COSTA RICA FOREST RESEARCH PROGRAMME CBP · COSTA RICA FOREST RESEARCH PROGRAMME CBP Carate, Osa...
33
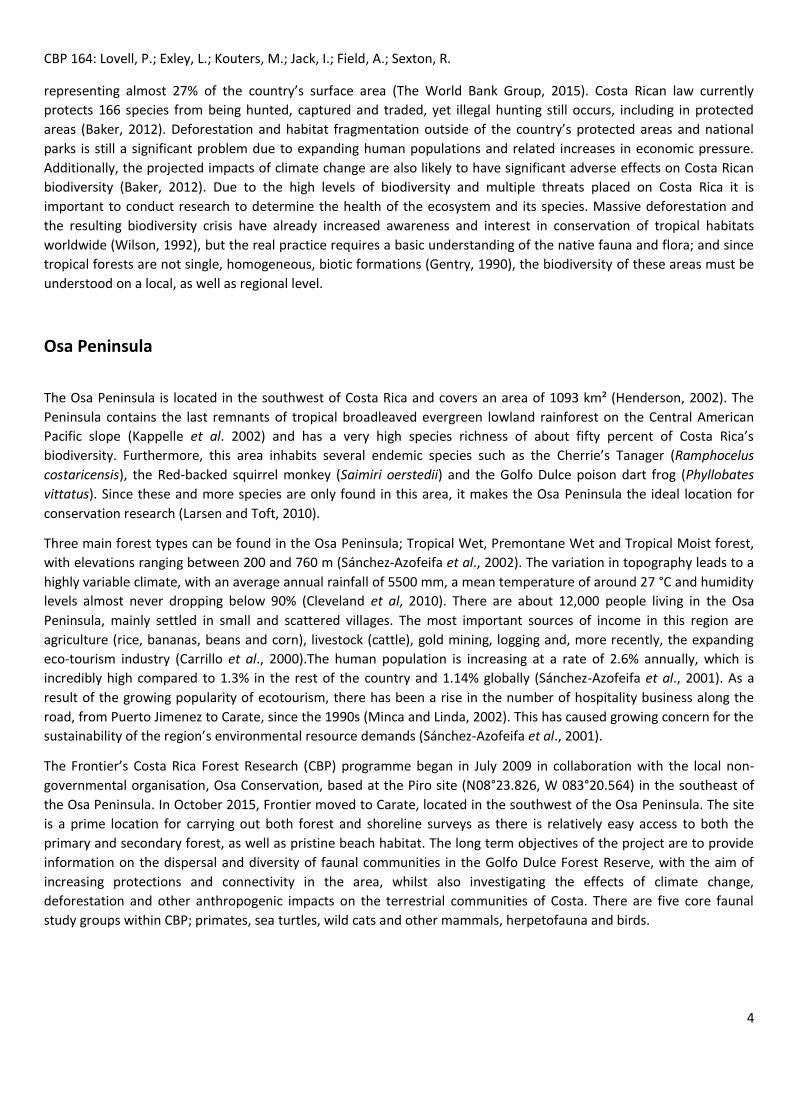
CBP 164: Lovell, P.; Exley, L.; Kouters, M.; Jack, I.; Field, A.; Sexton, R. 1 COSTA RICA FOREST RESEARCH PROGRAMME CBP Carate, Osa Peninsula, Costa Rica CRF Phase 164 Science Report 1 October 2016 – 31 December 2016 Pascal Lovell, Laura Exley, Melanie Kouters, Isabella Jack, Annabel Field, Rebecca Sexton.
Transcript of COSTA RICA FOREST RESEARCH PROGRAMME CBP · COSTA RICA FOREST RESEARCH PROGRAMME CBP Carate, Osa...

CBP 164: Lovell, P.; Exley, L.; Kouters, M.; Jack, I.; Field, A.; Sexton, R.
1
COSTA RICA FOREST RESEARCH PROGRAMME
CBP
Carate, Osa Peninsula, Costa Rica
CRF Phase 164 Science Report
1 October 2016 – 31 December 2016
Pascal Lovell, Laura Exley, Melanie Kouters, Isabella Jack, Annabel Field, Rebecca Sexton.

CBP 164: Lovell, P.; Exley, L.; Kouters, M.; Jack, I.; Field, A.; Sexton, R.
2
Contents Introduction .......................................................................................................................................................................... 3
Staff ................................................................................................................................................................................... 3
Natural History of Costa Rica and its Wildlife Conservation ............................................................................................. 3
Osa Peninsula .................................................................................................................................................................... 4
Aims and Objectives of Frontier CBP ................................................................................................................................ 5
Training ................................................................................................................................................................................. 5
Briefing Sessions................................................................................................................................................................ 6
Science Lectures ................................................................................................................................................................ 6
Field Training ..................................................................................................................................................................... 7
BTECs, CoPEs and TEFLs .................................................................................................................................................... 7
Research Work Programme .................................................................................................................................................. 7
Survey Area ....................................................................................................................................................................... 7
Projects ............................................................................................................................................................................. 9
Estimating the Population Density of the Four Primates Coexisting ............................................................................ 9
Mammal Track Study along Rio Carate, Osa Peninsula .............................................................................................. 12
Bird Species Richness and Abundance in Primary, Secondary and Degraded Forest ................................................. 19
Turtle Predation Study along Carate Beach, Osa Peninsula ....................................................................................... 26
Amphibian & Reptile Abundance in Primary, Secondary and Degraded Forest ......................................................... 29
References........................................................................................................................................................................... 32
CBP 164: Lovell, P.; Exley, L.; Kouters, M.; Jack, I.; Field, A.; Sexton, R.
3
Introduction
Staff
Pascal Lovell (PL) Principal Investigator (PI)
Laura Exley (LE) Project Coordinator (PC)
Melanie Kouters (MK) Field Communications Officer (FCO)
Isabella Jack (IJ) Assistant Research Officer (ARO)
Annabel Field (AF) Assistant Research Officer (ARO)
Rebecca Sexton (RS) Assistant Research Officer (ARO)
Natural History of Costa Rica and its Wildlife Conservation
Costa Rica, located between Nicaragua and Panama, is one of the seven Central American countries and covers an area
of 51.100 km2. It is surrounded by the Pacific on the west and the Caribbean on the east, creating a coast line of 1103
km and 255 km respectively. Even though this small country covers only 0.01 percent of the earth’s surface, it contains
>4% of the world’s biodiversity, including around 12,000 plant species, 1,239 butterfly species, 838 bird species, 440
reptile and amphibian species, and 232 mammal species (Sánchez-Azofeifa et al., 2002; IUCN, 2006; World Resources
Institute, 2006; National Biodiversity Institute, 2007). The high species richness has been attributed to two main
factors; its geographical location and climatic conditions. The fact that Costa Rica is situated between North and South
America means it can serve as a species corridor between these two continents. Furthermore, it lies halfway between
the Tropic of Cancer and the equator, leading to an annual average temperature of 27 °C, with very little fluctuations
throughout the year. Therefore, the seasons in this area are defined by precipitation, not temperature, resulting in a
distinct dry and wet season. The dry season starts around November/December and continues through April/May,
after which the rainy season begins. This year saw an abnormally late wet season that lasted well into December, and
with the presence of severe weather as well as Hurricane Otto, much of the work during this phase was disrupted. Only
a couple of weeks’ worth of surveying was carried out, and spread out around all the different projects this meant
there was no repeated observations and therefore very little comparable data to use. The southern Pacific lowlands
receive a particularly high degree of average annual rainfall (about 7,300 mm) (Baker, 2012). Although more than one-
fifth of Costa Rica is protected, further action must be taken in order to raise, or at least sustain the current level of
biodiversity (World Resources Institute, 2006).
Costa Rica is one of the world’s leading countries in environmental sustainability and conservation (Fagan et al., 2013),
however, this has not always been the case. Like many other countries throughout the world, Costa Rica has been the
site of extensive deforestation over the past few centuries. Up until the 1960s, activities such as logging and hunting
seriously threatened the biodiversity in this region, resulting in over half of the country’s forests being cut down and
many species being driven to the verge of extinction (Henderson, 2002). The poaching of turtles for the fatty calipee
and collection of turtle eggs for example, has severely depleted populations of endangered black turtles (Chelonia
mydas) and vulnerable olive ridley turtles (Lepidochelys olivacea) that use Costa Rica’s coastlines as nesting sites.
Similarly, the hunting of Costa Rica’s wild cat species, peccaries and tapirs for their meat, skins and other body parts,
has significantly reduced wild populations. Since the 1960s, some of these issues have been controlled through the
implementation of several reforestation programs, legislation, education and the creation of protected areas, now
CBP 164: Lovell, P.; Exley, L.; Kouters, M.; Jack, I.; Field, A.; Sexton, R.
4
representing almost 27% of the country’s surface area (The World Bank Group, 2015). Costa Rican law currently
protects 166 species from being hunted, captured and traded, yet illegal hunting still occurs, including in protected
areas (Baker, 2012). Deforestation and habitat fragmentation outside of the country’s protected areas and national
parks is still a significant problem due to expanding human populations and related increases in economic pressure.
Additionally, the projected impacts of climate change are also likely to have significant adverse effects on Costa Rican
biodiversity (Baker, 2012). Due to the high levels of biodiversity and multiple threats placed on Costa Rica it is
important to conduct research to determine the health of the ecosystem and its species. Massive deforestation and
the resulting biodiversity crisis have already increased awareness and interest in conservation of tropical habitats
worldwide (Wilson, 1992), but the real practice requires a basic understanding of the native fauna and flora; and since
tropical forests are not single, homogeneous, biotic formations (Gentry, 1990), the biodiversity of these areas must be
understood on a local, as well as regional level.
Osa Peninsula
The Osa Peninsula is located in the southwest of Costa Rica and covers an area of 1093 km² (Henderson, 2002). The
Peninsula contains the last remnants of tropical broadleaved evergreen lowland rainforest on the Central American
Pacific slope (Kappelle et al. 2002) and has a very high species richness of about fifty percent of Costa Rica’s
biodiversity. Furthermore, this area inhabits several endemic species such as the Cherrie’s Tanager (Ramphocelus
costaricensis), the Red-backed squirrel monkey (Saimiri oerstedii) and the Golfo Dulce poison dart frog (Phyllobates
vittatus). Since these and more species are only found in this area, it makes the Osa Peninsula the ideal location for
conservation research (Larsen and Toft, 2010).
Three main forest types can be found in the Osa Peninsula; Tropical Wet, Premontane Wet and Tropical Moist forest,
with elevations ranging between 200 and 760 m (Sánchez-Azofeifa et al., 2002). The variation in topography leads to a
highly variable climate, with an average annual rainfall of 5500 mm, a mean temperature of around 27 °C and humidity
levels almost never dropping below 90% (Cleveland et al, 2010). There are about 12,000 people living in the Osa
Peninsula, mainly settled in small and scattered villages. The most important sources of income in this region are
agriculture (rice, bananas, beans and corn), livestock (cattle), gold mining, logging and, more recently, the expanding
eco-tourism industry (Carrillo et al., 2000).The human population is increasing at a rate of 2.6% annually, which is
incredibly high compared to 1.3% in the rest of the country and 1.14% globally (Sánchez-Azofeifa et al., 2001). As a
result of the growing popularity of ecotourism, there has been a rise in the number of hospitality business along the
road, from Puerto Jimenez to Carate, since the 1990s (Minca and Linda, 2002). This has caused growing concern for the
sustainability of the region’s environmental resource demands (Sánchez-Azofeifa et al., 2001).
The Frontier’s Costa Rica Forest Research (CBP) programme began in July 2009 in collaboration with the local non-
governmental organisation, Osa Conservation, based at the Piro site (N08°23.826, W 083°20.564) in the southeast of
the Osa Peninsula. In October 2015, Frontier moved to Carate, located in the southwest of the Osa Peninsula. The site
is a prime location for carrying out both forest and shoreline surveys as there is relatively easy access to both the
primary and secondary forest, as well as pristine beach habitat. The long term objectives of the project are to provide
information on the dispersal and diversity of faunal communities in the Golfo Dulce Forest Reserve, with the aim of
increasing protections and connectivity in the area, whilst also investigating the effects of climate change,
deforestation and other anthropogenic impacts on the terrestrial communities of Costa. There are five core faunal
study groups within CBP; primates, sea turtles, wild cats and other mammals, herpetofauna and birds.

CBP 164: Lovell, P.; Exley, L.; Kouters, M.; Jack, I.; Field, A.; Sexton, R.
5
Figure 1: Map of the Osa Peninsula, showing Carate, our area of study
(http://www.vivacostarica.com/costa-rica-maps/costa-rica-maps-southern-pacific.html.)
Aims and Objectives of Frontier CBP
Under the umbrella of the research program, the specific aims and objectives of Frontier CBP are:
1. To estimate the population density, distribution and feeding preferences of the four primate species present in
Carate, Osa Peninsula, Costa Rica; and compare these among the different habitat types present in this area.
2. To assess mammal species richness and abundance along Rio Carate and the Beach Trail by searching for
natural tracks in and near the riverbed.
3. To compare the bird species richness and abundance between primary, secondary and degraded forests, by
performing point counts along the different trails, focusing on 44 forest bird species selected on several criteria, such
as endemism, IUCN status, ecological function and migratory features.
4. To assess nest success and turtle nest predation by conducting morning and night turtle patrols along Playa
Carate.
5. To gather information about the amphibian and reptile species richness in the primary, secondary and
degraded forests of Carate, Osa Peninsula, Costa Rica.
Training
The volunteer Research Assistants (RAs) and newly appointed staff members receive a number of briefing sessions on
arrival (Table 1), followed by regular science lectures and field training (Table 2) throughout their deployments. The
CBP research program also supports candidates completing the BTEC Advanced Certificate, Advanced Diploma in

CBP 164: Lovell, P.; Exley, L.; Kouters, M.; Jack, I.; Field, A.; Sexton, R.
6
Tropical Habitat Conservation, the Certificate of Personal Effectiveness (CoPE) and the Teach English as a Foreign or
second Language (TEFL) (Table 3).
Briefing Sessions
All the people newly arriving to CBP get an introduction towards the aims of the research program, the methodologies
used and the research output of the individual projects. Furthermore, they get an update on the achievements of CBP
through a general Science presentation; this is an introduction to the Frontier Costa Rica Forest Research Program in
Carate. Additionally, all volunteers and staff are given a health, safety and medical briefing, of which they are tested on
before participating in any field activity. Volunteers undertaking any kind of the previous mentioned qualification
courses are given an introductory briefing before they begin the assessments.
Table 1: Briefing sessions conducted during Phase CBP164
Briefing Session Presenter
Introduction to the Frontier Costa Rica Forest Research Programme PL
Health and Safety Briefing and Test PL LE
Introduction to the BTEC, CoPE & TEFL Qualifications PL
Introduction to Surveying and Monitoring PL IJ
Camp Life and Duties PL LE
Science Lectures
A broad program of science lectures is offered at CBP, providing information and training the different aspects of
research going on in our study area. Lectures are presented using PowerPoint and give a better understanding about
the biology and ecology of the studied species. Furthermore, they give an insight in the methods and data analysis used
by CBP and considerations made when planning research projects.
Lectures are scheduled with the following objectives:
To allow every volunteer and member of staff to attend each presentation at least once during deployment,
regardless of length of stay.
To meet the time requirements for BTEC assessments.
To avoid conflict with other activities, maximizing attendance
To provide detailed training on specific software and applications used in conservation, such as GPS.
Attendance of lectures is compulsory.
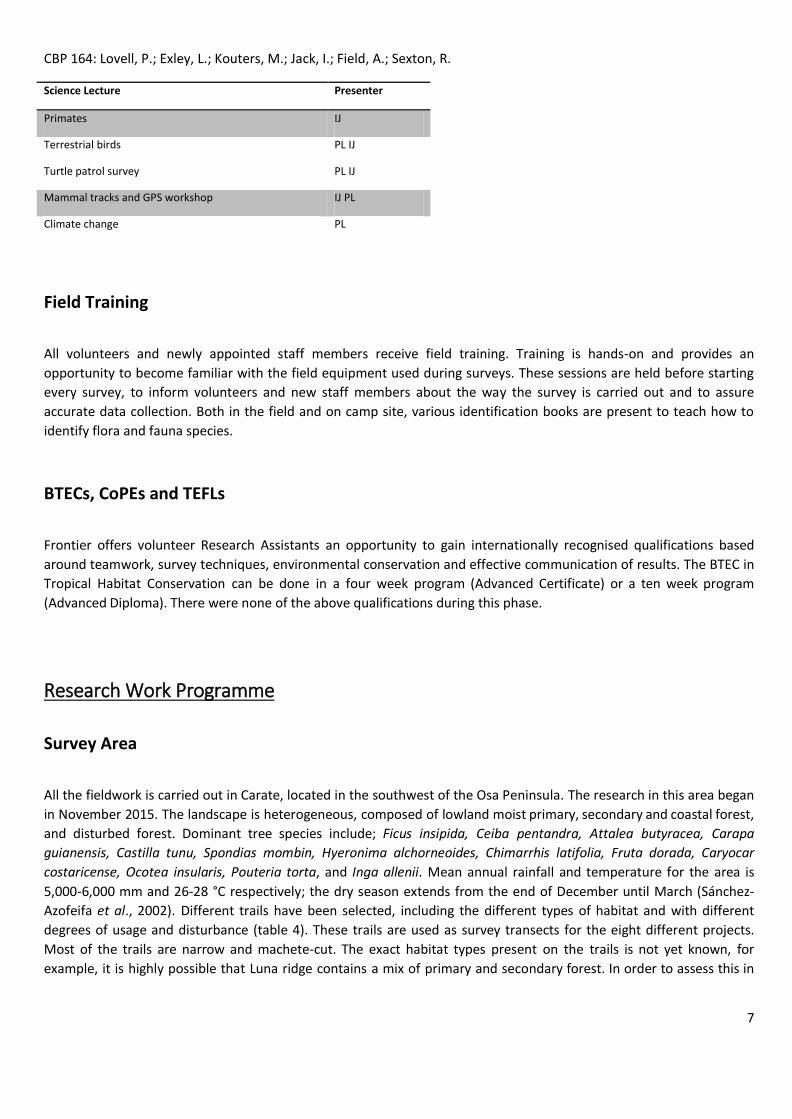
Table 2. Science lectures delivered during Phase CBP164.
CBP 164: Lovell, P.; Exley, L.; Kouters, M.; Jack, I.; Field, A.; Sexton, R.
7
Science Lecture Presenter
Primates IJ
Terrestrial birds PL IJ
Turtle patrol survey PL IJ
Mammal tracks and GPS workshop IJ PL
Climate change PL
Field Training
All volunteers and newly appointed staff members receive field training. Training is hands-on and provides an
opportunity to become familiar with the field equipment used during surveys. These sessions are held before starting
every survey, to inform volunteers and new staff members about the way the survey is carried out and to assure
accurate data collection. Both in the field and on camp site, various identification books are present to teach how to
identify flora and fauna species.
BTECs, CoPEs and TEFLs
Frontier offers volunteer Research Assistants an opportunity to gain internationally recognised qualifications based
around teamwork, survey techniques, environmental conservation and effective communication of results. The BTEC in
Tropical Habitat Conservation can be done in a four week program (Advanced Certificate) or a ten week program
(Advanced Diploma). There were none of the above qualifications during this phase.
Research Work Programme
Survey Area
All the fieldwork is carried out in Carate, located in the southwest of the Osa Peninsula. The research in this area began
in November 2015. The landscape is heterogeneous, composed of lowland moist primary, secondary and coastal forest,
and disturbed forest. Dominant tree species include; Ficus insipida, Ceiba pentandra, Attalea butyracea, Carapa
guianensis, Castilla tunu, Spondias mombin, Hyeronima alchorneoides, Chimarrhis latifolia, Fruta dorada, Caryocar
costaricense, Ocotea insularis, Pouteria torta, and Inga allenii. Mean annual rainfall and temperature for the area is
5,000-6,000 mm and 26-28 °C respectively; the dry season extends from the end of December until March (Sánchez-
Azofeifa et al., 2002). Different trails have been selected, including the different types of habitat and with different
degrees of usage and disturbance (table 4). These trails are used as survey transects for the eight different projects.
Most of the trails are narrow and machete-cut. The exact habitat types present on the trails is not yet known, for
example, it is highly possible that Luna ridge contains a mix of primary and secondary forest. In order to assess this in

CBP 164: Lovell, P.; Exley, L.; Kouters, M.; Jack, I.; Field, A.; Sexton, R.
8
more depth GIS work is being undertaken and in-depth habitat studies are required, perhaps with the help of drones to
get more knowledge about all the different habitat types present in Carate and surroundings.
Table 4. Current trails used for the research carried out in Carate S coordinates of the start and the end of the trail, as well as the length (km).
Trail Name (code) Transect
Length (km)
GPS Coordinates
START trail
GPS Coordinates
END trail
Disturbed forest Attalea Loop (with some secondary forest
patches) 1 km 08º26'11.14 N
83º26'16.99 W
08º26'29.60 N
83º29'02.37 W
Road 1.8 km 08º26'28.37 N
83º26'25.73 W
08º26'28.11 N
83º27'16.33 W
Secondary forest Shady Lane 2.5km 08º44'44.59 N
83º27'49.54 W
08º26'48.19 N
83º28'52.97 W
Beach Trail (mix of coastal and secondary forest) 2 km 08º26'36.69 N
83º44'63.16 W
08º26'50.30 N
83º29'02.37 W
Leona Loop 2km 08º26'56.09 N
83º29'04.37 W
08º26'56.39 N
83º29'05.16 W
Gallery forest Rio Carate 2.5 km 08º44'22.75 N
83º46'31.56 W
08º27'37.30 N
83º27'48.69 W
Primary forest Leona Ridge 4 km 08º26'48.19 N
83º28'52.97 W
08º26'54.51 N
83º29'05.16 W
Luna Ridge 9 km 08º26'29.63 N
83º27'16.62 W
08º26'28.54 N
83º26'56.86 W
Turtle patrols take place on one beach; Playa Carate. River Rio Carate passes through the survey areas, bordering the
National park of Corcovado, and has an important function in providing water and food for animals when they move
out of the park.

CBP 164: Lovell, P.; Exley, L.; Kouters, M.; Jack, I.; Field, A.; Sexton, R.
9
Projects
Estimating the Population Density of the Four Primates Coexisting
Introduction
Throughout Costa Rica, four different primate species can be found; the Central American squirrel monkey (Saimiri
oerstedii), the mantled howler monkey (Alouatta palliata), the geoffroy’s spider monkey (Ateles geoffroyi) and the
white-faced capuchin (Cebus capucinus). The Osa Peninsula is the only part of Costa Rica where these four new world
primate species occur together, making this place a very interesting area for study (Carrillo et al., 2000). Primates are
predominantly frugivorous, therefore, they have an important ecosystem function as seed dispersers, making them
vital for maintaining the plant diversity within the forest (Julliot, 1997; Garber et al., 2006). Generally, primate species
are highly sensitive to land conversion for agricultural purposes and development, clear cutting, selective logging,
hunting and the pet trade (Cropp and Boinski, 2000). In Costa Rica, primates are mainly threatened by increased rates
and amounts of forest loss and fragmentation, and infrastructural changes for the country's booming tourism industry.
In Panama, they have fared even worse since deforestation has been extensive and unregulated (Boinski and Sirot
1997; Boinski et al., 1998). The development of agribusinesses for oil palm and banana plantations is a serious
component of habitat destruction and fragmentation. Logging roads, clearings for telephone and electric power lines,
or other practices leading to forest fragmentation restrict populations to smaller forest areas, decreasing their ability to
find food during times of the year when food abundance is lowest (e.g. dry season) and leading to a decline in genetic
diversity, which in turn affects the population health and stability (Boinski et al., 1998).
Since October 2015 Frontier CBP has been surveying the presence of the four primate species in Carate. The overall
research aim is to gain more knowledge about the distribution of the four primate species in this area of the Golfo
Dulce Reserve. By comparing the richness and abundance of primate species between the different habitat types, we
can gain more information regarding management and policy decisions on a local level. Until now, density estimates
are lacking for the Central American squirrel monkey and the white-faced capuchin, which makes them key to survey,
however, focus is also placed on the red listed spider and howler monkeys.
The Central American squirrel monkey (Saimiri oerstedii) is one of the five species of squirrel monkeys. Their status on
the IUCN list is Vulnerable, with decreasing populations (IUCN, 2008). The main threats are habitat loss due to logging
and agriculture. They inhabit the lowland rainforests of Pacific Costa Rica towards Western Panama. They are an
arboreal and diurnal species, depending on a diet of insects, leaves, fruits, barks, flowers and nectar, and foraging in
the low and middle levels of primary and secondary forests. Group sizes range from 20 to 75 individuals that are
travelling between 2.5 and 4.2 km per day (IUCN, 2008). The white-headed capuchin (Cebus capucinus), also known as
the white-faced or white-throated capuchin, has a very important ecological function within the forest ecosystem by
dispersing pollen. They are Least Concern on the IUCN list but their main threats include tree logging and clear-cutting
because these activities drastically reduce suitable habitats. Other threats include the capturing for the pet trade and
hunting for their meat. Like the squirrel monkeys, the capuchins are diurnal and arboreal species with a diet of mainly
fruits and insects. They range from Honduras all the way down to Ecuador and are highly adaptive species, meaning
they can occupy various habitats, but usually occur in tropical evergreen and dry deciduous forests. Their group size
ranges from 4-40 individuals, with a mean average of 16 and they travel on average 2 km a day (IUCN, 2008). The Golden
mantled howler monkey (Alouatta palliata) is found in Costa Rica, Nicaragua, Panama and Guatemala, mostly in the
older areas of evergreen primary forest as well as secondary and semi- deciduous forest. They have an important
function as seed dispersers and germinators and their dung is an important food source for several dung beetle species.
Their status on the IUCN list is Least Concern (IUCN, 2008). They are diurnal, arboreal species with a diet that mainly
consists of leaves, giving them low amounts of energy which makes them rest for most of the day. Their main threats

CBP 164: Lovell, P.; Exley, L.; Kouters, M.; Jack, I.; Field, A.; Sexton, R.
10
are forest destruction and fragmentation. The group size ranges from 10-20 individuals, but can reach up to 40
individuals. The males are characterized by a very obvious white scrotum when they reach sexual maturity and have an
enlarge hyoid bone which allows them to create a loud howling noise, usually displayed at dawn and dusk (IUCN,
2008). The Geoffroy’s spider monkey (Ateles geoffroyi) is native to Costa Rica and Panama and is currently endangered
with a decreasing population (IUCN, 2008). They are diurnal and arboreal species, mainly inhabiting the upper layers of
the forest, and have a diet of fruits, leaves and sometimes insects, seeds, barks and flowers. Their threats are habitat
loss and hunting for their meat and the pet trade. The group size ranges from 20-40 individuals that are living in a
fission-fusion society, meaning that they split into subgroups during the day and congregate again during the night
(IUCN, 2008).
Materials and Methods
Data was collected by walking six different trails (Beach trail, Road, Attalea Loop, Luna Ridge, Leona Loop, Shady Lane)
and conducting total counts of all the primates encountered. The surveys started between 05.30 and 06.00 am, to
cover peak primate activity and thus increasing detection probability. A minimum of three observers walked at a
constant speed of 2 km/h, including regular stops every 100m as recommended by Peres (1999). The six trails were
divided into three main habitat types; primary (Luna Ridge, Leona Loop), secondary (Beach trail, Shady Lane) and
degraded (Road, Attalea Loop) forests. Each trail was walked in one way, and not more than once a week. The surveys
were done in fair weather because of reduced detection probability in adverse weather conditions. During phase four
the region experienced some of the most severe weather in around 30 years, and only a couple of weeks’ worth of
surveying was carried out, and spread out around all the different projects this meant there was no repeated
observations and therefore very little comparable data to use. When encountering a monkey troop, an observation
time of maximum 30 minutes was set. This provided enough time to assure a reliable count of all the individuals
without disturbing them for too much time (Pruetz and Leasor 2003). All individuals seen at the same time and
exhibiting the same general behaviour (i.e., resting, moving or foraging) were considered to be part of the same group
(Chapman et al., 1995). Where possible, secondary data on group composition (i.e. gender and age; adult, juvenile,
infant) was also recorded. Furthermore, the behaviour (i.e. resting, moving or foraging) upon encounter, the duration
of observation, and the perpendicular distance from the trail to the geometric centre of the group at first sighting,
height of the group in the tree and direction of travelling was noted. This study was non-invasive and according to the
legal requirements of Costa Rica (Costa Rican Government Decree 31514-MINAE). Any kind of abnormal or aggressive
behaviour towards the observers by individual primates was responded to by moving on as quickly as possible.
The mean detection rate was calculated for each species in each of the different forest types, and the Simpson’s
Diversity index was also calculated.
Results
The data used in this section was taken from November 2015 to December 2016.
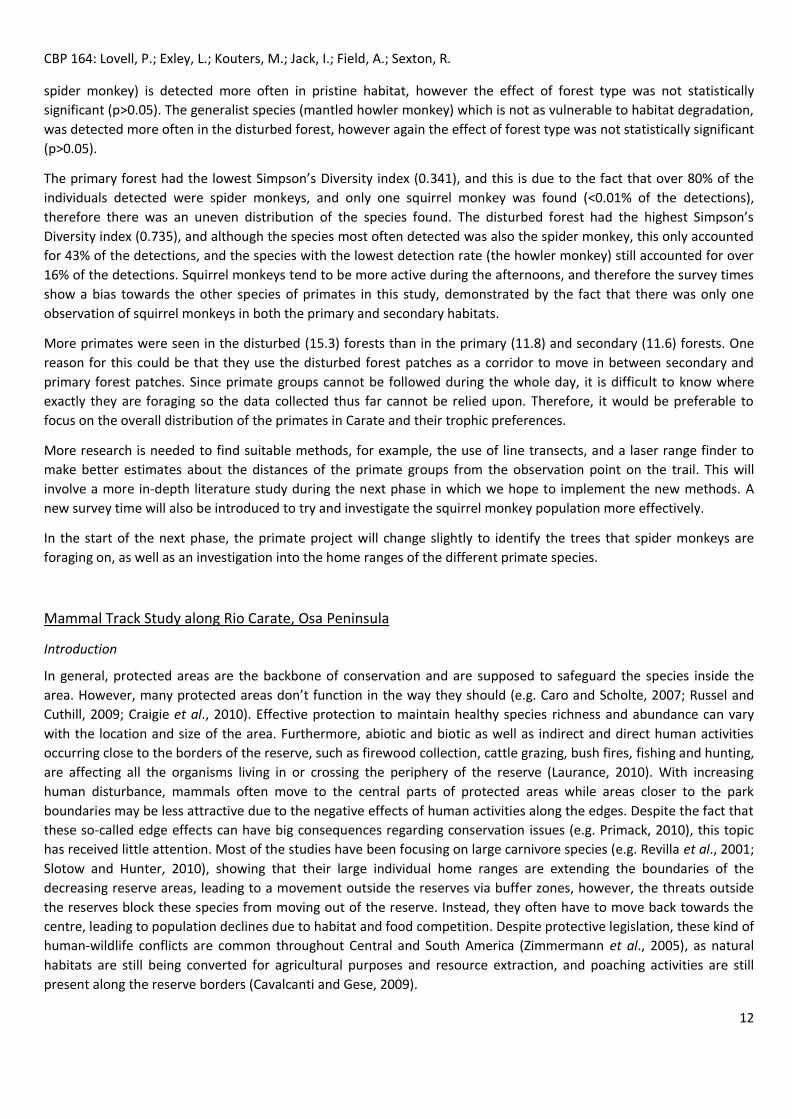
The overall detection rates per survey, and the Simpson’s Diversity index was also calculated for each of the three
forest types are shown in the table below.
CBP 164: Lovell, P.; Exley, L.; Kouters, M.; Jack, I.; Field, A.; Sexton, R.
11
Table 5: The mean detection rate per survey and the Simpson’s Diversity index for all four primate species
Mean
Detection
Rate
Simpson's
Diversity
Index
Primary 11.8 0.341
Secondary 11.6 0.694
Disturbed 15.3 0.735
The highest detection rate was found in the disturbed forest (15.3), then the primary forest (11.8), followed by the
secondary forest (11.6), and the lowest evenness was found in the primary forest (0.341), followed by the secondary
forest (0.694), and then the disturbed forest (0.735).
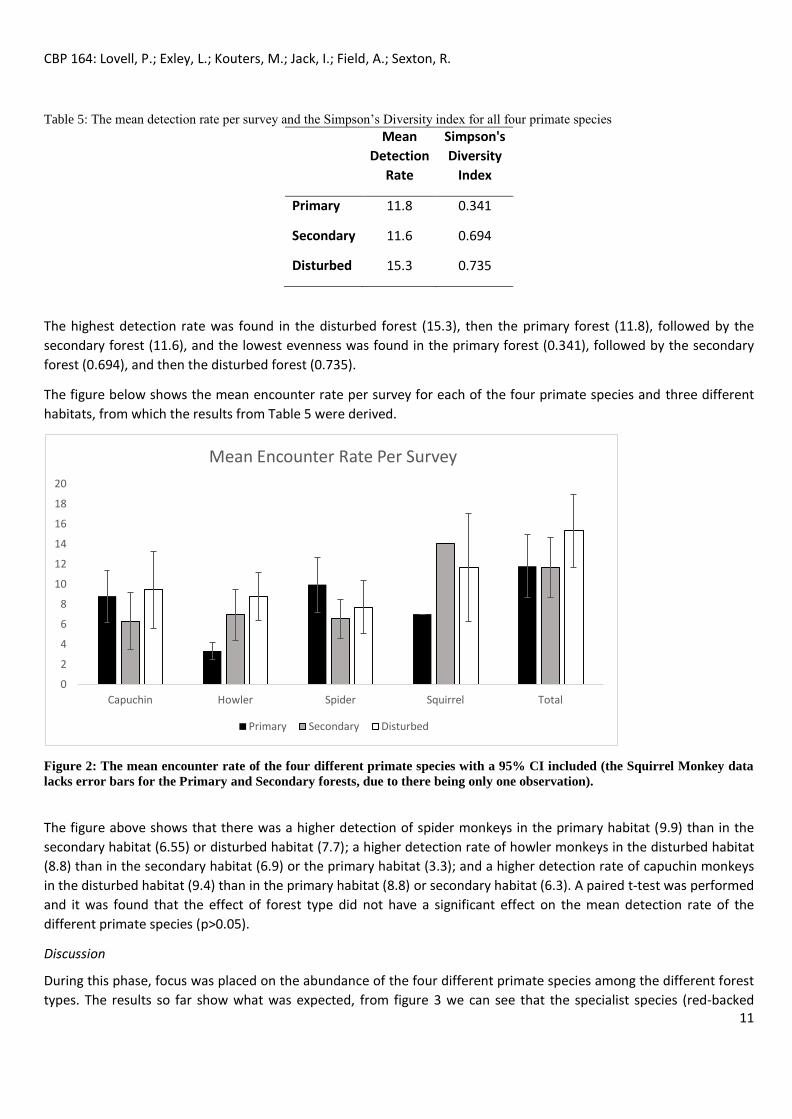
The figure below shows the mean encounter rate per survey for each of the four primate species and three different
habitats, from which the results from Table 5 were derived.
Figure 2: The mean encounter rate of the four different primate species with a 95% CI included (the Squirrel Monkey data
lacks error bars for the Primary and Secondary forests, due to there being only one observation).
The figure above shows that there was a higher detection of spider monkeys in the primary habitat (9.9) than in the
secondary habitat (6.55) or disturbed habitat (7.7); a higher detection rate of howler monkeys in the disturbed habitat
(8.8) than in the secondary habitat (6.9) or the primary habitat (3.3); and a higher detection rate of capuchin monkeys
in the disturbed habitat (9.4) than in the primary habitat (8.8) or secondary habitat (6.3). A paired t-test was performed
and it was found that the effect of forest type did not have a significant effect on the mean detection rate of the
different primate species (p>0.05).
Discussion
During this phase, focus was placed on the abundance of the four different primate species among the different forest
types. The results so far show what was expected, from figure 3 we can see that the specialist species (red-backed
0
2
4
6
8
10
12
14
16
18
20
Capuchin Howler Spider Squirrel Total
Mean Encounter Rate Per Survey
Primary Secondary Disturbed
CBP 164: Lovell, P.; Exley, L.; Kouters, M.; Jack, I.; Field, A.; Sexton, R.
12
spider monkey) is detected more often in pristine habitat, however the effect of forest type was not statistically
significant (p>0.05). The generalist species (mantled howler monkey) which is not as vulnerable to habitat degradation,
was detected more often in the disturbed forest, however again the effect of forest type was not statistically significant
(p>0.05).
The primary forest had the lowest Simpson’s Diversity index (0.341), and this is due to the fact that over 80% of the
individuals detected were spider monkeys, and only one squirrel monkey was found (<0.01% of the detections),
therefore there was an uneven distribution of the species found. The disturbed forest had the highest Simpson’s
Diversity index (0.735), and although the species most often detected was also the spider monkey, this only accounted
for 43% of the detections, and the species with the lowest detection rate (the howler monkey) still accounted for over
16% of the detections. Squirrel monkeys tend to be more active during the afternoons, and therefore the survey times
show a bias towards the other species of primates in this study, demonstrated by the fact that there was only one
observation of squirrel monkeys in both the primary and secondary habitats.
More primates were seen in the disturbed (15.3) forests than in the primary (11.8) and secondary (11.6) forests. One
reason for this could be that they use the disturbed forest patches as a corridor to move in between secondary and
primary forest patches. Since primate groups cannot be followed during the whole day, it is difficult to know where
exactly they are foraging so the data collected thus far cannot be relied upon. Therefore, it would be preferable to
focus on the overall distribution of the primates in Carate and their trophic preferences.
More research is needed to find suitable methods, for example, the use of line transects, and a laser range finder to
make better estimates about the distances of the primate groups from the observation point on the trail. This will
involve a more in-depth literature study during the next phase in which we hope to implement the new methods. A
new survey time will also be introduced to try and investigate the squirrel monkey population more effectively.
In the start of the next phase, the primate project will change slightly to identify the trees that spider monkeys are
foraging on, as well as an investigation into the home ranges of the different primate species.
Mammal Track Study along Rio Carate, Osa Peninsula
Introduction
In general, protected areas are the backbone of conservation and are supposed to safeguard the species inside the
area. However, many protected areas don’t function in the way they should (e.g. Caro and Scholte, 2007; Russel and
Cuthill, 2009; Craigie et al., 2010). Effective protection to maintain healthy species richness and abundance can vary
with the location and size of the area. Furthermore, abiotic and biotic as well as indirect and direct human activities
occurring close to the borders of the reserve, such as firewood collection, cattle grazing, bush fires, fishing and hunting,
are affecting all the organisms living in or crossing the periphery of the reserve (Laurance, 2010). With increasing
human disturbance, mammals often move to the central parts of protected areas while areas closer to the park
boundaries may be less attractive due to the negative effects of human activities along the edges. Despite the fact that
these so-called edge effects can have big consequences regarding conservation issues (e.g. Primack, 2010), this topic
has received little attention. Most of the studies have been focusing on large carnivore species (e.g. Revilla et al., 2001;
Slotow and Hunter, 2010), showing that their large individual home ranges are extending the boundaries of the
decreasing reserve areas, leading to a movement outside the reserves via buffer zones, however, the threats outside
the reserves block these species from moving out of the reserve. Instead, they often have to move back towards the
centre, leading to population declines due to habitat and food competition. Despite protective legislation, these kind of
human-wildlife conflicts are common throughout Central and South America (Zimmermann et al., 2005), as natural
habitats are still being converted for agricultural purposes and resource extraction, and poaching activities are still
present along the reserve borders (Cavalcanti and Gese, 2009).
CBP 164: Lovell, P.; Exley, L.; Kouters, M.; Jack, I.; Field, A.; Sexton, R.
13
Estimating the distribution and abundance of mammals is not that easy. Especially in the case of the Osa Peninsula,
where big mammals are extending their home ranges from Corcovado National Park towards other areas within the
Osa Peninsula. This makes it even more vital to conserve and manage these areas and the biological corridors that
connect them. Information on the distribution is also vital for the introduction of education and awareness initiatives,
with the aim of preventing human-wildlife conflict that threatens mammal populations and livelihoods across the
species range (Zimmermann et al., 2005). The aim of this study is to estimate the mammal species richness and
abundance along the river Rio Carate, which is located at the border of Corcovado National Park, the Osa Peninsula,
Costa Rica. Corcovado National Park compromises primary lowland rainforests, and serves as an important haven for
various animals and plant species. However, for many mammal species, the area of the park is not sufficient to
maintain healthy populations. By using tracking techniques, we can gain knowledge about the mammal species present
in and along the border of the park, and it will give us an idea of which mammals are moving in and out of the park.
This is especially important for feline species, since their broad distribution ranges obligate them to move in between
different protected areas in order to not override their maximum carrying capacities.
Materials and Methods
Tracking mammals by following footprints is probably the oldest known method of identifying mammal’s presence in
an area (Bider, 1968). Track surveys are efficient and usually low in cost, but are dependent on suitable field conditions
and trained observers (Burnham et al, 1980; Smallwood and Fitzhugh, 1995). Track searches were performed along the
river Rio Carate, Carate, Osa Peninsula, Costa Rica; starting at the river estuary, and going two kilometres upstream.
The surveys consisted of volunteers walking and looking for tracks in and around the riverbed. Surveys started at 7:00
am to prevent tracks from being washed away. More than 200 mammal species are currently present in the different
forest types of Costa Rica, with this study focusing on 20 mammal species. Table 6 gives an overview of the 19 selected
mammal species. All species are found in the lowland rainforests of the Osa Peninsula (Cavalcanti and Gese, 2009).
Among the focal species’ distribution range, only the Baird’s tapir is listed as Endangered. Many other mammal species
are listed as globally Vulnerable or Near Threatened (IUCN, 2014). However, in Costa Rica, the six feline species,
Neotropical river otter and Paca are considered to be Endangered (Cavalcanti and Gese, 2009).
All mammal tracks were recorded and identified by measuring its widest point and the vertical distance from the toes
to the palm pad and by using mammal track sheets (Adapted and modified of Sanchez, 1981). The GPS position of the
track was noted down as well as the direction of movement. This gave information on the movement of individuals
within a certain area. If a track of the same species was found within 100 m from the previous track, it was not
recorded and was assumed to be the same individual. Due to the very dry substrate, which is a mix of sand and rubble,
a considerable level of skill was necessary to accurately detect and identify the tracks.
Finally, the program Estimate S was used to estimate the mammal species diversity. With this program, we are able to
estimate the Simpson’s diversity Index, which is essentially the probability of two randomly chosen individuals (tracks)
being from different species. Furthermore, an estimate of the evenness was made, which showed how evenly
distributed the species were.
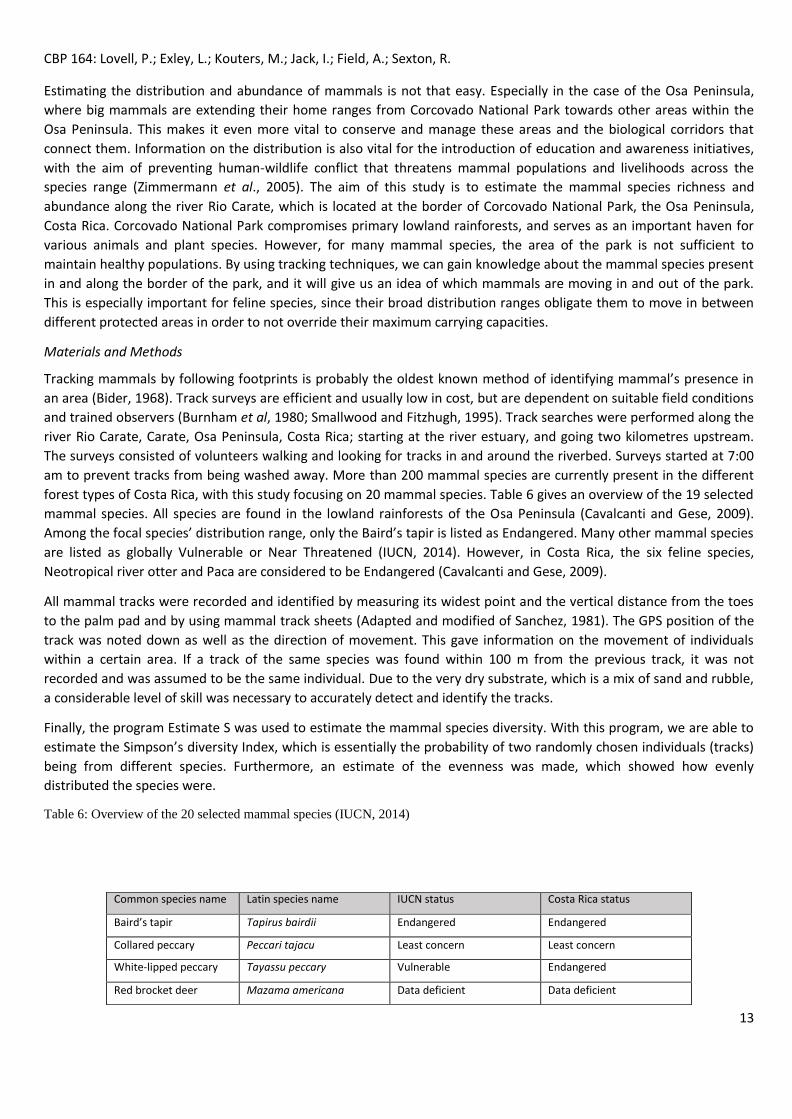
Table 6: Overview of the 20 selected mammal species (IUCN, 2014)
Common species name Latin species name IUCN status Costa Rica status
Baird’s tapir Tapirus bairdii Endangered Endangered
Collared peccary Peccari tajacu Least concern Least concern
White-lipped peccary Tayassu peccary Vulnerable Endangered
Red brocket deer Mazama americana Data deficient Data deficient

CBP 164: Lovell, P.; Exley, L.; Kouters, M.; Jack, I.; Field, A.; Sexton, R.
14
Figure 3:
Standard measurements taken; A- Track widest point and B- vertical distance from the toes to the palm pad.
Results
The data used in this section was taken from November 2015 to December 2016, with 24 positive surveys analysed.
In this report, the cumulative data is used to give a better idea of the abundance of mammal species in the area. Since
mid-November 2015, 17 different species were seen over 24 surveys. The 17 species identified were: agouti, armadillo,
Baird’s tapir, red brocket deer, collared peccary, common opossum, crab-eating racoon, margay, Neotropical river
otter, ocelot, paca, puma, tamandua, tayra, water opossum, white-lipped peccary, and white- nosed coati. 137
different individuals were seen over the 24 surveys. The mean species count per sample (or in our case survey) was
5.71; meaning that on average, five different species were seen each survey. The amount of tracks for each mammal
species is given in figure 4.
0
0.2
0.4
0.6
0.8
1
1.2
Ave
rage
Det
ecti
on
Rat
e
Species
Tayra Eira barbara Least concern Least concern
Neotropical river otter Lontra longicaudis Data deficient Endangered
Striped hog-nosed skunk Conepatus semistriatus Least concern Least concern
Common opossum Dedelphis marsupialis Least concern Least concern
Water opossum Chironectes minimus Least concern Least concern
Northern tamandua Tamandua mexicana Least concern Least concern
White-nosed coati Nasua narica Least concern Least concern
Crab-eating raccoon Procyon cancrivorus Least concern Least concern
Central American agouti Dasyprocta punctate Least concern Least concern
Paca Agouti paca Least concern Least concern
Nine-banded armadillo Dasypus novemcinctus Least concern Least concern
Puma Puma concolor Least concern Endangered
Ocelot Leopardus pardalis Least concern Endangered
Jaguarondi Puma yagouaroundi Least concern Endangered
Margay Leopardus wiedii Near threatened Endangered
Jaguar Panther onca Near threatened Endangered

CBP 164: Lovell, P.; Exley, L.; Kouters, M.; Jack, I.; Field, A.; Sexton, R.
15
Figure 4. Graph representing the amount of tracks found per mammal species over the 24 surveys. The two unidentifiable species
have been omitted.
Most of the tracks are from the ocelot (23), followed by the White-nosed coati and Crab-eating raccoon (19), then the
Baird’s tapir and Neotropical river otter (18).
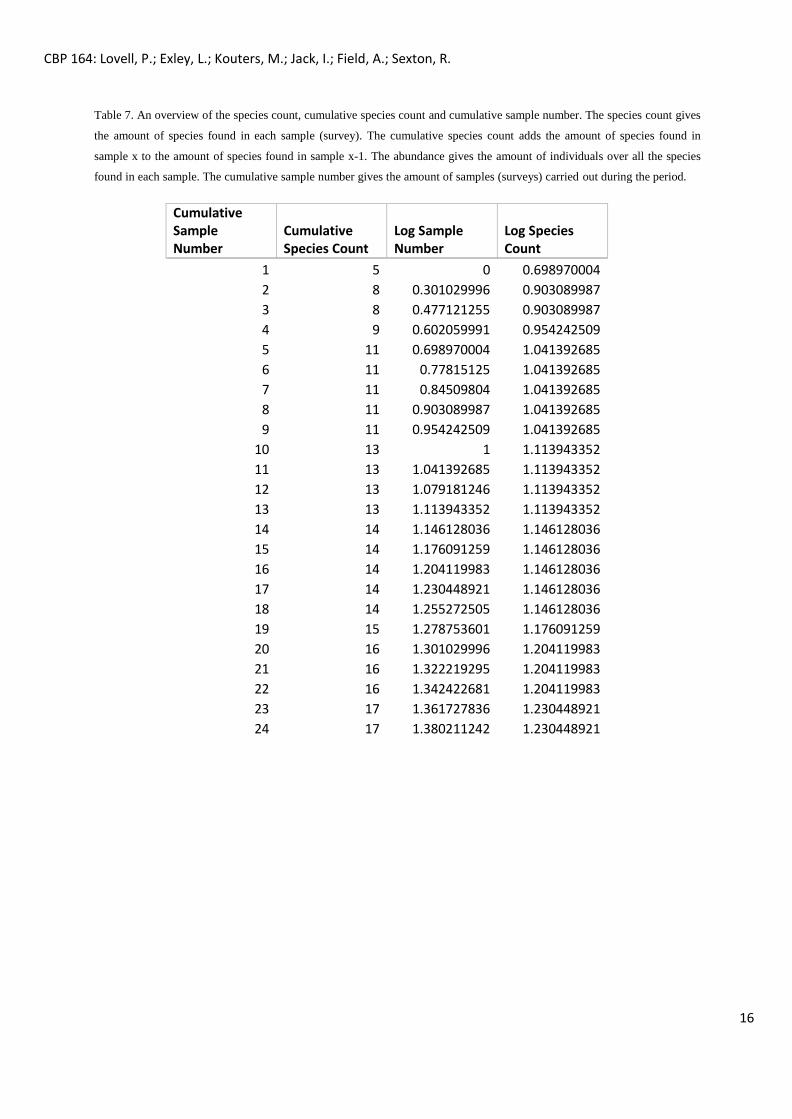
Table 7 and Figure 5 below show the data used for the extrapolated species curve, estimating the diversity of mammals
that should have been detected according to the survey effort.
CBP 164: Lovell, P.; Exley, L.; Kouters, M.; Jack, I.; Field, A.; Sexton, R.
16
Cumulative Sample Number
Cumulative Species Count
Log Sample Number
Log Species Count
1 5 0 0.698970004
2 8 0.301029996 0.903089987
3 8 0.477121255 0.903089987
4 9 0.602059991 0.954242509
5 11 0.698970004 1.041392685
6 11 0.77815125 1.041392685
7 11 0.84509804 1.041392685
8 11 0.903089987 1.041392685
9 11 0.954242509 1.041392685
10 13 1 1.113943352
11 13 1.041392685 1.113943352
12 13 1.079181246 1.113943352
13 13 1.113943352 1.113943352
14 14 1.146128036 1.146128036
15 14 1.176091259 1.146128036
16 14 1.204119983 1.146128036
17 14 1.230448921 1.146128036
18 14 1.255272505 1.146128036
19 15 1.278753601 1.176091259
20 16 1.301029996 1.204119983
21 16 1.322219295 1.204119983
22 16 1.342422681 1.204119983
23 17 1.361727836 1.230448921
24 17 1.380211242 1.230448921
Table 7. An overview of the species count, cumulative species count and cumulative sample number. The species count gives
the amount of species found in each sample (survey). The cumulative species count adds the amount of species found in
sample x to the amount of species found in sample x-1. The abundance gives the amount of individuals over all the species
found in each sample. The cumulative sample number gives the amount of samples (surveys) carried out during the period.

CBP 164: Lovell, P.; Exley, L.; Kouters, M.; Jack, I.; Field, A.; Sexton, R.
17
The extrapolated species accumulation curve (figure 5), gave the equation for an estimation of how
many surveys would be needed to observe the maximum amount of species present in the area.
Table 7 shows the amount of species we would have throughout the surveys. So far, 24 surveys have
been completed, revealing the tracks of 17 species. Based on the formula in Estimate S, around 18
different species’ tracks should be seen, so the survey effort gives an accurate representation of the
abundance of ground-dwelling mammal species.
Figure 5: The extrapolated species accumulation curve with an equation that gives the relationship between the species richness and the number of samples (surveys).
The cumulative number of species encountered (y) starts to level off with the cumulative number of
samples (surveys) carried out over time (x) (figure 5).
Furthermore, the output of Estimate S gave an estimate of the species diversity, similarly to the
Simpson’s diversity index. The Simpson’s Diversity index calculated was 0.856. Since this is close to 1,
it means that there was a high mammal species richness over all of the surveys, and the likelihood of
two tracks chosen at random being from the same species are quite low.
Discussion
From the results so far we can see that there are 17 mammal species present and active around Rio
Carate. 24 surveys have been carried out, and the extrapolation curve (Figure 5) is starting to level
off at the end, meaning that we have started to reach the maximum number of species that can be
detected with this methodology.
Most of the tracks were identified as ocelots, which is promising given just how susceptible they are
to the effects of deforestation. The ocelots represented over 16% of all the species detected. There
was also a high abundance of the Neotropical river otter, which can be mainly explained by the fact
that a lot of the surveys, particularly towards the start of the study, were carried out along the river
Rio Carate. It is still interesting to see that even though the majority of 2016 was quite dry, there
were still quite a few otters present in the area. During dry seasons, mammals tend to move to other
places to look for more favourable habitats. They have to look for water and food resources that
they are not finding in the areas they used to live during the wet season. Quite a lot of Baird’s tapir
0
0.2
0.4
0.6
0.8
1
1.2
1.4
1 2 3 4 5 6 7 8 9 10 11 12 13 14 15 16 17 18 19 20 21 22 23 24
Log. (Log Species Count)

CBP 164: Lovell, P.; Exley, L.; Kouters, M.; Jack, I.; Field, A.; Sexton, R.
18
tracks were observed, as well as crab-eating raccoon and white-nosed coati. The presence of feline
species tracks, such as the ocelot, shows that wild cats are moving in and out of Corcovado National
Park, however, more data and analysis is needed to figure out how abundant they are and to which
areas they are moving to and from. The first puma track was detected very late on in the study
(07/09/16), on the first survey carried out on the beach trail.
The bulk of the surveys were completed during phase two of the project (with observations 13-18
being taken in phase three, during the start of the rainy season), which was towards the start dry
season, affecting the encounter probability as it is thought that mammals move deeper into the
centre of a protected area (in this case Corcovado National Park), looking for food and water
resources. In general, the composition of mammal communities depends on the forest’s ability to
support the requirements of the mammals present in the area. Modification of habitats, such as
temporal or spatial changes, may generate boundaries for species due to the newly created
patchiness in the landscape, and this has effects on the structure and dynamics of all biological
communities (Cadenasso et al., 2003). The data during phase three was taken during the rainy
season, however a lack of available personnel restricted the effort to just five surveys. Also, the rainy
season had not quite started yet and the region was experiencing a drought. Surveys carried out
over the whole year will make it interesting to see if there is a difference in the amount of mammal
species and abundance we see during the wet and dry seasons, however the data taken thus far is
not enough to detect a significant difference.
During the following phase, some changes to the methodology should be made. Instead of only
using natural mammal tracks, track boxes of a previous BTEC student will be used and placed higher
up the river since observational walks have shown that there are more tracks present higher up.
Data will continue to be taken from natural tracks, but the trail will be extended higher up the river
as so far only a length of about 2 km is covered. Furthermore, many mammals are shy and elusive
creatures, and their adaptation to live in the undergrowth or canopy, or their nocturnal lifestyle
makes detection difficult. Over the years, wildlife biologists have used various tracking techniques to
assess mammal populations. The most common method is to detect the tracks left in fine soil or
sand (Olifiers et al, 2011), which is what we did during this phase, however, the addition of camera
traps will allow for much more efficient detection. This method is especially efficient for inventories
of cryptic animals as well as for population studies of species for which individuals can be
individually recognized by marks (Karanth, 1995; Carbone, 2001). Camera- trapping is an important
non-invasive tool for assessing patterns of mammal abundance and richness throughout space and
time, and their link with activity patterns, habitat use and reproductive information, which are key
elements for wildlife conservation research. Track surveys are efficient and usually involve low costs,
but depend on suitable field conditions and trained personnel (Burnham et al., 1980; Smallwood and
Fitzhugh, 1995). Camera-trapping on the other hand is more costly at the beginning, but is not so
dependent on the environment to be sampled, constant assistance or experienced field staff
(Rappole et al., 1985). Once camera trapping has been included in the methodology, the data from it
can be combined with the data from track surveys. Also, trails should be selected so that a
comparative study can be made, and compare the detection rates in different forest types, however
so far the amount of leaf litter as well as the dryness of the soil (during the dry season) has been a
factor in preventing detections of tracks on various trails.
CBP 164: Lovell, P.; Exley, L.; Kouters, M.; Jack, I.; Field, A.; Sexton, R.
19
Bird Species Richness and Abundance in Primary, Secondary and Degraded Forest
Introduction
The highly heterogeneous environments of Costa Rica give rise to many species-rich communities,
particularly those within the bird families (Herzog, Kessler and Cahill, 2002). Costa Rica hosts
approximately 850 bird species, of which 160 species are endemic (Henderson, 2010). This high bird
species richness means that Costa Rica has a relatively long history of studies focusing on bird
community structure (e.g., Young et al, 1998; Blake and Loiselle, 2001; Sigel et al, 2006) and
demography (e.g., Ruiz-Gutiérrez et al, 2008; Young et al, 2008; Woltmann and Sherry, 2011). Birds
provide various important ecological functions, such as seed dispersion and pollination, and can
therefore help in the maintenance of plant communities, and even contribute towards the
reforestation of fragmented habitats (Pejchar et al., 2008). However, the majority of bird studies
have been carried out in pristine habitats with very little attention given to degraded or fragmented
areas (Wilson, Collister and Wilson, 2011). Furthermore, partly due to its remoteness, little is known
about the bird communities of the Osa Peninsula despite its extraordinary species diversity and high
levels of endemism (Wilson, Collister and Wilson, 2011).
Home to approximately 375 species of birds (or 420 species according to Garrigues, 2007), including
many migratory birds and 18 endemic species (Sánchez-Azofeifa et al., 2002), the Osa Peninsula
comprises one of the largest remaining tracts of intact lowland rainforest in Mesoamerica (Barrantes
et al., 1999). This provides important habitat for a myriad of bird species. While 39% of the region is
under the protection of Corcovado National Park, and despite the recent decade’s significant
development, deforestation and forest fragmentation has occurred outside of the reserve (Sánchez-
Azofeifa et al., 2002).
Deforestation and fragmentation is considered the primary threat to birds in the Osa Peninsula (Osa
Conservation, 2016). Due to a human population growth rate of 2.6% (Sánchez-Azofeifa et al., 2001)
and increases in ecotourism, large areas of forest have been cleared to make space for agricultural
practices and the hospitality industry (Minca and Linda, 2002). Studies have found that in the period
between 1979 and 1997 the percentage of forested area in the Osa decreased from 97% to 89%
(Sánchez-Azofeifa et al., 2002). Furthermore, Sánchez-Azofeifa et al. (2002) found that as of 1997,
the majority of the remaining forest outside of Corcovado National Park has been altered, with only
44% of the region representing mature forest. Today, the tropical forest exists as a patchwork of
various size, age and connectivity within a human-dominated landscape (Wilson, Collister and
Wilson, 2002). Particular bird groups, such as understory insectivores (Canaday, 1996; Sekercioglu et
al., 2002; Sigel et al.., 2006), can be very sensitive to such changes, whilst others are able to utilise
degraded and fragmented habitats (Wilson, Collister and Wilson, 2002). Development is likely to
continue in the Osa Peninsula and thus it is of the upmost importance to understand how birds,
outside of Corcovado National Park, are being affected by these changes.
In addition to deforestation and fragmentation the birds of the Osa Peninsula are up against another
threat: climate change. This threat is not unique to the region, however, changes in temperature,
precipitation and greater climatic extremes are likely to have significant impacts on the avifauna.
Due to the fact that birds are endothermic, increased temperatures may cause greater energy use
for thermoregulation (Wormworth and Mallon, 2006). Additionally, temperature changes can
indirectly affect the birds reproduction, timing of breeding and migration (Wormworth and Mallon,
2006). For example, shifts in temperatures cause birds to shift the timing of seasonal events such as
egg laying or migration (Wormworth and Mallon, 2006). This causes birds to be out of synchrony
with other species, particularly plants and insects, which are necessary for their survival
CBP 164: Lovell, P.; Exley, L.; Kouters, M.; Jack, I.; Field, A.; Sexton, R.
20
(Wormworth and Mallon, 2006). Such changes may significantly impact species’ reproductive
success, which could ultimately result in the collapse of breeding populations in the long-run
(Wormworth and Mallon, 2006). Precipitation changes are also expected to negatively affect bird
populations. Studies have shown that periods of low or zero rainfall are correlated with lower bird
populations due to reduced food availability (Wormworth and Mallon, 2006). Furthermore, it is
believed that climate change is likely to increase extreme weather events such as drought or
flooding (Wormworth and Mallon, 2006). Extreme conditions can alter important habitats and
reduce the survival rates of both young and adult birds. Moreover, drought or floods in critical
stopover areas along bird migration routes can impair migratory birds’ ability to reach their final
destination (Wormworth and Mallon, 2006). Altogether, the effects of climate change and birds
responses to it will vary from species to species, thus it is critical that the different species of the Osa
Peninsula are monitored in order to determine how they are being affected.
Worldwide, the most important places for habitat-based conservation of birds are the Endemic Bird
Areas (EBAs). Most of the bird species are widespread and can inhabit large ranges of habitats. Some
however are said to be endemic since they are restricted to specific areas due to food and habitat
requirements. The landscapes where these species occur are high priority for broad-scale ecosystem
conservation. EBA’s are found around the world, but most of them are located in the tropics and
subtropics, especially the tropical lowland forest and moist montane forest. Geographically, EBA’s
are often islands or mountain ranges (Birdlife International, 2008). The poorly studied species are
species with very few or deficient data available about their status, distribution, abundance, etc.,
which makes them highly prioritized species to study. Specialist species are occurring in certain
habitats because of specialist habitat or food resource needs. If their habitat disappears, it is very
likely that the species will disappear too. Regarding the migratory species, we are working together
with the American National Park of North America and Canada. The bird species that are migrating
from north to south during northern hemisphere winters are being studied since little information is
available about these species when they are moving towards the south. Finally, the bird species with
important ecological functions are also our focus on species, since they have important functions
within the ecosystem they live. For example, woodpeckers make holes in trees that are habitats for
other species such as bats, beetles, etc.
Overall, the high species diversity and endemism of the avifauna in the Osa Peninsula coupled with
the threats of deforestation, fragmentation and climate change, highlights the need to better
understand and monitor the birds in the region. Due to the lack of scientific studies on birds in the
Osa Peninsula, Frontier aims to determine the species richness and abundance of birds in Carate in
relation to their habitat and disturbance, since bird distribution and species richness is often
explained by habitat type and environmental characteristics. Therefore, owing to their sensitivity
towards environmental changes, birds are good indicators of habitat health (Wilme and Goodman,
2003). Monitoring trends in bird diversity may help to identify species at risk of population decline or
even extinction due to human-induced environmental changes, such as habitat fragmentation and
loss, climate change, pollution and pet trade (Pejchar et al., 2008).
As such, the main objective is to compare the species richness and abundance between disturbed,
secondary and primary forest habitats through point count surveys, whereby the bird species are
recognized by sound and sight. In addition, Frontier aims to support the goals of the National Parks
Service in the United States of America and MINAE by monitoring migratory bird species that inhabit
both North America and migrate to Costa Rica during winter periods. Finally, due to the sensitivity of
conjunction with climatic changes over the long term.

CBP 164: Lovell, P.; Exley, L.; Kouters, M.; Jack, I.; Field, A.; Sexton, R.
21
Materials and Methods
This study focuses on 44 bird species, and the species are selected based on the following criteria;
endemic species, data deficient/poorly studied species, specialist species, migratory species, species
under threat (according to the IUCN) and species that perform a high ecological function.
Table 9: Overview of the selected 44 bird species on study.
Bird species common name Bird species Latin name Selected criteria
Fiery-billed Aracari Pteroglossus frantzii Endemic species to Pacific Costa Rica
and Western Panama
Chestnut-mandibled Toucan Ramphastos swainsonii Vulnerable
Black-bellied Wren Pheugopedius fasciatoventris Endemic species to Pacific Costa Rica
and Western Panama Riverside Wren Cantorchilus semibadius Endemic species to Pacific Costa Rica
and Western Panama; Data deficient Cherries Tanager Ramphocelus costaricensis Endemic species to Pacific Costa Rica
and Western Panama; Data deficient Blue-crowned Manakin Lepidothrix coronata Endemic species to Pacific Costa Rica
and Western Panama Red-capped Manakin Ceratopipra mentalis
Orange-collared Manakin Manacus aurantiacus Endemic species to Pacific Costa Rica
and Western Panama Pale-billed Woodpecker Campephilus guatemalensis Specialist species; Ecologically
important function Golden-naped Woodpecker Melanerpes chrysauchen Endemic species to Pacific Costa Rica
and Western Panama Long-tailed Woodcreeper Deconychura longicauda Near threatened
Bright-rumped Attila Attila spadiceus Disturbance indicator
Rufous Mourner Rhytipterna holerythra
Rufous Piha Lipaugus unirufus Specialist species
Tawny-Crowned Greenlet Hylophilus ochraceiceps Specialist species; Data deficient
Scarlet Macaw Ara macao Data deficient
Turquoise Cotinga Cotinga ridgwayi Endemic species to Pacific Costa Rica
and Western Panama; Vulnerable Yellow Warbler Setophaga petechia Migratory species
Golden-winged Warbler Vermivora chrysoptera Migratory species
Blue-winged Warbler Vermivora cyanoptera Migratory species
Black-hooded Antshrike Thamnophilus bridgesi Endemic speices to Pacific Costa Rica
and Western Panama; No data Black-cheeked Ant-tanager Habia atrimaxillaris Endemic species to the Osa Peninsula;
Endangered
Bicoloured Ant-bird Gymnopithys leucaspis

CBP 164: Lovell, P.; Exley, L.; Kouters, M.; Jack, I.; Field, A.; Sexton, R.
22
Dot-winged Antwren Microrhopias quixensis Specialist species
Ruddy-tailed Flycatcher Terenotriccus erythrurus Specialist species
Sulphur-rumped Flycatcher Myiobius sulphureipygius
Yellow-billed Cotinga Carpodectes antoniae Endemic to Costa Rica; Endangered
Baltimore Oriole Icterus galbula Migratory species
Rufous-tailed Jacamar Galbula ruficauda Disturbance indicator
Wood Thrush Hylocichla mustelina Near threatened; Migratory species
Smooth-billed Ani Crotophaga ani Disturbance indicator
Common Potoo Nyctibius griseus Poor data; Vulnerable
Great Tinamou Tinamus major Poor data; Climate change indicator
Great Curassow Crax rubra Vulnerable; Climate change indicator
Spectacled Owl Pulsatrix perspicillata Ecologically important function
Crested Guan Penelope purpurascens Poor data
Marbled wood Quail Odontophorus gujanensis Near Threatened
Spot-crowned Euphonia Euphonia imitans Endemic species to Pacific Costa Rica
and Western Panama; Specialist
species Green-shrike Vireo Vireolanius pulchellus Data deficient
Mealy Parrot Amazona farinosa Ecologically important function
White-crowned Parrot Pionus senilis Poor data; Ecologically important
function Brown-hooded Parrot Pyrilia haematotis Poor data; Specialist species
Black-Throated Trogon Trogon rufus Poor data
Baird’s Trogan Trogon bairdii Endemic species to Costa Rica; Near
Threatened
Using point counts, estimates of the bird species richness and abundance can be made. Point counts
are a widely used method to assess the distribution patterns and relative abundance of birds in
tropical habitats (Miller et al., 1998; Sánchez-Azofeifa et al., 2001; Henderson, 2010). A point count
refers to a count carried out by someone that is standing at a fixed place, from which the target
species (birds) are counted by sight and call, and this for a fixed period of time (Bibby et al., 2000;
Gibbons and Gregory, 2006; Hartley and Greene, 2012). The methodology is quite straightforward
and observers can easily gather the required data by walking a trail and stop at different points to
record all the present bird species by sound and sight. It must be said that, due to the high level of
tree density within a tropical forest, as well as the very high species diversity in this region, there is
quite a high level of experience necessary to detect and identify birds accurate. The point counts are
carried out along all the different trails; Luna Ridge, Leona Ridge, Shady Lane, Rio Carate, Attalea
Loop, road. During each survey, three point counts are carried out, separated 250 m from each other
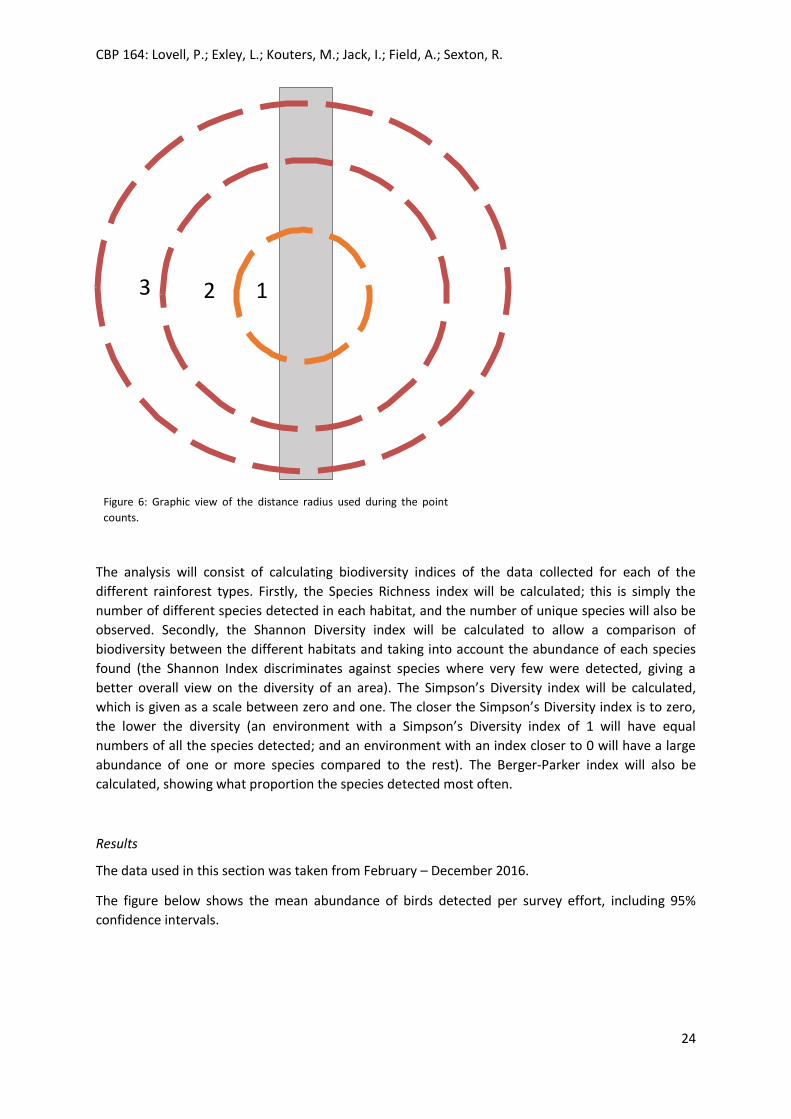
and started at 100 m from the forest edge. Since we work with a distance radius of 0 – 30 m (1), 30 –
100 m (2) and >100 m (3), it is important to stick with the 250 m in between the point counts to
avoid an overlap of counts. Furthermore, it is important to take into account the effort efficiency of
the observers. This is why not more than three point counts were carried out during every survey
since there is a drop in focus over time, making it important to find a compromise between

CBP 164: Lovell, P.; Exley, L.; Kouters, M.; Jack, I.; Field, A.; Sexton, R.
23
collection effort and precision/accuracy (Verner, 1985). Before starting the recording period of ten
minutes, there is a two minute settling period to allow the birds coming back after our disturbance
from walking towards the point counts. The point counts are permanent points, which are
permanently chosen locations within a site and clearly marked with colourful tape flags (Huff et al.,
2000). All the birds that are seen and heard within the different radius are noted down (sight: S;
sound: H), as well as the flying-over and flying-through birds are recorded in a separate list as
respectively FO and FT.
CBP 164: Lovell, P.; Exley, L.; Kouters, M.; Jack, I.; Field, A.; Sexton, R.
24
3 2 1
Figure 6: Graphic view of the distance radius used during the point
counts.
The analysis will consist of calculating biodiversity indices of the data collected for each of the
different rainforest types. Firstly, the Species Richness index will be calculated; this is simply the
number of different species detected in each habitat, and the number of unique species will also be
observed. Secondly, the Shannon Diversity index will be calculated to allow a comparison of
biodiversity between the different habitats and taking into account the abundance of each species
found (the Shannon Index discriminates against species where very few were detected, giving a
better overall view on the diversity of an area). The Simpson’s Diversity index will be calculated,
which is given as a scale between zero and one. The closer the Simpson’s Diversity index is to zero,
the lower the diversity (an environment with a Simpson’s Diversity index of 1 will have equal
numbers of all the species detected; and an environment with an index closer to 0 will have a large
abundance of one or more species compared to the rest). The Berger-Parker index will also be
calculated, showing what proportion the species detected most often.
Results
The data used in this section was taken from February – December 2016.
The figure below shows the mean abundance of birds detected per survey effort, including 95%
confidence intervals.

CBP 164: Lovell, P.; Exley, L.; Kouters, M.; Jack, I.; Field, A.; Sexton, R.
25
Figure 7: The encounter rate of abundance of birds per survey effort in each of the different habitats,
with 95% confidence intervals.
The highest detection of birds was found in the secondary habitat (n=9.53), and the lowest detection
was in the primary forest (n=7.86). A t-test was performed to see if there was a significant difference
in detection in the primary and secondary forests, however the null hypothesis that forest type had
no impact was accepted (p>0.05).
Table 10 below shows a summary of the different indices used to calculate diversity.
Table 10: Summary table of the Species Richness, Unique Species, Shannon Diversity index, and the Simpson's
Diversity index.
FOREST TYPE
RICHNESS UNIQUE SPECIES
SHANNON INDEX
SIMPSONS INDEX
BERGER-PARKER
PRIMARY 20 1 2.426 0.877 0.27
SECONDARY 24 6 2.167 0.806 0.38
DISTURBED 18 1 2.207 0.846 0.28
GALLERY 11 0 1.179 0.529 0.66
From the above table, we can see that the secondary forest has the highest species richness (24) and
unique species (6), however the primary forest has the highest biodiversity indices (Shannon=2.426;
Simpson’s=0.877). The gallery forest has the lowest species richness (11), unique species (0), and
both Shannon and Simpson’s indices (1.179 and 0.529 respectively).
Discussion
From Table 10 in the results section we can see that the secondary forest has higher species richness
(24) and unique species (6) than the primary forest (20 and 1 respectively). However, after taking
into account the different diversity indices we can conclude that although the species richness is
higher in secondary forest, this includes a lot of species that were only detected once (over 40% of
the species detected in the secondary forest were detected only once, compared to less than 12% in
the primary forest). Therefore we can conclude the primary forest has the highest levels of
biodiversity, and this result is echoed in many other comparative studies of biodiversity. The higher
level of biodiversity in primary forest can be attributed to lower levels of habitat degradation and
0
2
4
6
8
10
12
Gallery Disturbed Secondary Primary
Ind
ivid
ual
s/ S
urv
ey
Forest Type
CBP 164: Lovell, P.; Exley, L.; Kouters, M.; Jack, I.; Field, A.; Sexton, R.
26
fragmentation, which is known to affect bird species worldwide, as well as the presence of a higher
diversity of flora which may support specialist species vulnerable to deforestation. The gallery forest
has the lowest levels of biodiversity, with the lowest values for both the Shannon (1.179) and
Simpson’s Diversity (0.529) indices. This low value for the Simpson’s Diversity in the gallery forest
can be attributed to the fact that the disturbed forest had a 0.66 Berger-Parker index, meaning that
66% of the individuals detected came from one species (the Scarlet macaw), therefore there is a
higher likelihood that two individual observations chosen at random will be the same species. The
disturbed habitat also has higher biodiversity indices than the secondary forest, which may also be
due to the fact that 38% of the individuals detected in secondary forest were scarlet macaws,
compared with 28% in the disturbed forest.
The secondary forest detected the most unique species (6), including the near-threatened marbled
wood quail and wood thrush (both detected only once). That there were more unique species
(including species categorised with a higher threat of extinction) detected in the secondary forest
despite there being lower levels of biodiversity when compared with primary forest can be
attributed to the fact that there was a higher sample effort there (19 compared to 14), as well as
detection being simpler in more degraded habitat (it is harder to detect certain species in denser,
primary forest). There was a lower survey effort in the primary zones due to the trails being less
accessible, particularly during the wet season when Rio Carate became so high that it was impossible
to cross.
This study is still very much in its infancy, with staff members as well as volunteers still in the process
of learning bird calls and recognizing them by sound and sight. Furthermore, bird sound recording
equipment will be purchased in order to record the bird calls in the field and identify them back on
camp by using the online catalogued bird calls. This will ensure a more reliable dataset by double
checking bird call recognizing skills in the field with the recordings. Furthermore, it will be possible to
observe the accuracy of the observers before surveys are carried out.
For the next phase, more emphasis will be put on investigating the edge and patch effects on the
species composition. Methodology similar to Banks-Leite, Ewers & Metzger (2012) will be employed,
and the aim will be to study the effect of the fragmented landscape on the composition of bird
species in Carate.
Turtle Predation Study along Carate Beach, Osa Peninsula
Introduction
Sea turtles have been swimming in our oceans for millions of years and are a fundamental link in
marine ecosystems by maintaining the health of coral reefs and sea grass beds. They survived
different environmental changes thanks to their special adaptations (Spotilla, 2011). Nowadays, sea
turtles face a whole new range of human-induced threats including poaching, climate change,
pollution, beach development and artificial lighting (Safina, 2006; Spotilla, 2011), highly affecting
their growth, reproduction and thus survival (Spotilla, 2011). Their temperature-dependent sex
determination makes them an excellent indicator species for climate change, and therefore a
flagship species for conservation. Increasing temperatures create a sex bias skewed towards
females, which can cause entire populations to collapse (Hamann et al., 2007; Valverde et al., 2010;
Hawkes et al., 2011). Their late maturation in conjunction with these anthropogenic threats make
turtle populations highly vulnerable and often unstable (Govan, 1998). A global rise in sea levels
causes a decline in nesting habitat, and changing ocean currents and sea temperature rise leads to
decreasing prey species availability (Fish et al., 2005; Chaloupka et al., 2008; Robinson et al., 2009).

CBP 164: Lovell, P.; Exley, L.; Kouters, M.; Jack, I.; Field, A.; Sexton, R.
27
Worldwide, six of the seven sea turtle species are now endangered and threatened with extinction
(IUCN, 2016). Predation, especially on the eggs and hatchlings, highly affects sea turtle populations
in a negative way. Natural predators such as crabs, raccoons, birds, coyotes and sharks play a major
role in the food web. In addition, humans are negatively affecting sea turtles by disturbing the
nesting beaches in different ways; people leaving trash near the shore for example, which
unintentionally invites other, non-native species to look for food. In Central America, many
communities permit their domesticated dogs and cats to run free in coastal villages, leading to
several sea turtle nests being dug up and females being attacked while nesting. Furthermore,
poaching and the illegal trade of eggs, hatchlings and turtles further reduce the turtle populations.
With as few as one in 1000 eggs reaching adulthood, the destruction of only a few nests can have a
devastating effect on any sea turtle population. The main problem is that sea turtles have developed
special adaptations that allow them to live actively in the water, leaving them very clumsy on the
land. They are not fast enough to escape since they are unable to retract their heads and flippers
into their shell, like land tortoises, making them very vulnerable to these invasive predators (Sea
Turtle Conservancy, 2016; IUCN, 2008).
A number of conservation strategies have been established throughout Costa Rica, including limited
legal commercial egg harvesting on a nesting beach in Ostional during the first 36 hours of wet
season arribadas (mass arrival of turtles) (Campbell, 1998) and an annual catch of 1,800 black turtles
being granted to fishermen in Limόn (Troëng and Rankin, 2004). The latter may have increased
extractive use along with illegal hunting in the mid-90s. The ban on black turtle fishing and increased
law enforcement since 1999 may have increased female turtle survivorship (Troëng and Rankin,
2004). In other regions such as Tortuguero, the Costa Rican government has made egg poaching
illegal, in addition to prohibiting the trade of calipee, the edible part of the shell (Government of
Costa Rica 1963 and 1969; Troëng and Rankin, 2004). Meanwhile, the growing ecotourism industry
in Costa Rica has provided locals with an alternative source of income and has promoted
conservation throughout the country. To evaluate the effectiveness of such strategies, it is
imperative that monitoring programmes are long term as it can take decades for species with late
maturity to show a population response (Troëng and Rankin 2004; Bjorndal et al., 1999).
Costa Rica is an important nesting area for four sea turtle species: green turtles (Chelonia mydas),
hawksbills (Eretmochelys imbricata), olive ridleys (Lepidochelys olivacea) and leatherbacks
(Dermochelys coriacea) (Drake, 1993). All four species have been recorded as nesting in southern
Costa Rica, on the Osa Peninsula. Hawksbills and leatherbacks are listed as Critically Endangered,
green turtles are Endangered, and olive ridleys are Vulnerable (IUCN, 2013). On the Osa Peninsula,
turtles are threatened primarily from predation by dogs, coastal development, illegal trade of eggs
and, to a lesser extent, turtle meat (Drake, 1996). Therefore, the aim of this project is to monitor the
frequency of predation and the health of the nesting turtle populations. The Frontier Costa Rica
Forest research programme works in partnership with CORTORCO, protecting the four species which
nest here (see above). The hawksbills and leatherbacks rarely nest on these two beaches whereas
the olive ridley is most commonly found nesting here (Troëng and Rankin, 2004; Honarvar et al.,
2008; IUCN, 2013).
The Pacific green turtle has a circumglobal distribution, occurring in tropical and subtropical waters;
they are migratory species and undertake complex movements and migrations through
geographically different habitats. Nesting takes place in more than 80 countries worldwide (Hirth,
1997). Their movements within the marine environment are less understood, but apparently they
inhabit coastal water of over 140 countries (Groombridge and Luxmoore, 1989). The Olive ridley sea
turtle has circumtropical distribution, with nesting occurring in tropical waters and migratory circuits
CBP 164: Lovell, P.; Exley, L.; Kouters, M.; Jack, I.; Field, A.; Sexton, R.
28
in tropical and subtropical areas (Pritchard, 1969). They nest along the beaches of nearly 60 different
countries.
Materials and Methods
During this third phase of 2016 (July-September), we focused on the two common sea turtle species
present in this area; the Pacific green turtle (Chelonia mydas) and the olive ridley sea turtle
(Lepidochelys olivacea).
Both morning and night patrols were carried out on Playa Carate beach. Morning patrols began at
05:00 am on Playa Carate to minimise surveyor exposure to direct sunlight and high temperatures.
Night patrols typically started at 20:00 pm on both beaches. Each week, the high tide times were
checked online in order to fit the morning and night patrols into the schedule. To minimise the
disturbance to nesting females, survey teams were limited to six people and used red lights during
the night patrols. The survey area for both beaches was divided into 25 m sectors within a 2.3 km
stretch of Playa Carate and each sector had its own number. For every turtle track encountered, the
following data had to be collected during the night patrols:
Patrol date and names of recorders; this is for having an idea of the survey effort
Time of recording; both start and end time of the survey, as well as the time when a nest
was encountered
Beach sector number; always taking the smallest number (e.g. if observers are in between
sector 11 and 12, they will write down sector 11)
Distance from nest to the vegetation; either zone 1 (tidal inundation zone), 2 (beach area) or
3 (vegetation area)
Sea turtle species: olive ridley turtle or Pacific green turtle
Nest type associated with the tracks: Nest or False nest (N/F); false nest when the turtle
returned to the sea without nesting
Track symmetry: symmetrical (S) or asymmetrical (A)
After writing down the data, the track was crossed out in the sand to avoid the track being recorded
again in subsequent patrols. The track characteristics were used to identify the species if the turtles
were absent, where asymmetrical tracks suggest Olive ridley and symmetrical tracks suggest Pacific
green. In-situ nests were confirmed by inserting a stick into the sand to locate the egg chamber
(indicated by a marked change in resistance when pressure was applied) followed by careful digging
to confirm the presence of eggs. A false crawl was defined by the absence of a nest or where it was
clear that the turtle returned to sea without digging a nest.
During the morning patrols, predation of the nests was also checked. In the case of a predated nest,
made obvious by the presence of predator tracks, egg shells and signs that the nest had been dug
up, and the same measurements that were taken on the night patrols were taken, along with:
Predated nest (yes/no)
Presence of tracks (yes/no); if possible identifying the predator based on the tracks
Percentage of predation
It is important to note that every predated nest seen had to be analysed to be sure that it was a
newly recorded predated nest. This involved checking to see if the eggs were still soft, meaning that
CBP 164: Lovell, P.; Exley, L.; Kouters, M.; Jack, I.; Field, A.; Sexton, R.
29
the eggs were recently predated. If a new predated nest was found, the pieces of egg were dug up
and put together to determine the amount of eggs predated. If nests were found around the lagoon,
or the area in front of the airstrip up to the coconut bar, the nests were relocated.
This study was carried out in cooperation with the local community and COTORCO, with the results
being reported directly to MINAE. At the end of the season COTORCO will analyse the data after
which it will be shared with the various organisations (including Frontier) that have been working on
this project. Therefore there are currently no results or analysis for this project. The next phase will
include many hatching dates, and therefore excavations will be a large part of the sea turtle
conservation project. The next phase also marks the end of the sea turtle nesting season, and
therefore some analyses should have taken place in collaboration with COTORCO and Planet
Conservation.
Amphibian & Reptile Abundance in Primary, Secondary and Degraded Forest
Introduction
Amphibians are at the forefront of a major global decline; with over 43% of species facing population
decline (Folt and Reider, 2013), they are currently one of the most threatened vertebrate groups on
the planet (Puschendorf, et al., 2009). Reptiles, although being understudied, with the status of only
35% of described species being recorded by the IUCN, are believed by some to be facing a similar
population trends in terms of taxonomic breadth and geographic scope (Bohm, et al., n.d). Despite
the global biodiversity crisis these animals are facing, and their extreme ecological importance
within tropical ecosystems, very little is known about what is causing these severe declines (Collins
and Storfer, 2003; Whitfield, et al., 2007). It is believed that herpetofauna, due to their very specific
habitat requirements and narrow distribution ranges, are especially at risk from anthropogenic
disturbance and habitat fragmentation (Whitfield, et al., 2007; Bohm, et al., n.d; Bell and Donnelly,
2007). However, decreases in amphibian populations have also been witnessed in apparently
undisturbed habitats which seemingly lack any negative human activity (Puschendorf, et al., 2009).
It is of vital importance that we are able to further our understanding of what is fuelling the loss of
so many species, as many species of herpetofauna play vital roles within their habitat as either
important predators or prey species. They are also seed dispersers, as well as serving as an indicator
of the health of the ecosystem (Bell and Donnelly, 2007; Bohm, et al., n.d). In order to understand
the underlying causes of the severe declines we are witnessing (with a loss of over 120 species since
1980 (Whitfield, et al., 2007), long term studies into the population dynamics of tropical
herpetofauna are needed. It is especially difficult to analyse the changes in amphibian populations,
as these tend to fluctuate greatly on an annual basis due to variations in rainfall and temperature
etc. (Collins and Storfer, 2003). The best way to combat this issue is, of course, through the
launching of a long term study into the herpetofauna of the Osa Peninsula (an area where such
research is lacking) in order to gain an understanding of the spatial and temporal distribution of
species, as well as monitoring their population trends.
In Carate, we are able to monitor the presence of species in a variety of different habitat types,
conducting surveys in primary, secondary and disturbed forest, as well as the road side and along
river habitats. This study is currently still in its primary stages and through the use of visual
encounter surveys (VES) are currently collecting the baseline data of the species that are present in
these different habitat types. Over time, as the study progresses, we will then be able to analyse the
fluctuations in the populations of the herpetofauna that we are finding in the Osa Peninsula.
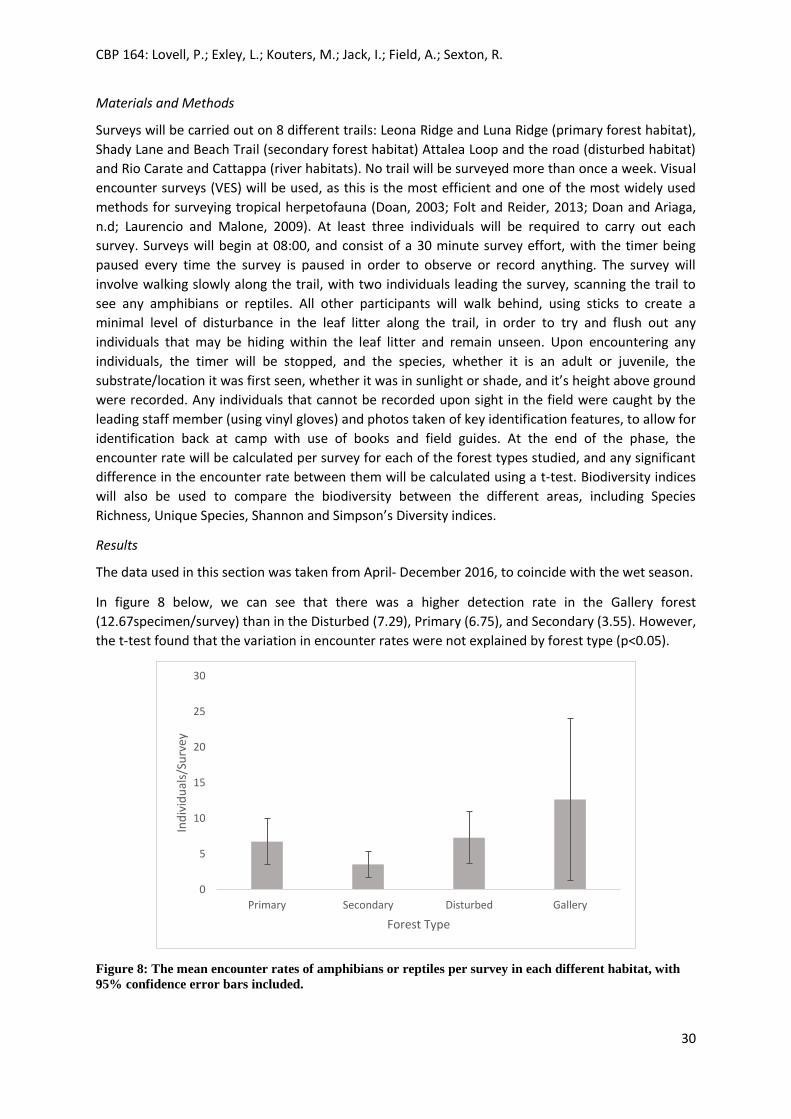
CBP 164: Lovell, P.; Exley, L.; Kouters, M.; Jack, I.; Field, A.; Sexton, R.
30
Materials and Methods
Surveys will be carried out on 8 different trails: Leona Ridge and Luna Ridge (primary forest habitat),
Shady Lane and Beach Trail (secondary forest habitat) Attalea Loop and the road (disturbed habitat)
and Rio Carate and Cattappa (river habitats). No trail will be surveyed more than once a week. Visual
encounter surveys (VES) will be used, as this is the most efficient and one of the most widely used
methods for surveying tropical herpetofauna (Doan, 2003; Folt and Reider, 2013; Doan and Ariaga,
n.d; Laurencio and Malone, 2009). At least three individuals will be required to carry out each
survey. Surveys will begin at 08:00, and consist of a 30 minute survey effort, with the timer being
paused every time the survey is paused in order to observe or record anything. The survey will
involve walking slowly along the trail, with two individuals leading the survey, scanning the trail to
see any amphibians or reptiles. All other participants will walk behind, using sticks to create a
minimal level of disturbance in the leaf litter along the trail, in order to try and flush out any
individuals that may be hiding within the leaf litter and remain unseen. Upon encountering any
individuals, the timer will be stopped, and the species, whether it is an adult or juvenile, the
substrate/location it was first seen, whether it was in sunlight or shade, and it’s height above ground
were recorded. Any individuals that cannot be recorded upon sight in the field were caught by the
leading staff member (using vinyl gloves) and photos taken of key identification features, to allow for
identification back at camp with use of books and field guides. At the end of the phase, the
encounter rate will be calculated per survey for each of the forest types studied, and any significant
difference in the encounter rate between them will be calculated using a t-test. Biodiversity indices
will also be used to compare the biodiversity between the different areas, including Species
Richness, Unique Species, Shannon and Simpson’s Diversity indices.
Results
The data used in this section was taken from April- December 2016, to coincide with the wet season.
In figure 8 below, we can see that there was a higher detection rate in the Gallery forest
(12.67specimen/survey) than in the Disturbed (7.29), Primary (6.75), and Secondary (3.55). However,
the t-test found that the variation in encounter rates were not explained by forest type (p<0.05).
Figure 8: The mean encounter rates of amphibians or reptiles per survey in each different habitat, with
95% confidence error bars included.
0
5
10
15
20
25
30
Primary Secondary Disturbed Gallery
Ind
ivid
ual
s/Su
rvey
Forest Type

CBP 164: Lovell, P.; Exley, L.; Kouters, M.; Jack, I.; Field, A.; Sexton, R.
31
In table 11 below, we can see that the highest Species Richness and Simpson’s Index was detected in
the disturbed habitat (11 and 0.823 respectively) and the highest Shannon Diversity index was found
in the secondary forest 1.498), the most amount of unique species were found in the disturbed
habitat (4), and the highest Berger-Parker index was found in the gallery forest (0.87). The lowest
Species Richness, Shannon and Simpson’s Diversity indices were found in the gallery forest (4, 0.528,
and 0.246 respectively).
Table 11: A summary of the different Biodiversity Indices calculated according to each forest type.
Forest Type Richness Unique Species Shannon Index Simpsons Index Sample Effort Berger-Parker
Primary 7 1 1.456 0.692 8 0.52
Secondary 8 0 1.498 0.812 20 0.34
Disturbed 11 4 1.323 0.823 14 0.29
Gallery 4 0 0.528 0.246 3 0.87
Discussion
It can be seen in figure 8 that while the detection rate is higher in gallery forests than in the other
types, this is more likely due to chance than to the different forest types surveyed. Also, the survey
effort was much lower in the gallery forest and the variation around the mean is very high.
Table 11 shows us that the secondary forest supports the highest levels of biodiversity (Shannon
index = 1.498), and that the disturbed forests has the most evenly spread abundance of the different
species detected, due to the fact that the most dominant species Basiliscus basiliscus (Basilisk)
accounted for under 30% of the individuals detected. The gallery forest had the least even diversity,
and while the detection rate was the highest of all the habitats, the basilisk species Basiliscus
basiliscus accounted for 87% of the individuals detected, which would explain this low score.
There were a few limitations to this study, the biggest of which was misidentification in the field,
leading to the misrepresentation of rarer species.
This study is currently being improved by the inclusion of new trails, and the standardisation of
distance between the different trails to give comparable survey areas. The new amphibian and
reptile study will begin at the start of the next wet season (in April), and for the time being pilot
studies are being conducted on several trails to assess their value to the detection of species and
their forest types that they represent.
CBP 164: Lovell, P.; Exley, L.; Kouters, M.; Jack, I.; Field, A.; Sexton, R.
32
References
• Bell, K. E., & Donnelly, M. A. (2007). Influence of Forest Fragmentation on Community
Structure of Frogs and Lizards in Northeastern Costa Rica. Conservation Biology. 20(6): 1750-1760.
• Bohm, M., Collen, B., Baillie, J. E., Bowles , P., Chanson, J., Cox, N., et al. (n.d). The
conservation status of the worlds reptiles.
• Collins, J. P., & Storfer, A. (2003). Global amphibian declines: sorting the hypothesis.
Diversity and Distributions. 9:89-98.
• Doan, T. M. (2003). Which Methods Are Most Effective for Surveying Rain Forest
Herpetofauna? Journal of Herpetology. 37(1), 72-81.
• Doan, T. M., & Ariaga, W. A. (n.d). The Impact of Tourism on the Herpetofauna of
Tambopata, South eastern Peru.
• Folt, B., & Reider, K. E. (2013). Leaf-litter herpetofaunal richness, abundance and community
assembly in mono-dominant plantations and primary forest of northeastern Costa Rica. Biodivesity
Consevation. 22:2057-2070.
• Laurencio, D., & Malone, J. H. (2009). Amphibians and Reptiles of Parque Nacional Carara, A
Transitional Herpetofaunal Assemblage in Costa Rica. Herpetological Conservation and Biology 4(1),
120-131.
• Puschendorf, R., Carnaval, A. C., VanDerWal, J., Zumbado-Ulate, H., Chaves, G., Bolanos, F.,
et al. (2009). Distribution models for the amphibian chytrid Batrachochytrium dendrobatidis in Costa
Rica: proposing climatic refuges as a conservation tool . Diversity and Distributions, 401-408.
• Whitfield, S. M., Bell, K. E., Phillipi, T., Sasa, M., Bolanos, F., Chaves, G., et al. (2007).
Amphibian and reptile declines over 35 years at La Selva, Costa Rica. PNAS. 104(20):8352-8356.
• Barrantes, G., Q. Jimenez, J. Lobo, T. Maldonado, M. Quesada, & R. Quesada. 1999. Manejo
Forestal y Realidad Nacional en la Peninsula de Osa. INBio, San Jose, Costa Rica
• Blake, J. G., & B. A. Loiselle. 2001. Bird assemblages in second-growth and old-growth
forests, Costa Rica: Perspectives from mist-nets and point counts. The Auk. 118: 304–326.
• Canaday, C. 1996. Loss of insectivorous birds along a gradient of human impact in Amazonia.
Biological Conservation. 77: 63–77.
• Herzog, S.K., Kessler, M., & Cahill, T.M. 2002. Estimating species richness of tropical bird
communities from rapid assessment data. The Auk. 119 (3): 749-769.
• Minca, C. & Linda, M. 2002. Ecotourism on the Edge: the case of Corcovado National Park,
Costa Rica. In: Font, X. & Tribe, J. editors. Forest tourism and recreation: case studies in
environmental management. Oxon: CABI Publishing, UK. 103-127.
• Osa Conservation. 2016. Our work: Birds. Available at:
http://osaconservation.org/projects/wildlife/birds/ [16 March 2016].
• Ruiz-Gutiérrez, V., T. A. Gavin, & A. A. Dhondt. 2008. Habitat fragmentation lowers survival
of a tropical forest bird. Ecological Applications. 18: 838–846.

CBP 164: Lovell, P.; Exley, L.; Kouters, M.; Jack, I.; Field, A.; Sexton, R.
33
• Sánchez-Azofeifa, G. A., R. C. Harriss, & D. L. Skole. 2001. Deforestation in Costa Rica: a
quantitative analysis using remote sensing imagery. Biotropica. 33: 378–384.
• Sanchez-Azofeifa, G., Rivard, B., Calvo, J. & Moorthy, I. 2002. Dynamics of Tropical
Deforestation Around National Parks: Remote Sensing of Forest Change on the Osa Peninsula of
Costa Rica. 2002. Mountain Research and Development. 22(4): 352-358.
• Sekercioglu, C. H., P. R. Ehrlich, G. C. Daily, D. Aygen, D. Goehring, & R. F. Sandi. 2002.
Disappearance of insectivorous birds from tropical forest fragments. Proceedings of the
National Academy of Sciences of the United States of America. 99: 263–267.
• Sigel, B. J., T. W. Sherry, & B. E. Young. 2006. Avian community responses to lowland tropical
rainforest isolation: 40 years of change at La Selva Biological Station, Costa Rica. Conserv. Biol. 20:
111–121.
• Wilson, S., Collister, D. & Wilson A. 2011. Community composition and annual survival of
lowland tropical forest birds on the Osa Peninsula, Costa Rica. Ornitologia Neotropical. 22:421-436.
• Woltmann, S., & T. W. Sherry. 2011. High apparent annual survival and stable territory
dynamics of Chestnut-backed Antbird (Myrmeciza exsul) in a large Costa Rican rain forest preserve.
The Wilson Journal of Ornithology. 123: 15–23.
• Wormworth, J. & Mallon, K. 2006. Bird Species and Climate Change: The Global Status
Report version 1.0. London: Climate Risk Pty Limited.
• Young, B. E., D. Derosier, & G. V. N. Powell. 1998. Diversity and conservation of understory
birds in the Tilarán Mountains, Costa Rica. The Auk. 115: 998–1016.
• Young, B. E., T. W. Sherry, B. J. Sigel, & S. Woltmann. 2008. Nesting success of Costa Rican
lowland rain forest birds in response to edge and isolation effects. Biotropica. 40: 615–622.