
Cost-Volume-Profit Analysis - UCSC Directory of …shep/migrated/11… · PPT file · Web view ·...
53
Copyright © 2009 by The McGraw-Hill Companies, Inc. All rights reserved. McGraw-Hill/Irwin Chapter 7 Cost-Volume- Profit Analysis
Transcript of Cost-Volume-Profit Analysis - UCSC Directory of …shep/migrated/11… · PPT file · Web view ·...
Copyright © 2009 by The McGraw-Hill Companies, Inc. All rights reserved.
McGraw-Hill/Irwin
Chapter 7
Cost-Volume-Profit Analysis

Copyright © 2009 by The McGraw-Hill Companies, Inc. All rights reserved.
McGraw-Hill/Irwin
Learning Objective
1
7-3
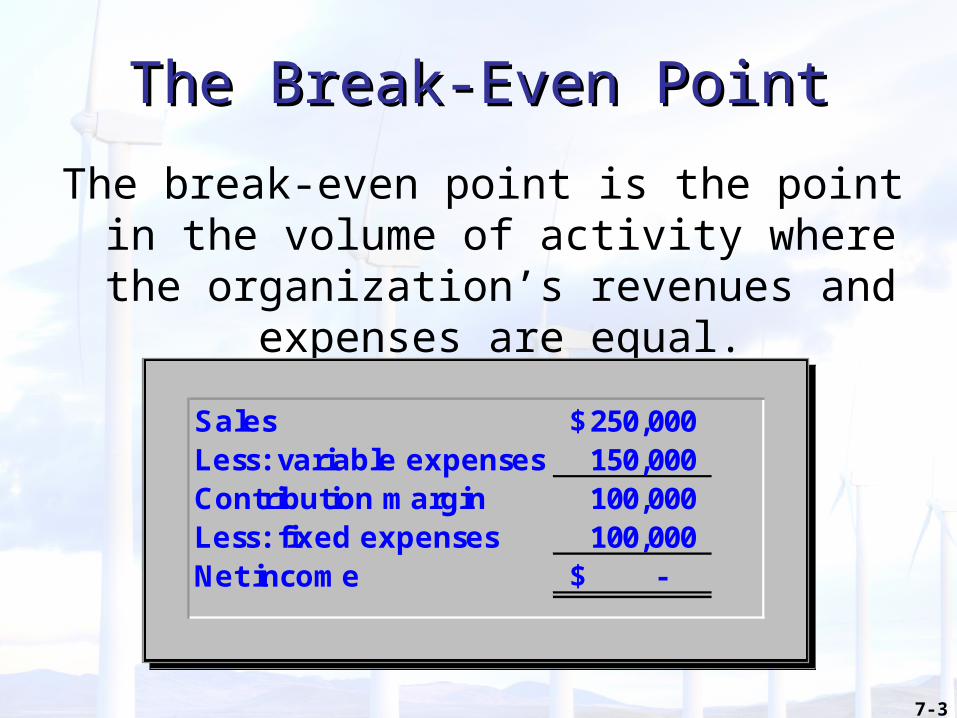
The Break-Even PointThe Break-Even Point
The break-even point is the point in the volume of activity where the organization’s
revenues and expenses are equal.
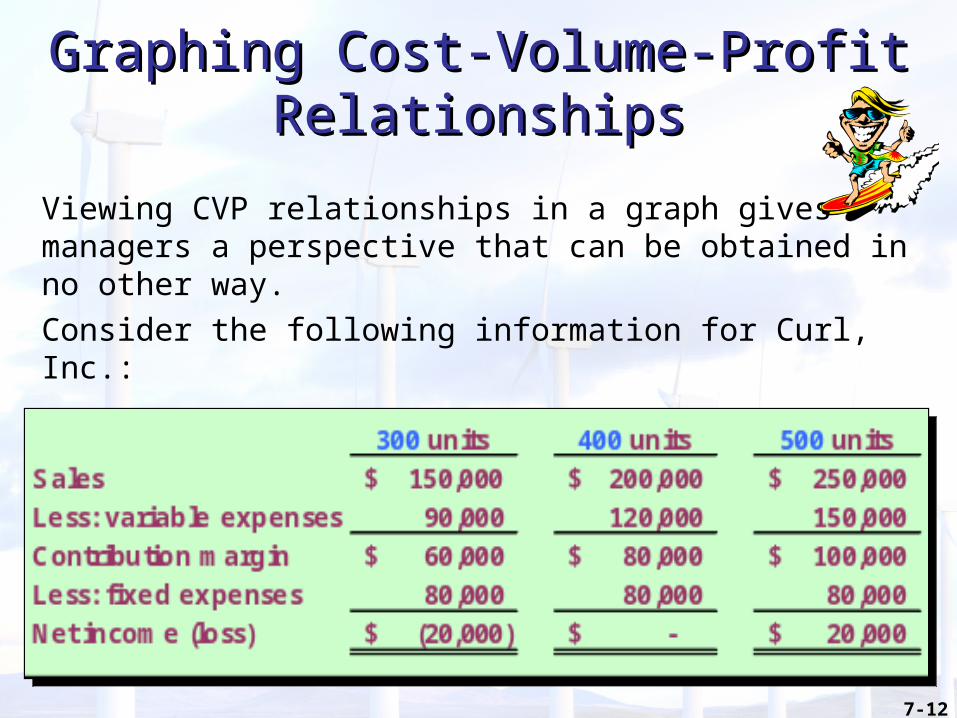
Sales 250,000$ Less: variable expenses 150,000 Contribution margin 100,000 Less: fixed expenses 100,000 Net income -$
7-4
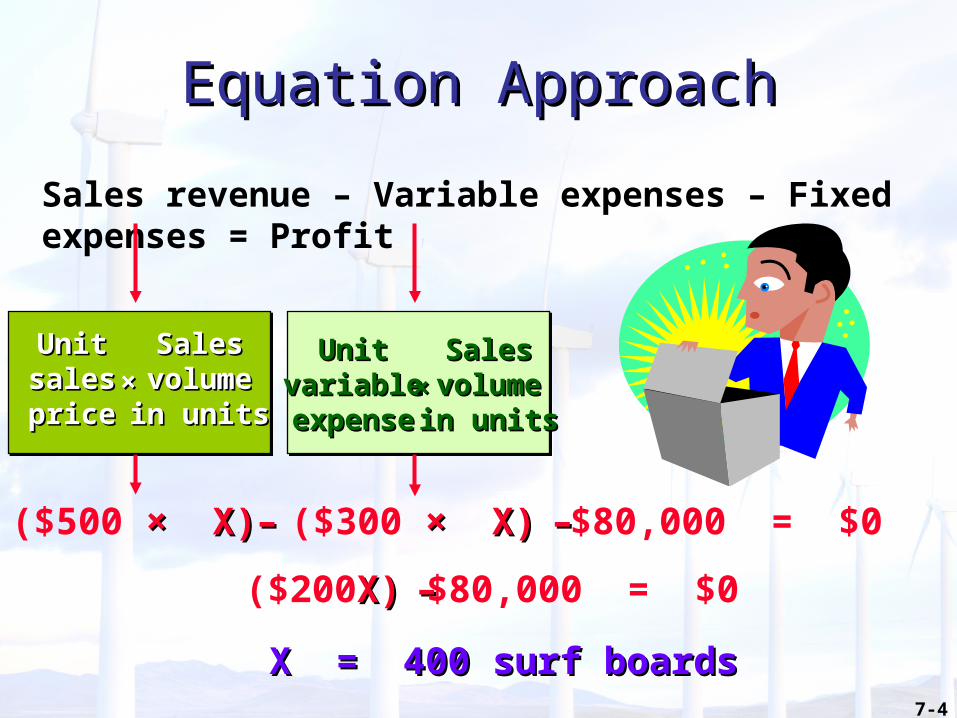
Equation ApproachEquation Approach
Sales revenue – Variable expenses – Fixed expenses = Profit
UnitUnitsalessalespriceprice
SalesSalesvolumevolumein unitsin units
××UnitUnit
variablevariableexpenseexpense
SalesSalesvolumevolumein unitsin units
××
($500 × X)× X) ($300 × X)× X)–– –– $80,000 = $0
($200X)X) –– $80,000 = $0
X = 400 surf boardsX = 400 surf boards

Copyright © 2009 by The McGraw-Hill Companies, Inc. All rights reserved.
McGraw-Hill/Irwin
Learning Objective
2
7-6
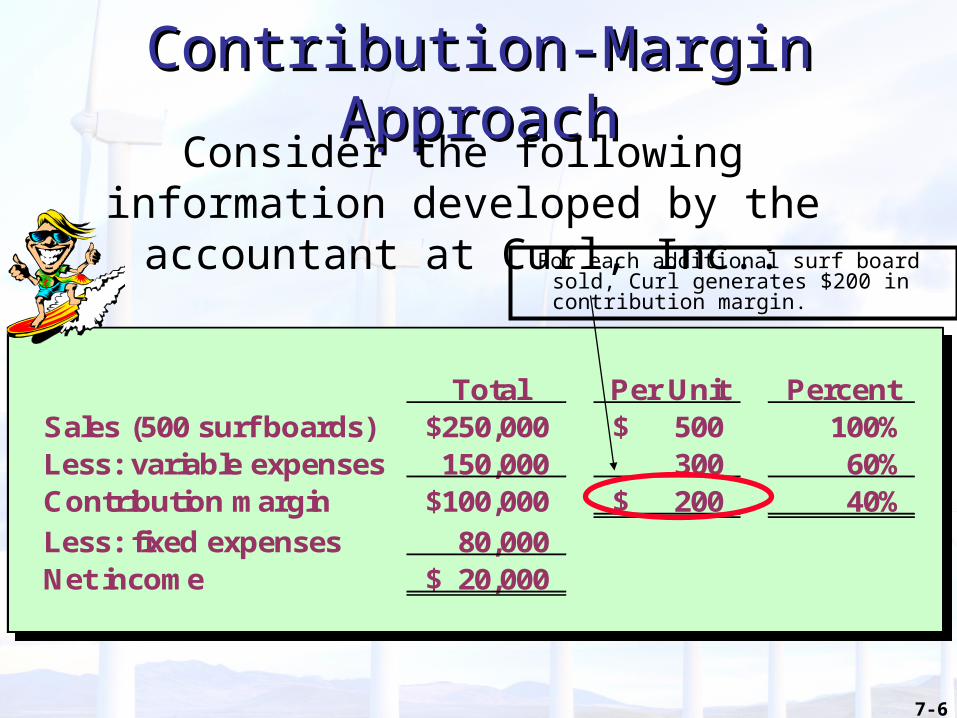
Contribution-Margin ApproachContribution-Margin Approach
For each additional surf board sold, Curl generates $200 in contribution margin.
Total Per Unit PercentSales (500 surf boards) 250,000$ 500$ 100%Less: variable expenses 150,000 300 60%Contribution margin 100,000$ 200$ 40%Less: fixed expenses 80,000 Net income 20,000$
Consider the following information developed by the accountant at Curl, Inc.:
7-7
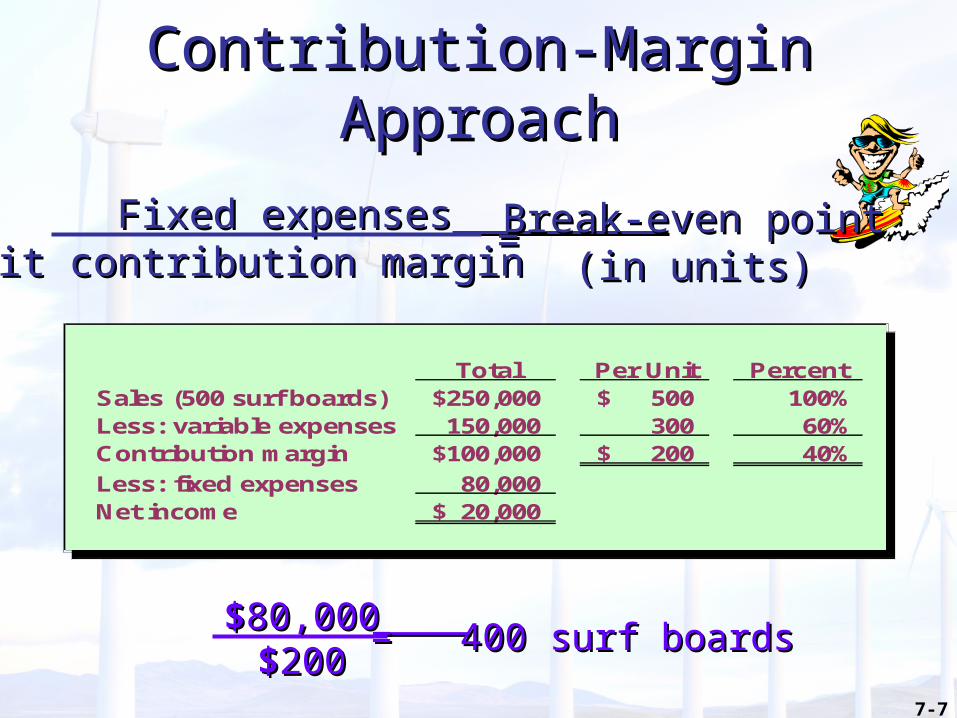
Contribution-Margin ApproachContribution-Margin Approach
Fixed expensesFixed expenses Unit contribution margin Unit contribution margin ==
Break-even pointBreak-even point(in units)(in units)
Total Per Unit PercentSales (500 surf boards) 250,000$ 500$ 100%Less: variable expenses 150,000 300 60%Contribution margin 100,000$ 200$ 40%Less: fixed expenses 80,000 Net income 20,000$
$$80,00080,000 $$200200 == 400 surf boards400 surf boards
7-8
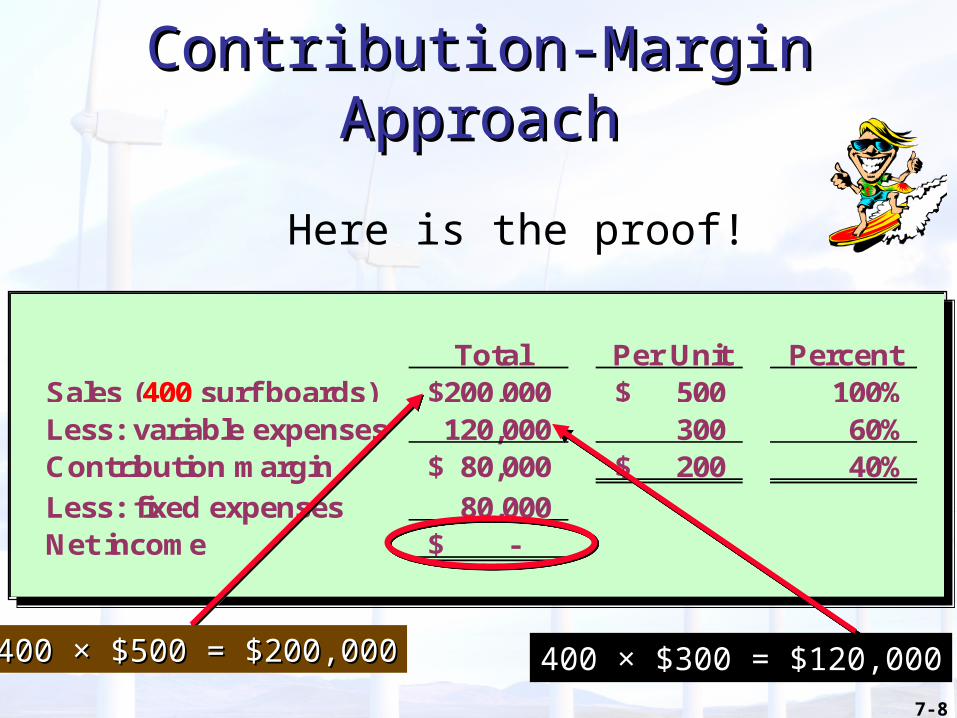
Contribution-Margin ApproachContribution-Margin Approach
Here is the proof!
Total Per Unit PercentSales (400 surf boards) 200,000$ 500$ 100%Less: variable expenses 120,000 300 60%Contribution margin 80,000$ 200$ 40%Less: fixed expenses 80,000 Net income -$
400 × $500 = $200,000400 × $500 = $200,000 400 × $300 = $120,000400 × $300 = $120,000
7-9
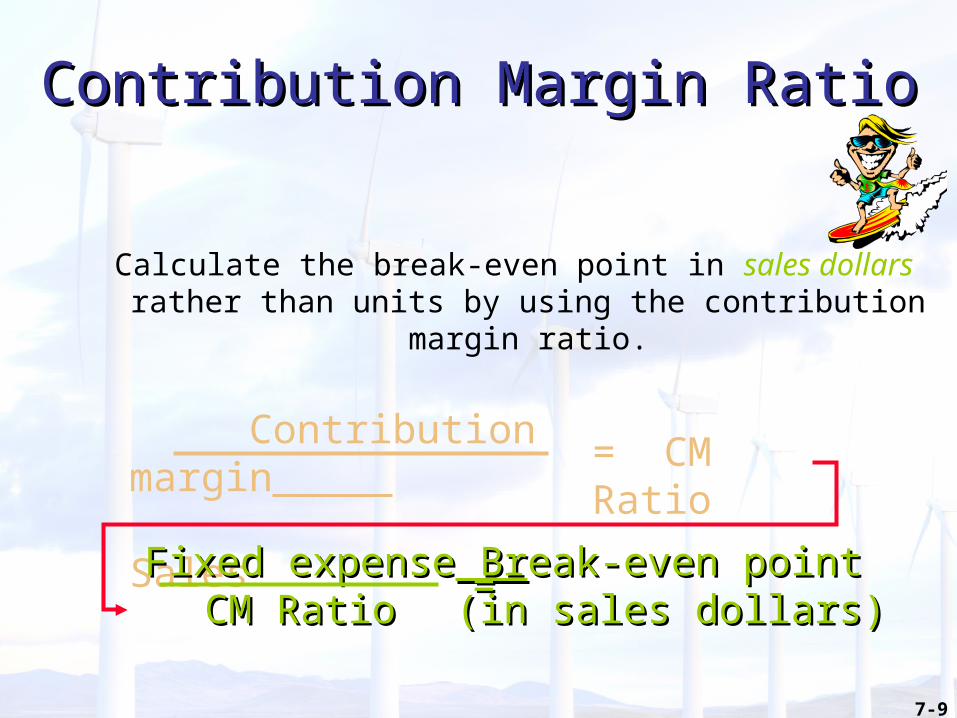
Contribution Margin RatioContribution Margin Ratio
Calculate the break-even point in sales dollars rather than units by using the contribution margin ratio.
Contribution margin Sales
= CM Ratio
Fixed expenseFixed expense CM RatioCM Ratio
Break-even pointBreak-even point(in sales dollars)(in sales dollars)==
7-10
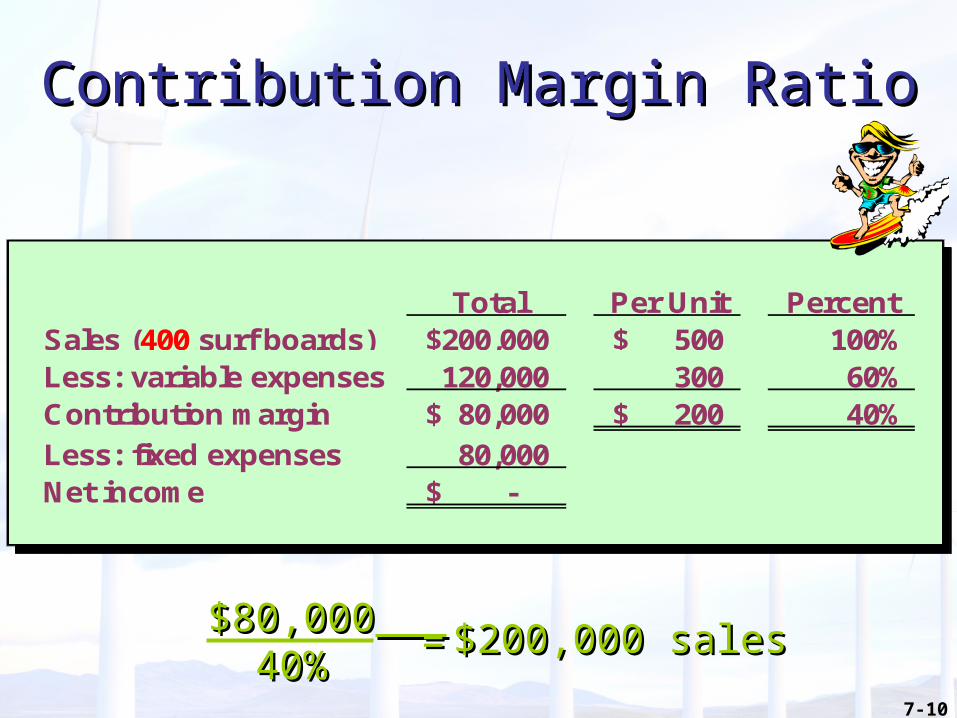
Total Per Unit PercentSales (400 surf boards) 200,000$ 500$ 100%Less: variable expenses 120,000 300 60%Contribution margin 80,000$ 200$ 40%Less: fixed expenses 80,000 Net income -$
Contribution Margin RatioContribution Margin Ratio
$80,000$80,000 40%40% $200,000 sales$200,000 sales==

Copyright © 2009 by The McGraw-Hill Companies, Inc. All rights reserved.
McGraw-Hill/Irwin
Learning Objective
3
7-12
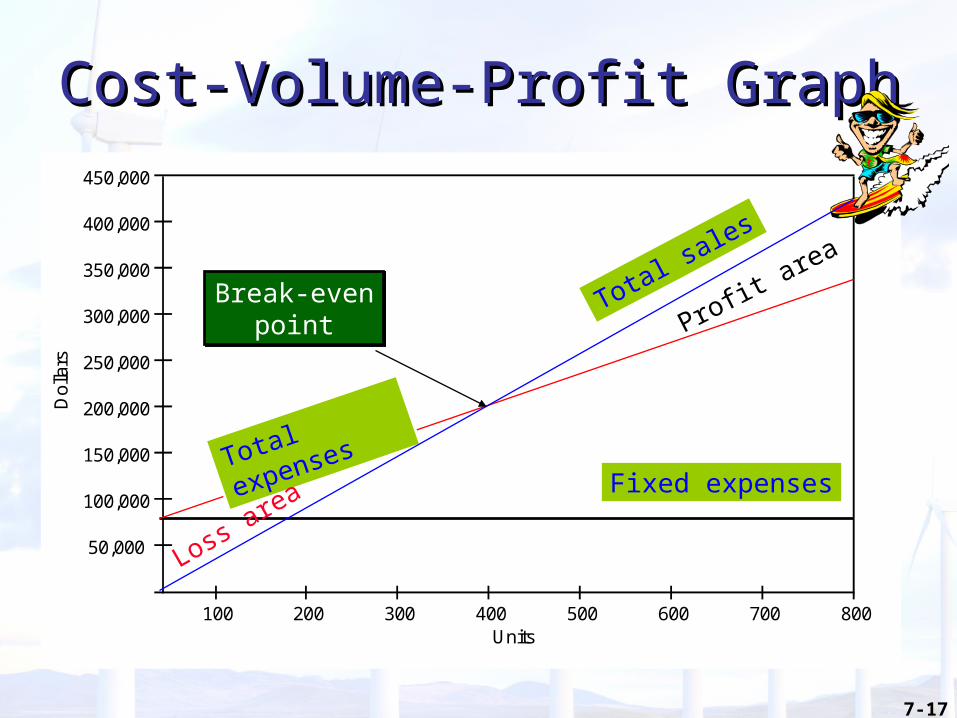
Graphing Cost-Volume-Profit Graphing Cost-Volume-Profit RelationshipsRelationships
Viewing CVP relationships in a graph gives managers a perspective that can be obtained in no other way.Consider the following information for Curl, Inc.:
7-13
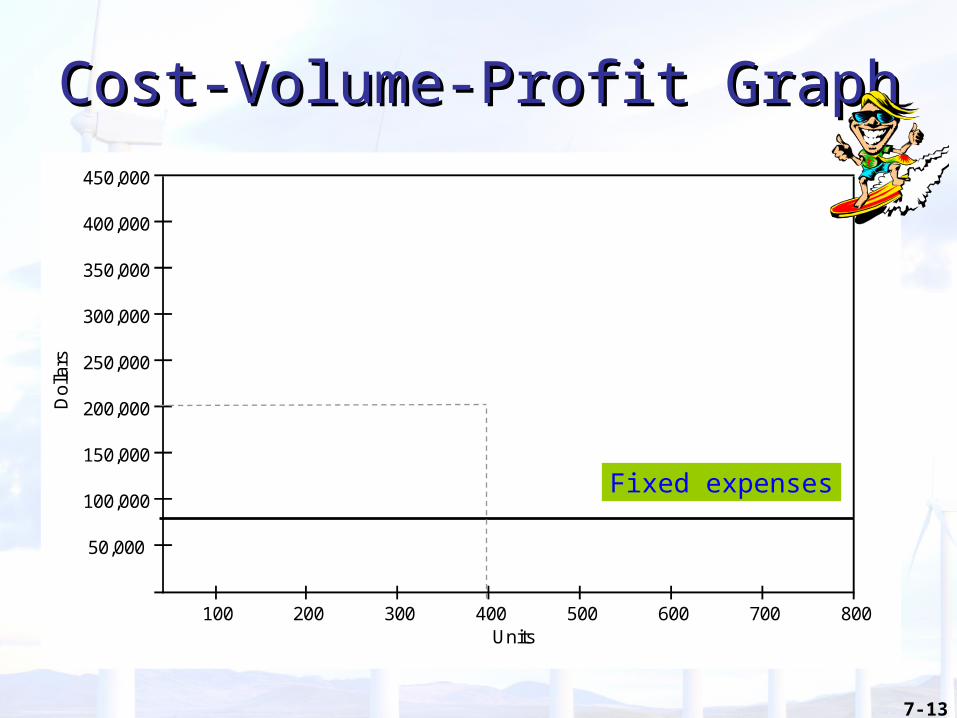
Cost-Volume-Profit GraphCost-Volume-Profit GraphD
olla
rs
600 700 800Units
200 300 400 500
450,000
100
200,000
150,000
100,000
50,000
400,000
350,000
300,000
250,000
Fixed expenses

7-14
Cost-Volume-Profit GraphCost-Volume-Profit GraphD
olla
rs
600 700 800Units
200 300 400 500
450,000
100
200,000
150,000
100,000
50,000
400,000
350,000
300,000
250,000
Fixed expensesTotal expenses
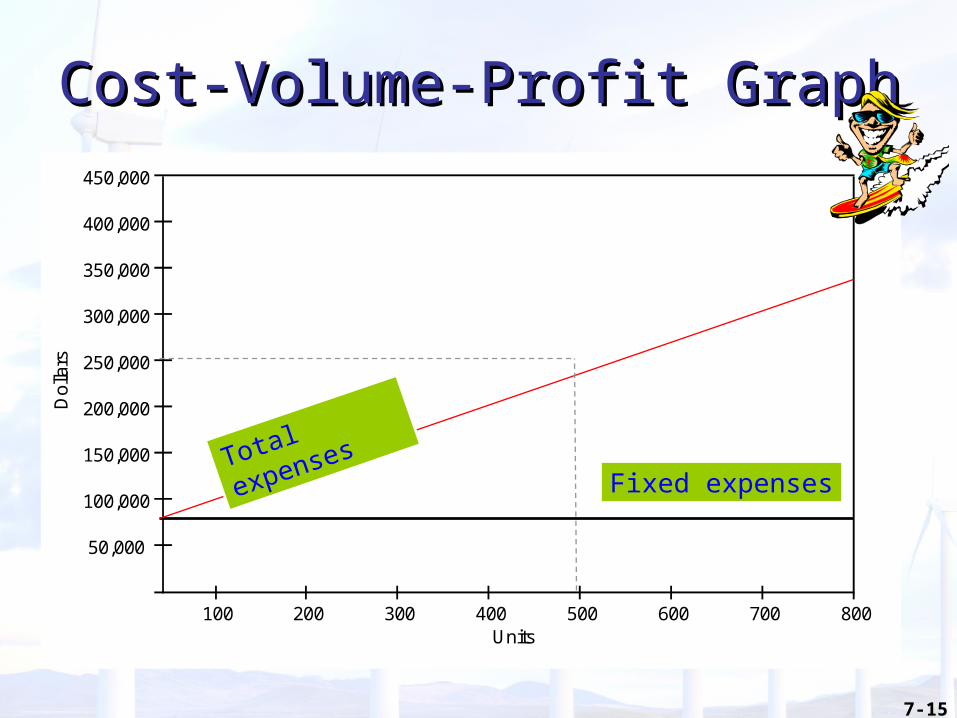
7-15
Cost-Volume-Profit GraphCost-Volume-Profit GraphD
olla
rs
600 700 800Units
200 300 400 500
450,000
100
200,000
150,000
100,000
50,000
400,000
350,000
300,000
250,000
Fixed expensesTotal expenses
7-16
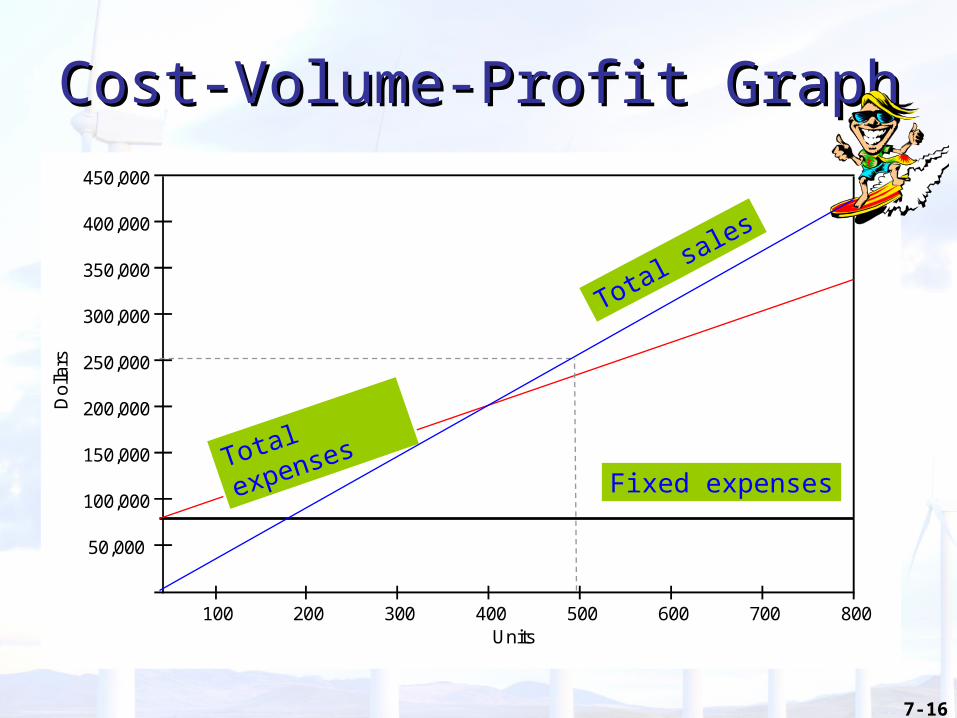
Cost-Volume-Profit GraphCost-Volume-Profit GraphD
olla
rs
600 700 800Units
200 300 400 500
450,000
100
200,000
150,000
100,000
50,000
400,000
350,000
300,000
250,000
Fixed expensesTotal expenses
Total sales
7-17
Cost-Volume-Profit GraphCost-Volume-Profit GraphD
olla
rs
600 700 800Units
200 300 400 500
450,000
100
200,000
150,000
100,000
50,000
400,000
350,000
300,000
250,000
Fixed expensesTotal expenses
Total sales
Break-evenpoint Profit a
rea
Loss area

7-18
Profit-Volume GraphProfit-Volume GraphSome managers like the profit-volume
graph because it focuses on profits and volume.
`
100 200 300 400 500 600 700Units
Pro
fit
0
100,000
(20,000)
(40,000)
(60,000)
80,000
60,000
40,000
20,000
Loss area
Profit areaBreak-even
point

Copyright © 2009 by The McGraw-Hill Companies, Inc. All rights reserved.
McGraw-Hill/Irwin
Learning Objective
4
7-20
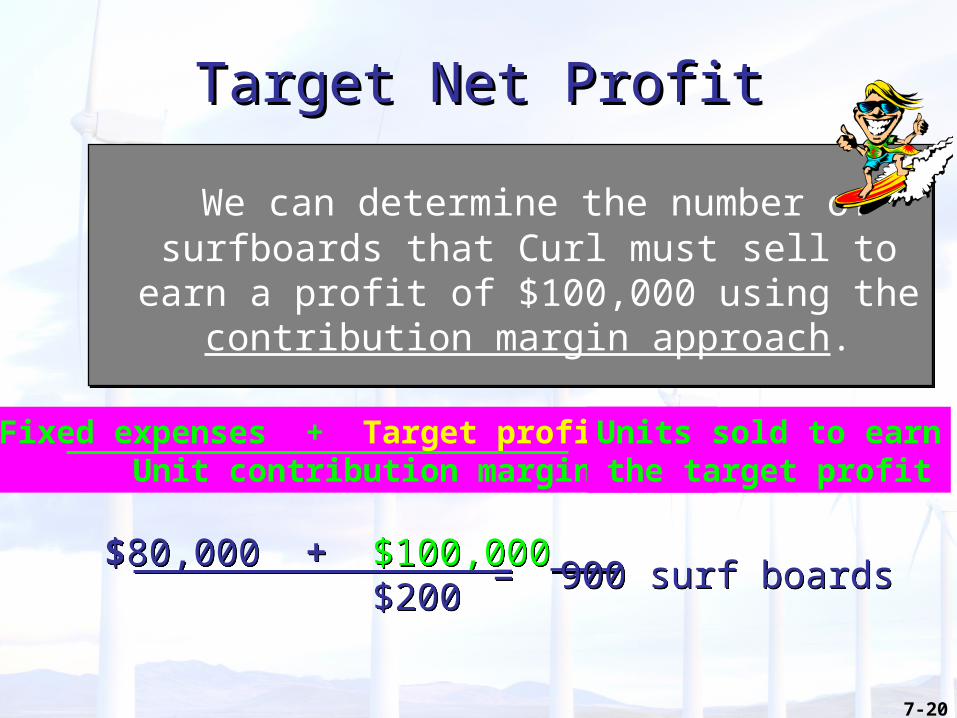
Target Net ProfitTarget Net Profit
We can determine the number of surfboards that Curl must sell to earn a profit of $100,000
using the contribution margin approach.
Fixed expenses + Target profit Unit contribution margin = Units sold to earn
the target profit
$80,000 + $100,000 $200 = 900 surf boards
7-21
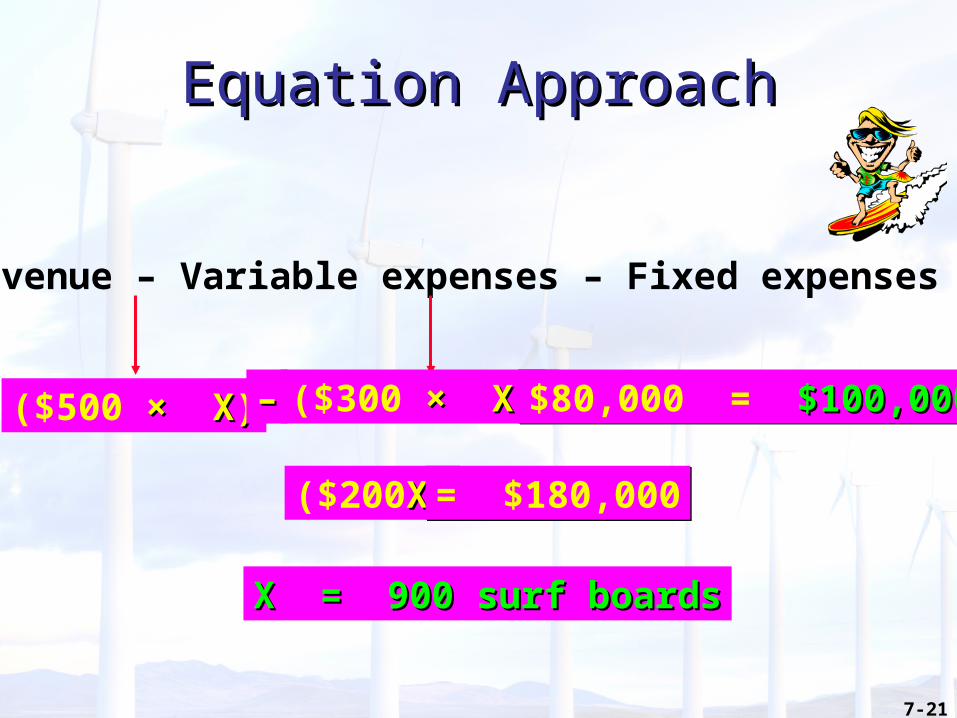
Equation ApproachEquation Approach
Sales revenue – Variable expenses – Fixed expenses = Profit
($500 × X)× X) ($300 × X)× X)–– –– $80,000 = $100,000$100,000
($200X)X) = $180,000
X = 900 surf boardsX = 900 surf boards
7-22
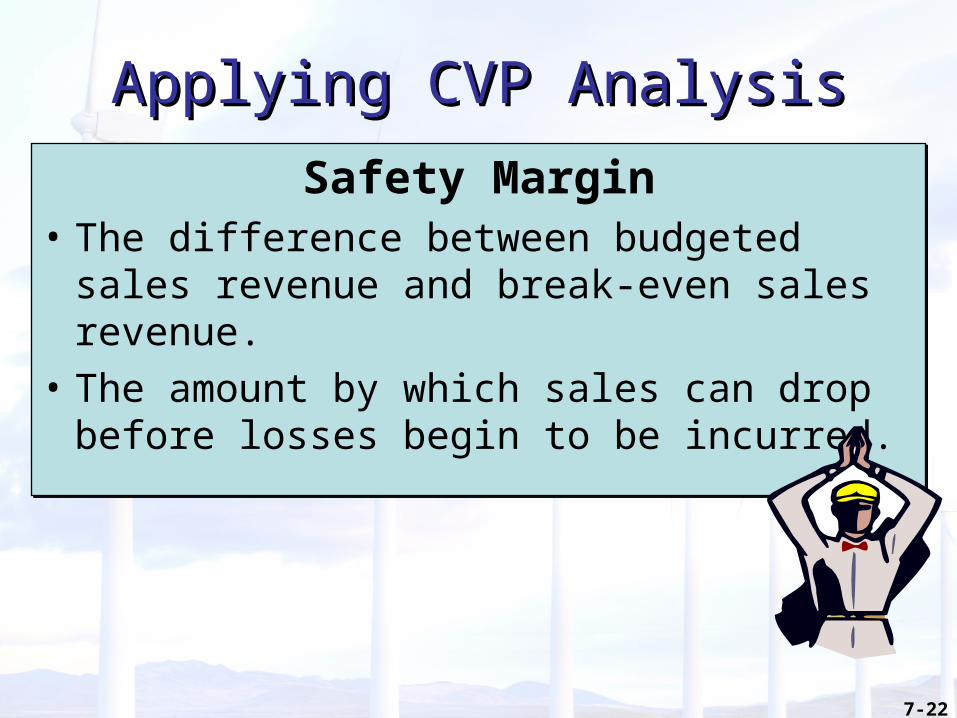
Applying CVP AnalysisApplying CVP Analysis
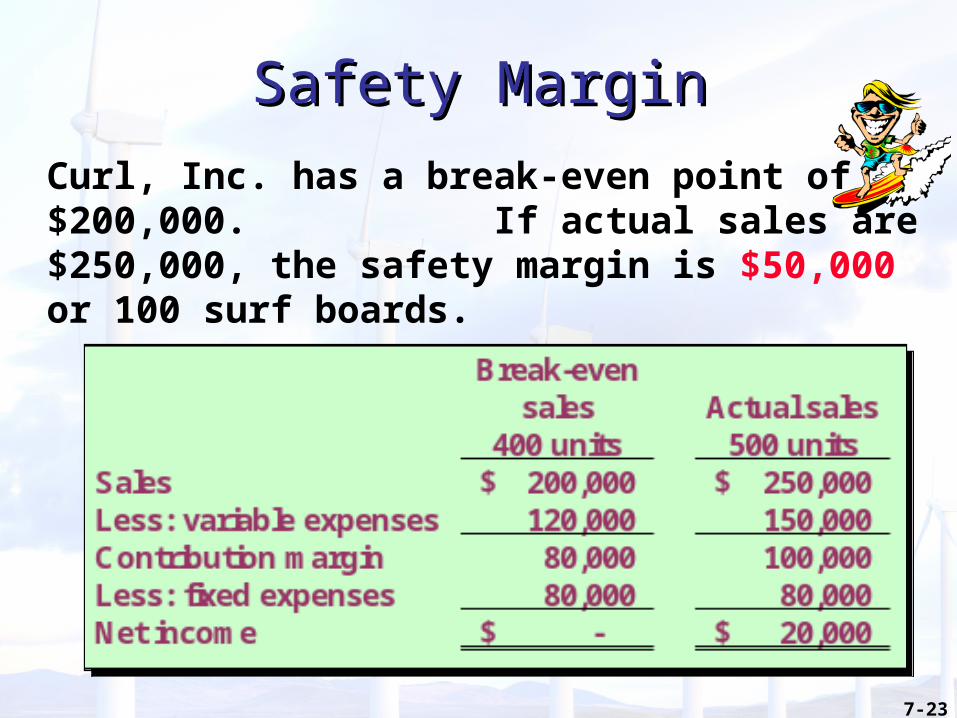
Safety Margin• The difference between budgeted sales
revenue and break-even sales revenue.• The amount by which sales can drop before
losses begin to be incurred.
7-23
Safety MarginSafety MarginCurl, Inc. has a break-even point of $200,000. If actual sales are $250,000, the safety margin is $50,000 or 100 surf boards.
7-24
Changes in Fixed CostsChanges in Fixed Costs
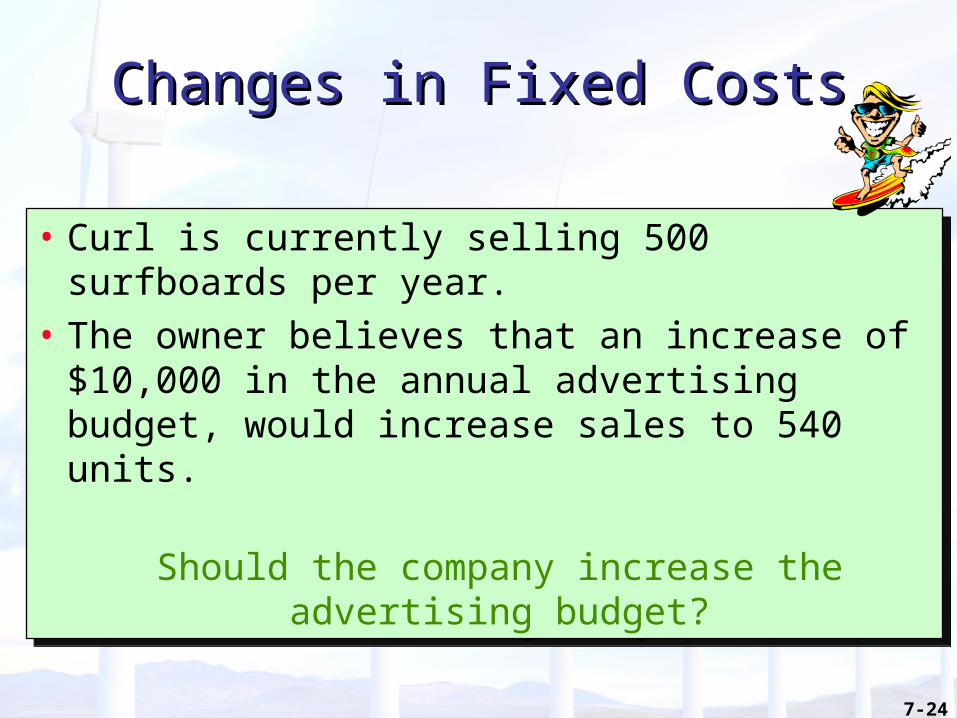
• Curl is currently selling 500 surfboards per year.
• The owner believes that an increase of $10,000 in the annual advertising budget, would increase sales to 540 units.
Should the company increase the advertising budget?
7-25
Changes in Fixed CostsChanges in Fixed Costs
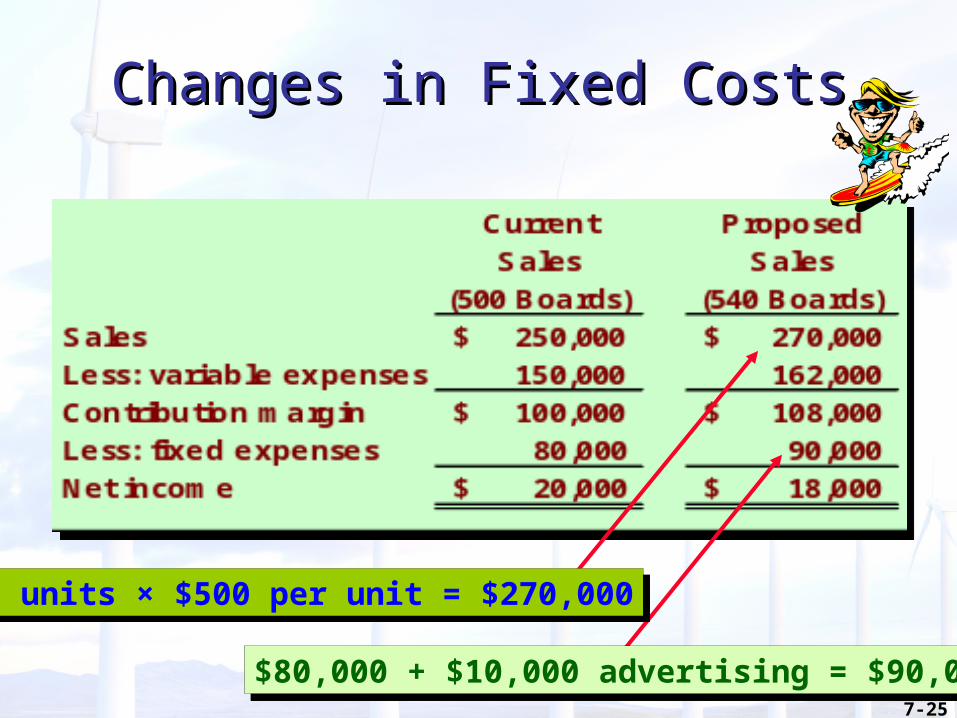
$80,000 + $10,000 advertising = $90,000
540 units × $500 per unit = $270,000
7-26
Changes in Fixed CostsChanges in Fixed Costs
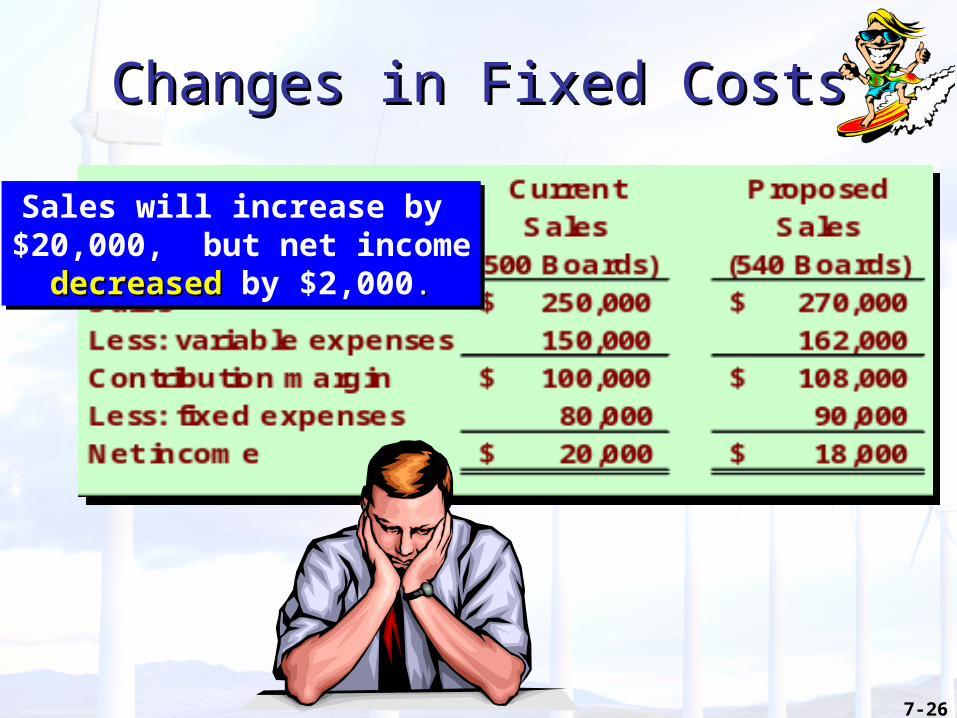
Sales will increase by $20,000, but net income
decreaseddecreased by $2,000..
7-27
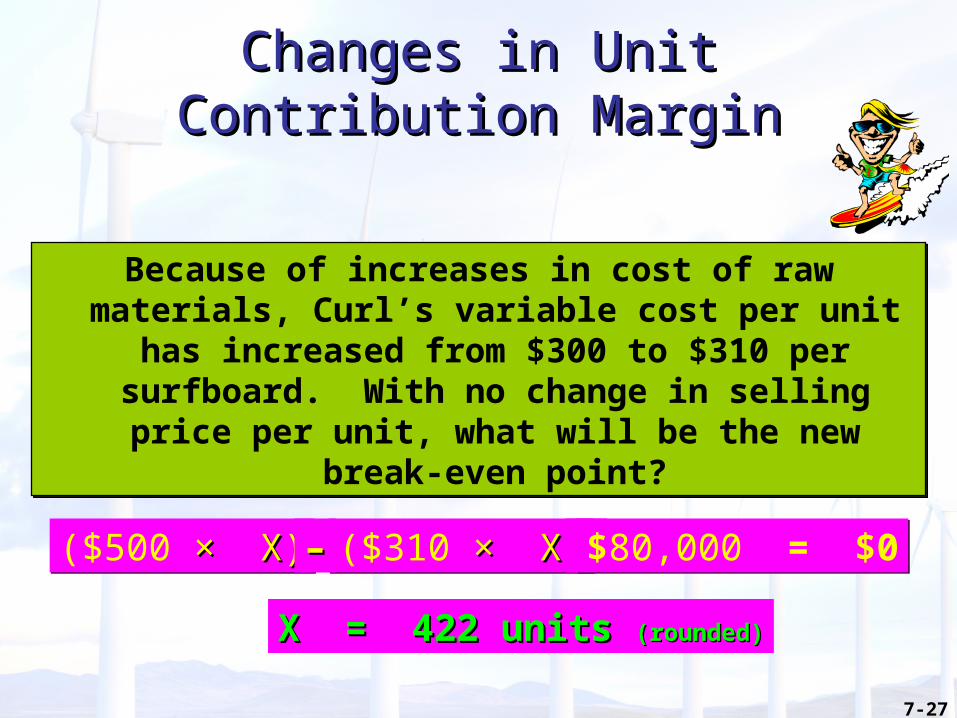
Changes in UnitChanges in UnitContribution MarginContribution Margin
Because of increases in cost of raw materials, Curl’s variable cost per unit has increased from $300 to $310 per surfboard. With no
change in selling price per unit, what will be the new break-even point?
($500 × X)× X) ($310 × X)× X)–– – $80,000 = $0
X = 422 units X = 422 units (rounded)(rounded)
7-28
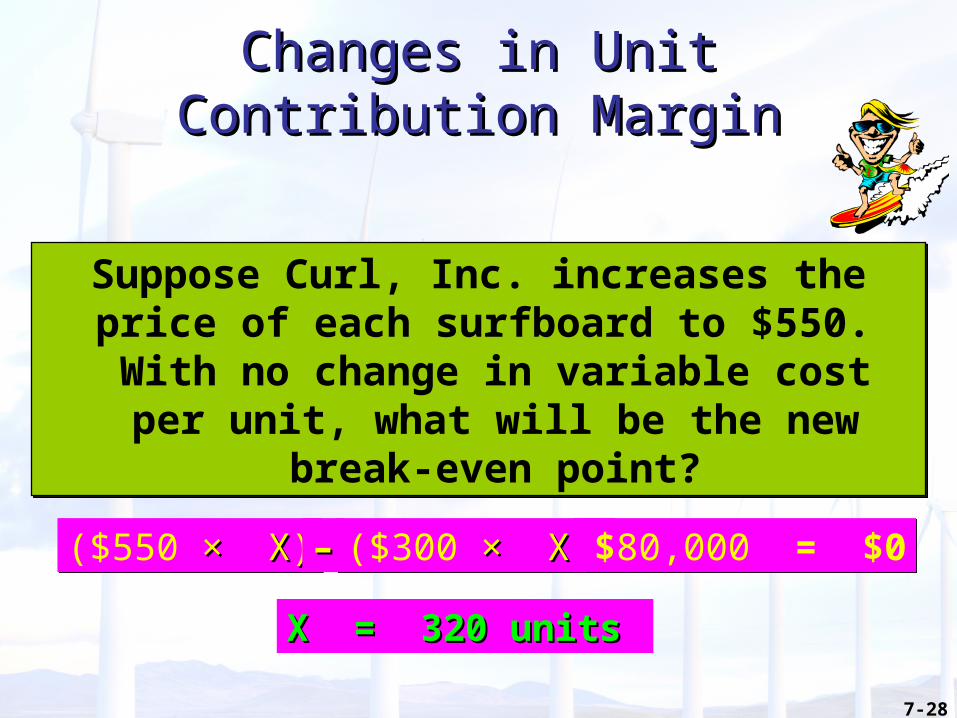
Changes in UnitChanges in UnitContribution MarginContribution Margin
Suppose Curl, Inc. increases the price of each surfboard to $550. With no change in variable cost per unit, what will be the
new break-even point?
($550 × X)× X) ($300 × X)× X)–– – $80,000 = $0
X = 320 units X = 320 units
7-29
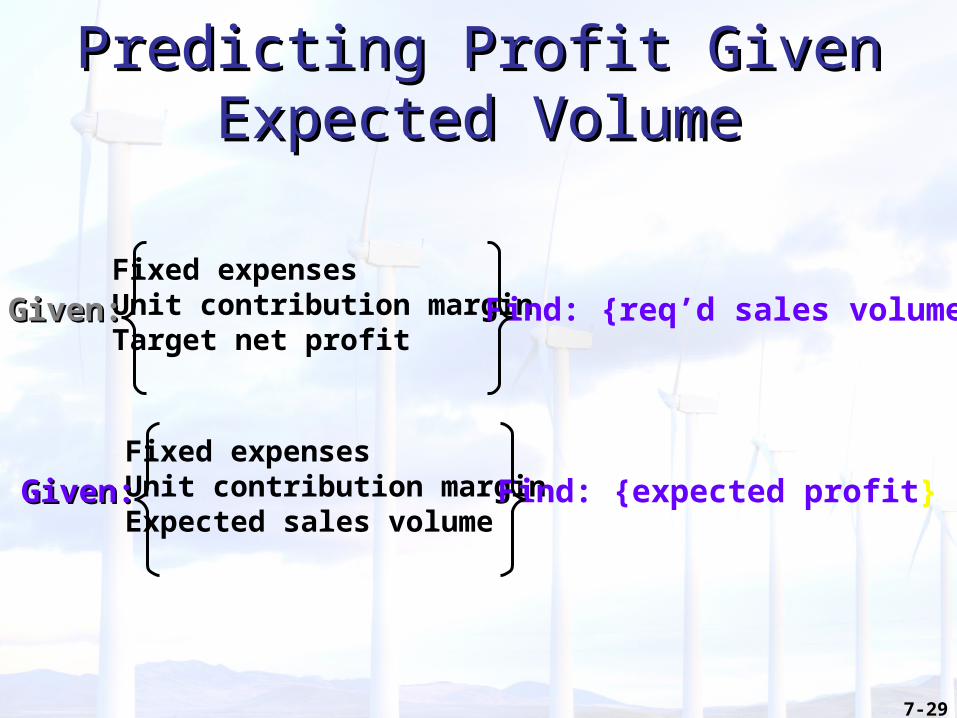
Predicting Profit Given Expected Predicting Profit Given Expected VolumeVolume
Fixed expensesUnit contribution marginTarget net profit
Find: {req’d sales volume}Given:Given:
Fixed expensesUnit contribution marginExpected sales volume
Find: {expected profit}Given:Given:
7-30
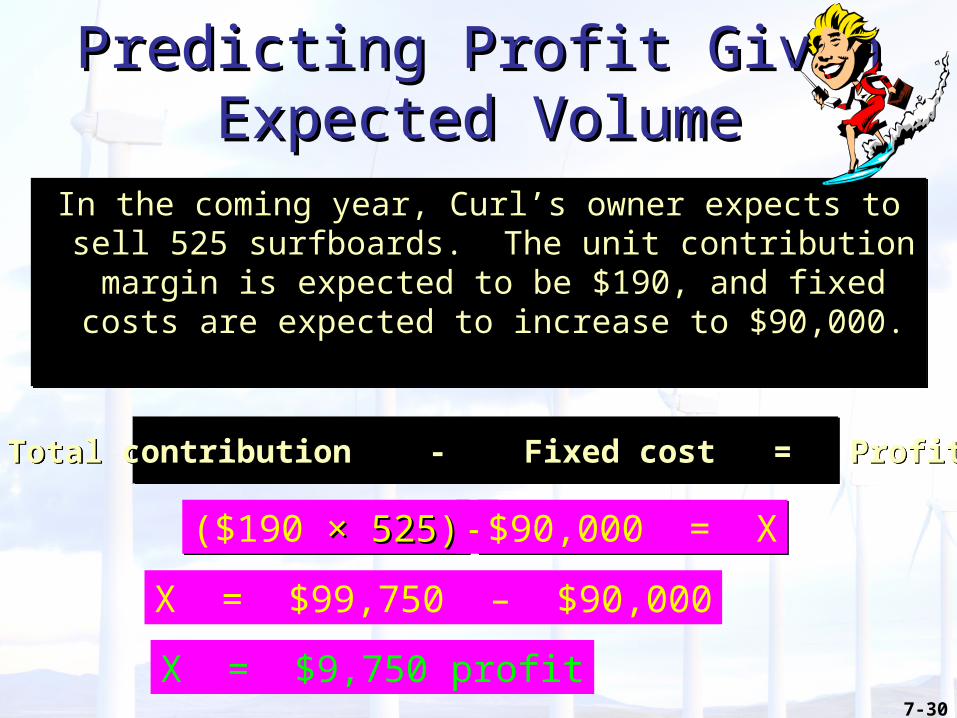
Predicting Profit GivenPredicting Profit GivenExpected VolumeExpected Volume
In the coming year, Curl’s owner expects to sell 525 surfboards. The unit contribution margin is
expected to be $190, and fixed costs are expected to increase to $90,000.
($190 × 525)× 525) – $90,000 = X
X = $9,750 profit
X = $99,750 – $90,000
Total contribution - Fixed cost = Profit

Copyright © 2009 by The McGraw-Hill Companies, Inc. All rights reserved.
McGraw-Hill/Irwin
Learning Objective
5
7-32
CVP Analysis with Multiple CVP Analysis with Multiple ProductsProducts
For a company with more than one product, sales mix is the relative combination in which a
company’s products are sold.Different products have different selling prices,
cost structures, and contribution margins.
Let’s assume Curl sells surfboards and sail boards and see how we deal with break-
even analysis.
7-33
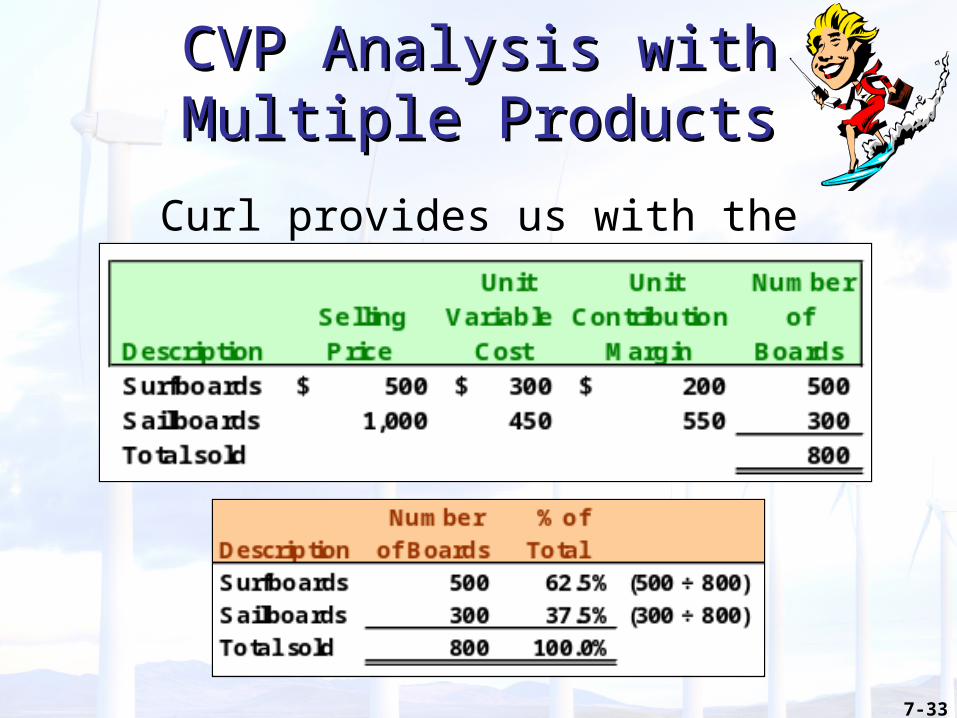
CVP Analysis with Multiple CVP Analysis with Multiple ProductsProducts
Curl provides us with the following information:
7-34
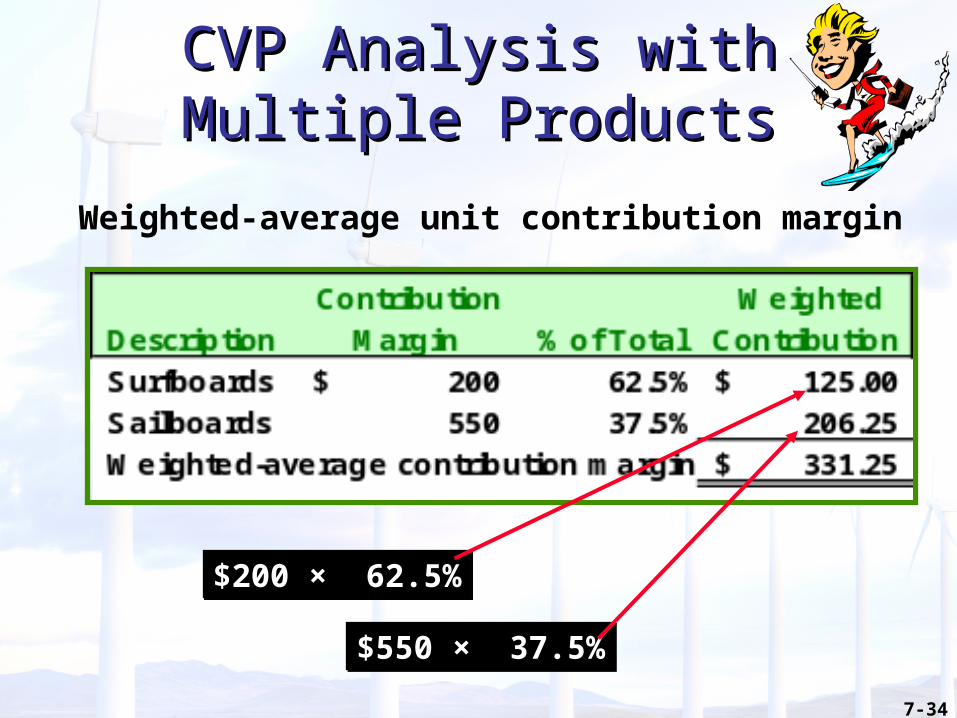
CVP Analysis with Multiple CVP Analysis with Multiple ProductsProducts
Weighted-average unit contribution margin
$200 × 62.5%
$550 × 37.5%
7-35
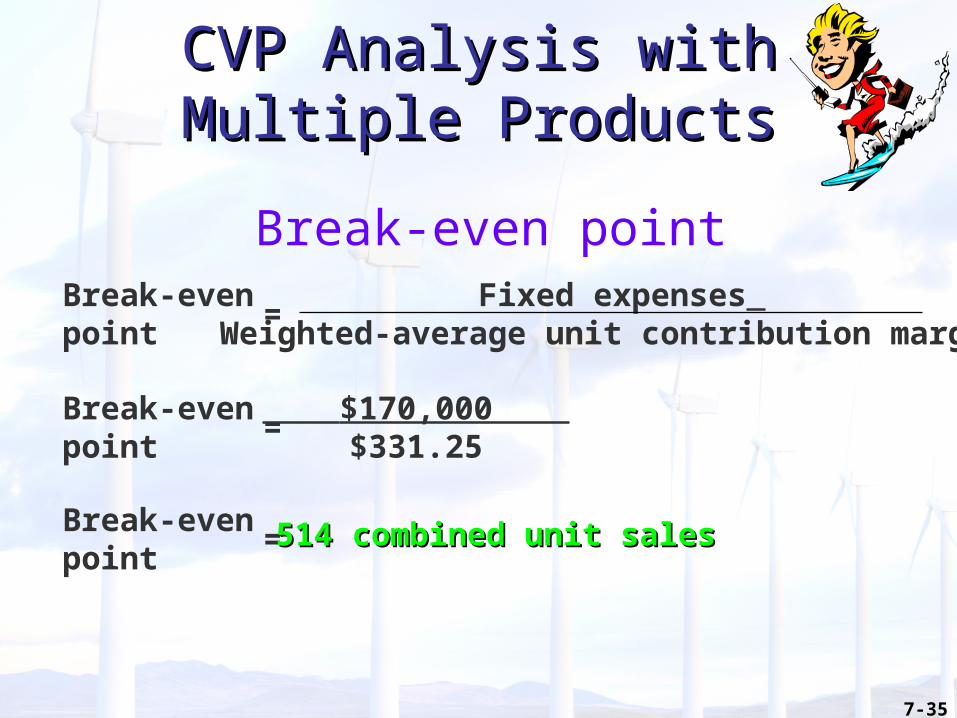
CVP Analysis with Multiple CVP Analysis with Multiple ProductsProducts
Break-even pointBreak-evenpoint = Fixed expenses
Weighted-average unit contribution margin
Break-evenpoint = $170,000
$331.25
Break-evenpoint = 514 combined unit sales514 combined unit sales

7-36
CVP Analysis with Multiple CVP Analysis with Multiple ProductsProducts
Break-even pointBreak-even
point = 514 combined unit sales

Copyright © 2009 by The McGraw-Hill Companies, Inc. All rights reserved.
McGraw-Hill/Irwin
Learning Objective
6
7-38
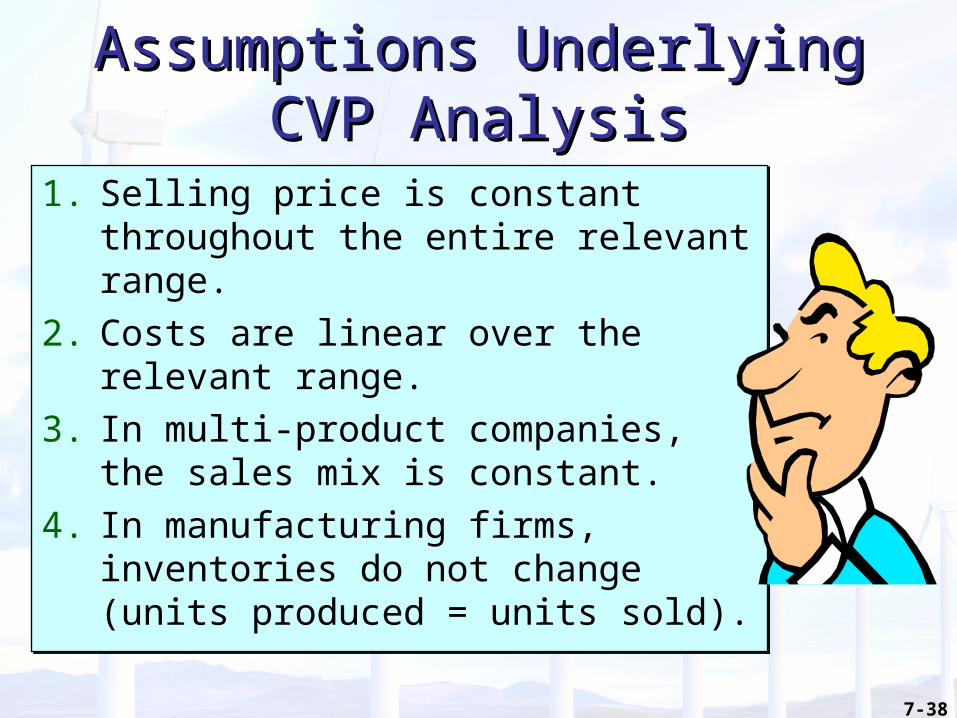
Assumptions UnderlyingAssumptions UnderlyingCVP AnalysisCVP Analysis
1. Selling price is constant throughout the entire relevant range.
2. Costs are linear over the relevant range.
3. In multi-product companies, the sales mix is constant.
4. In manufacturing firms, inventories do not change (units produced = units sold).

Copyright © 2009 by The McGraw-Hill Companies, Inc. All rights reserved.
McGraw-Hill/Irwin
Learning Objective
7
7-40
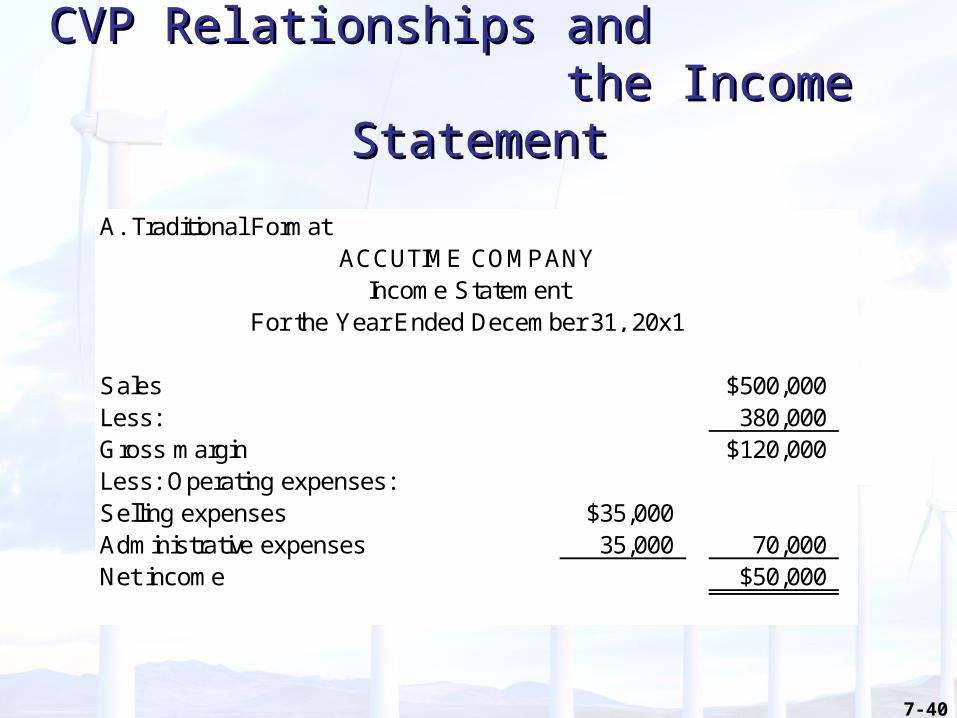
CVP Relationships and CVP Relationships and the Income Statementthe Income Statement
A. Traditional Format
Sales $500,000Less: 380,000Gross margin $120,000Less: Operating expenses:Selling expenses $35,000Administrative expenses 35,000 70,000Net income $50,000
ACCUTIME COMPANYIncome Statement
For the Year Ended December 31, 20x1
7-41
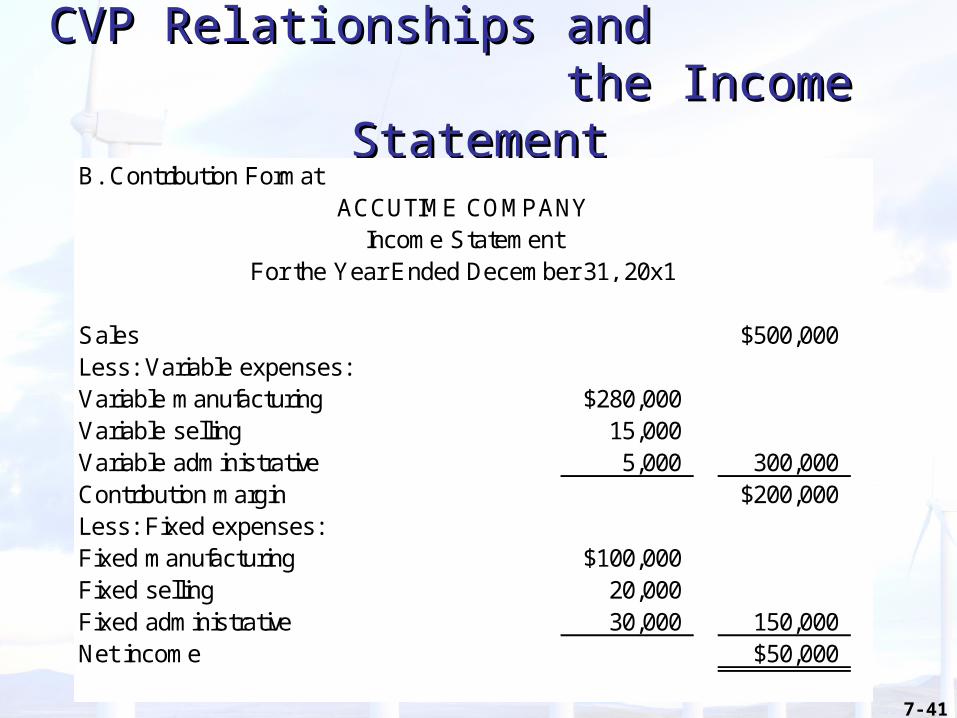
CVP Relationships and CVP Relationships and the Income Statementthe Income Statement
B. Contribution Format
Sales $500,000Less: Variable expenses:Variable manufacturing $280,000Variable selling 15,000Variable administrative 5,000 300,000Contribution margin $200,000Less: Fixed expenses:Fixed manufacturing $100,000Fixed selling 20,000Fixed administrative 30,000 150,000Net income $50,000
Income StatementFor the Year Ended December 31, 20x1
ACCUTIME COMPANY

Copyright © 2009 by The McGraw-Hill Companies, Inc. All rights reserved.
McGraw-Hill/Irwin
Learning Objective
8
7-43
Cost Structure and Operating Cost Structure and Operating LeverageLeverage
• The cost structure of an organization is the relative proportion of its fixed and variable costs.
• Operating leverage is . . .– the extent to which an organization uses fixed
costs in its cost structure.– greatest in companies that have a high
proportion of fixed costs in relation to variable costs.
7-44
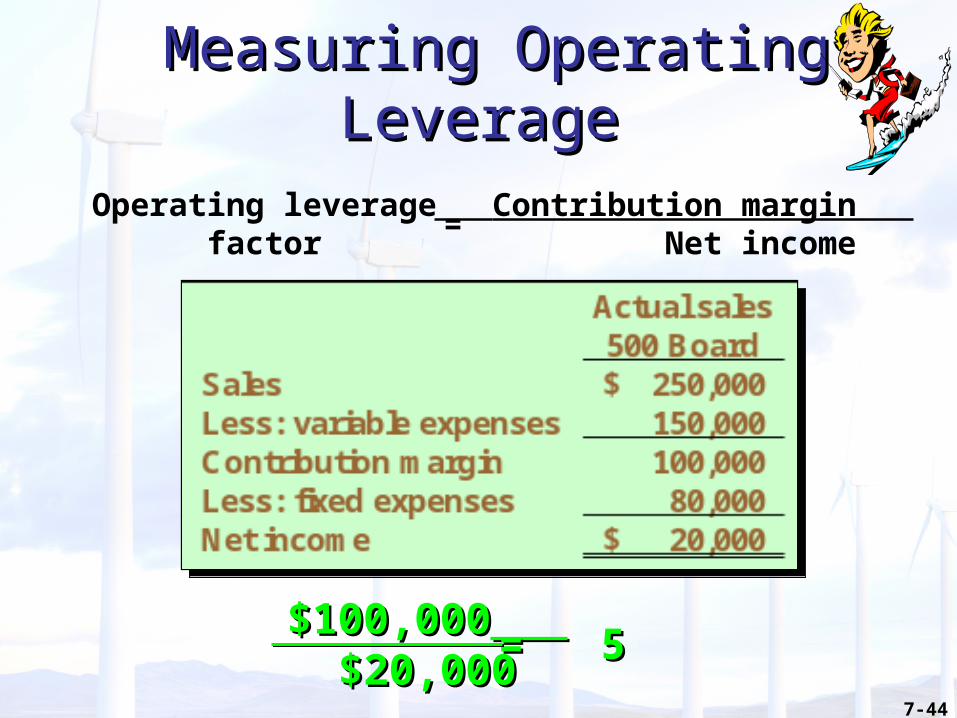
Measuring Operating LeverageMeasuring Operating Leverage
Contribution margin Net income
Operating leveragefactor =
$100,000$100,000 $20,000$20,000 = 5= 5
7-45
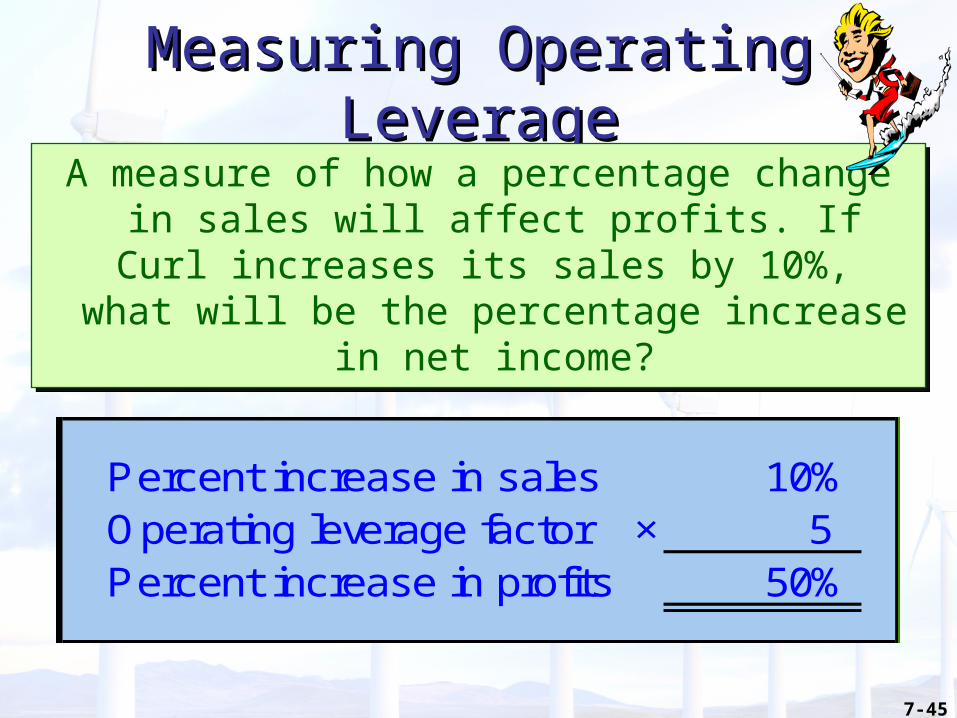
Measuring Operating LeverageMeasuring Operating LeverageA measure of how a percentage change in sales will affect profits. If Curl increases its sales by 10%, what will be the percentage
increase in net income?
Percent increase in sales 10%Operating leverage factor × 5Percent increase in profits 50%
7-46
Measuring Operating LeverageMeasuring Operating Leverage
A firm with proportionately high fixed costs has relatively high operating leverage On the other hand, a firm with high operating leverage has a relatively high break-even point.

Copyright © 2009 by The McGraw-Hill Companies, Inc. All rights reserved.
McGraw-Hill/Irwin
Learning Objective
9
7-48
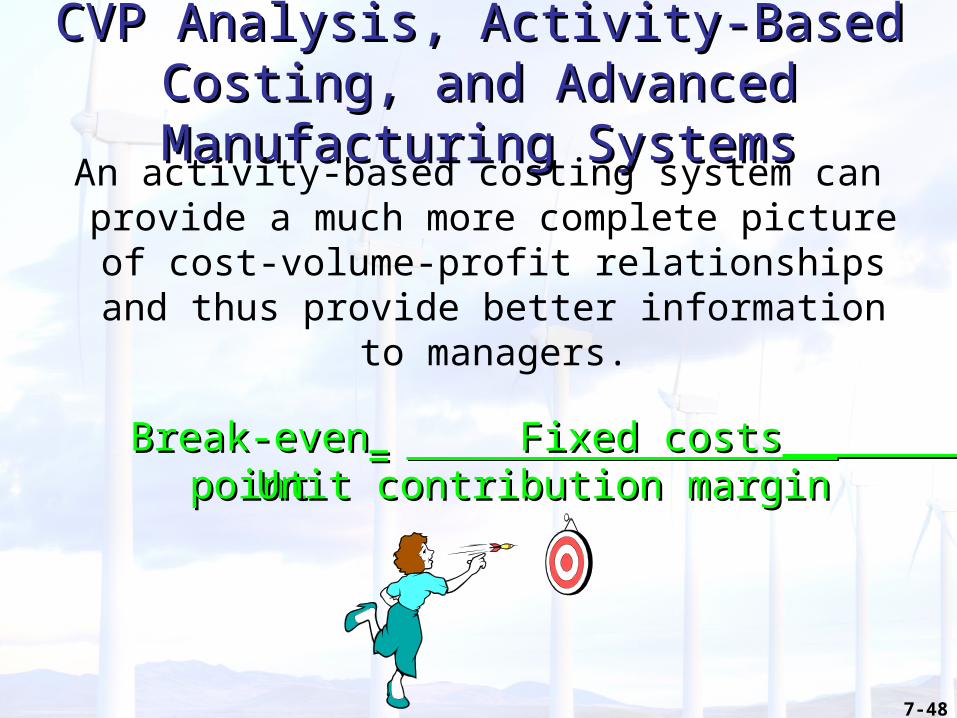
CVP Analysis, Activity-Based Costing, CVP Analysis, Activity-Based Costing, and Advanced Manufacturing Systemsand Advanced Manufacturing SystemsAn activity-based costing system can provide
a much more complete picture of cost-volume-profit relationships and thus provide
better information to managers.
Break-evenBreak-evenpointpoint
== Fixed costsFixed costs Unit contribution marginUnit contribution margin

Copyright © 2009 by The McGraw-Hill Companies, Inc. All rights reserved.
McGraw-Hill/Irwin
Learning Objective
10
7-50
Overhead costs like setup, inspection, and material handling are fixed with respect to sales volume, but they are not fixed with respect to other cost
drivers.
This is the fundamental distinction between a traditional CVP analysis and an activity-based
costing CVP analysis.
A Move Toward JIT andA Move Toward JIT andFlexible ManufacturingFlexible Manufacturing

Copyright © 2009 by The McGraw-Hill Companies, Inc. All rights reserved.
McGraw-Hill/Irwin
Learning Objective
11
7-52
Effect of Income TaxesEffect of Income Taxes
Target after-tax net income 1 - t
=Before-tax net income
Income taxes affect a company’s CVP relationships. To earn a
particular after-tax net income, a greater before-tax income will be
required.

7-53
End of Chapter 7End of Chapter 7
We madeWe madeit!it!


