
Cost shifting and the freezing of corporate pension plans Josh Rauh Stanford University and NBER...
32
Cost shifting and the freezing of corporate pension plans Josh Rauh Stanford University and NBER Irina Stefanescu Federal Reserve Board Steve Zeldes Columbia University and NBER The views expressed here are those of the authors and do not necessarily represent those of the Federal Reserve Board.
-
Upload
ronald-walters -
Category
Documents
-
view
214 -
download
0
Transcript of Cost shifting and the freezing of corporate pension plans Josh Rauh Stanford University and NBER...
Cost shifting and the freezing of corporate pension plans
Josh RauhStanford University and NBER
Irina StefanescuFederal Reserve Board
Steve ZeldesColumbia University and NBER
The views expressed here are those of the authors and do not necessarily represent those of the Federal Reserve Board.

Retirement landscape (corporate sector)
Source: 2015 Investment company Institute report
$ trillion assets
1995 2000 2009 2012 2014
Defined Benefit Plans (DB)
Private employers 1.5 2.0 2.2 2.7 3.2
Defined Contribution Plans (DC)
Private employers 1.5 2.2 2.7 3.5 4.6
DB percentage 50% 48% 45% 44% 41%

Institutional background (DBPs):
DBPs are governed by ERISA (1974);
Sponsors make tax-deductible contributions to the pension fund, manage the pension assets and need to comply to specific funding requirements;
Sponsors promise a fixed retirement income to employees (independent of the performance of the pension assets), based on salary and service.
Typically, participants receive at retirement (time r), an annual pension benefit equal to: , where k= benefit factor (for ex. 2%), N= years of service, Y salary at retirement.
Bear all investment risk (and longevity risk);

Shift Away From DBPsHOW:
Majority of new firms adopt DC arrangements. Standard terminations (mostly by small, well-funded employer plans); Distress terminations (few, but highly publicized). Freezes :
(a) “hard freeze (b) “soft freeze”.
Conversions to cash balance plans (CBPs) – as an alternative or predecessor to freezing.
WHY: (some of the most cited reasons) Increase in cost / risks of DB: investment, interest rate risk, longevity risk; Volatility of mandatory contributions and changes in mandatory funding
requirements (PPA 2006 and FASB 158); Competitive pressures, employees’ demand for portability, etc.

This PaperExamines the cost dimension and studies the prospective benefit accrual patterns of defined benefit plans that freeze.
1. Do firms that freeze their DB plans have larger potential cost savings in the form of counterfactual DB accruals than comparable firms that do not?
Answer: Yes. Firms that froze would have faced on average at least 50% higher accruals as a share of firm assets than comparable firms that do not. The probability that a firm freezes a pension plan is positively related to the value of new accruals as a share of firm assets.
2. How much annual cost saving is realized by firms that freeze, taking into account both the DB accruals that they avoid and the increases in DC contributions that they make?
Answer: Firms are estimated to save around 3% of payroll per year. The savings amount to around 3% of total book assets for a 10-year horizon.
3. Which demographic groups generate most savings? Answer: Realized savings are largest for workers aged 50-65 and smallest for workers aged 20-34.

Theoretical considerations
In an efficient market, the worker’s compensation would be equal to the marginal product of labor (MPL) and the freezing of pension benefits would not results in cost savings or the reduction in compensation.
However, if due to labor market frictions or implicit contracts some workers are receiving compensation in excess of MPL or outside wage opportunity, cost savings could be achieved.
Alternatively, if workers value DB benefits less than it costs the firm to provide them , there would be a surplus over which employers and employees can bargain and both parties would be better off.
Implications of the results
Our findings that employers can achieve substantial savings is consistent with the last two possibilities:
(1) A gap between compensation and MPL due to: search costs, firing costs, downward wage rigidities or implicit contracts;
(2) Employees do not value DB benefits as much as they value a DC plan (see also evidence on life annuities) or they value the flexibility to change jobs.
Our results suggest that savings are achieved on older workers because of (1) – see the demographic evidence- and on younger workers because of (2) – as the Cash Balance Plans freezes create savings as well.

Related literatureModeling the differential risk characteristics between DB and DC plans:
Bodie, Marcus and Merton (1988), Samwick and Skinner (2004), Poterba et al. (2007);
DB pension accruals and their effects on labor market behavior: Lazear (1983) , Mitchell and Fields (1984), Lazear and Moore (1988) and Stock and Wise (1990);
Modeling the macroeconomic forces behind the shift: Kruse (1995) and Ippolito and Thomson (2000). Several papers look at the freeze sponsor financial characteristics (Munnell and
Soto, 2007; Beaudoin, 2010), the subsequent impact on shareholder value (Rubin, 2007; Milevsky and Song, 2008; McFarland, Pang, and Warshawsky, 2009), decrease in liquidity pressures (Phan and Hegde, 2012) or risk taking activities (Choy, Lin and Officer, 2014)
Most of these studies came before the CBPs conversions and the wave of pension freezes of plans sponsored by large employers (ex. IBM, Verizon, GM, HP, Sears).
Our contribution to the literature
Our data allows us to estimate the potential cost savings that could be generated by freezes not only at the plan level but also by age/service groups.
We can compare prospective savings of plans that are actually frozen with prospective savings of plans that have not been frozen.
We can examine any wage or alternative pension arrangements intended to offset the lost DB benefits in the period immediately following the freeze.
We can evaluate how much employees would have to value the structural features of DC plans in order to be indifferent between the two arrangements.

Data and Methodology
Primary source: Form 5500 and its paper attachments. Filed annually with IRS and DOL, at plan level, from 1999 to 2010.
Combined with COMPUSTAT (to identify the sponsors). Plan level filters: more than 1000 employees, availability of
age-service-salary table.
Final sample: 8,484 plan-years
For each plan-year we hand-collect the following table:

Example: Xerox Corporation Retirement Income Guarantee Plan
Age GroupService Group
<1 1-4 5-9 10-14 15-19 20-24 25-29 30-34 35-39 40+<25 157 297 38
$37,272 $47,783 $46,381 25-29 290 1,877 1,113 28
$45,609 $62,874 $64,188 $64,280 30-34 268 2,037 2,704 678 69
$48,594 $70,739 $71,797 $73,889 $70,838 35-39 221 1,367 2,094 1,437 1,369 70
$49,442 $74,445 $75,538 $82,468 $83,476 $77,843 40-44 205 1,047 1,624 1,049 2,007 2,373 355
$53,620 $75,557 $77,173 $85,723 $90,267 $85,715 $78,478 45-49 145 638 1,092 690 1,289 3,410 1,999 406
$49,954 $71,965 $75,501 $83,525 $91,437 $90,855 $87,143 $86,384 50-54 103 428 651 432 806 1,060 1,224 1,696 114
$51,393 $72,208 $73,844 $80,177 $87,100 $89,129 $91,712 $93,062 $88,210 55-59 45 248 351 239 286 271 281 564 312 21
$51,026 $71,141 $77,044 $75,080 $82,843 $87,265 $91,771 $93,768 $91,462 $93,106 60-64 13 76 120 66 50 54 52 73 96 36
$66,371 $73,213 $68,061 $77,637 $70,217 $66,673 $87,677 $86,666 $86,447 65-69 3 12 15 5 4 3 3 7 5 14
70+ 1 1 6 1 2 1 2

Plan freezes
2002 2003 2004 2005 2006 2007 2008 2009 2010 20110
5
10
15
20
25
30
35
DBP freezes DBP freezes (with a CBP feature)
First we identify all ‘hard freezes’ reported in 5500, then manually checked against news, annual reports, the history of the plan: 213 plan freezes. Of these 175 plans report age-service matrices before the freeze (123 traditional DBPs and 52 with a cash balance feature).

Summary statistics Traditional DBPs Freezes
(N=411) Non-Freezes(N=5,022)
Difference (freeze-non-freeze)
mean median mean median mean medianSponsor levelTotal assets (sponsor) ($mil) 22,545 2,814 36,932 6,664 -14,387*** -3,850***Market leverage 0.34 0.28 0.30 0.25 0.04** 0.03**Interest coverage 7.64 4.35 10.23 5.16 -2.59** -0.81***EBITDA/ Sales 0.15 0.12 0.17 0.14 -0.02*** -0.02***
Plan levelABO ($mil) 397 98 713 189 -316.00*** -91.50***ABO/ Total Assets (sponsor) 10.6% 4.8% 8.1% 3.8% 0.02*** 1.04%***ABO / Payroll 179.7% 100.5% 232.8% 152.0% -53.0%*** -51.5%***Payroll ($mil) 232 97 333 116 -101.00*** -19.50***Payroll/ Total assets (sponsor) 7.8% 5.0% 4.8% 2.4% 3.0%*** 2.6%***Salary per Active Participant 51,904 49,641 58,578 57,123 -6,673*** -7,482***Active Participants (%) 55.7% 56.6% 50.2% 49.3% 5.5%*** 7.3%***Total Participants 9,522 3,671 13,810 4,797 -4,288*** -1,126***Funding (%) -6.2% -9.1% 2.9% -2.2% -9.1%*** -6.9%***Service Cost/ Payroll 5.67% 4.7% 6.57% 5.6% -0.90%** -0.81%**Service Cost/ABO 5.49% 4.6% 4.47% 3.6% 1.02%*** 0.98%***
ABO= accumulated benefit obligation, or the pension obligation
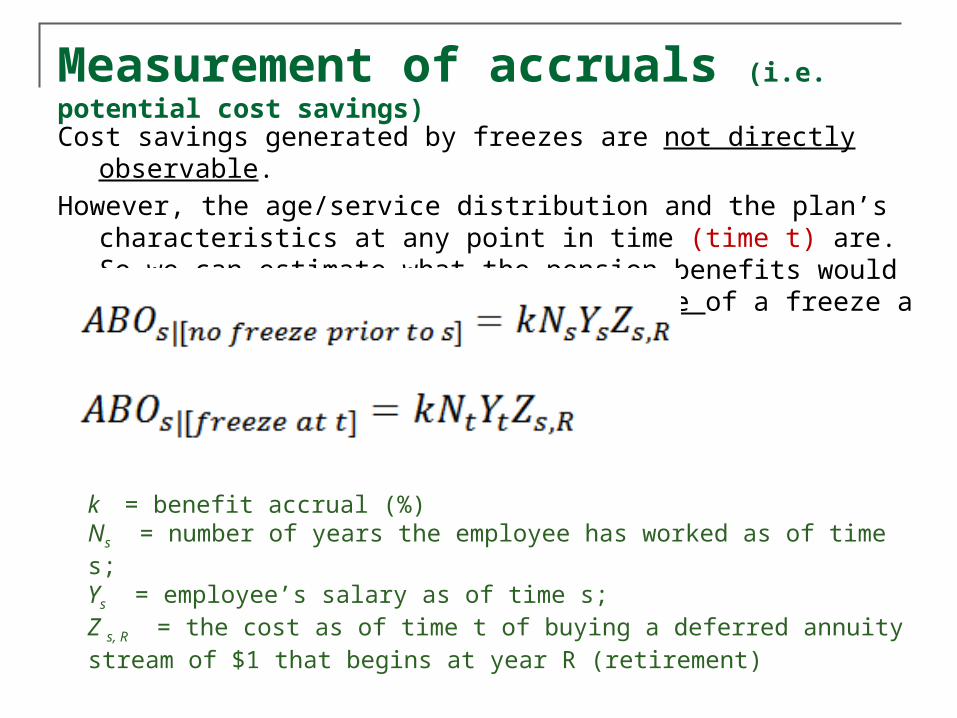
Cost savings generated by freezes are not directly observable.
However, the age/service distribution and the plan’s characteristics at any point in time (time t) are. So we can estimate what the pension benefits would be in the absence and in the presence of a freeze a few years later (time s, s>t).
Measurement of accruals (i.e. potential cost savings)
k = benefit accrual (%) Ns = number of years the employee has worked as of time s; Ys = employee’s salary as of time s; Z s, R = the cost as of time t of buying a deferred annuity stream of $1 that begins at year R (retirement)
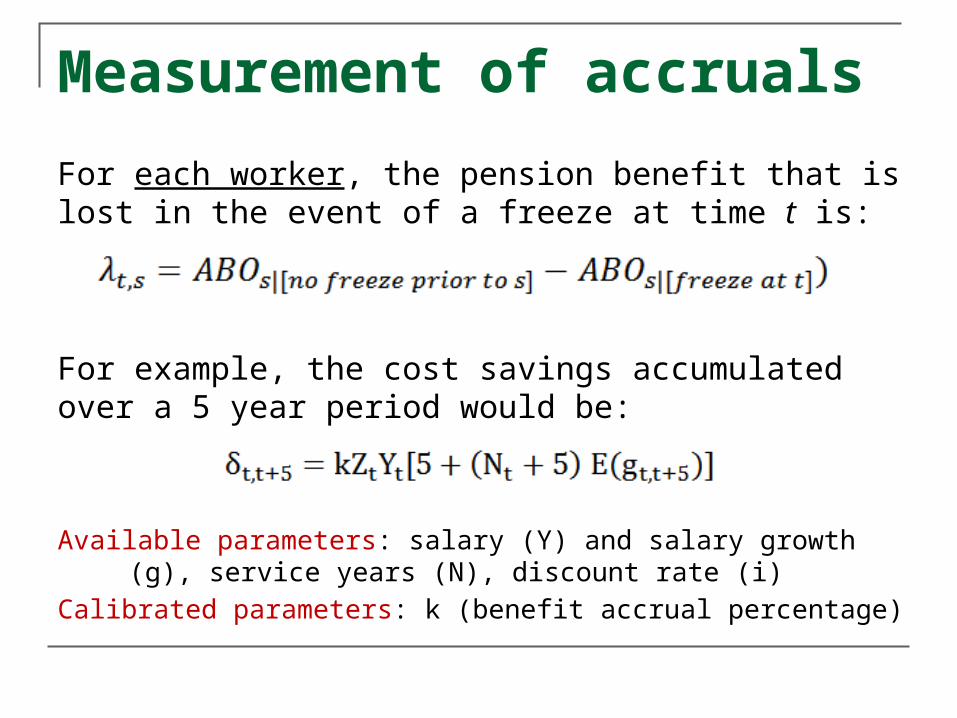
Measurement of accruals
For each worker, the pension benefit that is lost in the event of a freeze at time t is:
For example, the cost savings accumulated over a 5 year period would be:
Available parameters: salary (Y) and salary growth (g), service years (N), discount rate (i)
Calibrated parameters: k (benefit accrual percentage)

ENTRY and EXIT: estimated from plan time series
Age GroupService Group
<1 1-4 5-9 10-14 15-19 20-24 25-29 30-34 35-39 40+
<25 157 297 38
25-29 290 1,877 1,113 28
30-34 268 2,037 2,704 678 69
35-39 221 1,367 2,094 1,437 1,369 70
40-44 205 1,047 1,624 1,049 2,007 2,373 355
45-49 145 638 1,092 690 1,289 3,410 1,999 406
50-54 103 428 651 432 806 1,060 1,224 1,696 114
55-59 45 248 351 239 286 271 281 564 312 21
60-64 13 76 120 66 50 54 52 73 96 36
65-69 3 12 15 5 4 3 3 7 5 14
70+ 1 1 6 1 2 1 2

Calibration (k= benefit factor)
FreezesNon-
FreezesBenefit Factor 1.33% 1.23%
Discount rate 6.15% 6.26%
Salary Growth 4.45% 4.36%
Note: the ks we estimate also capture a range of features that affect accrual rates: COLAs, retirement ages, vesting provisions.
We use past reported service cost (i.e. accruals at the plan level) and the benefit formula to extract the benefit factor.
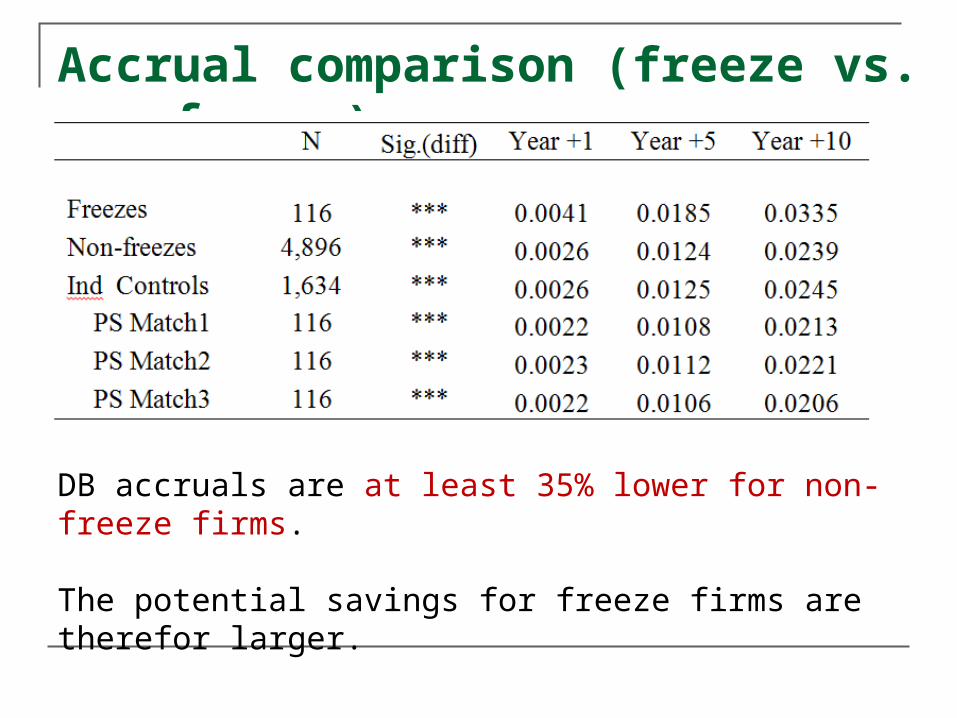
Accrual comparison (freeze vs. non-freeze)
DB accruals are at least 35% lower for non-freeze firms.
The potential savings for freeze firms are therefor larger.

Projected benefit accruals(freeze and non-freeze plans)
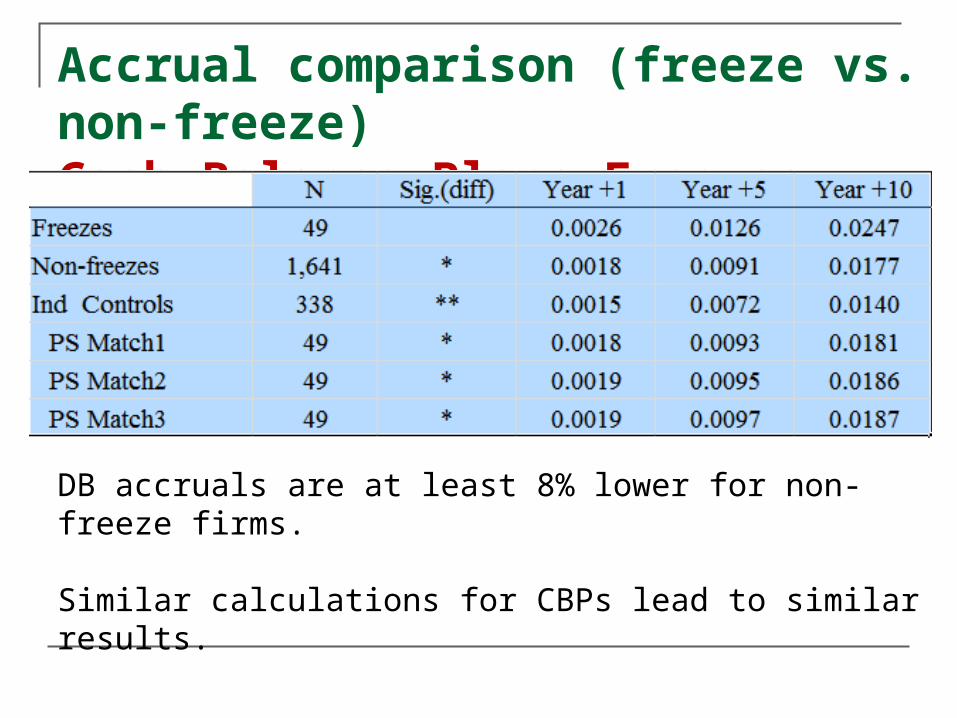
Accrual comparison (freeze vs. non-freeze)Cash Balance Plans Freezes
DB accruals are at least 8% lower for non-freeze firms.
Similar calculations for CBPs lead to similar results.

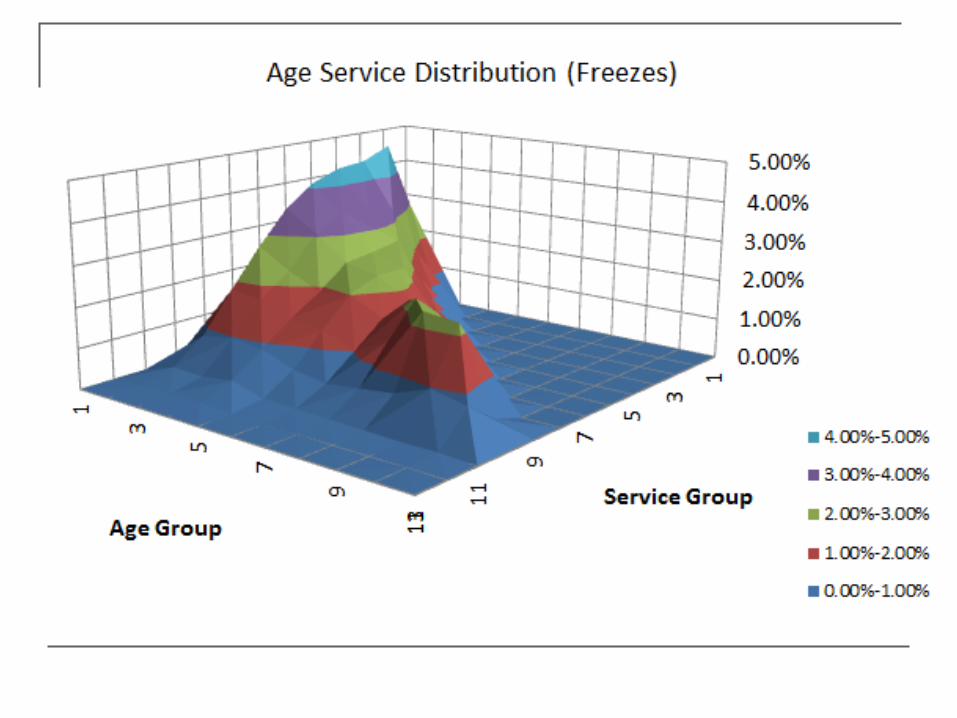
Where do costs savings come from? Higher k + higher g + lower i + larger payrolls +Age/Service Distributions
Service group


Benefit accruals by age groups0
.1.2
.3.4
1 2 3 4 5 6 7 8 9 10Years ahead
Age group: 20-34
Age group: 35-49
Age group: 50-65
Benefit Accrual/ Total Payroll (Freeze Sponsors)
0.0
1.0
2.0
3.0
4
1 2 3 4 5 6 7 8 9 10Years ahead
Age group: 20-34
Age group: 35-49
Age group: 50-65
Benefit Accrual / Total Assets (Freeze Sponsors)
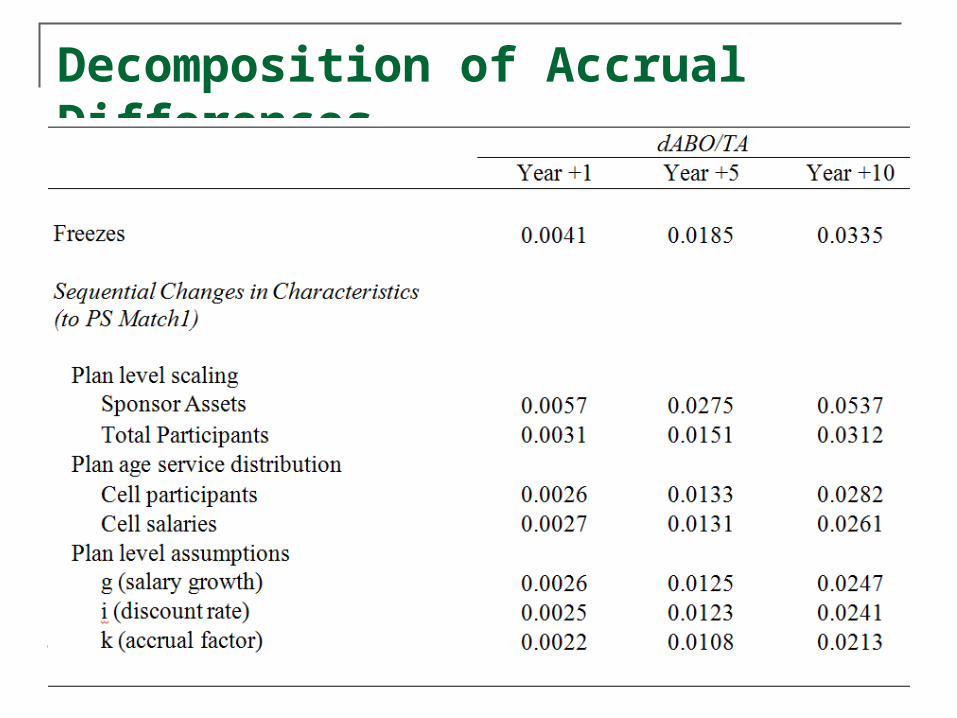
Decomposition of Accrual Differences

Do cost savings motivate freezes?

Estimated cost savings (sponsor level)
Contributions to 401k plans are extracted from Form5500 (Schedule H) and aggregated at the sponsor level.
d401(k) is the additional contribution to 401(k) plans that is attributed to the accounts of DB participants now included into these plans.
d401(k)= post-freeze contribution - pre-freeze contribution x (1+g)
Difference (DB accrual- extra DC contribution)
= cost savings realized (in the absence of salary offsets)

Estimated cost savings (sponsor level)
Break even condition = the annualized, compounded additional yearly pre-tax compensation as a
percentage of payroll that would be required as a supplement to the post-freeze benefit;
= shortfall from the perspective of the employee;
= cost saving from the perspective of the firm.
The workers would have to value the structure, choice, flexibility or portability of DC plans by 2.7-3.6% of payroll to experience welfare gains from freezes.

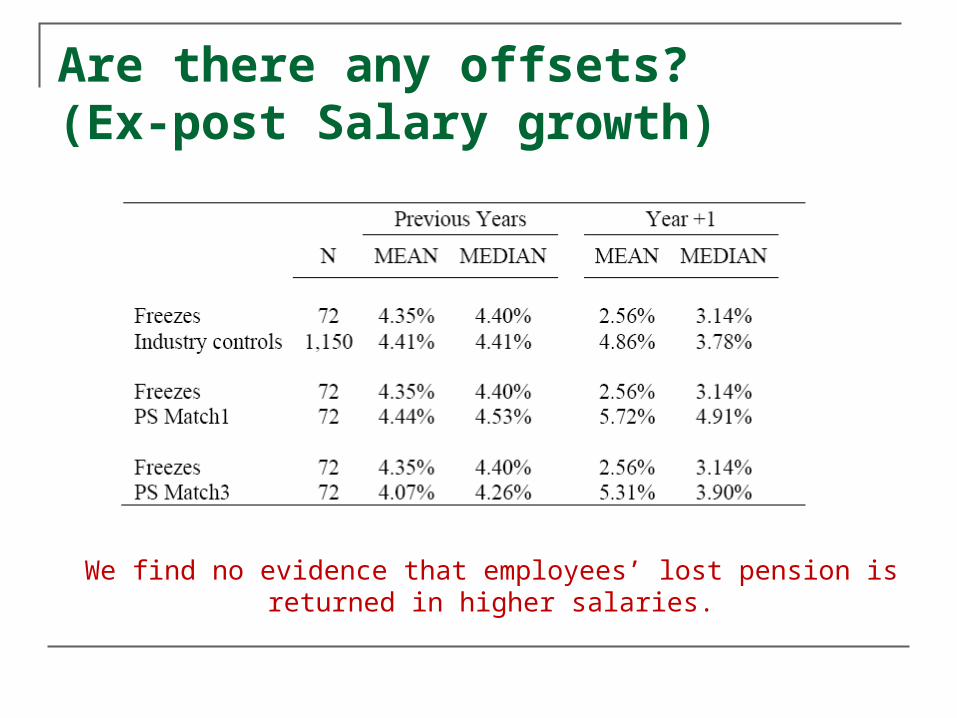
Are there any offsets? (Ex-post Salary growth)
We find no evidence that employees’ lost pension is returned in higher salaries.

Conclusions
Firms that have frozen pension plans have reduced their costs of providing retirement benefits to workers even net of increases to 401(k) contributions over horizons ranging from 1-10 years: 2.7-3.6% of payroll per year or 3.7% of total firm assets for a 10-year horizon.
Employees of these firms, on the other hand, have seen decreases in the net present value of their retirement benefits. The foregone accruals and net cost effects are generally larger for older employees.
The probability that a firm freezes a pension plan is positively related to the value of new accruals as a share of firm assets.
The results are consistent with firms reneging on implicit contracts and also with the view that employees value less the DB plans relative to equal DC cost arrangements.


![Zeldes et al (1).ppt [Kompatibilitätsmodus]](https://static.fdocuments.net/doc/165x107/625773a7df9cdb215f522de4/zeldes-et-al-1ppt-kompatibilittsmodus.jpg)


