Cost Savings and Business Benefits - Nintexinfo.nintex.com/rs/nintex/images/File -...
26
A Forrester Total Economic Impact™ Study Commissioned By Nintex Project Director: Sarah Musto October 2014 The Total Economic Impact™ of the Nintex Workflow Platform Cost Savings and Business Benefits
Transcript of Cost Savings and Business Benefits - Nintexinfo.nintex.com/rs/nintex/images/File -...

A Forrester Total Economic
Impact™ Study
Commissioned By
Nintex
Project Director:
Sarah Musto
October 2014
The Total Economic Impact™ of the Nintex Workflow Platform Cost Savings and Business Benefits

Table Of Contents
Executive Summary .................................................................................... 3
Disclosures .................................................................................................. 4
TEI Framework and Methodology ............................................................. 5
Analysis ........................................................................................................ 6
Financial Summary ................................................................................... 21
Nintex Workflow Platform: Overview ...................................................... 22
Appendix A: Composite Organization Description .............................. 23
Appendix B: Total Economic Impact™ Overview ................................. 24
Appendix C: Glossary ............................................................................... 25
Appendix D: Supplemental Material ....................................................... 26
Appendix E: Endnotes .............................................................................. 26
ABOUT FORRESTER CONSULTING
Forrester Consulting provides independent and objective research-based
consulting to help leaders succeed in their organizations. Ranging in scope from a
short strategy session to custom projects, Forrester’s Consulting services connect
you directly with research analysts who apply expert insight to your specific
business challenges. For more information, visit forrester.com/consulting.
© 2014, Forrester Research, Inc. All rights reserved. Unauthorized reproduction is strictly prohibited.
Information is based on best available resources. Opinions reflect judgment at the time and are subject to change. Forrester®, Technographics®, Forrester Wave, RoleView, TechRadar, and Total Economic Impact are trademarks of Forrester Research, Inc. All other trademarks are the property of their respective
companies. For additional information, go to www.forrester.com.

3
Executive Summary
Nintex commissioned Forrester Research to conduct a Total
Economic Impact™ (TEI) study and examine the potential
return on investment (ROI) that enterprises may realize by
deploying Nintex’s workflow platform. The purpose of this
study is to provide readers with a framework to evaluate the
potential financial impact of using the Nintex workflow platform
within their organizations.
To better understand the benefits, costs, and risks associated
with the implementation of the Nintex workflow platform, which we will refer to as the Platform, Forrester interviewed several
customers with multiple years of experience using Nintex Workflow and Nintex Forms. These customers recognize the value
inherent in automating processes. Their colleagues and customers are working both in offices and on mobile devices and
are spread across many countries. Content necessary to collaborate and make business decisions is stored in many
applications across these devices. They have some well-defined processes, but the steps leading up to these processes or
to connect closely related processes are loosely defined and manual. With Nintex Workflow, customers can automate their
processes and create workflows that connect their people, processes, and content. With Nintex Forms, Nintex provides an
easy way to collect data from colleagues and customers within the workflow. Using Nintex Mobile, customers can extend
these workflows to users who are on the go. With Nintex Connectors, customers can easily integrate cloud services and line-
of-business applications into their workflows.
Prior to using the Platform, these customers were mostly relying on custom code to automate processes. However, it was
difficult and time-consuming to build workflows, and many processes remained manual (e.g. paper-based, email, excel files)
while a backlog of requests for automation grew. This left customers frustrated with process inefficiencies and the inability to
automate faster. With the Platform, customers are able to automate processes in pace with demand, connect the right
people and data in each process, and easily make changes to workflows as processes change. This results in increased
productivity for end users and IT, reduced costs associated with automation, better collaboration, and higher quality of work.
NINTEX ENABLES INCREASED PRODUCTIVITY AND SIMPLER WORKFLOW MANAGEMENT
Our interviews with five existing customers and subsequent financial analysis found that a composite organization, which we
will refer to as the Organization, based on these interviewed organizations experienced the risk-adjusted ROI1, benefits, and
costs shown in Figure 1. See Appendix A for a description of the Organization.
The analysis points to benefits of just over $1.6 million over three years versus costs of $580,000, adding up to a net present
value (NPV) of $1,020,045.
FIGURE 1
Financial Summary Showing Three-Year Risk-Adjusted Results
ROI: 176%
NPV: $1,020,000
Payback: 10.5 months
Productivity per user: ���� 8% to 15%
Source: Forrester Research, Inc.
“With Nintex, we now have the time to not only
deliver workflows, but also to spend time
analyzing the process and to make sure that we
are delivering something in a smarter way.”
— Workflow architect
4
› Benefits. The Organization experienced the following risk-adjusted benefits that represent those experienced by the
interviewed companies:
• Improved productivity for business end users results in benefits of $622,000 in Year 3. Business end users
save on average 1 hour for complex processes2 and 15 minutes for simple processes
2 automated with Nintex.
• Improved productivity for IT full-time equivalents (FTEs) provides $77,000 to $91,000 in benefits each year.
The Organization was able to automate select processes used by the IT organization, which saved frequent users of
these processes an average of 3 hours per week.
• Avoided cost from using Nintex versus relying on custom code. The Organization previously used custom
code to automate processes. To replicate the automation achieved with the Platform, the Organization would have
spent on average $77,000 per year for internal resource time.
› Costs. The Organization experienced the following risk-adjusted costs:
• Licensing fees for the Enterprise Edition of the Nintex workflow platform. The Organization paid $64,000
upfront for the Enterprise Edition and paid $22,400 every year for software assurance and premium support.
• Professional services costs for assistance with initial workflows. The Organization engaged with a partner for
help in the development and deployment of the first six complex workflows. This resulted in a $300,000 cost.
• Resource costs for an architect and support staff to manage Nintex. One FTE is responsible for developing
Nintex workflows for the Organization, and a team of three FTEs are responsible for implementation and ongoing
support.
• Business end user resource cost for time spent on workflows. Business end users spend 2 hours per simple
workflow and 20 hours per complex workflow to assist in validation and testing. Three business specialists are
trained to help develop simple workflows for end users.
• Training costs of $5,000 upfront. This is to provide training on the Platform for the team of three IT FTEs and the
three business specialists
Disclosures
The reader should be aware of the following:
› The study is commissioned by Nintex and delivered by Forrester Consulting. It is not meant to be used as a competitive
analysis.
› Forrester makes no assumptions as to the potential ROI that other organizations will receive. Forrester strongly advises
that readers use their own estimates within the framework provided in the report to determine the appropriateness of an
investment in the Nintex workflow platform.
› Nintex reviewed and provided feedback to Forrester, but Forrester maintains editorial control over the study and its
findings and does not accept changes to the study that contradict Forrester's findings or obscure the meaning of the study.
› Nintex provided the customer names for the interviews but did not participate in the interviews.
› All financial data is in US dollars.
5
TEI Framework and Methodology
INTRODUCTION
From the information provided in the interviews, Forrester has constructed a Total Economic Impact (TEI) framework for
those organizations considering implementing the Nintex workflow platform. The objective of the framework is to identify the
cost, benefit, flexibility, and risk factors that affect the investment decision.
APPROACH AND METHODOLOGY
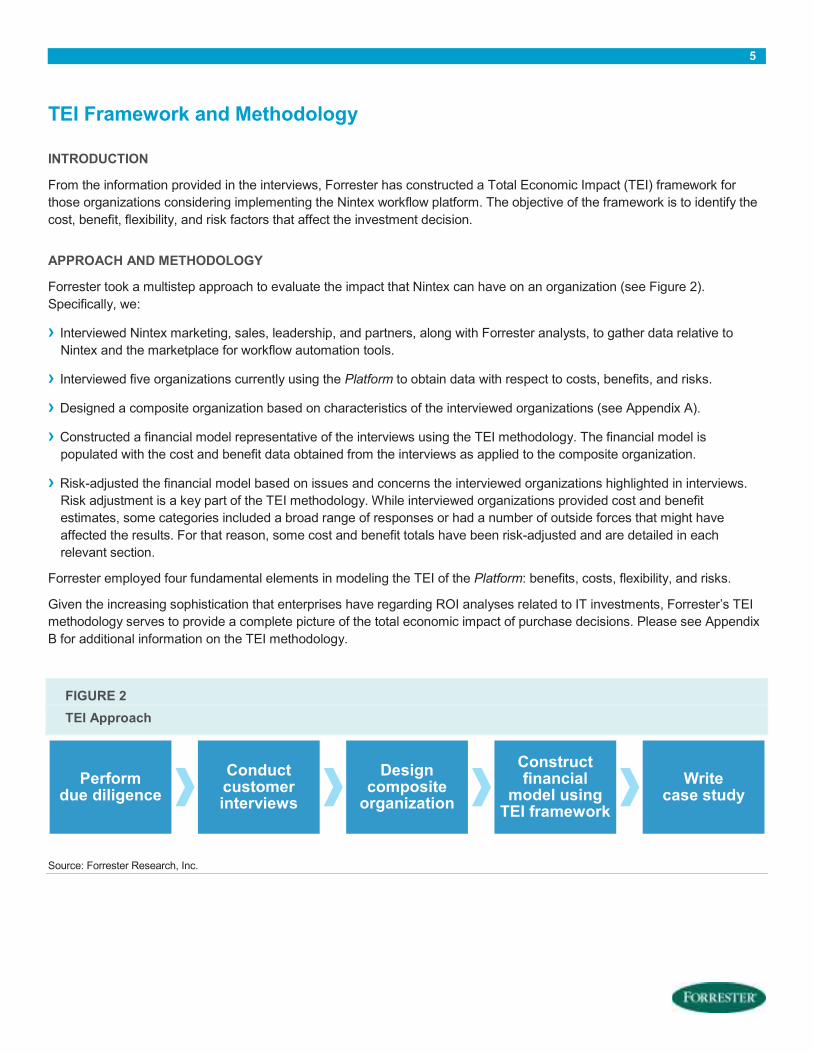
Forrester took a multistep approach to evaluate the impact that Nintex can have on an organization (see Figure 2).
Specifically, we:
› Interviewed Nintex marketing, sales, leadership, and partners, along with Forrester analysts, to gather data relative to
Nintex and the marketplace for workflow automation tools.
› Interviewed five organizations currently using the Platform to obtain data with respect to costs, benefits, and risks.
› Designed a composite organization based on characteristics of the interviewed organizations (see Appendix A).
› Constructed a financial model representative of the interviews using the TEI methodology. The financial model is
populated with the cost and benefit data obtained from the interviews as applied to the composite organization.
› Risk-adjusted the financial model based on issues and concerns the interviewed organizations highlighted in interviews.
Risk adjustment is a key part of the TEI methodology. While interviewed organizations provided cost and benefit
estimates, some categories included a broad range of responses or had a number of outside forces that might have
affected the results. For that reason, some cost and benefit totals have been risk-adjusted and are detailed in each
relevant section.
Forrester employed four fundamental elements in modeling the TEI of the Platform: benefits, costs, flexibility, and risks.
Given the increasing sophistication that enterprises have regarding ROI analyses related to IT investments, Forrester’s TEI
methodology serves to provide a complete picture of the total economic impact of purchase decisions. Please see Appendix
B for additional information on the TEI methodology.
FIGURE 2
TEI Approach
Source: Forrester Research, Inc.
Perform due diligence
Conduct customer interviews
Design composite organization
Construct financial
model using TEI framework
Write case study
6
Analysis
COMPOSITE ORGANIZATION
For this study, Forrester conducted a total of five interviews with representatives from the following companies, which are
Nintex customers:
› A global pharmaceutical company based in the United States with recent fiscal year revenue of over $45 billion and over
70,000 employees. The organization has been using the Nintex workflow platform for three years, and it currently has
developed more than 700 workflows.
› A global manufacturing organization headquartered in Europe and operating in more than 100 countries. Its recent fiscal
year revenue is over $4 billion, and it currently has over 15,000 employees. The organization has used the Nintex workflow
platform for three years and has developed 70 workflows.
› A Southeast Asian branch of a global banking organization with approximately 4,000 employees. The organization has
been using the Nintex workflow platform for one year and has developed 25 workflows.
› A nonprofit organization operating in 120 offices in the United States with recent fiscal year revenue of $650 million and
3,500 employees. The organization has used the Nintex workflow platform for two years and currently has developed 45
workflows.
› A division of a global building technologies company headquartered in the United States with 120,000 employees. The
organization has been using the Nintex workflow platform for one year and has developed about 50 workflows.
Based on the interviews, Forrester constructed a TEI framework, a
composite organization, and an associated ROI analysis that
illustrates the areas financially affected. The Organization, the
composite organization that Forrester synthesized from these
results, represents an organization with the following characteristics
(see Appendix A for more detail):
› Is a US-based global organization with $700 million in revenue in
the most recent fiscal year.
› Has 3,800 employees worldwide.
› Has a number of paper-based and manual processes and is
standardized on a collaboration and content management
system like SharePoint or Office 365.
After an extensive RFP and business case process evaluating
multiple vendors, the Organization chose Nintex and began
deployment:
› The Organization purchased the Enterprise Edition of the Nintex
workflow platform.
› Implementation of the Platform took three FTEs one week to
complete.
› In the initial four months, as part of the proof of concept (POC), the Organization contracted with a partner to help build six
of the most commonly used and complex workflows.3 The Organization also has one architect responsible for developing
“By replacing email-based
processes with a small
workflow, I have created a
measurable process. I can now
tell what point we’re at in the
workflow, and take corrective
action to improve efficiency.”
~Director of collaboration, knowledge management

7
Nintex workflows. This architect worked with the professional services staff as a form of training and also built an additional
four simple workflows in this four-month period.
› The Organization deployed these initial 10 workflows two years
ago, and then relied on internal FTEs for ongoing workflow
development and management of the Platform. By the end of
Year 3, the Organization expects to have developed 60 workflows
in total, 54 of which automate business processes and six of
which automate IT processes. Of those 60 total workflows, 30%
are automating complex processes and 70% are automating
simple processes.
INTERVIEW HIGHLIGHTS
The Organization’s experience prior to and after implementing the
Platform is consistent with common themes revealed in the five
customer interviews.
Situation
Before the Organization decided to invest in the Platform, it struggled with a number of challenges in process automation.
› The Organization relied on custom code to develop workflows to automate processes. Due to the difficulty in developing
with custom code, creating workflows was very time-consuming and inflexible to process changes upon completion. As the
pipeline of requests for automation from the business grew, the relationship between IT and business users became
increasingly strained.
› Since previous process automation was so slow, most processes remained manual. Many processes were handled
through the use of Excel spreadsheets, email, conference calls, and sending paper documents through an approval chain.
This resulted in a lack of efficiency, issues with quality and consistency in processes, and lack of transparency into process
completion.
› The Organization made the decision to standardize on a content and collaboration platform like SharePoint across all of
the business units for collaboration purposes and as a document repository. In looking for a new solution for workflow
development, the Organization knew that it wanted a tool that could interact easily with its content and collaboration
solution.
Solution
The Organization selected the Nintex workflow platform for its intuitive workflow designer, logic and flow, ease of use and
implementation, ability to integrate with other systems within a workflow, and user interaction. Additionally, because the
workflow designer works with SharePoint and/or Office 365, standardizing across the organization on Nintex for workflow
development complements the Organization’s existing technology strategy.
Results
The Organization found that:
› Automating processes with the Nintex workflow platform has enabled productivity gains for the business and IT. The most significant benefit of using the Platform has been improved process efficiencies due to workflows. Shortly after
deploying the first set of workflows, users of those processes began to realize time savings. Over time, as user adoption
grew and new workflows were introduced, these time savings compounded. Additionally, processes are conducted more
“We have several examples
where our workflows need to
talk to another system, and the
fact that we can do that with
Nintex is definitely a winning
factor.”
~Workflow architect
8
consistently, with fewer errors or delays; workflows ensure that every process that’s started is compliant with regulations
and doesn’t result in litigation; and interactions with customers and other external parties can be completed more efficiently
and in line with best practices. Aside from the monetary value of this time saved, nonquantifiable benefits that the
Organization experienced because of these improvements include reduced fines and litigation costs, better engagement
and collaboration with colleagues and external partners, higher customer satisfaction, and incremental revenue from
completing projects more quickly.
› Developing workflows with a drag-and-drop designer speeds delivery of automation and opens the door for partnership with business users. With the Platform, the Organization is able to reduce the amount of time it takes to
develop workflows by an average of 60%. Previous frustrations
around the pipeline of requests from the business to automate
processes are significantly reduced. In addition, the Organization is
able to create more flexibility for end users by providing them the
option to build simpler workflows on their own. A three-person IT
team acting as a Nintex Center of Excellence (CoE), including an
architect to build Nintex workflows, has also trained three business
end users who are more tech-savvy to act as business specialists
in their regions. Business users who want to automate a simple
process then have the ability to either engage with these business
specialists to develop those workflows or engage with the architect.
The CoE retains governance over those workflows created by the
business specialists to ensure that they are developed in line with
the Organization’s guidelines and standards, and they continually
reevaluate the balance between governance and self-service for
the business to ensure an optimal pace of automation.
› The ease of use of the Platform reduces the burden on IT. Not only is developing workflows much easier and less time-
consuming, but using the Platform provides the agility to quickly make changes to workflows as business processes
evolve. Additionally, due to this ease of use, the CoE has the opportunity to encourage more business end users to
develop their own workflows, further reducing the queue and reliance on IT for automation.
“We needed to create a better
relationship between our users
and IT. After deploying
Nintex, we now work as
partners. We work together to
make sure we get things done
at the right speed.”
~System consultant
9
BENEFITS
The Organization experienced a number of quantified benefits in this case study:
› Improved business end user productivity.
› Improved IT FTE productivity.
› Cost avoidance for prior workflow development and management.
The Organization identified several additional benefits that were not able to be quantified. These include:
› The ability to easily collect and share best practices and lessons learned across the organization. The results are higher
quality of work, reduced errors, and improved engagement with colleagues and customers.
› Better compliance with external regulations due to the structure and consistency provided through Nintex Forms and
Nintex Workflow. This leads to reduced litigation costs and fines.
› Incremental revenue from additional projects that were completed due to process efficiencies.
While the Organization was not able to isolate metrics associated with these benefits, Forrester encourages readers with
access to these metrics to include them in their business case analyses.
Improved Business End User Productivity
The most significant benefit that the Organization realized is the productivity gains for end users due to process automation.
In order to quantify this value, the Organization estimated the number of times workflows are used across the end user base
each week. Workflows available to end users include all business workflows and select IT workflows (e.g., software
provisioning). End users rely on two types of workflows:
› Complex workflows: These workflows automate processes that require five to 50 or more steps, a number of different
people or departments, and/or integrations with other systems. On average, end users will rely on a subset of the complex
workflows available to them, interact with these workflows on average every other week, and expect to save about an hour
each time as compared with the pre-automated process. With the Platform, up-to-date information is provided at each
step, there is automatic routing through an approval chain, and there is visibility into the status of the workflow. Examples
include the following processes, which bring together a number of collaborators during a more lengthy process:
• Global approval processes for large capital expenditures that require estimates and inputs from various contributors
and approval from several departments.
• Employee onboarding and software provisioning for new hires and software provisioning for new laptops in the case
of major software updates, laptop loss, or laptop replacement.
• Interacting with external contributors/collaborators to collect submissions for inclusion in published documents.
• Global collaboration between internal groups on major reports or published materials that require significant
collaboration in data gathering, writing, editing, and publishing.
• Account openings for new customers that require detailed data collection, data checks, and approvals from various
departments.
› Simple workflows: These workflows automate one- to five-step processes. End users will find a selection of these
workflows relevant for their activities and will run these workflows on average once a week, saving approximately 15
minutes each time. Examples include the following processes, which were previously paper-based or email-based. Now,
through workflows, these processes are completed much more quickly, consistently collect the correct data, route the
information to the correct people, and automatically route the information to the correct systems upon completion if
necessary:
10
• Time sheets for either full-time employees, contractor/professional services staff, or both.
• Minor expense approval processes, such as for travel reimbursement or office supplies.
• Vacation/leave requests to get approval for and track time spent out of office.
• Submission of best practices and lessons learned to a shared site and routing of relevant best practices to different
user groups.
The most frequent users of workflows save 10% to 15% of their time on average each week. To recognize that not all time
saved is used productively, a productivity factor of 50% is applied to these savings to indicate that 50% of that time is
repurposed to complete additional tasks. Using an average fully loaded annual compensation of $65,000, this results in
$348,000 in productivity savings in Year 1 up to $622,000 in Year 3 on a risk-adjusted basis.
While the interviewed organizations provided similar averages for time savings per workflow type and overall time savings,
each workflow’s productivity contribution is variable, and it can be difficult to determine how often each workflow is used.
Additionally, organizations can differ in user adoption of workflows, resources available to build and evangelize workflows,
and end user average compensation. To compensate for this variability within and across organizations, this benefit was risk-
adjusted and reduced by 30%. The risk-adjusted total benefit resulting from improved business end user productivity over
the three years was $1,468,086. See the section on Risks for more detail.
TABLE 1
Improved Business End User Productivity
Ref. Metric Calculation Year 1 Year 2 Year 3
A1 Number of complex workflows
available to end users 6 11 17
A2 Average time savings per complex
workflow per use (hours) 1 1 1
A3 Average number of complex workflows
used per week (total) 350 525 700
A4 Number of simple workflows available
to end users 11 24 38
A5 Average time savings per simple
workflow per use (hours) 0.25 0.25 0.25
A6 Average number of simple workflows
used per week (total) 1,050 1,400 1,575
A7 Total time savings per week (hours) (A2*A3)+(A5*A6) 612.5 875 1,093.75
A8 Average annual fully loaded
compensation $65,000 $65,000 $65,000
A9 Productivity capture 50% 50% 50%
At Improved business end user
productivity (A7*52)*(A8/2,080)*A9 $497,656 $710,938 $888,672
11
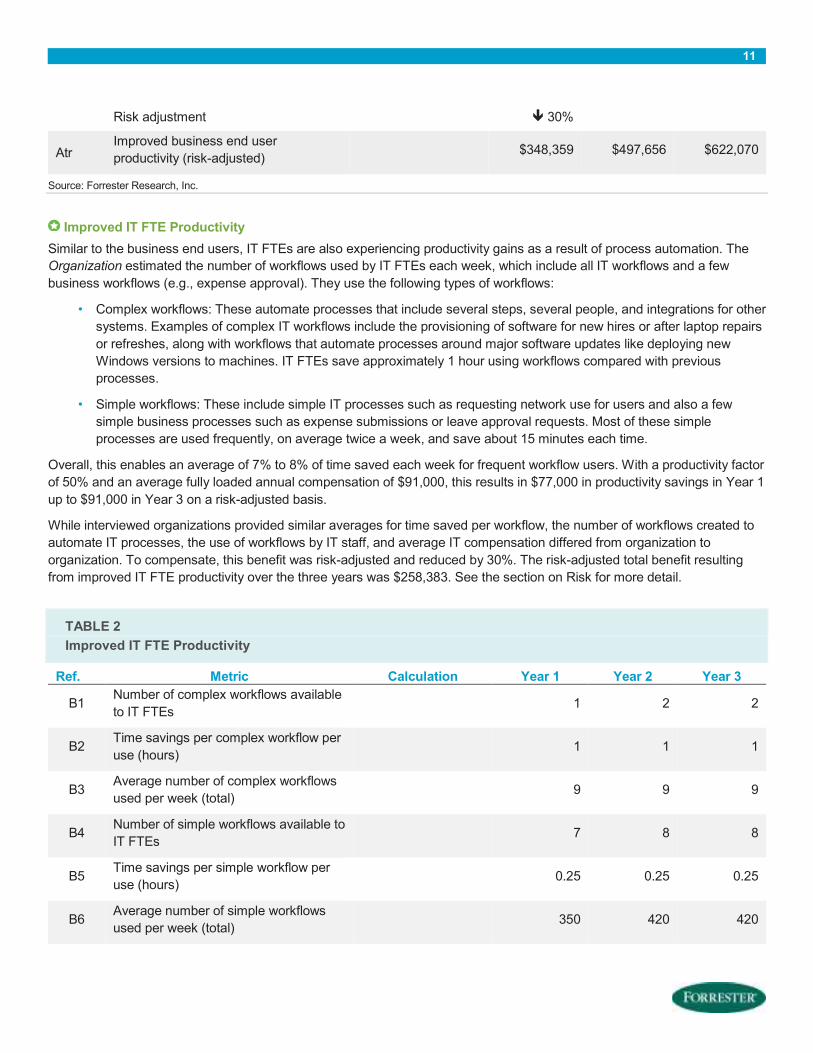
Risk adjustment � 30%
Atr Improved business end user
productivity (risk-adjusted) $348,359 $497,656 $622,070
Source: Forrester Research, Inc.
Improved IT FTE Productivity
Similar to the business end users, IT FTEs are also experiencing productivity gains as a result of process automation. The
Organization estimated the number of workflows used by IT FTEs each week, which include all IT workflows and a few
business workflows (e.g., expense approval). They use the following types of workflows:
• Complex workflows: These automate processes that include several steps, several people, and integrations for other
systems. Examples of complex IT workflows include the provisioning of software for new hires or after laptop repairs
or refreshes, along with workflows that automate processes around major software updates like deploying new
Windows versions to machines. IT FTEs save approximately 1 hour using workflows compared with previous
processes.
• Simple workflows: These include simple IT processes such as requesting network use for users and also a few
simple business processes such as expense submissions or leave approval requests. Most of these simple
processes are used frequently, on average twice a week, and save about 15 minutes each time.
Overall, this enables an average of 7% to 8% of time saved each week for frequent workflow users. With a productivity factor
of 50% and an average fully loaded annual compensation of $91,000, this results in $77,000 in productivity savings in Year 1
up to $91,000 in Year 3 on a risk-adjusted basis.
While interviewed organizations provided similar averages for time saved per workflow, the number of workflows created to
automate IT processes, the use of workflows by IT staff, and average IT compensation differed from organization to
organization. To compensate, this benefit was risk-adjusted and reduced by 30%. The risk-adjusted total benefit resulting
from improved IT FTE productivity over the three years was $258,383. See the section on Risk for more detail.
TABLE 2
Improved IT FTE Productivity
Ref. Metric Calculation Year 1 Year 2 Year 3
B1 Number of complex workflows available
to IT FTEs 1 2 2
B2 Time savings per complex workflow per
use (hours) 1 1 1
B3 Average number of complex workflows
used per week (total) 9 9 9
B4 Number of simple workflows available to
IT FTEs 7 8 8
B5 Time savings per simple workflow per
use (hours) 0.25 0.25 0.25
B6 Average number of simple workflows
used per week (total) 350 420 420

12
B7 Total time savings per week (hours) (B2*B3)+(B5*B6) 96.5 114 114
B8 Average annual fully loaded
compensation $91,000 $91,000 $91,000
B9 Productivity capture 50% 50% 50%
Bt Improved IT FTE productivity (B7*52)*(B8/2,080)*B9 $109,769 $129,675 $129,675
Risk adjustment � 30%
Btr Improved IT FTE productivity (risk-
adjusted) $76,838 $90,773 $90,773
Source: Forrester Research, Inc.
Cost Avoidance For Prior Workflow Development And Management
The Organization indicated that another key benefit is the time savings in developing and managing workflows with the
Nintex workflow platform versus its previous use of custom code. The Organization found that for the workflow architect, prior
to using the Platform, it would take on average 200 hours to build a complex workflow and 10 hours to build a simple
workflow. With the Platform, the architect saw an average 60% reduction in these times. Additionally, prior to using the
Platform, the three FTEs who managed the workflows and overall environment and provided support spent an average of 4
hours per week on these activities. With the Platform, management time is reduced by 20%. In Table 3, the time it would
have taken to replicate the automation achieved with the Platform using custom code is reflected as a cost avoidance
benefit. Tables 6, 7, and 8 describe the current time needed for developing and managing workflows, and the resulting offset
is the value of the time savings described above.
The interviewed organizations differed slightly on the time savings achieved in moving from custom code to the Platform, the
number of FTEs responsible for automation, and the average compensation. To compensate, this benefit was risk-adjusted
and reduced by 10%. The risk-adjusted total benefit resulting from this cost avoidance over the three years was $231,998.
See the section on Risks for more detail.
TABLE 3
Cost Avoidance For Prior Workflow Development And Management
Ref. Metric Calculation Year 1 Year 2 Year 3
C1 FTEs who build workflows 1 1 1
C2 Number of complex workflows
built each year 6 6 6
C3 Previous time per complex
workflow (hours) 200 200 200
C4 Number of simple workflows built
each year 14 14 14
C5 Previous time per simple
workflow (hours) 10 10 10
C6 FTEs who support workflows 3 3 3
C7 Previous time spent on workflow
management per FTE (hours per 4 4 4

13
week)
C8 Total hours per year (C1*C2*C3)+(C1*C4*C5)+(C6*C7*52) 1,964 1,964 1,964
C9 Average annual fully loaded
compensation $91,000 $91,000 $91,000
Ct Cost avoidance for workflow
development C8*(C9/2,080) $85,925 $85,925 $85,925
Risk adjustment � 10%
Ctr Cost avoidance for workflow
development (risk-adjusted) $77,333 $77,333 $77,333
Source: Forrester Research, Inc.
Total Benefits
Table 4 shows the total of all benefits across the three areas listed above, as well as present values (PVs) discounted at
10%. Over three years, the Organization expects risk-adjusted total benefits to be a PV of about $1.6 million.
TABLE 4
Total Benefits (Risk-Adjusted)
Ref. Benefit Year 1 Year 2 Year 3 Total
Present
Value
Atr Improved business end user
productivity $348,359 $497,656 $622,070 $1,468,086 $1,195,347
Btr Improved IT FTE productivity $76,838 $90,773 $90,773 $258,383 $213,070
Ctr
Cost avoidance for prior
workflow development and
management
$77,333 $77,333 $77,333 $231,998 $192,314
Total benefits $502,530 $665,761 $790,175 $1,958,467 $1,600,732
Source: Forrester Research, Inc.

14
COSTS
The Organization experienced a number of costs associated
with the Nintex workflow platform:
› Nintex platform costs.
› Professional services costs.
› IT FTE resource costs.
› Business end user resource costs.
› Training costs.
These represent the mix of internal and external costs experienced by the Organization for initial planning, implementation,
and ongoing maintenance associated with the solution.
Nintex Platform Costs
The Organization purchased the Enterprise Edition of the Nintex workflow platform. The license cost for the Platform was
$64,000. The Organization also paid software assurance and premium support of $22,400 per year.
TABLE 5
Nintex Platform Costs
Ref. Metric Calculation Initial Year 1 Year 2 Year 3
D1 Licensing costs $64,000
D2 Software assurance and premium support costs
$22,400 $22,400 $22,400
Dt Nintex platform costs (not risk-adjusted)
D1+D2 $64,000 $22,400 $22,400 $22,400
Source: Forrester Research, Inc.
Professional Services Costs
The Organization brought in a professional services team of three members to assist in building the initial set of complex
workflows. These workflows automated highly visible and common processes (both for the business and IT) that included
several steps, a number of interactions with colleagues and/or external parties, and integrations with other systems. While
the internal IT team responsible for the Platform received official training, assisting the professional services team provided
additional opportunity to learn how to build these more involved workflows. The three-person professional services team
spent two weeks on each workflow at an hourly rate of $160 per person. Following the deployment of these initial workflows,
the internal IT team took over development of all workflows going forward.
Professional services costs are variable from organization to organization, considering some organizations rely more than
others on professional services to assist with workflow development and implementation. Additionally, the size of the
professional services staff and the hourly or contract rate can vary. To compensate, this cost was risk-adjusted up by 30%.
The risk-adjusted cost for professional services for the Organization was $299,520. See the section on Risks for more detail.
Note: The mix of professional services costs, IT
FTE resource costs, and business end user
resource costs used for workflow development at
the Organization represents the most common
scenario of the interviewees. Due to high
variability in this mix, readers are urged to
consider their organization’s goals and skill sets
in their business case analyses.

15
TABLE 6
Professional Services Costs
Ref. Metric Calculation Initial Year 1 Year 2 Year 3
E1 Number of professional services
staff 3
E2 Hours spent on implementation 0
E3 Number of complex workflows built 6
E4 Hours spent per complex workflow
per staff member 80
E5 Number of simple workflows built 0
E6 Hours spent per simple workflow
per staff member 4
E7 Average hourly rate $160
Et Professional services costs ((E1*E2)+(E1*E3*E4)+
(E1*E5*E6))*E7 $230,400 $0 $0 $0
Risk adjustment � 30%
Etr Professional services costs (risk-
adjusted) $299,520 $0 $0 $0
Source: Forrester Research, Inc.
IT FTE Resource Costs
The Organization relies on a team of three FTEs who make up the internal Nintex CoE as part of their responsibilities. This
team includes one architect responsible for developing workflows and two support staff to assist in managing existing
workflows and the Platform. These three FTEs spent one week implementing the Workflow and Forms products. They each
spend three hours a week on ongoing management of the Nintex environment, support for business end users building their
own workflows, and regular Nintex account management meetings. The architect spends on average 80 hours to build one
complex workflow (multiple steps, integrations, interactions) and 4 hours to build one simple workflow (a few steps, no
integrations). In the initial POC period, the architect spent 40 hours shadowing the professional services team for each
complex workflow and built an additional four simple workflows. In years 1 through 3, the architect built all of the additional
complex workflows and most of the simple workflows, aside from six simple workflows built in Year 2 and Year 3 by business
end users.
IT FTE resource costs are variable from organization to organization, considering some organizations rely more than others
on professional services, the skill set and availability in house can vary, and the average compensation for IT can differ. To
compensate, this cost was risk-adjusted up by 30%. The risk-adjusted cost for IT resources over the three years was
$163,188. See the section on Risks for more detail.
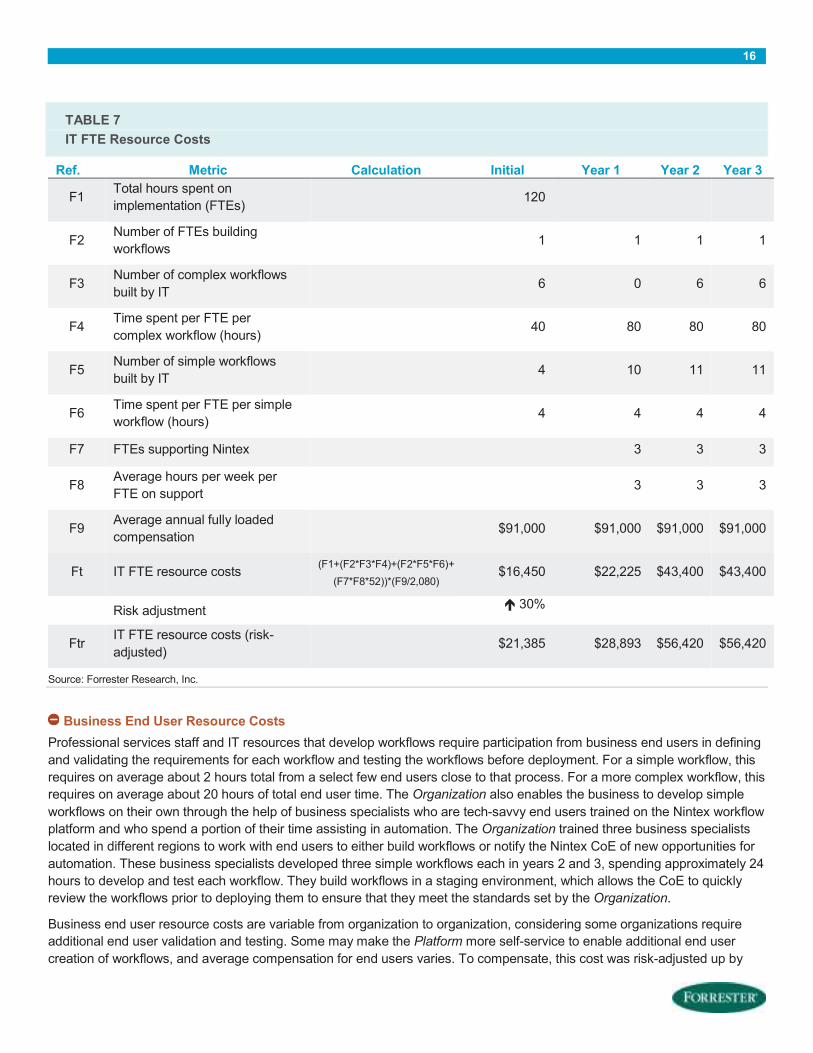
16
TABLE 7
IT FTE Resource Costs
Ref. Metric Calculation Initial Year 1 Year 2 Year 3
F1 Total hours spent on
implementation (FTEs) 120
F2 Number of FTEs building
workflows 1 1 1 1
F3 Number of complex workflows
built by IT 6 0 6 6
F4 Time spent per FTE per
complex workflow (hours) 40 80 80 80
F5 Number of simple workflows
built by IT 4 10 11 11
F6 Time spent per FTE per simple
workflow (hours) 4 4 4 4
F7 FTEs supporting Nintex 3 3 3
F8 Average hours per week per
FTE on support 3 3 3
F9 Average annual fully loaded
compensation $91,000 $91,000 $91,000 $91,000
Ft IT FTE resource costs (F1+(F2*F3*F4)+(F2*F5*F6)+
(F7*F8*52))*(F9/2,080) $16,450 $22,225 $43,400 $43,400
Risk adjustment � 30%
Ftr IT FTE resource costs (risk-
adjusted) $21,385 $28,893 $56,420 $56,420
Source: Forrester Research, Inc.
Business End User Resource Costs
Professional services staff and IT resources that develop workflows require participation from business end users in defining
and validating the requirements for each workflow and testing the workflows before deployment. For a simple workflow, this
requires on average about 2 hours total from a select few end users close to that process. For a more complex workflow, this
requires on average about 20 hours of total end user time. The Organization also enables the business to develop simple
workflows on their own through the help of business specialists who are tech-savvy end users trained on the Nintex workflow
platform and who spend a portion of their time assisting in automation. The Organization trained three business specialists
located in different regions to work with end users to either build workflows or notify the Nintex CoE of new opportunities for
automation. These business specialists developed three simple workflows each in years 2 and 3, spending approximately 24
hours to develop and test each workflow. They build workflows in a staging environment, which allows the CoE to quickly
review the workflows prior to deploying them to ensure that they meet the standards set by the Organization.
Business end user resource costs are variable from organization to organization, considering some organizations require
additional end user validation and testing. Some may make the Platform more self-service to enable additional end user
creation of workflows, and average compensation for end users varies. To compensate, this cost was risk-adjusted up by
17
30%. The risk-adjusted cost for business end user resources over the three years was $23,400. See the section on Risks for
more detail.
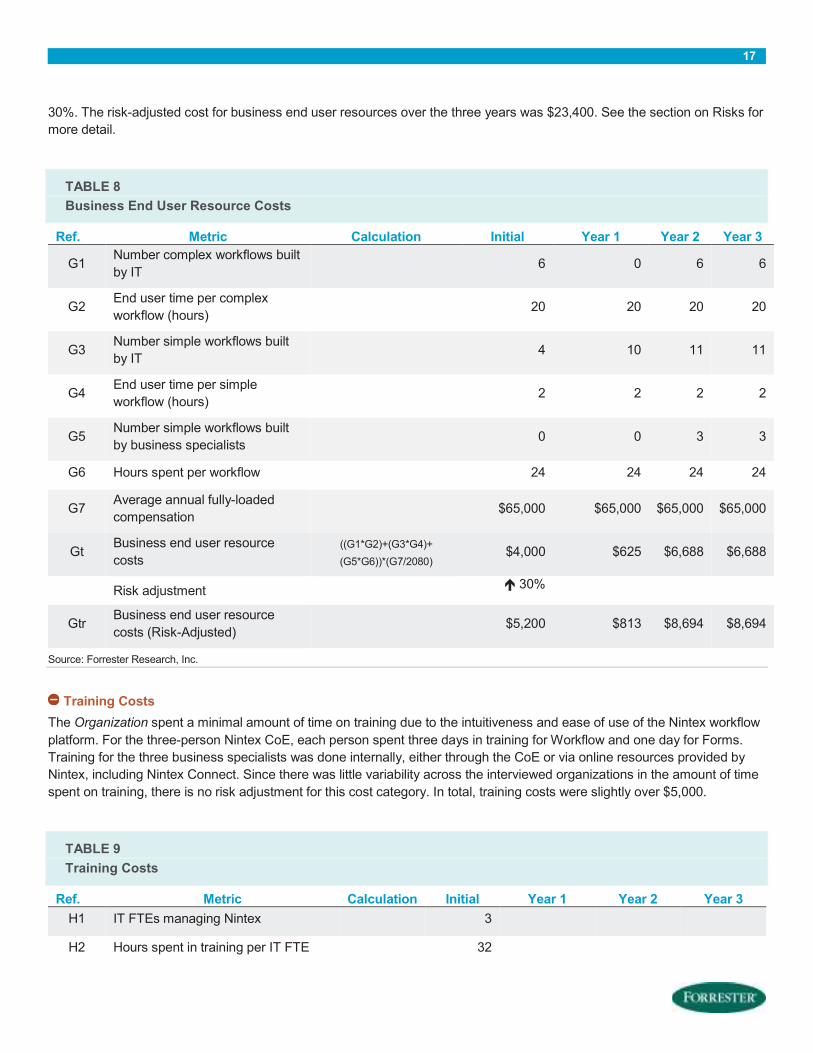
TABLE 8
Business End User Resource Costs
Ref. Metric Calculation Initial Year 1 Year 2 Year 3
G1 Number complex workflows built
by IT 6 0 6 6
G2 End user time per complex
workflow (hours) 20 20 20 20
G3 Number simple workflows built
by IT 4 10 11 11
G4 End user time per simple
workflow (hours) 2 2 2 2
G5 Number simple workflows built
by business specialists 0 0 3 3
G6 Hours spent per workflow 24 24 24 24
G7 Average annual fully-loaded
compensation $65,000 $65,000 $65,000 $65,000
Gt Business end user resource
costs
((G1*G2)+(G3*G4)+
(G5*G6))*(G7/2080) $4,000 $625 $6,688 $6,688
Risk adjustment � 30%
Gtr Business end user resource
costs (Risk-Adjusted) $5,200 $813 $8,694 $8,694
Source: Forrester Research, Inc.
Training Costs
The Organization spent a minimal amount of time on training due to the intuitiveness and ease of use of the Nintex workflow
platform. For the three-person Nintex CoE, each person spent three days in training for Workflow and one day for Forms.
Training for the three business specialists was done internally, either through the CoE or via online resources provided by
Nintex, including Nintex Connect. Since there was little variability across the interviewed organizations in the amount of time
spent on training, there is no risk adjustment for this cost category. In total, training costs were slightly over $5,000.
TABLE 9
Training Costs
Ref. Metric Calculation Initial Year 1 Year 2 Year 3
H1 IT FTEs managing Nintex 3
H2 Hours spent in training per IT FTE 32
18
H3 Business specialists who help with
wworkflows 3
H4 Hours spent in training per business
specialist 10
H5 Average IT annual fully loaded
compensation $91,000
H6 Average end user annual fully loaded
compensation $65,000
Ht Training costs $5,138 $0 $0 $0
Source: Forrester Research, Inc.
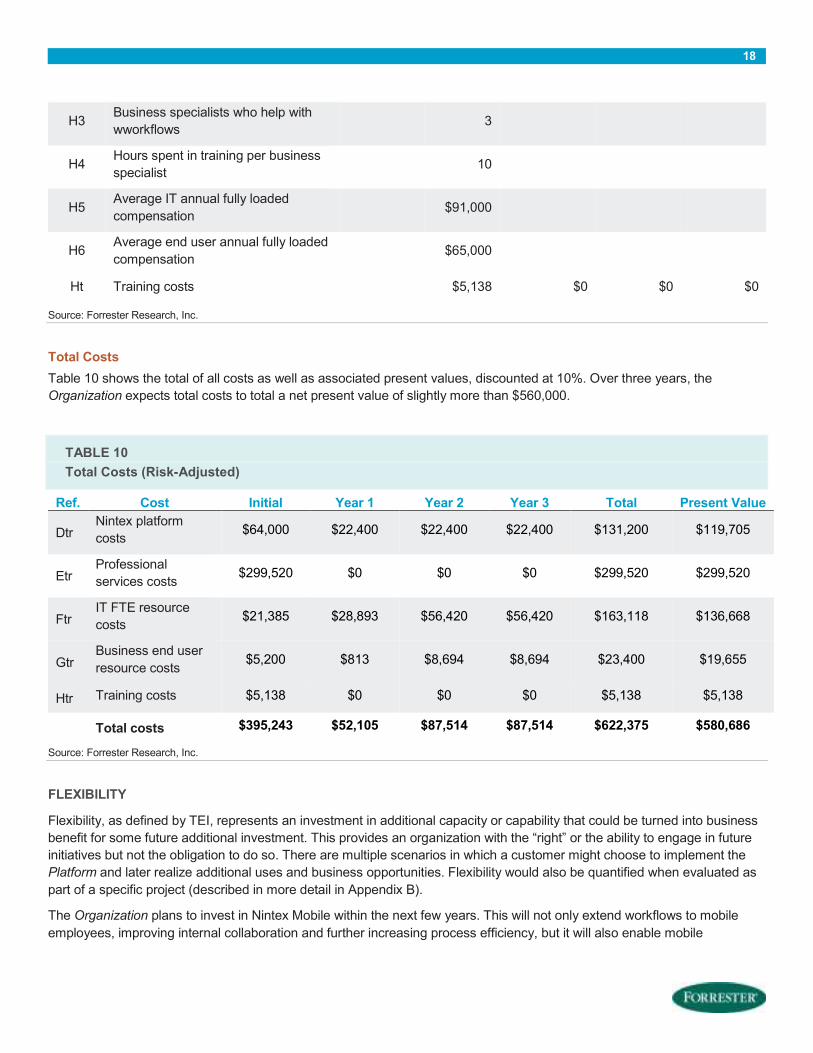
Total Costs
Table 10 shows the total of all costs as well as associated present values, discounted at 10%. Over three years, the
Organization expects total costs to total a net present value of slightly more than $560,000.
TABLE 10
Total Costs (Risk-Adjusted)
Ref. Cost Initial Year 1 Year 2 Year 3 Total Present Value
Dtr Nintex platform
costs $64,000 $22,400 $22,400 $22,400 $131,200 $119,705
Etr Professional
services costs $299,520 $0 $0 $0 $299,520 $299,520
Ftr IT FTE resource
costs $21,385 $28,893 $56,420 $56,420 $163,118 $136,668
Gtr Business end user
resource costs $5,200 $813 $8,694 $8,694 $23,400 $19,655
Htr Training costs $5,138 $0 $0 $0 $5,138 $5,138
Total costs $395,243 $52,105 $87,514 $87,514 $622,375 $580,686
Source: Forrester Research, Inc.
FLEXIBILITY
Flexibility, as defined by TEI, represents an investment in additional capacity or capability that could be turned into business
benefit for some future additional investment. This provides an organization with the “right” or the ability to engage in future
initiatives but not the obligation to do so. There are multiple scenarios in which a customer might choose to implement the
Platform and later realize additional uses and business opportunities. Flexibility would also be quantified when evaluated as
part of a specific project (described in more detail in Appendix B).
The Organization plans to invest in Nintex Mobile within the next few years. This will not only extend workflows to mobile
employees, improving internal collaboration and further increasing process efficiency, but it will also enable mobile
19
interactions with customers. Extending workflows to customers’ mobile devices has the potential to improve engagement,
enhance revenue, and increase customer satisfaction.
RISKS
Forrester defines two types of risk associated with this analysis: “implementation risk” and “impact risk.” Implementation risk
is the risk that a proposed investment in the Nintex workflow platform may deviate from the original or expected
requirements, resulting in higher costs than anticipated. Impact risk refers to the risk that the business or technology needs
of the organization may not be met by the investment in the Platform, resulting in lower overall total benefits. The greater the
uncertainty, the wider the potential range of outcomes for cost and benefit estimates.
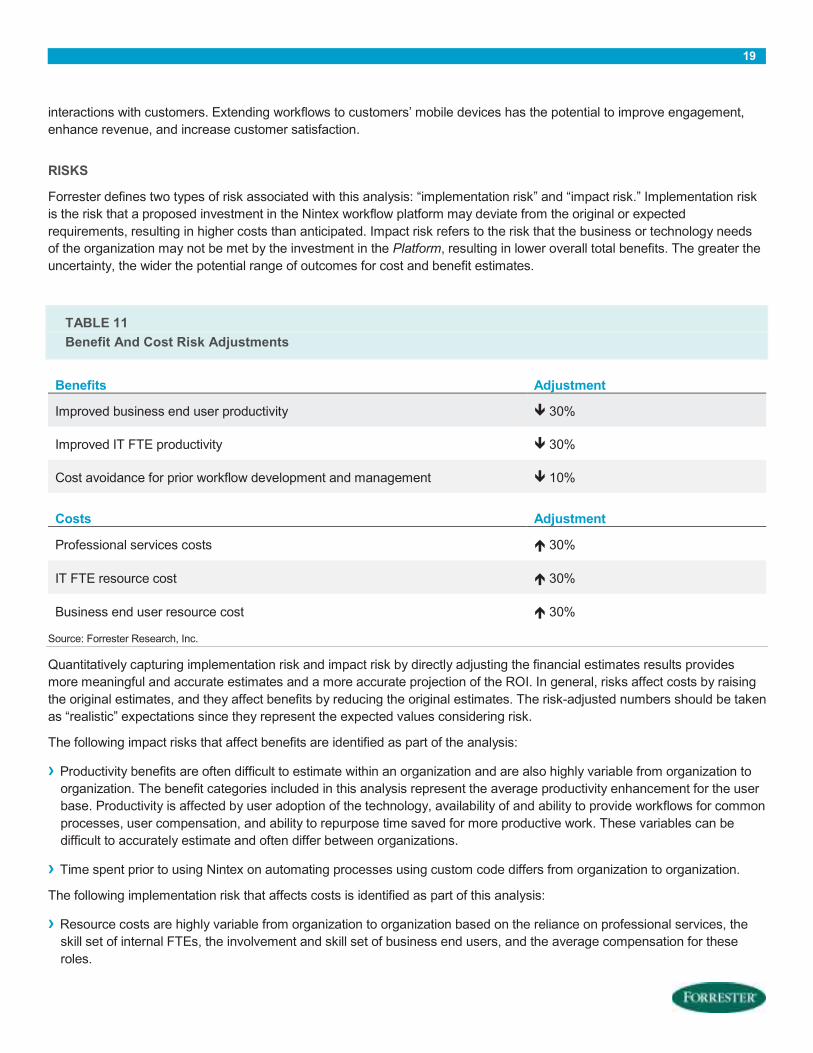
TABLE 11
Benefit And Cost Risk Adjustments
Benefits Adjustment
Improved business end user productivity � 30%
Improved IT FTE productivity � 30%
Cost avoidance for prior workflow development and management � 10%
Costs Adjustment
Professional services costs � 30%
IT FTE resource cost � 30%
Business end user resource cost � 30%
Source: Forrester Research, Inc.
Quantitatively capturing implementation risk and impact risk by directly adjusting the financial estimates results provides
more meaningful and accurate estimates and a more accurate projection of the ROI. In general, risks affect costs by raising
the original estimates, and they affect benefits by reducing the original estimates. The risk-adjusted numbers should be taken
as “realistic” expectations since they represent the expected values considering risk.
The following impact risks that affect benefits are identified as part of the analysis:
› Productivity benefits are often difficult to estimate within an organization and are also highly variable from organization to
organization. The benefit categories included in this analysis represent the average productivity enhancement for the user
base. Productivity is affected by user adoption of the technology, availability of and ability to provide workflows for common
processes, user compensation, and ability to repurpose time saved for more productive work. These variables can be
difficult to accurately estimate and often differ between organizations.
› Time spent prior to using Nintex on automating processes using custom code differs from organization to organization.
The following implementation risk that affects costs is identified as part of this analysis:
› Resource costs are highly variable from organization to organization based on the reliance on professional services, the
skill set of internal FTEs, the involvement and skill set of business end users, and the average compensation for these
roles.

20
Table 11 shows the values used to adjust for risk and uncertainty in the cost and benefit estimates for the Organization.
Readers are urged to apply their own risk ranges based on their own degree of confidence in the cost and benefit estimates.
21
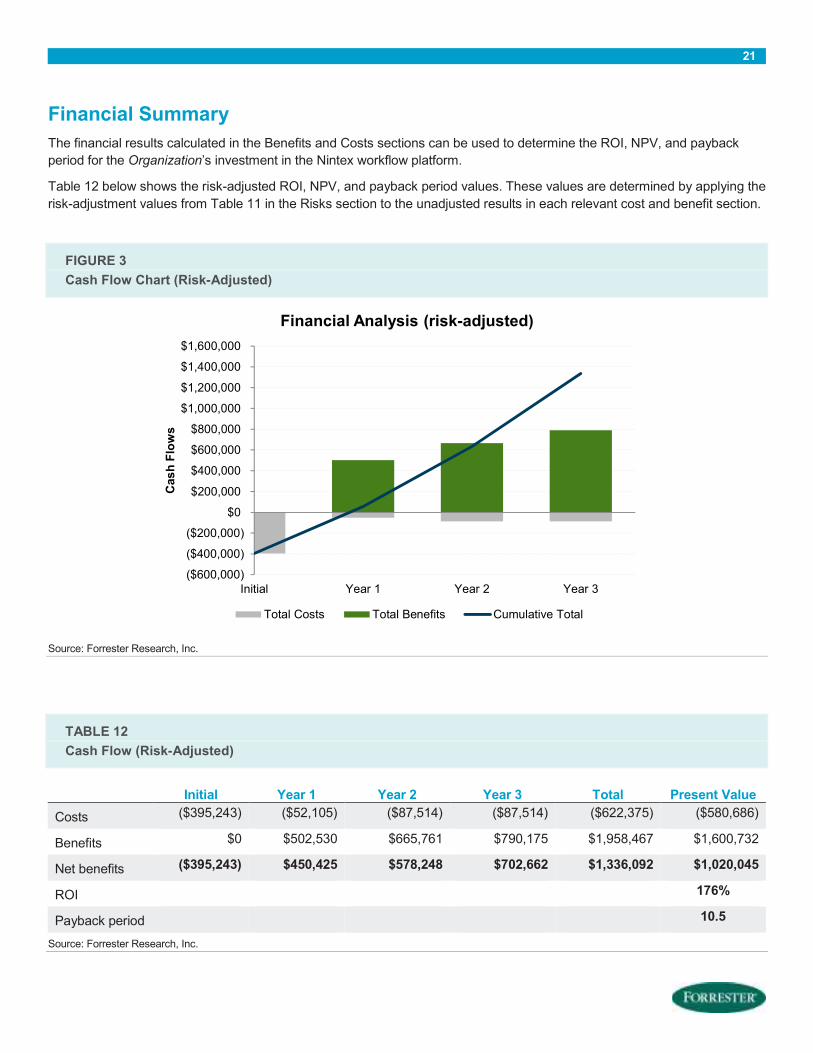
Financial Summary
The financial results calculated in the Benefits and Costs sections can be used to determine the ROI, NPV, and payback
period for the Organization’s investment in the Nintex workflow platform.
Table 12 below shows the risk-adjusted ROI, NPV, and payback period values. These values are determined by applying the
risk-adjustment values from Table 11 in the Risks section to the unadjusted results in each relevant cost and benefit section.
FIGURE 3
Cash Flow Chart (Risk-Adjusted)
Source: Forrester Research, Inc.
TABLE 12
Cash Flow (Risk-Adjusted)
Initial Year 1 Year 2 Year 3 Total Present Value
Costs ($395,243) ($52,105) ($87,514) ($87,514) ($622,375) ($580,686)
Benefits $0 $502,530 $665,761 $790,175 $1,958,467 $1,600,732
Net benefits ($395,243) $450,425 $578,248 $702,662 $1,336,092 $1,020,045
ROI
176%
Payback period 10.5
Source: Forrester Research, Inc.
($600,000)
($400,000)
($200,000)
$0
$200,000
$400,000
$600,000
$800,000
$1,000,000
$1,200,000
$1,400,000
$1,600,000
Initial Year 1 Year 2 Year 3
Cash Flows
Financial Analysis (risk-adjusted)
Total Costs Total Benefits Cumulative Total

22
Nintex Workflow Platform: Overview
The following information is provided by Nintex. Forrester has not validated any claims and does not endorse Nintex or its
offerings.
Nintex is a leading workflow company. It delivers innovative software and cloud services to help organizations automate
everyday business processes quickly and easily.
More than 5,000 public and private organizations in 90 countries, including 200 of the Fortune 500, run millions of Nintex
workflows daily. Its network of more than 1,000 reselling and service partners delivers integrated workflow solutions, from
simple to complex, addressing needs of business users, developers, and IT professionals.
Whether working with simple workflows or complex processes that interconnect multiple systems, Nintex delivers
workflow solutions that match its customers’ needs and business vision. Built for today's most used content and
collaboration environments, its scalable solutions enable you to automate more processes, increasing efficiency and
producing replicable results. Both powerful and easy to use, the Nintex workflow platform delivers immediate results and
return on investment, followed by rapid adoption across the enterprise.
23
Appendix A: Composite Organization Description
For this TEI study, Forrester has created a composite organization, the Organization, to illustrate the quantifiable benefits
and costs of implementing the Nintex workflow platform. The Organization is intended to represent a global company with
3,800 employees and is based on characteristics of the interviewed customers.
The Organization had, prior to implementing the Platform, relied on custom code to automate some of the manual processes
that were creating inefficiencies within the organization and reducing the overall quality of work. However, because
automating with custom code was time-consuming and inflexible to business process changes, there was a large pipeline of
requests that were unfulfilled, straining the relationship between IT and the business and leaving productivity gains on the
table.
In purchasing the Platform, the Organization had the following objectives:
› Automate and improve paper-based or manual (e.g., email-based, conference calls, excel spreadsheets) processes.
› Enable more efficient collaboration within the organization and with customers.
› Foster a better relationship between business end users and IT and keep pace with business demand to automate.
› Provide cost savings in the development and management of workflows.
For the purpose of the analysis, Forrester assumes that the Organization has been using the Platform for one year.
Following the one-week implementation, the IT FTEs responsible for Nintex worked with a partner to develop 10 initial
workflows as a POC. Following this successful four-month pilot, these three FTEs formed the internal Nintex Center of
Excellence, developed additional workflows and provided training to three business specialists, and oversaw the workflows
those specialists created. While the initial 10 workflows were mostly complex processes, by the end of Year 3, of the 60 total
workflows created, 90% were automating business processes, a majority of which were simpler in nature. The organization
consistently added 20 workflows per year.
FRAMEWORK ASSUMPTIONS
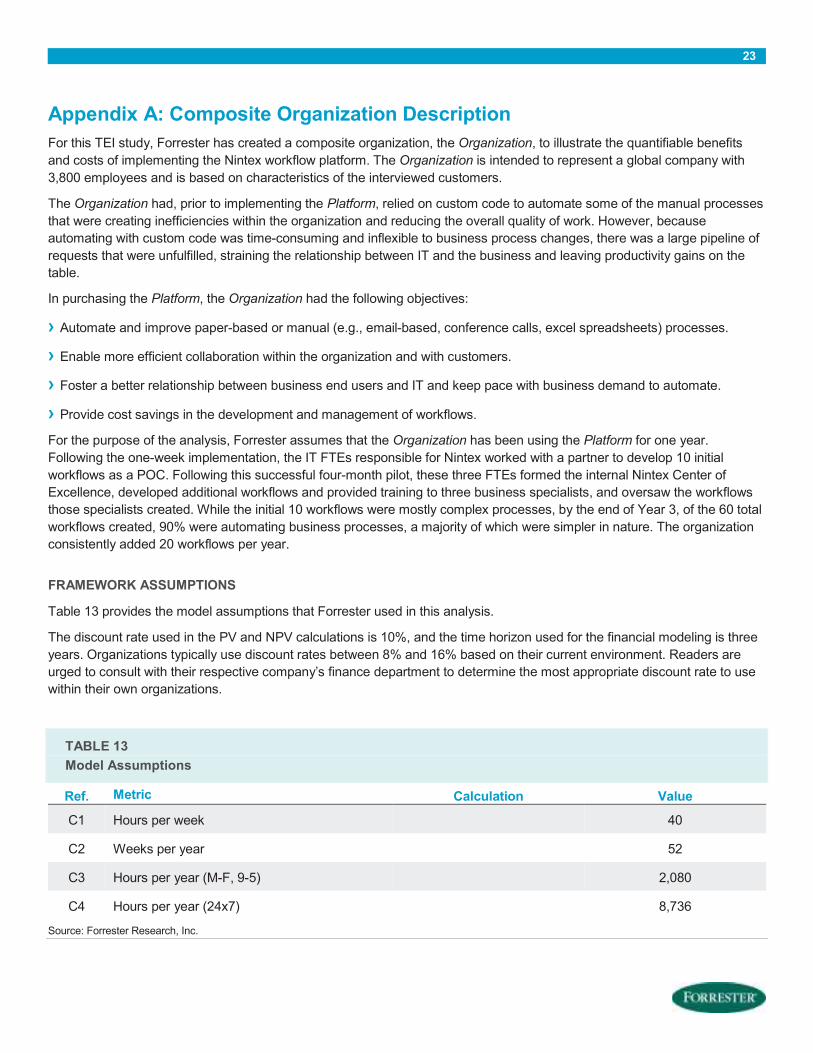
Table 13 provides the model assumptions that Forrester used in this analysis.
The discount rate used in the PV and NPV calculations is 10%, and the time horizon used for the financial modeling is three
years. Organizations typically use discount rates between 8% and 16% based on their current environment. Readers are
urged to consult with their respective company’s finance department to determine the most appropriate discount rate to use
within their own organizations.
TABLE 13
Model Assumptions
Ref. Metric Calculation Value
C1 Hours per week 40
C2 Weeks per year 52
C3 Hours per year (M-F, 9-5) 2,080
C4 Hours per year (24x7) 8,736
Source: Forrester Research, Inc.
24
Appendix B: Total Economic Impact™ Overview
Total Economic Impact is a methodology developed by Forrester Research that enhances a company’s technology decision-
making processes and assists vendors in communicating the value proposition of their products and services to clients. The
TEI methodology helps companies demonstrate, justify, and realize the tangible value of IT initiatives to both senior
management and other key business stakeholders.
The TEI methodology consists of four components to evaluate investment value: benefits, costs, flexibility, and risks.
BENEFITS
Benefits represent the value delivered to the user organization — IT and/or business units — by the proposed product or
project. Often, product or project justification exercises focus just on IT cost and cost reduction, leaving little room to analyze
the effect of the technology on the entire organization. The TEI methodology and the resulting financial model place equal
weight on the measure of benefits and the measure of costs, allowing for a full examination of the effect of the technology on
the entire organization. Calculation of benefit estimates involves a clear dialogue with the user organization to understand
the specific value that is created. In addition, Forrester also requires that there be a clear line of accountability established
between the measurement and justification of benefit estimates after the project has been completed. This ensures that
benefit estimates tie back directly to the bottom line.
COSTS
Costs represent the investment necessary to capture the value, or benefits, of the proposed project. IT or the business units
may incur costs in the form of fully burdened labor, subcontractors, or materials. Costs consider all the investments and
expenses necessary to deliver the proposed value. In addition, the cost category within TEI captures any incremental costs
over the existing environment for ongoing costs associated with the solution. All costs must be tied to the benefits that are
created.
FLEXIBILITY
Within the TEI methodology, direct benefits represent one part of the investment value. While direct benefits can typically be
the primary way to justify a project, Forrester believes that organizations should be able to measure the strategic value of an
investment. Flexibility represents the value that can be obtained for some future additional investment building on top of the
initial investment already made. For instance, an investment in an enterprisewide upgrade of an office productivity suite can
potentially increase standardization (to increase efficiency) and reduce licensing costs. However, an embedded collaboration
feature may translate to greater worker productivity if activated. The collaboration can only be used with additional
investment in training at some future point. However, having the ability to capture that benefit has a PV that can be
estimated. The flexibility component of TEI captures that value.
RISKS
Risks measure the uncertainty of benefit and cost estimates contained within the investment. Uncertainty is measured in two
ways: 1) the likelihood that the cost and benefit estimates will meet the original projections and 2) the likelihood that the
estimates will be measured and tracked over time. TEI risk factors are based on a probability density function known as
“triangular distribution” to the values entered. At a minimum, three values are calculated to estimate the risk factor around
each cost and benefit.
25
Appendix C: Glossary
Discount rate: The interest rate used in cash flow analysis to take into account the time value of money. Companies set
their own discount rate based on their business and investment environment. Forrester assumes a yearly discount rate of
10% for this analysis. Organizations typically use discount rates between 8% and 16% based on their current environment.
Readers are urged to consult their respective organizations to determine the most appropriate discount rate to use in their
own environment.
Net present value (NPV): The present or current value of (discounted) future net cash flows given an interest rate (the
discount rate). A positive project NPV normally indicates that the investment should be made, unless other projects have
higher NPVs.
Present value (PV): The present or current value of (discounted) cost and benefit estimates given at an interest rate (the
discount rate). The PV of costs and benefits feed into the total NPV of cash flows.
Payback period: The breakeven point for an investment. This is the point in time at which net benefits (benefits minus costs)
equal initial investment or cost.
Return on investment (ROI): A measure of a project’s expected return in percentage terms. ROI is calculated by dividing
net benefits (benefits minus costs) by costs.
Simple workflow: A workflow that automates a process that has a minimal number of steps (i.e., one to five) and previously
was paper-based/email-centric or ad hoc.
Complex workflow: A workflow that automates a process that has a significant number of steps (i.e., five to 50 steps),
requires a number of collaborators to complete, and/or involves integrations with other systems or cloud services.
A NOTE ON CASH FLOW TABLES
The following is a note on the cash flow tables used in this study (see the example table below). The initial investment
column contains costs incurred at “time 0” or at the beginning of Year 1. Those costs are not discounted. All other cash flows
in years 1 through 3 are discounted using the discount rate (shown in the Framework Assumptions section) at the end of the
year. PV calculations are calculated for each total cost and benefit estimate. NPV calculations are not calculated until the
summary tables are the sum of the initial investment and the discounted cash flows in each year.
Sums and present value calculations of the Total Benefits, Total Costs, and Cash Flow tables may not exactly add up, as
some rounding may occur.
TABLE [EXAMPLE]
Example Table
Ref. Metric Calculation Year 1 Year 2 Year 3
Source: Forrester Research, Inc.

26
Appendix D: Supplemental Material
Related Forrester Research
“New Development Platforms Emerge For Customer-Facing Applications,” Forrester Research, Inc., June 9, 2014
Appendix E: Endnotes
1 Forrester risk-adjusts the summary financial metrics to take into account the potential uncertainty of the cost and benefit
estimates. For more information, see the section on Risks.
2 For the purposes of this analysis, Forrester separated workflows into two buckets: simple workflows and complex
workflows. Simple workflows automate processes that have a minimal number of steps (i.e., one to five steps) and previously were paper-based/email-centric or ad hoc. Complex workflows automate processes that have a significant number of steps (i.e., five to 50 steps), require a number of collaborators to complete, and involve integrations with other systems or cloud services.
3 For the purposes of this analysis, Forrester separated workflows into two buckets: simple workflows and complex
workflows. Simple workflows automate processes that have a minimal number of steps (i.e., one to five steps) and previously were paper-based/email-centric or ad hoc. Complex workflows automate processes that have a significant number of steps (i.e., five to 50 steps), require a number of collaborators to complete, and involve integrations with other systems or cloud services.