
Cost Research Binnenwerk - orgprints.orgorgprints.org/30599/1/2016-BioGreenhouse_Research.pdf ·...
156
Research Research COST is supported by the EU Framework Programme Horizon 2020 Edited by Martin Koller, Francis Rayns, Stella Cubison and Ulrich Schmutz Guidelines for Experimental Practice in Organic Greenhouse Horticulture
Transcript of Cost Research Binnenwerk - orgprints.orgorgprints.org/30599/1/2016-BioGreenhouse_Research.pdf ·...
ResearchResearcResearcResearcResearcResearcResearcResearcResearchResearcResearchResearcResearcResearcCOST is supported bythe EU Framework ProgrammeHorizon 2020
Edited by Martin Koller, Francis Rayns, Stella Cubison and Ulrich Schmutz
Guidelines for Experimental Practice in Organic Greenhouse Horticulture
April 11, 2016
AcknowledgementThis book is based upon work from COST Action FA1105 BioGreenhouse, supported by COST (European Cooperation in Science and Technology).
The authors and editors wish to thank many colleagues for their assistance in providing the material for these guidelines. In addition Rob Meijer (Chair, COST Action FA1105 Biogreenhouse), Karin Postweiler (DLR Rheinpfalz, Germany), Birgit Rascher (LWG Bayern, Germany) and Catherine Mazollier (GRAB, France) provided critical comments on the text. We want to thank Ms. José Frederiks (Wageningen UR Greenhouse Horticulture) for processing layout and printing. We are grateful for financial support and the opportunity to build this network. Link to the Action: http://www.cost.eu/COST_Actions/fa/FA1105 and: http://www.biogreenhouse.org/
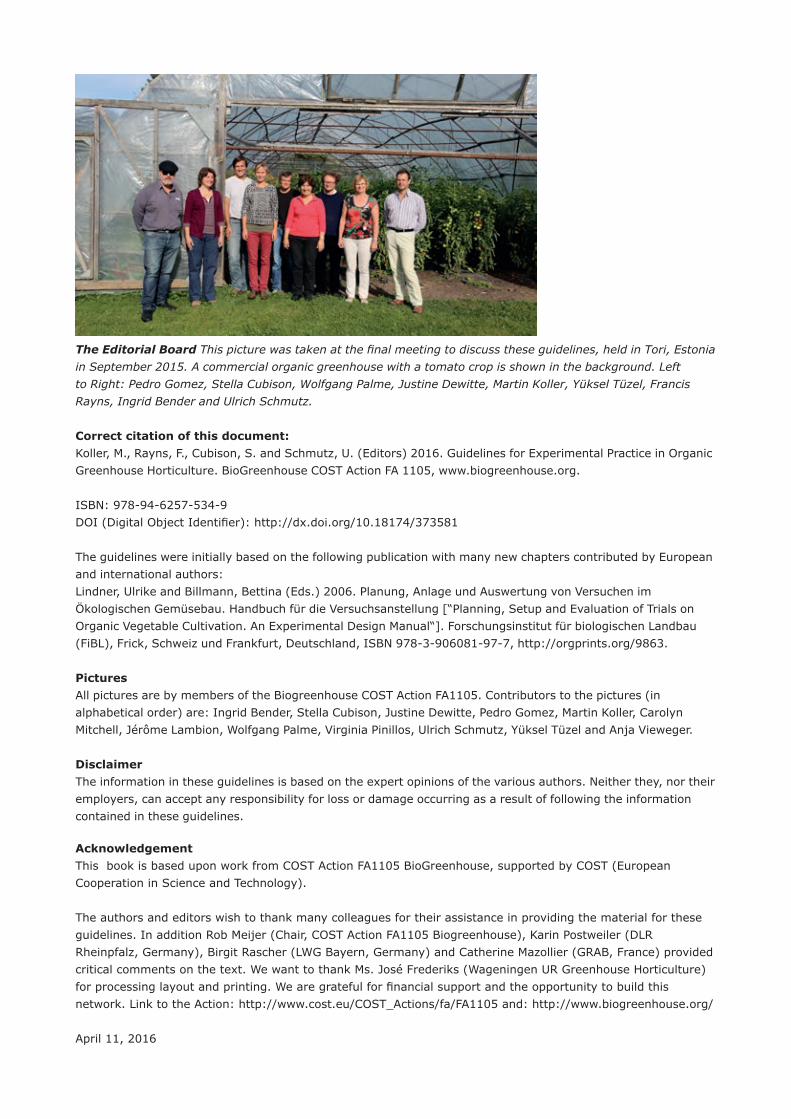
The Editorial Board This picture was taken at the final meeting to discuss these guidelines, held in Tori, Estonia in September 2015. A commercial organic greenhouse with a tomato crop is shown in the background. Left to Right: Pedro Gomez, Stella Cubison, Wolfgang Palme, Justine Dewitte, Martin Koller, Yüksel Tüzel, Francis Rayns, Ingrid Bender and Ulrich Schmutz.
Correct citation of this document:Koller, M., Rayns, F., Cubison, S. and Schmutz, U. (Editors) 2016. Guidelines for Experimental Practice in Organic Greenhouse Horticulture. BioGreenhouse COST Action FA 1105, www.biogreenhouse.org.
ISBN: 978-94-6257-534-9DOI (Digital Object Identifier): http://dx.doi.org/10.18174/373581
The guidelines were initially based on the following publication with many new chapters contributed by European and international authors:Lindner, Ulrike and Billmann, Bettina (Eds.) 2006. Planung, Anlage und Auswertung von Versuchen im Ökologischen Gemüsebau. Handbuch für die Versuchsanstellung [“Planning, Setup and Evaluation of Trials on Organic Vegetable Cultivation. An Experimental Design Manual“]. Forschungsinstitut für biologischen Landbau (FiBL), Frick, Schweiz und Frankfurt, Deutschland, ISBN 978-3-906081-97-7, http://orgprints.org/9863. PicturesAll pictures are by members of the Biogreenhouse COST Action FA1105. Contributors to the pictures (in alphabetical order) are: Ingrid Bender, Stella Cubison, Justine Dewitte, Pedro Gomez, Martin Koller, Carolyn Mitchell, Jérôme Lambion, Wolfgang Palme, Virginia Pinillos, Ulrich Schmutz, Yüksel Tüzel and Anja Vieweger.
DisclaimerThe information in these guidelines is based on the expert opinions of the various authors. Neither they, nor their employers, can accept any responsibility for loss or damage occurring as a result of following the information contained in these guidelines.

Guidelines for Experimental Practice | 3
Table of contents
Authors 5
Preface 7
Abbreviations 9
1 Introduction 11
2 Trials in Organic Horticulture 13
2.1 Separation from conventional cropping 132.2 Crop rotation and plant material 132.3 Trial designs 13
2.3.1 Plots and treatments 142.3.2 Controls and other comparisons 142.3.3 Replications and randomisation 152.3.4 Fully randomised design 152.3.5 Block design 152.3.6 Latin Square design 162.3.7 Split plot design 162.3.8 Fully factorial design 172.3.9 Simplifieddesignsforon-farmtrials 17
2.4 Recording results 182.4.1 Recording information 182.4.2 Missing values 192.4.3 Harvest records 192.4.4 Time measurement 19
2.5 Data analysis and statistics 202.5.1 Plot values 202.5.2 Statistical analysis 21
2.6 Writing up an experimental report 21
3 Key Types of Experiments 23
3.1 Crop variety trials 233.1.1 Variety comparison experiments 233.1.2 Grafting experiments 25
3.2 Fertilisation experiments 283.2.1 Experiments with solid fertilisers, manures and commercial products 283.2.2 Experiments with liquid fertilisers 323.2.3 Experiments with compost 343.2.4 Experiments with green manures 353.2.5 Fertilising experiments in growing media used for transplant production, potted
herbs or ornamentals 383.2.6 Evaluation of container growing media 40
3.3 Experiments on weed control 413.3.1 Weed control 413.3.2 Evaluation of mulching materials 42

4 | Guidelines for Experimental Practice
3.4 Plant protection experiments 433.4.1 Evaluation of fungicides and insecticides in organic cropping 433.4.2 Evaluation of bio control agents and natural enemies 453.4.3 Enhancementstobiodiversityusingflowerstrips 48
3.5 Other types of experiments 503.5.1 Evaluation of greenhouse infrastructure 503.5.2 Irrigation systems 533.5.3 Pollination 59
3.6 Economic evaluation of crop trials 613.7 Participative experiments and on farm research 65
4 Guidelines for Selected Crops 69
4.1 Introduction 694.2 Fruit vegetables 71
4.2.1 Tomatoes 714.2.2 Eggplant 764.2.3 Peppers 824.2.4 Courgette 874.2.5 Cucumbers 914.2.6 Watermelon 954.2.7 Melons 99
4.3 Leafy vegetables 1024.3.1 Lamb’s lettuce 1024.3.2 Lettuce 1054.3.3 Rocket and other baby leaf brassica salads 108
4.4 Other vegetables 1104.4.1 Climbing beans 1104.4.2 Kohlrabi 1154.4.3 Radish 1184.4.4 Spring onion 121
4.5 Transplants 1234.5.1 Vegetable transplants 123
4.6 Herbs 1254.6.1 Parsley 1254.6.2 Basil-growninpots 128
4.7 Perennial fruits 1314.7.1 Strawberries 1314.7.2 Raspberries 1354.7.3 Table grapes 1384.7.4 Papaya 1414.7.5 Mango 145
4.8 Ornamentals 1484.8.1 Pelargoniums cultivated in pots 148
5 Appendices 151
5.1 Appendix A: General information 1515.2 Appendix B: Summary table of crop nutrient demand 1525.3 Appendix C: Summary of nutrient content of crop tissues 154
Guidelines for Experimental Practice | 5
Authors
Samih Abu Baker, Jordan. Is a full professor at the department of plant production and protection, Dean of Faculty of Agricultural Technology at Al Balqa` Applied University. He is involved with studies related to sustainability of agriculture and organic farming research aspects. [email protected].
Ingrid Bender, Estonia. A researcher at the Estonian Crop Research Institute. Her work focuses on vegetable breederseedproduction,breeding,varietytrialsandorganictrialsingreenhouseandopenfield.ingrid.bender@etki.ee.
Stella Cubison, United Kingdom. An associate of Garden Organic (formerly HDRA) and fruit researcher. She currently works on an organic fruit farm and is experienced in trials work (varieties, pest and disease monitoring), specialising in apple and strawberry production. [email protected].
Justine Dewitte, Belgium. Works at the Vegetable Research Centre East Flanders (PCG) where she is researcher and advisor. Her work focuses on practically oriented research of organic vegetables under protection, and aromatic plants. [email protected].
Martine Dorais, Canada.SeniorResearchScientistatAgricultureandAgri-FoodCanadaandadjunctprofessorat Laval University. She currently works on organic sustainable production systems for horticultural crops. [email protected].
Jacques Fuchs, Switzerland. Has worked in the Department of Crop Sciences of the research institute of organicagriculture(FiBL)inCH-Frick.Heisspecialisesinthebiologicalqualityofcompost,compostutilizationanddevelopmentofcompostbasedproducts.www.fibl.org,[email protected].
Pedro Gomez, Spain. His main expertise is conservation and development of vegetables varieties in MediterraneangreenhousesatAndalucíaInstituteofAgriculturalTrainingandResearch(IFAPA)[email protected].
Nikki Jennings, United Kingdom. A breeder at the James Hutton Institute in Scotland. She currently works on the commercial raspberry breeding programme and has experience in variety trials and protected cropping.
Frank Kempkes, The Netherlands, Works for over 20 years at Wageningen UR greenhouse horticulture, the department of greenhouse technology. His work focusses mainly on energy saving techniques, covering materials and greenhouse climate. [email protected].
Robert Koch, Germany. Works at the State Horticultural College and Research Institute in Heidelberg. His work focuses on practically oriented research of organic ornamentals crops and herbs. [email protected].
Martin Koller, Switzerland. Works in the extension service of the research institute of organic agriculture (FiBL)inFrick.Amainfocusison-farmexperimentsonplantprotection,varietytrialsandorganicfertilisertestinginvegetableandornamentalscropsandherbs.www.fibl.org,[email protected].
Jérôme Lambion, France. Works at GRAB (Research Group on Organic Farming) in Southern France, as a researcher.Hismainfocusison-farmexperimentsoncropprotection,especiallyfunctionalbiodiversityandbiological control.
Gerben Messelink, The Netherlands, is research entomologist at Wageningen UR Greenhouse Horticulture. His work focuses on evaluation of natural enemies and the development of biological control systems for pests in greenhouse crops. [email protected].
Carolyn Mitchell, United Kingdom. A researcher at the James Hutton Institute. Her work focusses on developing sustainable pest and disease control in perennial and arable crop production.

6 | Guidelines for Experimental Practice
Wolfgang Palme, Austria. Head of department of Vegetable Growing at the Horticultural College and Research Institute in Vienna. His work focuses on vegetable diversity, variety trials and sustainable organic production alternatives. [email protected].
Virginia Pinillos, Spain. Professor in the Department of Agronomy at the University of Almería. Her work focusesonfloweringandfructificationofMediterraneanandsubtropicalfruitcrops,andcurrently,hermainresearch is on protected fruit crops.
Karin Postweiler, Germany. Works at the Experimental Station for Vegetables Queckbrunnerhof, Schifferstadt (DLRRheinpfalz).Hermainfocusisontrialsinorganicfertilizers,weedcontrol,cropcare ([email protected]).
Ellen Richter, Germany. HeadoftheplantprotectionserviceofNorthRhine-Westphalia.Sheisresponsibleforplantprotectioningeneralbutmaininterestisstillvegetableproductionunderfieldandprotectedconditions.ellen.richter@lwk.nrw.de.
Francis Rayns, United Kingdom. Is a Research Associate of Garden Organic (formerly known as the Henry Doubleday Research Association) and Coventry University’s Centre for Agroecology, Water and Resilience (CAWR). He specialises in the soil fertility of organic vegetable systems. www.gardenorganic.org.uk. [email protected].
Ulrich Schmutz, United Kingdom. Is a senior research fellow at Coventry University’s Centre for Agroecology, Water and Resilience (CAWR) and a Research Associate of Garden Organic (formerly known as the Henry Doubleday Research Association). He specialises on organic horticultural and ecological economics. www.coventry.ac.uk/CAWR,[email protected].
Yüksel Tüzel, Turkey. Is a full professor at the Department of Horticulture in Ege University Faculty of Agriculture. She works on protected cultivation mainly on vegetable production through sustainable production [email protected].
Wim Voogt, The Netherlands.IsscientificresearcherattheGreenhouseHorticultureunitofWageningenUniversity and Research. His expertise is on plant nutrition, soils and water, in greenhouse grown crops. [email protected].
Guidelines for Experimental Practice | 7
Preface
In 2008, at the occasion of the 16th IFOAM Organic World Congress in Modena, Italy, about 25 participants expressedtheirinteresttoworktogetherinthefieldofresearchanddevelopmentfororganicgreenhouseorprotectedhorticulture.TomaterializethisatwodayworkshopwasorganisedinColognein2009todiscussthe subject and how a collaboration could be formalised. This was attended by 45 people from all over Europe andfromCanada.Itwasdecidedtoworktogetherinthefieldoforganicprotectedhorticultureconcerningplanting material, soil fertility, water management, disease and pest management, climate control and energy conservation, and sustainability. The group also agreed to submit a COST (European Cooperation in Science and Technology) Action on the same subject. In mid 2011 the proposal Towards a sustainable and productive EU organic greenhouse horticulture, in short, BioGreenhouse, was submitted. At the end of 2011 COST approved this proposal as COST Action FA1105 (see http://www.cost.eu/COST_Actions/fa/FA1105andwww.biogreenhouse.org),whichaimstobuildanetworkofexpertsworkinginthefieldof organic protected horticulture and to develop and communicate, through coordinated international efforts, knowledge for new and improved production strategies, methods and and technologies to support sustainable and productive organic greenhouse/protected horticulture in the EU. This project offered the framework and funds for the experts of the 27 participating COST countries and two COST Neighbouring countries to meet and to work together in Working Groups concerning the objectives of the Action.Oneoftheseobjectivesistodevelopstandardizedmethodsandprotocolsforvarietytestingandforevaluation of seed treatments to enable interchangeability and joint interpretation of research.
Twenty one experts from all over the Action worked together on this objective. They have taken their task/command very seriously, because they have not limited the proposal for these standards to variety testing and seedtreatment,butextendedtheirworktoallfieldsofexperimentalpracticeinorganicgreenhousehorticulture. Together they produced this booklet:Guidelines for experimental practice in organic greenhouse horticulture.
It is an indispensible source of information for all the people and institutes involved in research in organic protected horticulture; for researchers, students, teachers and consultants.On behalf of the COST Action Biogreenhouse I want to thank the team of the authors and editors for the work they have done, their cooperative spirit and their perseverance.This work will certainly contribute to an improved experimentation, collaboration and exchange of information in organic greenhouse horticulture.
Rob J.M.MeijerWageningen UR Greenhouse HorticultureChair, COST Action FA1105 Biogreenhouse

8 | Guidelines for Experimental Practice

Guidelines for Experimental Practice | 9
Abbreviations
EGTOP Expert Group for Technical Advice on Organic ProductionCPVO CommunityPlantVarietyOfficeUPOV International Union for the Protection of New Varieties of PlantsEU European UnionCOST European Cooperation in Science and TechnologyANOVA Analysis of Variancen Number of replicatesha HectareGM Gross marginVC Variable costsO Output(financial)Y YieldP PriceISHS International Society for Horticultural ScienceBBCH Biologische Bundesanstalt, Bundessortenamt und Chemische Industrie
(a type of key used to describe plant growth stages)PAR Photosynthetically active radiationUV Ultra violetdS Deci Siemens μS Micro Siemensv/v Volume/volumem/m Mass/massTDR Time-domainreflectometryAEI Agro Ecological InfrastructureEC Electrical conductivityPAR Participatory action researchDM Dry matter

10 | Guidelines for Experimental Practice

Guidelines for Experimental Practice | 11
1 Introduction
By Martin Koller, Francis Rayns and Ulrich Schmutz
The aim of this handbook of experimental guidelines is to help conduct experiments for organic horticulture in greenhouses throughout Europe. It considers vegetables, fruit and ornamental production. Using standardised research procedures for experiments will aid a comparison of results and dissemination of knowledge. The editorshavetriedtoincorporateasmanyclimaticzones,countriesandcropsaspossibleinordertorepresentawideareaofEuropealthoughsomesmallercropsorcertainspecificclimatescouldnotbeincluded.
The term greenhouse will be used in these guidelines in accordance with the EGTOP report on organic cultivation in greenhouses as follows (EGTOP, 2013): "All permanent structures, with or without heating, covered by glass or plastic or other material that lets daylight through, in which crops, transplants or ornamentals are cultivated, are considered as ‘greenhouses’". Usually only glass structures are heated (see Figure 1.1 and 1.2). In contrast tothetermgreenhouse“undercover“wouldmeancroppinginlowplastictunnels(cloches),floatingrowcoversorflatlayersofplasticfleeceormesh(showninFigures1.4and1.5).
Figure 1.1 A typical greenhouse/glasshouse structure, in this case with a renewable heating boiler.

12 | Guidelines for Experimental Practice
Figure 1.2 Polytunnels, either permanently covered (left) or with removable covers (right).
Figure 1.3 Temporary field coverings, either supported on hoops (left) or loose (right).
These guidelines were inspired by a handbook written in 2006 for German speaking countries in Central Europe. The title of this is “Planung, Anlage und Auswertung von Versuchen im Ökologischen Gemüsebau. Handbuch für die Versuchsanstellung” (Planning, Setup and Evaluation of Trials on Organic Vegetable Cultivation. An ExperimentalDesignManual).WiththesupportofEUCOSTactionBioGreenhouse(FA1105)from2012-2016this text has been largely rewritten with many new chapters from European and international authors. It now includes organic fruit crops (soft fruit and top fruit), important aspects of organic systems like green manure crops and a description of economic analysis and participatory research methods.
The guidelines are intended to help when planning and designing research for organic production systems, especially for young researchers or researchers who have to deal with a new crop. Moreover, they should help an experienced researcher to think of the important points on a certain experiment. Naturally not all aspects can becoveredinsuchguidelinesandnotallmethodspresentedmaybeapplicableforaspecificresearchquestionor approach. Sometimes the recommendation (e.g. on the minimum number of replications when using mature trees) cannot be followed and compromises in the research design are necessary, but equally the minimum replicationsshouldbeexceededwerepossibletoproducemorestatisticallysignificantresults.
Even if some information about the crop management is provided, these guidelines cannot be a substitute for a good growing handbook or growing experience – nor will they cover all aspects in each region of the European Union and the neighbouring countries. We therefore advise researchers (and students) to read, in addition to these guidelines, a textbook on organic growing of the relevant crop and to speak to experienced growers before setting up an experiment.
Guidelines for Experimental Practice | 13
2 Trials in Organic Horticulture
By Martin Koller, Francis Rayns and Ulrich Schmutz
Apre-conditionfortrialsconcerningorganicvegetableandfruitcropsistheEUregulation834/2007onorganicfarming, or any other equivalent regulation in countries outside the EU. Inside the EU, in addition to the public(legallybinding)EUstandard,privatestandardsofcertificationbodiesdefiningorganicorbio-dynamicproductionarealsorelevant.Researchshouldalwaysbeconductedonwell-establishedorganicland(ideallyconverted for at least 5 years), and the history of conversion should be documented in the Materials and Methods section of any report (for research studying the process of conversion this is obviously not applicable).
If the research involves methods and products which are currently not part of organic standards (public or private)theprotocolhastobediscussedwiththecertificationbodyfirst.Inthecaseofon-farmtrialsthefarmeralsoneedstobeinvolved.Priorapprovalfromthecertificationbodyandwrittendocumentationontheextentofthe trials and the new methods tested should always be kept.
2.1 Separation from conventional cropping
Inanyorganicresearchcarehastobetakentoavoidtheinfluenceofanyadjacentconventionalfarmingorhorticulture-forexamplespraydriftofherbicidesorotherpesticides.Foroutsidecroppingadistanceof10morahighphysicalbarrier(suchasamaturehedge,stonefieldwallorsolidwoodenfenceisacceptedassufficient).Theissueisoflesssignificanceinprotectedhorticulturebutconsiderationneedstobegiventothedangerofcontamination through windows open for ventilation etc.
2.2 Crop rotation and plant material
The guidance given in the organic standards on crop rotation, the use of green manures and other good practice in organic soil care should also be used for all organic research trials and this includes those in polytunnels and greenhouses. The full crop rotation history for at least 3 years, including any fallow periods should always described in the Materials and Methods of the trial reports. If trials use potted plants or nursery stock details of the origin and composition of the growing media are important. Seeds and transplants should be from an organic source.Ifnoneareavailableaderogationfromthecertificationbodyisoftenrequiredandconventionalseedswithout chemical seed treatments are usually acceptable.
The crop grown immediately before the trial should be as uniform as possible and any plants propagated for the trial should be equally treated under the same standardised nursery conditions as documented in the Materials and Methods. For organic fertiliser trials the land should be cropped for at least 2 years beforehand with high nutrient demanding crops (and the crop residues removed) in order to deplete the fertility.
Themicroclimatehasanimportanteffectoncropperformance.Thisisnotonlythecaseinthefieldbutisparticularly important in polytunnels and greenhouses. Factors include the effects of walls, heating pipes, positionoftheplants(inthemiddleorendofthehouse),generalsettingofthehouse(inanorth-southoreast-west direction), temperature of the irrigation water and radiation from different surface materials.
2.3 Trial designs
Thereisnormallyadistinctionbetween‘demonstration’and‘scientific’trials.Theformerareoftenunreplicatedand are therefore smaller, easier (and cheaper) to run and may be linked to open day events aimed at farmers or apilotstudyinadvanceformoredetailedwork.Resultsfromsuchtrialsarenotusuallyacceptableforscientificpublication where replication allows statistical analysis to be performed to show that any differences between treatments are not just due to random variations in the experimental area.
14 | Guidelines for Experimental Practice
Despite care full homogeneity can rarely be achieved and any known gradients should be incorporated into thetrialdesign.Thiscanbedonebyhavingrandomizedblockswithalltreatmentsplacedalongthegradientorgradientsofchange(seesection2.3.5).Ahighernumberofreplicationscanalsobeusedifthefieldorgreenhouse is very heterogenic.
Border plants, strips or plots (‘guard areas’) can be used to separate the research trial area from other land butalsotoseparatedifferenttreatments.Theappropriatesizeoftheborderdependsontheresearchquestion.Variety trials usually require no borders between treatments unless plants with different harvest times are tested.Forfertiliser,plantprotectionandirrigationtrials(especiallyifthesearerunforseveralyears)asufficientborder between treatments is necessary to avoid one plot affecting its neighbours (perhaps as a result of mixing of soil during cultivations).
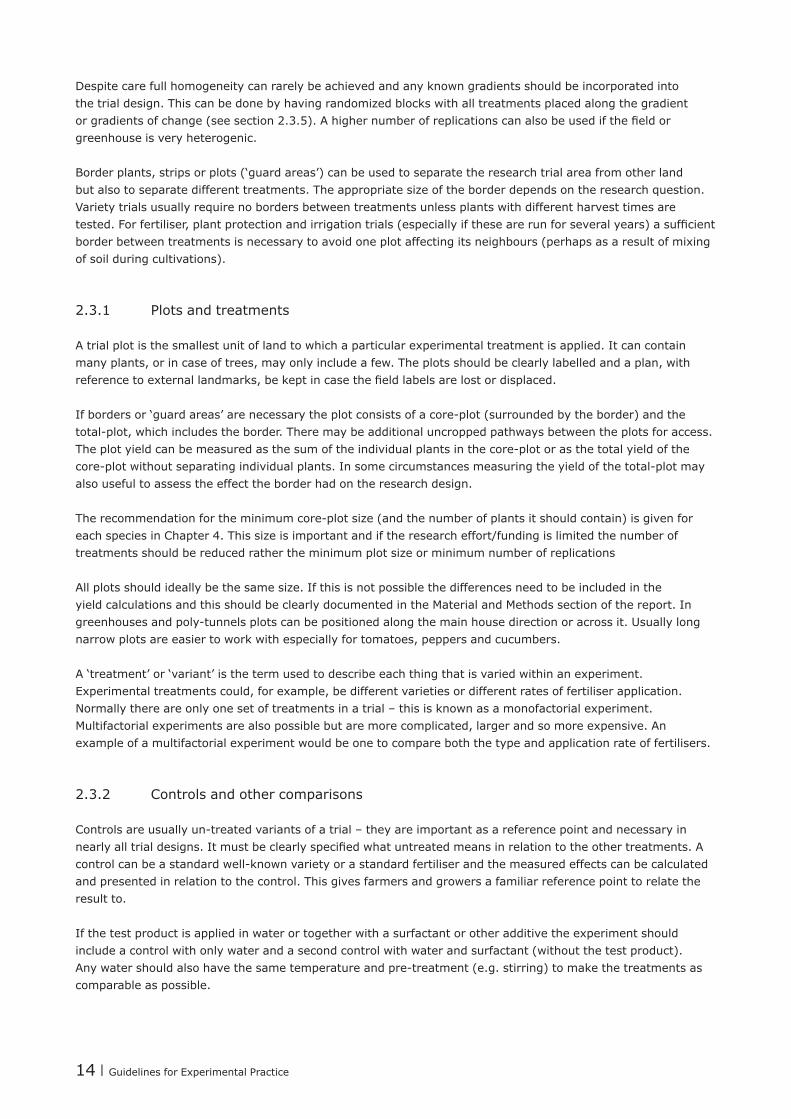
2.3.1 Plots and treatments
A trial plot is the smallest unit of land to which a particular experimental treatment is applied. It can contain many plants, or in case of trees, may only include a few. The plots should be clearly labelled and a plan, with referencetoexternallandmarks,bekeptincasethefieldlabelsarelostordisplaced.
Ifbordersor‘guardareas’arenecessarytheplotconsistsofacore-plot(surroundedbytheborder)andthetotal-plot,whichincludestheborder.Theremaybeadditionaluncroppedpathwaysbetweentheplotsforaccess.Theplotyieldcanbemeasuredasthesumoftheindividualplantsinthecore-plotorasthetotalyieldofthecore-plotwithoutseparatingindividualplants.Insomecircumstancesmeasuringtheyieldofthetotal-plotmayalso useful to assess the effect the border had on the research design.
Therecommendationfortheminimumcore-plotsize(andthenumberofplantsitshouldcontain)isgivenforeachspeciesinChapter4.Thissizeisimportantandiftheresearcheffort/fundingislimitedthenumberoftreatmentsshouldbereducedrathertheminimumplotsizeorminimumnumberofreplications
Allplotsshouldideallybethesamesize.Ifthisisnotpossiblethedifferencesneedtobeincludedintheyield calculations and this should be clearly documented in the Material and Methods section of the report. In greenhousesandpoly-tunnelsplotscanbepositionedalongthemainhousedirectionoracrossit.Usuallylongnarrow plots are easier to work with especially for tomatoes, peppers and cucumbers.
A ‘treatment’ or ‘variant’ is the term used to describe each thing that is varied within an experiment. Experimental treatments could, for example, be different varieties or different rates of fertiliser application. Normally there are only one set of treatments in a trial – this is known as a monofactorial experiment. Multifactorial experiments are also possible but are more complicated, larger and so more expensive. An example of a multifactorial experiment would be one to compare both the type and application rate of fertilisers.
2.3.2 Controls and other comparisons
Controlsareusuallyun-treatedvariantsofatrial–theyareimportantasareferencepointandnecessaryinnearlyalltrialdesigns.Itmustbeclearlyspecifiedwhatuntreatedmeansinrelationtotheothertreatments.Acontrolcanbeastandardwell-knownvarietyorastandardfertiliserandthemeasuredeffectscanbecalculatedand presented in relation to the control. This gives farmers and growers a familiar reference point to relate the result to.
If the test product is applied in water or together with a surfactant or other additive the experiment should include a control with only water and a second control with water and surfactant (without the test product). Anywatershouldalsohavethesametemperatureandpre-treatment(e.g.stirring)tomakethetreatmentsascomparable as possible.
Guidelines for Experimental Practice | 15
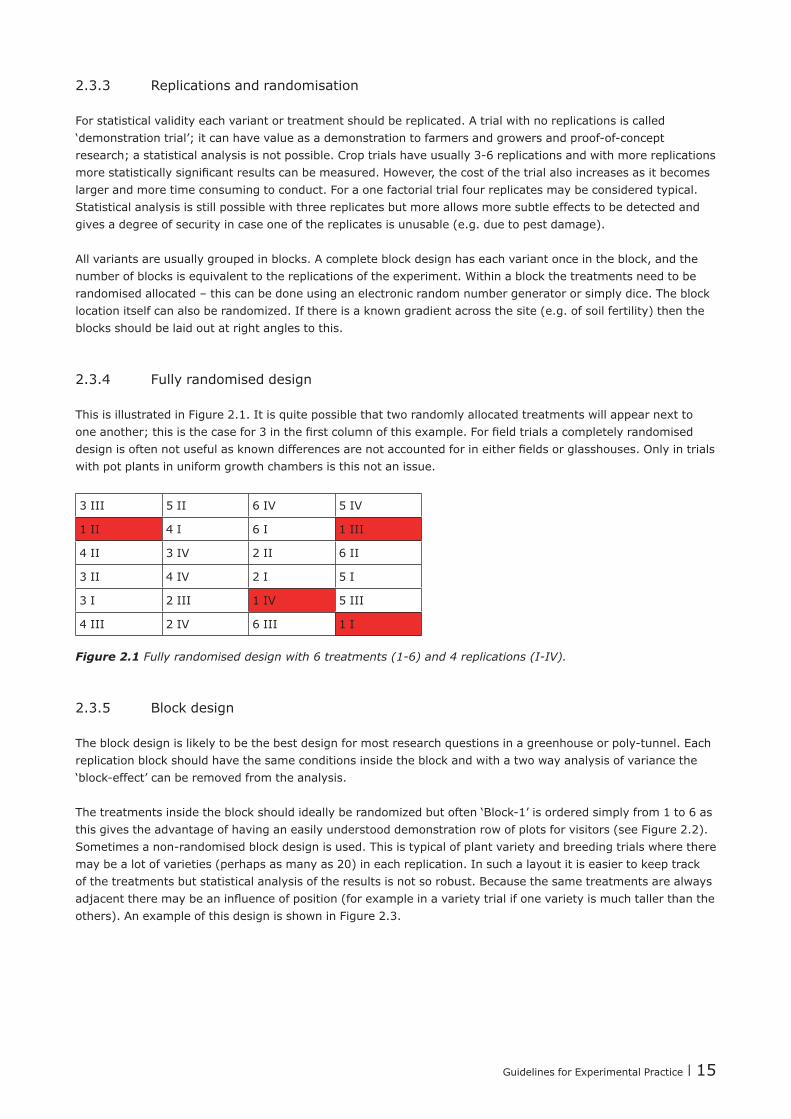
2.3.3 Replications and randomisation
For statistical validity each variant or treatment should be replicated. A trial with no replications is called ‘demonstrationtrial’;itcanhavevalueasademonstrationtofarmersandgrowersandproof-of-conceptresearch;astatisticalanalysisisnotpossible.Croptrialshaveusually3-6replicationsandwithmorereplicationsmorestatisticallysignificantresultscanbemeasured.However,thecostofthetrialalsoincreasesasitbecomeslarger and more time consuming to conduct. For a one factorial trial four replicates may be considered typical. Statistical analysis is still possible with three replicates but more allows more subtle effects to be detected and gives a degree of security in case one of the replicates is unusable (e.g. due to pest damage). All variants are usually grouped in blocks. A complete block design has each variant once in the block, and the number of blocks is equivalent to the replications of the experiment. Within a block the treatments need to be randomised allocated – this can be done using an electronic random number generator or simply dice. The block locationitselfcanalsoberandomized.Ifthereisaknowngradientacrossthesite(e.g.ofsoilfertility)thentheblocks should be laid out at right angles to this.
2.3.4 Fully randomised design
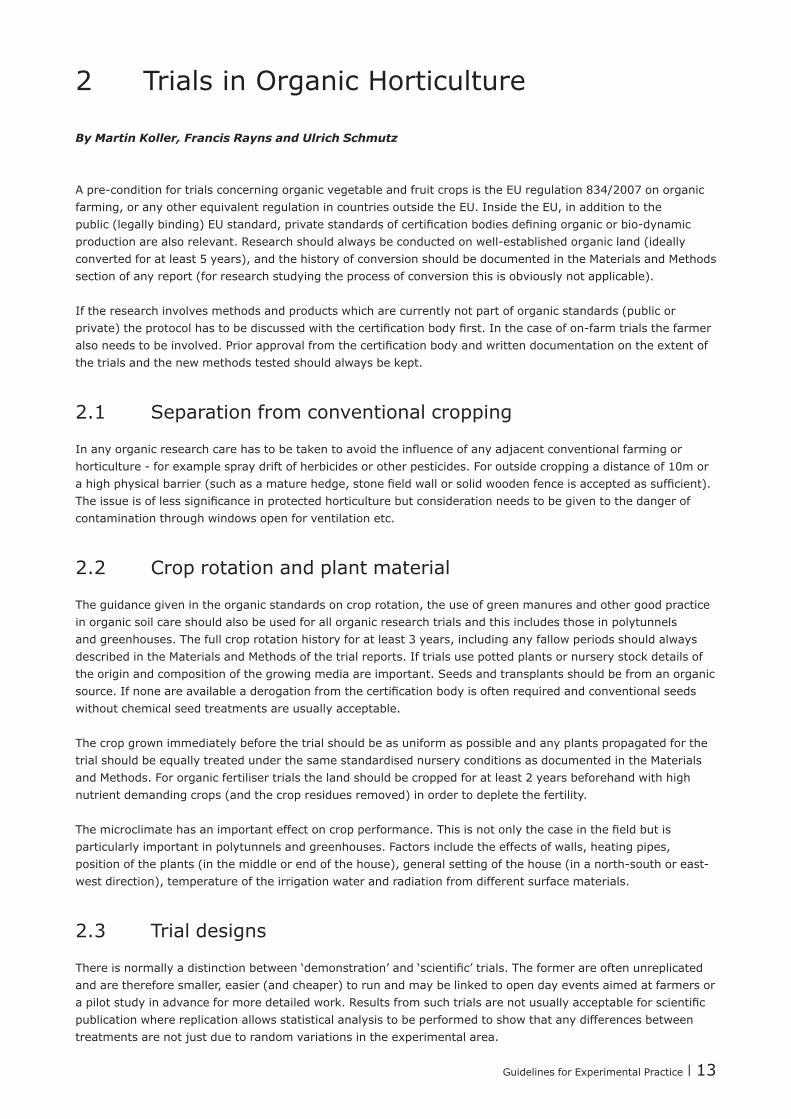
This is illustrated in Figure 2.1. It is quite possible that two randomly allocated treatments will appear next to oneanother;thisisthecasefor3inthefirstcolumnofthisexample.Forfieldtrialsacompletelyrandomiseddesignisoftennotusefulasknowndifferencesarenotaccountedforineitherfieldsorglasshouses.Onlyintrialswith pot plants in uniform growth chambers is this not an issue.
3 III 5 II 6 IV 5 IV
1 II 4 I 6 I 1 III
4 II 3 IV 2 II 6 II
3 II 4 IV 2 I 5 I
3 I 2 III 1 IV 5 III
4 III 2 IV 6 III 1 I
Figure 2.1 Fully randomised design with 6 treatments (1-6) and 4 replications (I-IV).
2.3.5 Block design
Theblockdesignislikelytobethebestdesignformostresearchquestionsinagreenhouseorpoly-tunnel.Eachreplication block should have the same conditions inside the block and with a two way analysis of variance the ‘block-effect’canberemovedfromtheanalysis.
Thetreatmentsinsidetheblockshouldideallyberandomizedbutoften‘Block-1’isorderedsimplyfrom1to6asthis gives the advantage of having an easily understood demonstration row of plots for visitors (see Figure 2.2). Sometimesanon-randomisedblockdesignisused.Thisistypicalofplantvarietyandbreedingtrialswheretheremay be a lot of varieties (perhaps as many as 20) in each replication. In such a layout it is easier to keep track of the treatments but statistical analysis of the results is not so robust. Because the same treatments are always adjacenttheremaybeaninfluenceofposition(forexampleinavarietytrialifonevarietyismuchtallerthantheothers). An example of this design is shown in Figure 2.3.

16 | Guidelines for Experimental Practice
6 I 1 II 3 III 6 IV
5 I 3 II 2 III 1 IV
4 I 4 II 5 III 2 IV
3 I 6 II 4 III 5 IV
2 I 2 II 1 III 3 IV
1 I 5 II 6 III 4 IV
Block I Block II Block III Block IV
Figure 2.2 Block design with 6 treatments (1-6) and 4 replications (I-IV) randomised in Blocks II to IV.
6 I 5 II 4 III 3 IV
5 I 4 II 3 III 2 IV
4 I 3 II 2 III 1 IV
3 I 2 II 1 III 6 IV
2 I 1 II 6 III 5 IV
1 I 6 II 5 III 4 IV
Block I Block II Block III Block IV
Figure 2.3 Block design with 6 treatments (1-6) and 4 replications (I-IV) in a fixed order.
2.3.6 Latin Square design
The Latin square, or rectangle if plots are longer then wide, is a special form of block design. With this design the effect of both block and column can be measured. For a true Latin square the number of treatments should be the same as the number of replications. Then each treatment is found once in each block and each column. If the numberofreplicationislimitedtofoura‘modified’Latinsquareispossible,howeverthisalsolimitsthepowerofthe statistical analysis considering block and row effects. An example is shown in Figure 2.4.
Block IV 4 IV 3 IV 2 IV 5 IV
3 III 2 III 1 IV 6 IV
Block III 6 III 1 III 5 III 4 III
Block II 5 II 4 II 3 II 1 II
5 I 6 I 6 II 2 II
Block I 1 I 2 I 3 I 4 I
Column A Column B Column C Column D
Figure 2.4 'Modified' Latin square with 6 treatments and 4 replications, showing four blocks (I-IV) and four columns (A-D).
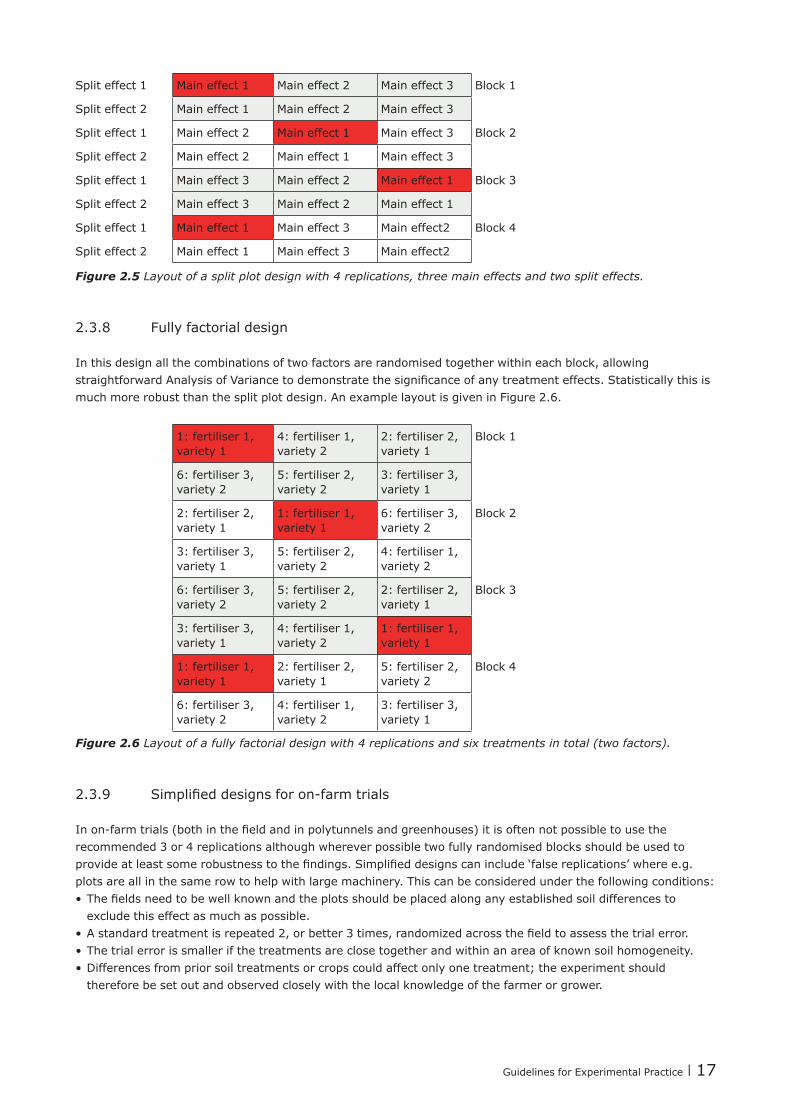
2.3.7 Split plot design
This allows for the testing of two factors in combination. These are known as the main effect and the split effect. An example might be the effect of different fertilisation effects on two different varieties of a glasshouse grown crop (see Figure 2.5). Because all the different treatment combinations are not fully randomised statistical tests requiretheretobebiggereffectsbeforetheycanbeshowntobesignificant.However,splitplotdesignscanbeeasier to manage than fully factorial layouts.
Guidelines for Experimental Practice | 17
Split effect 1 Main effect 1 Main effect 2 Main effect 3 Block 1
Split effect 2 Main effect 1 Main effect 2 Main effect 3
Split effect 1 Main effect 2 Main effect 1 Main effect 3 Block 2
Split effect 2 Main effect 2 Main effect 1 Main effect 3
Split effect 1 Main effect 3 Main effect 2 Main effect 1 Block 3
Split effect 2 Main effect 3 Main effect 2 Main effect 1
Split effect 1 Main effect 1 Main effect 3 Main effect2 Block 4
Split effect 2 Main effect 1 Main effect 3 Main effect2
Figure 2.5 Layout of a split plot design with 4 replications, three main effects and two split effects.
2.3.8 Fully factorial design
In this design all the combinations of two factors are randomised together within each block, allowing straightforwardAnalysisofVariancetodemonstratethesignificanceofanytreatmenteffects.Statisticallythisismuch more robust than the split plot design. An example layout is given in Figure 2.6.
1: fertiliser 1, variety 1
4: fertiliser 1, variety 2
2: fertiliser 2, variety 1
Block 1
6: fertiliser 3, variety 2
5: fertiliser 2, variety 2
3: fertiliser 3, variety 1
2: fertiliser 2, variety 1
1: fertiliser 1, variety 1
6: fertiliser 3, variety 2
Block 2
3: fertiliser 3, variety 1
5: fertiliser 2, variety 2
4: fertiliser 1, variety 2
6: fertiliser 3, variety 2
5: fertiliser 2, variety 2
2: fertiliser 2, variety 1
Block 3
3: fertiliser 3, variety 1
4: fertiliser 1, variety 2
1: fertiliser 1, variety 1
1: fertiliser 1, variety 1
2: fertiliser 2, variety 1
5: fertiliser 2, variety 2
Block 4
6: fertiliser 3, variety 2
4: fertiliser 1, variety 2
3: fertiliser 3, variety 1
Figure 2.6 Layout of a fully factorial design with 4 replications and six treatments in total (two factors).
2.3.9 Simplifieddesignsforon-farmtrials
Inon-farmtrials(bothinthefieldandinpolytunnelsandgreenhouses)itisoftennotpossibletousetherecommended 3 or 4 replications although wherever possible two fully randomised blocks should be used to provideatleastsomerobustnesstothefindings.Simplifieddesignscaninclude‘falsereplications’wheree.g.plots are all in the same row to help with large machinery. This can be considered under the following conditions:•Thefieldsneedtobewellknownandtheplotsshouldbeplacedalonganyestablishedsoildifferencesto
exclude this effect as much as possible.•Astandardtreatmentisrepeated2,orbetter3times,randomizedacrossthefieldtoassessthetrialerror.•The trial error is smaller if the treatments are close together and within an area of known soil homogeneity.•Differences from prior soil treatments or crops could affect only one treatment; the experiment should
therefore be set out and observed closely with the local knowledge of the farmer or grower.

18 | Guidelines for Experimental Practice
This approach is particularly suited to preliminary screening work, for example to see if a new crop will grow at allinaparticulararea.Iftheresultsarepromisingamoredetailedscientifictrialwithgraterreplicationcanbeset up later. During the data analysis the following considerations are important:•Analyse the repeated treatment separately. If the ‘false replications’ within one row are not statistically differentitcanbeassumedthatnomajorexternalinfluencefactorsexistandthatthedifferencesmeasuredindifferent treatments are mainly caused by the different treatments.
•Ifsignificantdifferencesarefoundbetween‘falsereplications’theinterpretationofthewholeon-farmexperiment has to be careful and descriptive, and all results of the statistical analysis have to be fully disclosed.
•If treatment data are presented in graphs the lack of a statistical analysis should be indicated in the description of the graph. If ‘false replications’ are used only mean values and standard deviation should be shown.
Additionalstatisticalanalysistoolscanbeusedifnon-replicatedon-farmtrialsareconductedovermanysitesandmultipleyears.Thisisalsothecasewhentreatmentsareincreasedinfixedsteps,e.g.compost:1t/ha,2 t/ha, 3 t/ha, 4 t/ha = four different treatments of compost with increasing tonnage per hectare. There is increasinginterestinresearchworkdoneusinga‘citizenscience’approach(seesection3.7)
2.4 Recording results
In the Materials and Methods section of any report all general information concerning the research trial must be documented. This can include location, site details (rainfall, altitude, water quality, nitrogen deposition through air, etc.), the organic status of the land, prior use, type of greenhouse, type of glass or plastic, research design, lengthandexactdatesoftrialandotherrelevantinformation.Soiltypeandresultsfromsoilsamples(macro-andmicro-nutrients)beforeandafterthetrialarealsoimportantifrelevanttotheresearchquestion.
Details on the weather conditions before and during the trial should also be provided and these include min/max soil and air temperature, sunshine hours, irradiation, humidity, wind speed. Within the greenhouse additional data on relative humidity, additional lighting type/amount, CO2 contents, heating type/source, and sun/heat screens usage are required.
For the crop cultivation as much information as possible should be recorded including, variety, rootstock, scion,sourceofplant,seed-treatments,seedingorplantingtime,typeofgrafting,plantdensity,plantingdateand further cultivation operations such as leaf pruning, weeding or pest control. Fertiliser additions should be recorded and the source, amount and method of application should be clearly documented. This also includes type of irrigation water used, any fertigation (supply of nutrients in the irrigation water), CO2 enrichments or climate control to enrich CO2.
2.4.1 Recording information
Plant records can be made by weighing, measuring heights or lengths, counting (e.g. number of stems of fruits per m² or per plant). They can also be done by rating against an agreed scale (e.g. pest per percentage of leaf area,orpercentageleafareawithsymptoms).Ratingisoftendoneonascaleof1-9(or1-5).Measurementsandratingsforaspecificrecordshouldalwaysbedonebythesamepersonforthewholetrial,asthisreducesthe overall measurement error.
Guidelines for Experimental Practice | 19
In ratings 1 is usually used for the lowest intensity of a trait and 9 for the highest. The optimal rating and the scaleused(e.g.ifshortenedto1-3-5-7-9)mustbedocumented.TheCommunityPlantVarietyOffice(CPVO, www.cpvo.europa.eu) and the International Union for the Protection of New Varieties of Plants (UPOV, www.upov.int) describes technical protocols for all the important horticultural species that include reference to such scales for a variety of characteristics. Information from both organisations is very similar but that from UPOV is available in more languages. Further details are given in the chapters for individual crops. For statistical analysis quantitative measurements are better than ratings but both give valuable information. However ratings should not be used to record information which could easily be collected by measurement (especially in the case of crop yields. Taking pictures can also help to illustrate differences. In some trials simple assessments ofphysicalparameters(e.g.fruitfirmness,colour)orchemicalparameters(e.g.sugarcontentmeasuredbyrefractometers) are worthwhile.
2.4.2 Missing values
A missing value can be the loss of a plant, a plot or even a whole block of the experiment. All missing values need to be recorded and honestly reported in the research report. The reasons for missing values can be manifoldandthemostcommononesareflooding,animalseatingcrops,applicationerrorsandlossofdata.Croplosses due to the actual treatments are not missing values.
If there are too many missing values the statistical analysis of the data is affected and a very large amount of missing values can make the whole experiment useless for statistical analysis. Under certain circumstances bordercropsoutsidethecore-plotcanbeusedintheanalysisasasubstitutebutthisisnotgoodpracticeandmust be clearly documented.
2.4.3 Harvest records
During the growing phase and at harvest all relevant biotic and abiotic stresses and damage to the plants need to be recorded. The harvest should include total yield and marketable yield, with details of the EU or other privateretailbasedtradeclassificationusedtomakethisdistinction.Themarketableyielddependsonthemarketchannelandusuallyfourtypesofmarketchannelareapplicabletoorganiccrops:directsales,small-scaleretail,supermarketsandprocessing.Whilefordirectsalesandprocessingnotradeclassificationapplies(totalyield=marketableyield)forotherchannelsthereareclearspecificationsanddifferentpricesforClass1 or Class 2 produce. It is important to record these differences as it is the marketable yield which interests farmers and growers most. Normally the whole trial should be harvested at the same time. There are exceptions however, for example if the harvest date itself is part of the research question.
2.4.4 Time measurement
If new processes or growing techniques are being researched measuring the time needed for application (including preparation time) needs to be recorded. This can be done by using stopwatches or smartphones and data can later be expressed in labour hours per m2 or hours/ha. It is important that only one person, or one team of people, makes these measurements in all the treatments.
20 | Guidelines for Experimental Practice
Example 1: Timing tomato harvest (in a trial with different plant densities)Measurements:•Harvest time (seconds)•Total number of harvested fruit•Shoots per treatment•Fruits per shoot•From this data the following can be calculated:•Harvest time per fruit (seconds)•Harvested fruit per hour•Harvested shoots per hour•Labour hours per hectare or m2
Example 2: Timingforweedcontroltreatment(inatrialtocomparefleeceversusuncoveredsoil)Measurements:•Hand weeding time (seconds)•Number of plants per plot•Number of weeds per plot•From this data the following can be calculated: •Hand weeded plants per hour•Removed weeds per hour•Labour hours per hectare or m2
For further agronomic and economic calculations data from reference material such as farm management handbookscanbeusedtoincludemachinerycosts,fertilisercostsandlabourcostsfor‘what-ifs’,i.e.ifdoneonacommercial scale and not in a plot scale. Further information on this can be found in the chapter on the economic evaluation of crop trials.
2.5 Data analysis and statistics
Data should be collected in clear record sheets (on paper or electronically) and all data must be correctly allocated to the particular treatment. Common problems are typing or reading errors, decimal points being accidently moved, double entries, missed records, rounding data or missing digits and a general lack of concentration. Human error in data recording and analysis cannot be eliminated but it can be minimised by good experimental practices.
Datacleaningandcheckingisbestdonewithinaspread-sheetsoftwareprogramme(e.g.MicrosoftExcel).Someofthemistakesdescribedabovecanbespottedinadatascreeningexercisewhereextremevaluesarecross-checked,anddatacanbesortedtofinddoubleentriesorotherunusualentries.Whenenteringdatainaspread-sheetitisusefultoimmediatelycalculatemean,median,standarddeviationandstandarderrorinpredefinedformulas, as this can give extra check on typing errors. This descriptive statistics can also give guidance on further statistical methods to be used during the analysis.
2.5.1 Plot values
Yielddatafromplotareashavetobeconvertedtostandardmetricareaunits-usually1m²,1000m²or1ha.Itisimportanttodistinguishbetweenthecore-plotareaandthetotal-plotarea.Bordersorpathwaysspecificallyassociated with an experiment have to be excluded when calculating commercial yields but access ways that are normally part of the cropping system (e.g. tractor wheelings) should be included. Usually yields per ha are appropriateforfieldcropsandsomepoly-tunnelsandyieldsperm²forgreenhousesandsomepolytunnels.

Guidelines for Experimental Practice | 21
2.5.2 Statistical analysis
The data from experimental trials are usually analysed with the ANalysis Of VAriance (ANOVA) methods. This is a collection of statistical methods to differentiate between treatment means and the variation among and betweentreatments.ThemethodwasdevelopedbyRonaldFisherandfirstpublishedinthe1920s.TheF-test,namedafterhim,isusedtofindoutifthevarianceofatreatmentisdifferenttothevarianceoftheremainder.Othertestsexistifthemeansarenot‘normally’distributed(e.g.theKruskal-Wallistest).Itmaybenecessarytomathematically‘transform’somedatasetstomakethemappropriatebeforeanalysis.FollowingontheF-test,furthertestsliketheTukey-testcanbeusedtofindmeansthataresignificantlydifferentfromeachother.Those differences are marked with different letters in graphs or tables. Further statistical tests, correlation and regression analysis are also possible if the data are suitable for such analysis.
If in doubt about the correct statistical analysis method to use it is worthwhile seeking the advice of a statistician.Thisshouldbedonebeforetheexperimenthasbeensetuptoconfirmthatthedesignisappropriateto generate the data needed to test the hypothesis.
Further informationGrafen A. And Hails R. (2002).
ModernStatisticsfortheLifeSciences.OxfordUniversitypress.ISBN978-0-19-925231-2Zar, J. H. (2010).
BiostatisticalAnalysis,5thed.,PearsonPrenticeHall,UpperSaddleRiver,NJ.ISBN:978-0-13-100846-5
2.6 Writing up an experimental report
Reportswillvarydependingontherequirementsoftheinstitutionandthefundingbodyandthesizeoftheproject;afinalreportofatrialrunningforseveralyearswillclearlycontainmoreinformationthananinterimreport. However, most reports will include the following sections that are also usually found in academic papers.
Introduction and backgroundThe focus of the introduction section of the report is the research question and how it is embedded in the background of existing knowledge. What is the framework of the research and which underlining assumptions have been made? What are the overall aims of the research, how can it contribute to new knowledge and who will use this knowledge (e.g. private companies, academic institutions, farmers and growers, consumers)?
Materials and methodsThe report should explain the choice of methods used to assess the research question and then describe the materialsandmethodsusedintheexperimentaltrialwithsufficientdetailtoenableittoberepeated:Trial design (e.g. block or Latin square), number of replications (usually called n=4 for 4 replications), plants per plot,plotsize,plantdensity,boardersandsizeofcore-plot,generalbackgroundonthesiteintermsoflocation,climate, soil, cropping history, organic status.Short but comprehensive summary of all trial details, treatments and operations including dates.Short,butcomprehensivesummaryofcropdatalikeplantvariety,propagation,pre-treatments,pruning,fertiliser etc. which could affect the results of the trial.Description of all assessment methodology. This is particularly important when there is chemical analysis of soil or plant materials as different techniques will give quite different results.
Results and discussionThe interpretation of results should be written in simple readable text with useful observations and descriptive data from scoring sheets and pictures. This qualitative description should be combined with the presentation of quantitativedatafromthestatisticalanalysis.Itisimportanttoreportthequantitativedataasun-biasedfirstand then offer an interpretation. The reason for this is that the reader may come to a different interpretation of the data than the author of the report. Authors sometimes have a selective view towards ‘good results’ they arehopingfor.However,anyresultisa‘goodresult’ifachievedwithapre-definedresearchmethodfollowingarigorous procedure. Graphs and tables are appropriate tools to present results clearly and compactly.

22 | Guidelines for Experimental Practice
Appropriate and clearly labelled scales are important (e.g. logarithmic for growth functions) and graph types should be chosen to avoid optical illusions. In a discussion sections the personal view and interpretation of the authors (called ‘expert knowledge’) are valuable information to the reader; they should however be clearly indicated as such and separated from the pure description of the results and this includes personal value judgements in the description of results like “treatment x had an ‘a much more important’ effect”. Methods and experiments that failed should also be described.
ConclusionsKeyfindingsortheresearchshouldbepresented.Thiswillshowhowtheresultscanbemadeuseofbygrowersand identify the need for any further research work.
Acknowledgements Acknowledgementsshouldincludeallstaffinvolved,frompicturecreditstofieldandgreenhousestaff,tolab,statisticalandproofreadingsupport.Iffarmergroupsorcitizenswereinvolvedinsettingtheresearchquestionor collecting results this should also be acknowledged.
ReferencesAll academic or ‘grey’ literature cited in the text should be clearly listed.
Summary or abstractAshort(oneortwopage)summaryoftheworkthatbrieflycoverswhatwasdoneandthemainfindingsisusefulfor people who do not have time to read the full version, especially for commercial producers for whom the resultsmayberelevant.Thismaybedistributedasaleafletormadeavailableonawebsite.Insuchacaseeveryeffort should be made to avoid unnecessary jargon.

Guidelines for Experimental Practice | 23
3 Key Types of Experiments
3.1 Crop variety trials
3.1.1 Variety comparison experiments
By Ingrid Bender
RequirementsThe tests should be carried out under soil and environmental conditions that ensure satisfactory growth and developmentofthecropconcerned-theseareexplainedintheguidelinesfortheindividualvegetablespeciesinChapter 4.
Make sure that all varieties are maintained under the same light, temperature and humidity conditions. The sowing and transplanting must be done at the optimum time and take case to avoid mixing the varieties. When transplanting is used make sure that uniform, strong and healthy plants are planted. If, after transplanting, a plantdies,replantingareplacementispossibleduringfirstfewdays.Toavoidshocksfortheyoungplantstheyshould be hardened off before transplanting.
Operations such as the preparation of growing media, sowing or planting, harrowing, pruning, etc. should be carried out and completed, if possible, on the same day and under the same weather conditions. If this cannot bedoneacompletetrialreplicationorblockshouldbefinished. Phytosanitary measures and weed control should be done according to ordinary local practice. The irrigation should be adapted to the plant species, growth stage, soil type and climatic conditions. It is important to ensure a uniform distribution of water; preferably irrigate at night or in calm weather.
Figure 3.1 Left, a lettuce variety trial; Right, evaluation of radish characteristics.
24 | Guidelines for Experimental Practice
Experimental design of variety trialsVariety trials are usually monofactorial and set up as a block design or as a Latin square. If different harvest times are expected (e.g. for radish and salads), a buffer should be planted around the experimental plots. The desired number of plants per m/m2correspondstothepracticeincommercialcultivationandisspecifiedatthespecificguidelinesoftheindividualvegetables(seeChapter4).Atleastthreereplicationsarerecommendedfor fruit vegetables and four for leafy vegetables (as the plots for these are normally smaller and more replicates are easier to establish). The minimum number of plants per variety should be chosen according to the recommendation of CPVO (www.cpvo.europa.eu).
Variety screeningForsomeresearchquestions(e.g.breeding,pre-screening),avarietytrialasdescribedaboveisoftentootime consuming or limited by the available facilities. In such cases a screening trial with less plants and less replicates could be performed. However, the results of such experiments should be interpreted carefully and the methodological constraints should be mentioned in the experimental report.
Pest and disease assessments (see section 3.4)The assessment of infection of any pests and diseases should be carried out at what is likely to be the time of their maximum severity. If the problem subsequently increases the assessment should be repeated.
Observations before harvestTorecordtheresultsofthescoringandharvestingtheformsoftheCommunityPlantVarietyOffice(CPVO)orthe International Union for the Protection of New Varieties of Plants (UPOV) should be used. These recommend that two independent cropping cycles (normally repeated in the same place) are grown and monitored before any conclusions can be drawn.
Monitoringduringtheperiodofcropgrowthprovidesareliable,in-depthevaluationofthevarietiesandsupplements the yield measurements. The assessments that are appropriate will vary and are given in the guidelines for each plant species. Plant features and characteristics are usually scored, at strategic dates, on a scale1to9asquantitativemeasurementsareoftendifficult.Assessmentsarealwayscarriedoutonallinthewholetrial.Thedateofstrategiceventsinthelifeofthecrop(e.g.flowering,fruitset)shouldberecorded.Ifmaking colour assessments this is best done under an overcast sky.
Harvest observationsThe determination of harvesting time depends on the developmental state of the plant and should not be impeded by external factors such as market conditions, lack of time, etc. The harvest information, as well as criteria for the optimum harvest maturity, are given in the guidelines for each plant species in Chapter 4. Each harvest should usually be made at the optimum time for each variety. With only a few species will all varieties be ready for harvest at the same time. In many case the time taken from planting to harvest is an important piece of information.
To avoid mistakes the plot treatment and replication number should be clearly marked on any crates or sample bags. The weight should not be determined on wet or heavily contaminated crops. The harvested crop should beclassifiedasmarketableornon-marketablebynationaltradeclassesorEUqualitystandards.Detailedinformation on this is given in the guidelines for each plant species.
Forfurtheranalysesarepresentativesub-sampleoftheharvestshouldbeused:•Ingredient research and taste testing may complement and complete the variety trials. As a basis for
investigations are methods of biochemical and food analysis (Boehringer, Mannheim, 1989). •Sensory tests can be carried out using two different approaches: 1. Working with trained panel. This type of testing is concerned with obtaining objective facts about products
due to the general principles of the Standards Committee for Food and Agricultural Products (e.g. DIN 10 950, Sensory analysis Basic principles STANDARD by Deutsches Institut Fur Normung E.V. (German National Standard), 10/01/2012) http://www.nal.din.de/).
2. Consumer testing. This type of testing is concerned with obtaining subjective data, or how well products are likely to be accepted. Usually large panels (50 or more) of untrained personnel are recruited for this type of testing.
Guidelines for Experimental Practice | 25
For some types of vegetables a storage test can be carried out. The crop for storage must be undamaged and free from pests and diseases. The storage conditions (duration, temperature, humidity and the storage facilities) havetobecarefullydescribed.Aftercompletionofstorage,thecropisfirstweighedtodeterminetherespirationandevaporationlosses,thencleanedandsortedintomarketableandnon-marketableproduce.
References and further information
Boehringer Mannheim GmbH. 1989. Methods of biochemical and food analysis. Mannheim
www.cpvo.europa.eu/main/en/home/technical-examinations/technical-protocols
www.upov.int/de/publications/tg_rom/tg_index_numerical.html
www.bioversityinternational.org/e-library/publications/categories/descriptors/
3.1.2 Grafting experiments
By Justine Dewitte (In cooperation with COST Action FA 1204 “Vegetable Grafting”)
RequirementsRootstock trials are carried out on a similar way to variety trials so the requirements are almost the same. However, there are some particular points to pay attention to:•Make sure that the growing medium is the best one for the rootstock of that crop•Make sure that the rootstock and the variety (scion) are sown at the optimal time so you can graft under the
best conditions. This can be different for every combination, so it is best to check with the seed company in advance concerning the germination rate and growth speed. Depending on the crop and the time of sowing, the difference in sowing time can vary from a few days to a few weeks earlier or later.
•It is very important that each rootstock and variety is maintained in exactly the same way (the same light, temperature and humidity conditions). These should follow the general needs of the crop as listed in Chapter 4.Itisnotpermittedtocreateconditionsthatfavouronespecificrootstock.
•If transplanting is necessary, it has to be done under uniform conditions. This is also the case when grafting the plants.
•Mixing different rootstocks is not permitted. Make sure that the different plants are clearly labelled. •Each operation has to be completed on the same day under the same conditions.•The planting material should be hardened off (acclimatised) in a uniform way before planting out.
Experimental designRootstock trials are usually set up with a monofactorial block design. All borders of the greenhouse have to be plantedupbuttheseplantsshouldnotbepartofthetrial-theyareabufferforexternalfactors.Thedesirednumber of plants per m2shouldcorrespondtothepracticeincommercialcultivationandthisisspecifiedintheguidelines for the individual vegetables in CPVO protocols. At least three, or if possible four, replications are recommended. It is advantageous to have a history of the soil conditions of the greenhouse or polytunnel so that the pest and disease pressure of a particular soil can be taken into account. Controls are important – these can eitherbeungraftedorself-graftedplantsorboth.

26 | Guidelines for Experimental Practice
Plant health assessmentsTo score above ground infections of pests and diseases on the plants the same assessments can be used as for variety trials. However, one of the most important aims of rootstock trials concerns the health of the roots. Soil borne pests or diseases, as well as damage caused by physiological problems, can be evaluated by estimating thepercentageofinfectedrootarea.Scores(1-9)canbetransformedbyalogarithmicscaleto%.Logarithmicevaluation:1=absent0% 2=verylowtolow>0to2.5% 3=low>2.5to5% 4=lowtomedium>5-10% 5=medium>10-15% 6=mediumtostrong>15-25% 7=strong>25-35% 8=strongtoverystrong>35to67.5% 9=verystrong67.5to100%
Rootsshouldbeevaluatedimmediatelyaftertheendofthegrowingperiod-theystillhavetobefresh.Itisimportant to avoid damaging the roots while taking them out of the soil. It is also possible to make additional assessments during the growing period but this necessitates destruction of the plants and so larger plots are required in order to have some remaining at harvest.
Root knot nematodes are a common pest in fruit vegetables, especially in heated greenhouses. The main reasonforthisistheratherlimitedcroprotationsthatareusedforeconomicreasons.Therefore,aspecificmeasurement method is carried out, called “rootknotindex” (Figure 3.2). The pictures can be used for all species ofMeloidogyne.Ascoreof0to3willnothavemuchinfluenceonthegrowthoftheplant,buthigherscores(4to10) can cause large harvest losses.
Observations during vegetative periodThe growth assessments of rootstock trials are very similar to those of variety trials (see section 3.1.1, Variety Trials).
Harvest and observation on cropThe harvest measurements and monitoring of rootstock trials are similar to those of variety trials (see section 3.1.1, Variety Trials).

Guidelines for Experimental Practice | 27
Score 0 (undamaged plant) Score 2 Score 4
Score 6 (50% of roots affected) Score 7 (75% roots affected) Score 9 (100% roots affected)
Figure 3.2 Scoring system to assess root knot nematode damage (from Cuijpers and Janmaat, 2012).
References and further information
COST Action FA1204 (Vegetable Grafting to Improve Yield and Fruit Quality under Biotic and Abiotic Stress Conditions http://www.cost.eu/COST_Actions/fa/FA1204
Cuijpers, Willemijn and Janmaat, Leen (2012) Biowisselkas:Brederevruchtwisselingvooreengezonderebodem.[Organicgreenhouseintercropping:Broadening crop rotations for a healthier soil.] Louis Bolk Instituut, Driebergen. www.orgprints.org/20824
28 | Guidelines for Experimental Practice
3.2 Fertilisation experiments
By Wim Voogt
Fertilisation experiments in organic farming are quite complicated as one has to deal with some important constraints as well as multiple parameters which are very much entangled. One of the constraints is that the majority of the N in manures, composts and supplemental fertilisers is in an organic form; plants take up N in mineral form (NH4
+ and NO3-) and these ions only become available as a result of the decay of organic matter
(mineralisation). Furthermore, organic fertilisers comprise of a mixture of several nutrients. For example, consideraquantitativeN-trialusingchickenmanure.ApplicationrateswillnotonlyaffecttheintendedrangeofN supply but also other nutrients (K, P), salinity (EC, Na, Cl) as well as the quantity of organic matter. Each of these parameters will, or may, have an effect on the soil chemical, physical and biological conditions and hence contributetotheresult.Settingupsimpleone-dimensionalexperiments-asinconventionalhorticulturewithmineralfertilisers–isreallyimpossible,oratleastwouldrequirelargetrialset-ups.Insteadamoregeneralapproachisneededwherebyitwillbecrucialtodefinetheresearchquestionandtheaimofthetrialandadjustthe design accordingly. In many cases it also requires the monitoring of additional parameters to interpret the results. Fertilisation trials can be conducted with the aims of:•Quantificationofnutrientavailability(includingmineralisationtrials)•Determining the effect on crop development in relation to plant requirements
3.2.1 Experiments with solid fertilisers, manures and commercial products
By Wim Voogt
QUANTIFICATION TRIALSThe aim of these is to estimate the pattern of the availability of nutrients after application of a fertiliser.
RequirementsTo determine nitrogen availability these trials should preferably be done as incubation trials, in pots under controlled conditions of temperature and water content, to make extrapolation of the results possible. Containers of at least 1 litre should be used. Preferably a standard soil mixture should be prepared, which than can be used in all other parallel and consecutive trials. This standard soil must resemble the soil or growing media used in the commercialpracticethatthesetestsareintendedtoreflect.Thebestapproachistotakealargeamountofthissoil, thoroughly mix, sieve, air dry and store in a cool and dry place; each time soil is needed for a trial it can be taken from this stock.
Amorepracticalwayistodesignateahomogeneousplot–notnecessarilyagreenhouseplot-asthestandardsoil source. This should be kept under permanent crop cover or a continuous rotation. If either of these approaches is impossible, then other soil can be used but this is less satisfactory and the results cannot so easilybeextrapolated.Pretestingofthesoilisneededtoestimatethebulkweightofpotsfilledwithairdrysoil,consideringamaximumfillingrateof75%.Thisweightwillbethestandardforallpots.Thedataonspecificweight of soil per pot and water quantity needed will be used for all incubation tests to be performed with this standard.
Experimental design of incubation trials The fertiliser to be tested must be analysed and characterised. All organic fertilisers contain a mixture of nutrients which complicates the application and the testing. All incubation trials need a range of applications, includingazerocontrol.Therangeshouldresembleanexpectedtotalsupplyofthenutrientunderinvestigation.For N this can be 0, 25, 50, 75, 100 kg N/ha. For K, the range is likely to be 0, 50, 100, 150, 200 kg K/ha and for P the range can be 0.5, 10,15,20,25 kg P/ha.
Guidelines for Experimental Practice | 29
The incubation trial should be set up with at least four replicates. Before starting, the required application must bedetermined,basedontheweightofsoilatfieldcapacityandfillingrateofthepots.Therequiredportionofair-drysoilwillbetakenfromstorageandforeachtreatmentthetotalquantityofsoilshouldbethoroughlymixed with the fertiliser under investigation. After mixing the soil must be divided in equal portions between the pots. A cement mixer is ideal for mixing the soil. During the mixing process half of the required water quantity willbeaddedandthoroughlymixed.Thenpotswillbefilledwithequalquantitiesofthesoil-fertilisermixture.After the pots are put in place, the remaining water will be added to each pot. Pots should preferably be placed in a room with controlled environmental conditions. In some experiments the results may show an initial decrease in the mineral N concentration. This is due to immobilisation of N by microorganisms, caused by a low availability from the organic matter (low C/N ratio). This is related to properties of the fertiliser and is a true outcome of the test. However, this might be undesirable for the purpose of interpretation and application of the data so it is better to avoid this immobilisation effect and use soil with higher mineral N. To boost the mineral N in the soil, either simply base dress the bulk soil with some (conventional)ureaorpreparethebulksoilbyaddingarapidreleasingorganicfertilisersuchasblood-meal.However,thispreparationneedstobedonewithfreshfieldmoistsoilatleastfourweekspriortothetestingtoenable the process go for some time. The air drying, as described above, is then needed before storage of this soil.
QuantitificationThe quantity of fertiliser to be mixed into the soil can be calculated as follows:
F = (N/3000)* (Bd/n)* r * v
where:F = g fertiliser to be addedN = N kg/ha N treatment level to be supplied n = N quantity in the fertiliser, in g/kg Bd = bulk density of the air dry soil g/litre r = number of replicatesV = filling volume of pot (in litres)(3000 equivalent for a soil area of 1 ha to 30 cm rooting zone)
As the processes involved in mineralisation are strongly dependent on temperature and soil moisture the pots shouldideallybeplacedinaclimate-chamberwithcontrolledenvironmenti.e.constanttemperatureandhumidity,withset-pointsresemblingtheaveragegreenhouseenvironment.Alternativelythepotscanbeplacedin a section of a greenhouse, together with continuous monitoring of the pot temperature, to make it possible to compareandextrapolatetheresults.Duringthetests,thewatercapacityshouldbekeptataroundfieldcapacity.Thebestestimationofthiswillbeobtainedbyplacingsomeofthepotsonelectronicscalesandrefillthepotswith water according to their weight. If these are not available, the moisture conditions can be checked with hand-heldsoilmoisturesensors(FD-sensors).Toprotectthetoplayerofthepotsfromdryingouttooquickly,acover with perforated plastic can be used. Never use closed plastic sheet as air movement for unrestricted CO2 and O2 exchange must be possible. Obviously, the water source used must be as pure as possible (e.g. rainwater, reverseosmosisordemineralizedwater)toavoidinteractionsandmisinterpretationofresults.
30 | Guidelines for Experimental Practice
Observations and interpretation of dataAftermixingthefertilisersandbeforefillingthepotsasoilsamplemustbetakenfromeachtreatment(includingthe control). During the incubation trial soil samples must be taken at regular intervals from the pots to enable calculation of a nutrient release curve. Samples can be taken by using a small auger; the boreholes mustberefilledwithsoilfromthepot.Thefrequencywilldependontheexpectedreleasetimeofthefertiliserunder investigation (based on expert judgement or knowledge of some components). For rapidly mineralising fertilisers a reasonable schedule is after 7, 14, 28 and 56 days. For more slowly mineralising fertilisers it can be:10,25,50,100days.Bothscheduleswillprovidesufficientinformationforpracticalapplicationpurposes.However, if one wants to know the full release, the schedule must be prolonged to 200 days and one year respectively. If it is not known if a certain fertiliser belongs to the category of rapid or slow releasers, a short testing prior to the incubation test is required. For soil analysis, it is necessary to estimate both NH4
+ and NO3
- concentrations as well as the quantity of soil solution. Therefore the 1:10 CaCl2 (Houba et al. 2000) or 1:2 extract (Sonneveld et al. 1990), then using CaCl2insteadofdemineralised-water(modificationafterSonneveld et al. 1990)arethemostappropriate.Forascientificapproach,allfourreplicatesmustbesampledindividually to enable statistical analysis. For pragmatic approaches, the sampled soil of the four replicates can be put together rather than being analysed separately although this will reduce the opportunity for statistical analysis. The results can be expressed relative to the total supplied N.
CROP DEMAND TRIALSThe aim of these is to assess the effect of fertilisers on crop development and determination of plant requirements. The approach can be either a response trial with base dressing only, with top dressing only, or a mixed design.
Crop: When selecting a test crop it is important to verify that this is likely to show the expected impact of the treatments; some crops are more nutrient demanding than others.
Soil Type: It is recommended to do parallel tests on contrasting sandy and clay soils. The soil should not have been fertilised too heavily in previous years.
Location: The trial should be established in a homogeneous area with regard to factors such as soil and water management. No trial should have been laid out there before as there may be after effects of the treatments. Differences can partly be corrected in statistical analysis of the results but this does reduce the accuracy of the work.
Size: In greenhouses plots of at least 10 m2 should be considered. For practical reasons it is recommendable to usethespan-widthasthemeasureforwidthandalengthof3meters.
Additional fertilisation: For a trial is focused on a particular nutrient it should be ensured that all other nutrientsaresufficientlyavailableorwillbesupplied.
Irrigation and soil moisture: Nutrient availability depends strongly on the moisture content of the soil. Wet and dry conditions will disturb microbial processes such as mineralisation and cause heterogeneities. Thereforedripirrigationisnotafavouritesystemforfertilisertrialsas,bydefinition,theywillcausehorizontalheterogeneityanddryzonesinthetopsoil.Somesprinklertypesystems,ontheotherhand,havedisadvantagesas well. The least disturbing system is probably a combination of drip and sprinkler. Soil moisture content should be monitored and ideally controlled by soil moisture sensors or tensiometers.
Crop-husbandry: It is important to do as much as possible to minimise the occurrence of pests and diseases and weed growth.

Guidelines for Experimental Practice | 31
Experimental designImportant guidelines are:•Always include an unfertilised control plot. This will give information on the extent of the background nutrient
availability by the soil.•When comparing fertilisers systems a treatment with the relevant nutrient supplied at a suboptimal level must
be incorporated.•There should be at least four rates of application including the control. If the goal is to establish the crop need (forexample,updatingfertilizingadvice)thenbothsubandsupra-optimallevelsmustbeused.
Specifically for trials aiming at base dressings:Prior to the testing, soil analysis must be made to estimate the background mineral content at the start.•Decisions about application rates of the fertilisers must be based on data concerning the expected release of
nutrients, either obtained from literature or the supplier. If not available, incubation trials are required prior to the crops response trials.
•Forverylongseasoncrops(e.g.tomatoesgrownforlongerthansixmonths)N-andK-supplysolelybybasedressingsisinappropriate,duetotoohighinputsneededatthestart.Forthesecrops,amixofbase-andtop dressings is required, taking into account the fact that that the total N, K or EC level in the soil must not surpass certain maxima, as described in Sonneveld and Voogt, (2009). Hence the top dressings must also be part of the design.
•The choice for the different levels to be applied must be based on profound estimations of crop demand and rate of mineral release. A good principle to begin with is that halfway through the growing period, half of the required nutrient should become available.
•For comparison trials (e.g. alternatives to established organic fertilisers) a reference treatment with the “standard” should be incorporated. The supposed ‘optimal’ should get the same quantity of N (or K or P) as the reference plot.
Specificallyfortrialsaimingattopdressing•Prior to the testing, soil analysis must be made to estimate the background mineral content at the start.•Use a standard base dressing using fertilisers for nutrients not under investigation.
Overlap and interference with the nutrient/fertiliser under investigation cannot be avoided completely, but use minimal inputs to keep at least the EC between boundary values.
•The choice for the different levels to be applied must be based on profound estimations of crop demand and mineral release. The determination of timing and splitting of the applications must be set and based on realistic expectations.
•Applications must be carefully supplied, in case of solid fertilisers, these cannot be combined with drip irrigation, as unequal wetting of the fertilisers will be a risk.
•For comparison trials (e.g. alternatives to established organic fertilisers) a reference treatment with the “standard” should be incorporated. The supposed ‘optimal’ should get the same quantity of N (or K or P) as the reference plot.
Fertilisertrialsareusuallylaidoutasablockdesign.Inagreenhousetheplotsarelaidoutspan-wide,eachtreatment plot then can follow one after the other. A border area of at least 1m width is usually left on both sides of the trial. At least four replications are recommended.
ObservationsCrop: Yield and quality should be monitored, the exact parameters depending on the crop type (see Chapter 4). Particular attention should be paid to nutritional disorder symptoms (leaf colour etc.) during crop growth. Total biomass should be assessed, either at crop harvest or, in the case of long term crops with prunings, also during the growth period. Biomass should be dried and the nutrient content determined to calculate total crop uptake.
Soil: Atleastbeforeplantingorsowing,after4weeksandatfinalcropharvest,soilsamplesmustbetakenfromtherootingzone(0-25cmdepth).Coresshouldbetakenrandomlyintheplantrows.Ifdripirrigationisusedcoresshouldbetakenequallyfromspotsclosebyandinbetweenthedrippingzone.SamplesshouldbeanalysedforN-min,KandP,usingappropriateanalyticalmethodsliketheCaClextractionmethodorthe1:2volumeextract (Houba et al. 2000; Sonneveld et al. 1990).
32 | Guidelines for Experimental Practice
References and further informationHouba VJG., Temminghoff EJM., Gaikhorst GJ, Van Vark, W. 2000.
Soil analysis procedures using 0.01 m Calcium Chloride as extraction reagent. Commun. Soil Sci. Plant Anal., 31(9&10),1299-1396.
Sonneveld C Van den Ende J and De Bes S S. 1990. Estimatingthechemicalcompositionofsoilsolutionsbyobtainingsaturationextractsorspecific1:2byvolumeextracts.PlantSoil122,169-175.
3.2.2 Experiments with liquid fertilisers
By Martin Koller
General requirementsTheplotsmusthavebeenfertilizedequallyinthepreviousyears.Ifthisisnotthecasethecropandsoilmanagement should have be the same at least within each experimental block. If there is any doubt about the homogeneity of the trial site a nitrogen demanding green manure could be established prior to the experiment (e.g. oil radish). The biomass of this green manure has to be removed before the experiment begins.
An appropriate buffer around each core plot has to be established. In most cases 1 m along the row and one row betweentheplotsissufficienttoseparatedifferentfertigationtreatments(liquidfertilisersmixedintheirrigationwater). However the minimum distance between core plots depend on the irrigation system. With drip irrigation systems, at least the length of 3 drip holes between the core plot and the border of the plot should be reserved as a buffer. With sprinkler irrigation systems the border around the core plot has to be at least 1.5 times the irrigation radius of the sprinkler.
FertilisersAllthefertiliserstobetestedhavetobecharacterizedcarefully.Inmostcasesitisbesttodeterminethenitrogen (and carbon) content of each batch to be used before the experiment begins. For liquid organic fertilisers the density and the viscosity has to be measured (in the case of viscosity this can most easily be described by comparing it to well known fertilisers).
Fertilisers should be applied according to their total nitrogen content. If it is suspected that their rates of nitrogen availability are very different a preliminary incubation experiment should be carried out to determine availability ratio of each one. This enables them to be applied according to “available nitrogen ” instead of total nitrogen.
Fertiliser applicationFor experimental use it is possible to mix the fertiliser with water and to spread it with watering cans. However this is very unlike true farm practice so it is therefore advisable to use drip irrigation hose for each treatment separately and mix the fertilisers and the irrigation water with proportional dosing pumps (e.g. Dosatron). Ifdosingpumpsareused,itisimportanttoconfirmthattheyworkproperly,e.g.bymeasuringthenitrogencontent of the fertigation solution. Especially with very viscous fertilisers dosing pumps do not always run properly.Insuchcasessomewatershouldfirstbeaddedtothefertiliser(20-50%ofthevolumeofthefertiliserisusuallysufficient)andthedosingpumpthenadjustedaccordingly.Alternativelythefertiliserscanbemixedmanually.Somefertiliserswillcauseclogging.Theyshould,thereforefirstbetestedonasmallscaleandafterevery fertigation run the system should be rinsed with clean water.

Guidelines for Experimental Practice | 33
Figure 3.3 Equipment used for fertigation of greenhouse crops, mixing nutrients into the irrigation water.
Soil and plant samples Before the start of the experiment soil samples should be collected from all plots. For fruiting vegetables samples shouldbetakendownto60cmdepth;inlettuceandothermoreshallowrootingcrops30cmmightbesufficient.During the cropping period additional soil sampling could be conducted although mineral nitrogen analysis will not show if plants have already taken up the available nitrogen or if the fertiliser is not yet completely mineralized;interpretationortheresultsisnotstraightforward.
A more direct approach is to measure nutrients in plant sap (e.g. using portable ion meters such as LAQUAtwin, www.horiba.com) or to measure the colour of the leaves (e.g. using Minolta SPAD 502 chlorophyll meter).
Soil samples should also be collected at the end of experiment. Measurements should also be made of the vegetative plant material, harvested fruits (at a representative number of harvests) and any leaves or side shoots that are removed. The nutrients in these components should be determined and the data can be used to calculate a nutrient budget for the crop.
In the following example, for nitrogen, the apparent effectiveness of an organic fertiliser could be calculated according to:
Ntot = Sum of nitrogen in plantsNmin = Mineralised nitrogen in the soil at the end of experiment
EvaluationInmostcasesacomparisonoftheyieldissufficienttocomparetheeffectivenessofdifferentfertilisers.Yielddetermination has to be carried out according to the recommendation for the different vegetables (see Chapter 4). In fruit crops such as tomatoes, some quality parameters such as total soluble solids, titratable acidity and firmnessonatleastatthreeharvestdatescouldcompletetheassessment.Withleafyvegetables,produceshould be sampled for nitrate, at least if grown during winter time, because of concerns of its effects on human health.

34 | Guidelines for Experimental Practice
3.2.3 Experiments with compost
By Jacques Fuchs
Aims of compost experimentsDepending on the situation there can be various aims of compost experiments. For example to study the influenceofcompostonsoilstructure,onwaterholdingcapacity,onplantnutrition,onplanthealth,tocompareof the effect of different compost types (different inputs, different maturity etc.), or to compare different strategiesofcompostuse(e.g.distributionoverthewholefieldoronlyinthecroprows,ratesandtimingofcompost application etc.).
Beforebeginningacompostexperiment,thespecificquestiontobeansweredhastobeclearlydefinedasthiswillinfluencethedesign.Forexample,iftheprimaryaimistostudy/demonstratetheinfluenceofthecompostonthesoilstructure,theexperimenthastohaveaminimumdurationoffiveyearsbutiftheaimoftheexperiment is to investigate the effect of compost against diseases then a duration of only one or two crops may besufficient.
General requirementsThe site on which the experiment will be done has to be homogenous. The choice of the site should be in relation to the question we want to investigate (e.g. using land with, or at risk of, soil structural problems if we want to investigatetheinfluenceofcompostonsoilstructure).
Thecompostsusedhavetobewellcharacterizedinordertocomparetheresultsofdifferentexperiments.Whenanalysis results are stated it is important to be clear about the methods used and if the results are expressed relative to compost volume or compost weight (fresh or dried). Different countries each have normally accepted methods(thatmayberelatedtocompostqualitystandardse.g.BundesgütegemeinschaftKompost,VKS-ASIC2010). The concentration of some elements is often expressed in terms of their oxides (e.g. P2O5 rather than P). This may be a legal requirement for the declaration of fertiliser composition but it can easily lead to confusion. The information needed includes:
Information about the composting process:•Quantitative and qualitative characterisation of input materials (in percentage terms).•Composting system (e.g. open windrow or in vessel).•Profileoftemperatureandmoisturecontentduringprocess.•Information on the intensity and method of compost turning.•Duration of the process.•Storage conditions.
Physical and chemical and biological analysis of the compost:•Sievingsize(inmm).•Bulk density of fresh compost (weight per volume). •Dry matter (in as a percentage by weight of fresh compost).•Organic matter (usually as a percentage of dry matter).•Ph(inwaterorinaspecificsaltsolution).•Electrical conductivity and salt content.•Total element content of major nutrients (including nitrogen, phosphorus, potassium magnesium, calcium). •Available or extractable nutrient content (e.g. NH4-N,NO2-NandNO3-N).•C/N ratio.•Totalpotentiallytoxicelements(e.G.Mercury,cadmiumandzinc).•Contamination with inert materials (stones, glass, metal and plastic).•Occurrence of viable weed seeds.•Occurrence of human pathogens.
Depending of the aim of the experiment, knowledge of other characteristics of the compost can also be important (Fuchs et al. 2008).ForexamplesuppressivitypotentialagainstPythiumandRhizoctoniaorphytotoxicityeffects.

Guidelines for Experimental Practice | 35
The soil where the experiment is performed also has to be analysed (type of soil, texture, organic matter content, N, P, K, Mg, Ca etc.). It is very important to describe exactly the methods used for the determination of the compost and soil parameters (especially the extraction medium used) as a number of techniques are available that may give quite different results.
Quantity of compost usedThe maximum quantity of compost used is determined by the balance of fertiliser. The nitrogen is usually in a veryunavailableformandsoinsomecountries(e.g.Switzerland)only10%ofthetotalamountisconsideredinthebalance.Howevertheremaybeotherlimitsofapplication(e.g.inSwitzerlandamaximumof25tonnesdrymatter per ha can be applied in any three year period). As the compost cannot offer to the plant all the nutrients insufficientquantityadditionalinputsmayalsobeneeded(e.g.ofnitrogen).
Reference plotsIf not only fertilisation questions have to be answered by the experiment, it is important to have, in addition to an untreated reference plot, also a standard treatment (a N, P, K, Mg control). The quantity of fertiliser in this plot has to represent the fertiliser content in the compost, and the availability of the fertilisers also has to be similar. For K and Mg, ‘Patentkali’ can be recommended – this is a mixture of potassium sulphate and magnesium sulphate. P can be added as rock phosphate. For nitrogen, it is recommended to add horn shavings to balance the soil Nmin content as a result of compost addition.
Experimental designFor experiments with a duration of only one season, a standard design with four replications can be used. The plotshavetobeofasufficientsizetoavoidbordereffectsintheevaluationoftheresults(e.g.plotswithaminimum width of 4 crop rows and length of 10 meters; the middle two rows are evaluated between meters 2 and 8). For experiments with a duration of several years (e.g. to evaluate the effect of compost on soil structure) theplotshavetobelargerinordertoavoidthemixingofsoilfromthevarioustreatments.Thebufferzones,in which no measurements are done, are more important than in the short time experiments. For experiments running for several years, soil samples from all the plots should be collected and analysed before the work begins in order to establish base line values.
References and further informationFuchs J.G., Berner A., Mayer J.,Smidt E., Schleiss K. 2008
Influenceofcompostanddigestatesonplantgrowthandhealth:potentialsandlimits.ProceedingsoftheinternationalcongressCODIS2008.p.101-110.www.orgprints.org/17977/
BundesgütegemeinschaftKomposte.V.Methodenbuch(inGerman).www.kompost.deVKS-ASIC2010. SchweizerischeQualitätsrichtlinien(inGerman).DirectiveSuissedelabranchesurlaqualitéducompostetdudigestat(inFrench).www.vks-asic.ch
3.2.4 Experiments with green manures
By Francis Rayns
BackgroundGreenmanuresarecropsgrownforthebenefitofthesoilratherthanforharvestandsale.Theycanhaveanumber of effects in protected cropping that include:•Addingnitrogentothesoilbynitrogenfixation(legumesonly).•Modifying the availability of other plant nutrients. •Adding organic matter to the soil.•Stimulating biological activity.•Contributing to the control of weeds, pests and diseases.
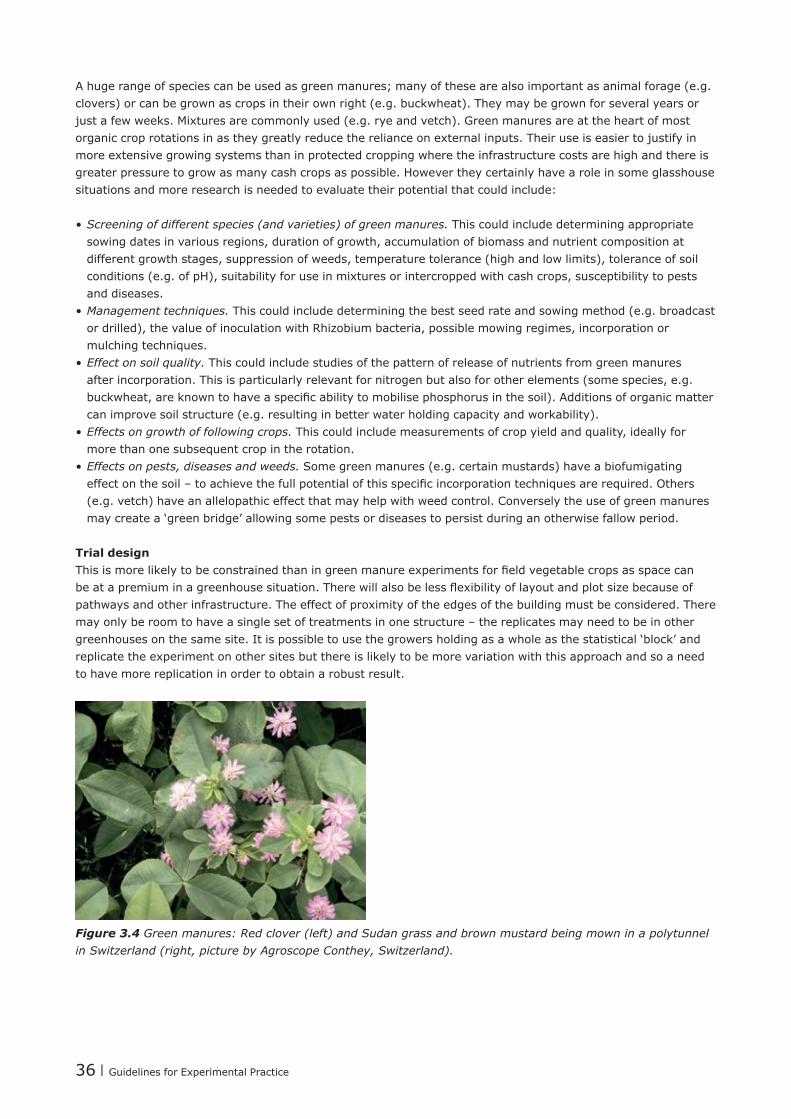
36 | Guidelines for Experimental Practice
A huge range of species can be used as green manures; many of these are also important as animal forage (e.g. clovers) or can be grown as crops in their own right (e.g. buckwheat). They may be grown for several years or just a few weeks. Mixtures are commonly used (e.g. rye and vetch). Green manures are at the heart of most organic crop rotations in as they greatly reduce the reliance on external inputs. Their use is easier to justify in more extensive growing systems than in protected cropping where the infrastructure costs are high and there is greater pressure to grow as many cash crops as possible. However they certainly have a role in some glasshouse situations and more research is needed to evaluate their potential that could include:
• Screening of different species (and varieties) of green manures. This could include determining appropriate sowing dates in various regions, duration of growth, accumulation of biomass and nutrient composition at different growth stages, suppression of weeds, temperature tolerance (high and low limits), tolerance of soil conditions (e.g. of pH), suitability for use in mixtures or intercropped with cash crops, susceptibility to pests and diseases.
• Management techniques. This could include determining the best seed rate and sowing method (e.g. broadcast ordrilled),thevalueofinoculationwithRhizobiumbacteria,possiblemowingregimes,incorporationormulching techniques.
• Effect on soil quality. This could include studies of the pattern of release of nutrients from green manures after incorporation. This is particularly relevant for nitrogen but also for other elements (some species, e.g. buckwheat,areknowntohaveaspecificabilitytomobilisephosphorusinthesoil).Additionsoforganicmattercan improve soil structure (e.g. resulting in better water holding capacity and workability).
• Effects on growth of following crops. This could include measurements of crop yield and quality, ideally for more than one subsequent crop in the rotation.
• Effects on pests, diseases and weeds. Some green manures (e.g. certain mustards) have a biofumigating effectonthesoil–toachievethefullpotentialofthisspecificincorporationtechniquesarerequired.Others(e.g. vetch) have an allelopathic effect that may help with weed control. Conversely the use of green manures may create a ‘green bridge’ allowing some pests or diseases to persist during an otherwise fallow period.
Trial designThisismorelikelytobeconstrainedthaningreenmanureexperimentsforfieldvegetablecropsasspacecanbeatapremiuminagreenhousesituation.Therewillalsobelessflexibilityoflayoutandplotsizebecauseofpathways and other infrastructure. The effect of proximity of the edges of the building must be considered. There may only be room to have a single set of treatments in one structure – the replicates may need to be in other greenhouses on the same site. It is possible to use the growers holding as a whole as the statistical ‘block’ and replicate the experiment on other sites but there is likely to be more variation with this approach and so a need to have more replication in order to obtain a robust result.
Figure 3.4 Green manures: Red clover (left) and Sudan grass and brown mustard being mown in a polytunnel in Switzerland (right, picture by Agroscope Conthey, Switzerland).

Guidelines for Experimental Practice | 37
Crop husbandryWhenever possibility all operations should be done in as similar manner as possible to what would be commercial practice. In some cases, however, sowing etc. may need to be done by hand rather than machine if a number of different species are being compared. If the performance of a green manure crop in a region is completely unknown then it may be worthwhile to conduct some small, unreplicated, tests in the season before the main experiment is set up. This will ensure that there is a basic understanding of a crops requirements so that a promising idea is not dismissed as a failure when, with slightly different management, it could be grown to advantage.
MeasurementsAll trials should include at least some measurements of green manure performance but the degree of detail to which this is done does depend on the aim of the work and, to some extent, the time available. Measurements could include:• Crop germination. Counts of seedling emergence can be done every few days in the weeks after sowing. If a mixtureofspecieshasbeensownthenthedifferentspeciesshouldbeidentifiedandrecordedseparately.Itisbest done by counting the numbers in several meter lengths of row (these can be marked out and the same rows used for each successive count) or in a square quadrat if the seeds have been broadcast.
• Crop growth and development. Cropheightsgiveasimple,non-destructiveyetnumericalwayofassessinggrowth. However, it can be misleading in comparisons between different species as some will tend to have a more upright habit than others and this is not necessarily related to biomass production. Estimates of ground cover are useful (these can be categorised into bare ground, green manure and weeds) and, if regularly done, can show development over time. Quadrats can be used or estimates of whole plot performance can be made. Monitoring of growth stage is important as the effects of a green manure will change as it matures; they generallybecomemorelignifiedandslowertodecompose.Seedsetisalsoanissueasthereisapotentialforgreen manures to become weeds in following crops. Some researchers have used cameras installed in tubes (‘minirhizotrons’)tofollowrootdevelopmentbutthisisaveryspecialistarea.
• Nitrogen fixation. For leguminous green manures an estimate of input of atmospheric nitrogen is likely to be relevant.Unfortunatelymeasuringfixationaccuratelyisnoteasyandcanbeexpensive.Thereareanumberof methods available, for example using 15N labelling, using natural 15N abundance and comparing nitrogen uptakewithanon-legumegreenmanureManyresearchersuseestimatesfromtheliterature(forexampletoconstructnutrientbudgets)butitmaynotbeappropriatetoextrapolatefromfieldtoglasshouseconditions.Atthe very least there should be observations to see if nodules are present and if they are pink to show that they are active.
• Weed, pest and disease problems. Particular issues should always be noted. If control of these problems is a focus of the trial then more detailed monitoring may be worthwhile (eg scoring of damage at regular intervals to show the spread of a disease). Excessive weeds may interfere with some antagonistic green manure effects (e.g. the inhibition of nematodes by Tagetes)
• Biomass. If the crop is mown during its growth (common for longer tem green manures outside but perhaps less relevant in a greenhouse situation) then the amount cut should be measured. This is best done by cutting a quadrat with sheers at the same height as the mower used for the whole trial. The amount and nature of plant material actually incorporated is perhaps the most important measurement of all but measurements of biomass may also be made as the green manure crop grows – this information may be useful for modelling growth. Biomass is best measured by sampling one or more quadrats per plot. Ideally the plants are carefully dug up, the roots washed and the roots and shoots weighed separately. Weeds can also be separated from the crop, and a green manure mixture separated into its component species. It is impossible to extract all the roots so this measurement will only be ‘recoverable roots’ and an underestimate of the full root biomass. As an alternative the shoots can just be cut off ‘at ground level’. This is much quicker but does result in an underestimate of the above ground biomass because many of the stem bases will not be included. If more information about root growth is really needed then it is possible to extract large (say 10cm diameter) soil cores and wash out the roots from them over sieves. There is likely to be a lot of variability so preliminary wok may be needed to ensure that there is enough replication to make the results statistically robust. In small plots there needs to be a compromise between the gathering of data and disruption to the plot (trampling causing compaction, removal of samples etc.). This is a particular issue in the case of a long term trial where the growth of following crops can be affected.

38 | Guidelines for Experimental Practice
• Biomass quality. Fresh weight of the sampled material is readily measured and is usually expressed as tonnes per ha although kg per square meter may be more appropriate. It is best to also use a subsample to determine the dry matter content of each crop fraction (roots, shoots, weeds etc.) by drying in an oven at 60oC until a constant weight is achieved. Chemical characterisation may be useful; this can mean analysis of major nutrients (C, N, P and K) or of the cellulose/lignin content. The C:N ratio is particularly important for predicting the mineralisation patterns of a green manure. Analysis of a large number of samples is expensive so it may be necessary, although not ideal, to pool the replicates or to use standard values from the literature in order to calculate the inputs to the soil.
• Soil information. Basic soil parameters (e.g. pH, available nutrients, organic matter levels etc.) should be determined at the time the experiment is set up so that the results can better be compared with those from other sites. It may be necessary to make other measurements as the green manures are growing or at the time of incorporation if soil effects are a focus of the work. Whenever soil samples are taken it is important that they are representative of each plot (adequate cores must be taken to provide a pooled sample of sufficientsizefortheanalysesneeded)andaretakenwithcleantoolstoaknowndepth.Theymustbetreatedappropriatelybeforeanalysis(ifmineralnitrogenisrequiredtheymustbestoredcoolbutnotfrozenalthoughair drying is acceptable before certain determinations).
• Environmental information. Records of temperature, light levels etc. should be kept, together with information aboutwatering(rainfallwillprobablybeirrelevantbutmayinfluencethemoisturelevelsinthesubsoilbeneaththe greenhouse). It is also useful to record the previous cropping.
Effects after incorporation – soilRegular soil sampling will show the pattern of release of nutrients as a result of incorporation of the green manures. This is of particular relevance in the case of nitrogen which, in its mineral forms, exists only transiently and yet is so important for crop nutrition; its availability is usually greatly affected by green manures. Quantifyingsoilphysicalandbiologicalchangesismoredifficult.Insitumeasurementscanbemadeof,forexample,bulkdensity,soilhardness(usingapenetrometer),waterinfiltrationetc.Insomecasesdiversityandabundanceofvarioustypesofsoillifecanbeassessed-thismaybeofparticularrelevanceinmonitoringtheeffects of green manures on soil borne diseases.
Effects after incorporation –cropsPerformance of the following crops should be measured according to the protocols suggested in other chapters in this book. Depending on the focus of the work particular attention may be paid to various effects (e.g. competition with weeds, disease incidence, crop yield or quality). In some cases it may be desirable to continue to measure the performance of crops throughout a whole rotation.
Economic evaluationAlltrialsshouldincludesomecalculationofthecostsandbenefitsofthevarioustreatments.Thisistoenableanypotentialyieldbenefitstobesetinacommercialcontext.Ideallythereshouldbeacomparisonwith‘standardfarm practice’. Suggestions for how this can be accomplished are covered in section 3.6 of these guidelines.
Anecdotal informationThisisparticularlyrelevantforon-farm‘participatory’trials.Thegrower’sviewonthepracticalityofadoptinga particular strategy has a value in addition to the agronomic measurements. They may be able to show thatsomethingmaybeverydifficultoreasytoadopt.Theymaybeabletocommentonsomething(e.g.animprovementinsoilworkability)thathasnotbeenquantifiedbutisneverthelessimportant.
3.2.5 Fertilising experiments in growing media used for transplant production, potted herbs or ornamentals
By Martin Koller
See also section 3.2.6 and 4.5.1

Guidelines for Experimental Practice | 39
The amount of nutrients and fertilisers in growing media are usually expressed in mg or g per litre of growing media (i.e. by volume rather than by weight). It is therefore crucial to use an easy and accurate laboratory method to measure bulk density. The ISHS method (Verdonck and Gabriels, 1992) or the EN 13041:2011 (CEN 2011) method are usually considered to be too time consuming. It is therefore recommended to use one of the following methods:
EN 13040:2007 (CEN 2007)
Fillingaone-litretestcylinderwithsample"asreceived",staticcompaction(withaplunger) and weighing the contents of the cylinder.
VDLUFA (A 13.2) Filling a 250 ml cylinder with sample “as received” (respectively rewetted to “pot condition”-i.e.whentightlycompactedinafistitmustbemoistbutnomoisturemayexude), compaction by dropping 10 times from 10 cm height and weighing of the contents of the cylinder.
Setting up experimentsDifferent fertilisers should be added to the growing media to supply the same amount of the element in question (intermsofmgperlitre).Alltheotherelements(especiallymicro-elements,whicharenotthesubjectoftheexperiment but may also be in the fertilisers) should be equilibrated (e.g. with appropriate additions of rock phosphate and potassium sulphate).
Changes to available nutrient levels are likely to occur during growing media storage. It is therefore recommended, as well as conducting experiments using freshly mixed growing media to store samples in closed plastic bags at least for 4 weeks and then test again with the same setup. This procedure can simulate the handling and use of most commercial growing media.
At least 4 replicates should be used. In most cases it is useful to use more than one test species to assess any possible phytotoxic effects of the fertilisers (e.g. Chinese cabbage is a plant sensitive to some phytotoxic compounds).
Evaluation of experimentsExperiments should continue at least to the normal transplanting stage of the crop. There should be assessments of:•Fresh weight of the shoot at transplanting stage.•Nutrients in the shoot.•Growth after transplanting.•Analysis of the growing media for pH, EC (salinity) and nutrients such as Nmin at least at start and at the end of
the experiment.
Determination of pH, EC and nutrients in growing media:Either of the following methods can be recommended (Sonneveld and Voogt 2009):1 : 1.5 volume water extract (e.g. national standard method in the Netherlands)1 : 5 volume water extract, according to the recommendation CEN/TC 223 or VDLUFA (national standard method in Germany)
Instead of water, stronger solutions such as CAT (CaCl2 + DTPA) can be used as these can give more meaningful results, especially in growing media containing compost and clay products. The presence of a chelate such as DTPA will extract higher amounts of metallic elements. Whatever method is chosen it should be clearly stated in any report of the results.
References and further information Cees Sonneveld, Wim Voogt. 2009.
Plant Nutrition of Greenhouse Crops. Chapter 4: Soil and Substrate Testing to Estimate Nutrient Availability and Salinity Status. https://books.google.ch/books?isbn=9048125324
CEN-EuropeanCommitteeforStandardization.2007. EN13040:2007:Soilimproversandgrowingmedia-Samplepreparationforchemicalandphysicaltests,determination of dry matter content, moisture content and laboratory compacted bulk density.
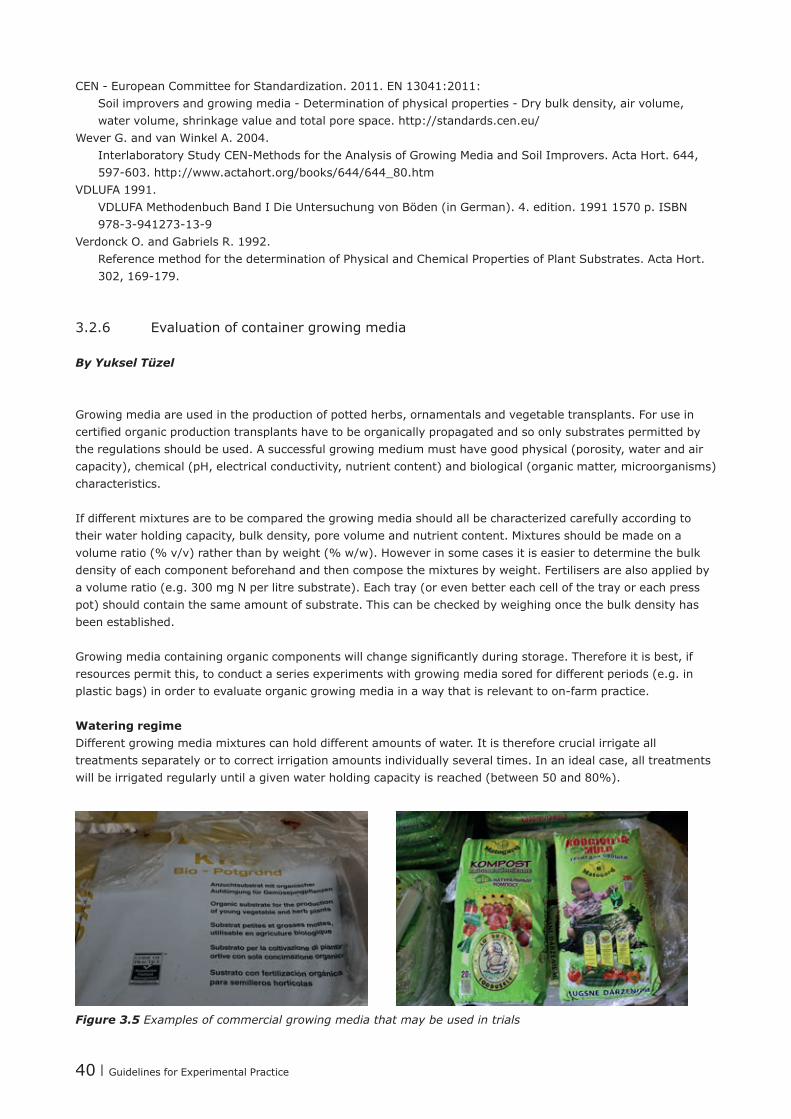
40 | Guidelines for Experimental Practice
CEN-EuropeanCommitteeforStandardization.2011.EN13041:2011: Soilimproversandgrowingmedia-Determinationofphysicalproperties-Drybulkdensity,airvolume,water volume, shrinkage value and total pore space. http://standards.cen.eu/
Wever G. and van Winkel A. 2004. InterlaboratoryStudyCEN-MethodsfortheAnalysisofGrowingMediaandSoilImprovers.ActaHort.644,597-603.http://www.actahort.org/books/644/644_80.htm
VDLUFA 1991. VDLUFA Methodenbuch Band I Die Untersuchung von Böden (in German). 4. edition. 1991 1570 p. ISBN 978-3-941273-13-9
Verdonck O. and Gabriels R. 1992. Reference method for the determination of Physical and Chemical Properties of Plant Substrates. Acta Hort. 302,169-179.
3.2.6 Evaluation of container growing media
By Yuksel Tüzel
Growing media are used in the production of potted herbs, ornamentals and vegetable transplants. For use in certifiedorganicproductiontransplantshavetobeorganicallypropagatedandsoonlysubstratespermittedbythe regulations should be used. A successful growing medium must have good physical (porosity, water and air capacity), chemical (pH, electrical conductivity, nutrient content) and biological (organic matter, microorganisms) characteristics.
Ifdifferentmixturesaretobecomparedthegrowingmediashouldallbecharacterizedcarefullyaccordingtotheir water holding capacity, bulk density, pore volume and nutrient content. Mixtures should be made on a volumeratio(%v/v)ratherthanbyweight(%w/w).Howeverinsomecasesitiseasiertodeterminethebulkdensity of each component beforehand and then compose the mixtures by weight. Fertilisers are also applied by a volume ratio (e.g. 300 mg N per litre substrate). Each tray (or even better each cell of the tray or each press pot) should contain the same amount of substrate. This can be checked by weighing once the bulk density has been established.
Growingmediacontainingorganiccomponentswillchangesignificantlyduringstorage.Thereforeitisbest,ifresources permit this, to conduct a series experiments with growing media sored for different periods (e.g. in plasticbags)inordertoevaluateorganicgrowingmediainawaythatisrelevanttoon-farmpractice.
Watering regimeDifferent growing media mixtures can hold different amounts of water. It is therefore crucial irrigate all treatments separately or to correct irrigation amounts individually several times. In an ideal case, all treatments willbeirrigatedregularlyuntilagivenwaterholdingcapacityisreached(between50and80%).
Figure 3.5 Examples of commercial growing media that may be used in trials

Guidelines for Experimental Practice | 41
Experimental designRecommended replicates: at least 4.Minimumnumberofplantspertreatment:onetrayperreplication;thisshouldbeofastandardsizeusedincommercial production e.g. containing 308 cells/plants.
AssessmentspH, EC and N min should be measured at least at the start and the end of the experimentFresh matter (and dry matter) of the seedling shootsNutrient content (e.g. of N) of the shoot (do not dry the shoot above 60°C)Colour of the seedling leaves (e.g. using Chlorophyll Meter Minolta SPAD 502) Establishment of the seedlings, by planting out seedlings and assessing their performance after a period of growth (‘take off trials’)
References and further informationKuepper, G., 2010.
PottingMixesforCertifiedOrganicProduction.HorticultureTechnicalNote.https://attra.ncat.org
3.3 Experiments on weed control
3.3.1 Weed control
By Justine Dewitte
RequirementsBefore weed control experiments are carried out, it is advisable to learn to identify the different weeds at the seedling stage. To recognise them is crucial for the observations. Before a trial can be done an appropriate site mustbeselected.Itisimportanttoconsiderthehistoryandtherotationstageofthefield,becausethiswillinfluencetheprocessandtheresultsofthetrial.Theplotsmusthavebeenequallytreatedinpreviousyears.Anappropriate buffer around the trial has to be established.
Weed control trials can be done in different situations, for example:•Whilethegreenhouseisemptybetweentwocrops(forexample,toassessthebenefitsofagreenmanurelike
Japanese oats (Avena strigose) or phacelia (Phacelia tanacetifolia), using a mulch, stale seedbed or a fallow period).
•Whileacropisgrowing(forexample,duringaweedsensitivecroplikebabyleafsaladsusingflameweeding,mechanical weeding or planting through a mulch).
In both cases it is important to assess the immediate effects of these measures but also to examine the weed problems in the following crops.
Experimental designWeedcontroltrialsareusuallydoneusingfourreplications,setupasamono-factorialblockdesign.Theplotshavetobeofasufficientsizetopreventneighbouringplotsaffectingtheresultsandtoallowforthenaturalpatchinessinweedpopulations.Thesizeoftheplotswilldependontheaimofthetrialbuttheworkinvolvedshould not be underestimated. If a replicated trial is not possible then a ‘demonstration’ trial would be an alternative. In this case it is recommended to repeat the trial in subsequent seasons or at multiple locations toconfirmtheresults.Acontrolshouldbeincluded;thisisnormallyun-weededbutsometimesanareakeptcompletely weed free (e.g. by hand weeding) is also appropriate.
42 | Guidelines for Experimental Practice
ObservationsOn each assessment date, information about the crop as well as the weeds should be recorded – this can includecropdevelopmentstage(e.g.usingaformalizedBBCHscale),heightofcanopy,estimationofvigourandany pest or disease problems. The weeds on a plot can be expressed in population numbers, as a percentage ofgroundcoverorasbiomass.Thiscanbedeterminedinabsolutefiguresoranestimationcanbemade.Information should also be recorded concerning the level of weed population on the untreated (control) plots.
Absolute assessment: Individual weed plants are counted for each species or the biomass of each species is determined by weighing. These evaluations have to be made on full plots or on randomly selected marked squares within each plot. For example, weeds could be counted in 8 randomly selected 35.3 x 35.3 cm quadrats in each plot (i.e. with a total of 1m2.)
Estimation: All treated plots have to be compared to the untreated (control or reference) plot. The relative weed population has to be estimated. The assessment includes an overall estimate of the total weed population and/ortheindividualweedspecies.Itispossibletosummariseinonefigureanestimationofthenumberofweeds,thefieldcoverage,theheightandthevigourofgrowth(‘virtualweedvolume’)oftheweeds.Inprinciplethis is a fast and simple method. The result can be expressed as a percentage (that is to say on a linear scale of 0%=noweedsto100%=sameweedpressureasinthecontrolplot).Asimilarinversescalemaybeusedtoexpressthepercentageofweedcontrol(0%=noweedcontrol,100%=completeweedcontrol).
It can be important to identify the different weeds on each plot as some control measures will be effective against some and not others. The time needed to control the weeds for each treatment is also an important issue for the farmer as this is linked to the cost of production. Assessments should also be made at different times e.g. beforeandafterspecificcontrolmeasuresinordertoassessregrowth.
References and further informationMeier, U. (ed.). 2001.
Growthstagesofmono-anddicotyledonousplants.BBCHMonograph.2.EditionGermanFederalBiologicalResearch Centre for Agriculture and Forestry. http://pub.jki.bund.de/index.php/BBCH
3.3.2 Evaluation of mulching materials
By Samih Abu Baker
A common agricultural practice for vegetable growers is mulching. This practice has been well documented to improve growth and yield. Mulches go back to early agriculture when they were primarily organic in nature and mainlyusedtoconservemoisture.Theycanbedefinedassubstancesspreadoverthegroundtoprotectsoiland plant roots from undesirable environmental factors, including temperature, moisture, weed competition, soil structure, and biological activity.
The advantages of mulching include the following: •Water conservation; mulches can greatly reduce evaporation from the soil surface and can reduce irrigation
needs.•Weed control; mulches can prevent weed growth, thus reducing competition with the crop for light, water and
nutrients.•Reduced labour requirement; much less labour is expended in weed removal and in applying water to properly
mulched crops.•Temperaturemodification;asageneralrule,organicmulchestendtocoolsoil,whereasclearandblackplasticmulchesmaybeusedtowarmthesoilmulchesalsogenerallyreducesoiltemperaturefluctuations.
•Soil structure improvement; soil structure is improved when the lower layer of an organic mulch decays or following incorporation of organic mulches into the soil.
•Reduced insect numbers; certain organic mulches (such as cedar chips) are reputed to repel insects.•Reduced nutrient and water losses.•Keeping crops clean from soil contamination.
Guidelines for Experimental Practice | 43
A wide range of material can be used as mulch material; these may be organic (e.g. straw) or synthetic (usually aplasticfilm).Onceanorganicmulchingmaterialhasbeenincorporatedintothesoilandhasdecomposeditwill improve soil structure, especially in the case of “heavy” soils such as clays, clay loams, and silty soils. This improvesdrainage,andthusaerationoftherootzone.Thewater-holdingabilityofmorewelldrainedsoilwillalso be improved by increased organic matter. Synthetic mulches may also be biodegradable.
Available nitrogen in the soil can be reduced when incorporating organic materials from mulches into the soil. This‘nitrogenrobbery’canoccurbecausethebacteriaandfungiinvolvedinthedecompositionprocesswillutilizelargeamountsofnitrogenastheymultiplyrapidlyduringthebreak-downoftheorganicmatter.Oneofthemostimportant reasons for organic mulches is weed control by placing them directly on top of small weeds; a layer of 10cm of organic mulch will block light and the photosynthesis will be prevented.
Experimental layouts Experimentswithmulchescanhelptoquantifythebenefitsandcostsofusingthem.Measurementscanbemade of crop yield (including its earliness and quality), effects on soil water and interactions with irrigation requirements, effects on the soil (mineralisation patterns under the mulch and the supply of nutrients as an organic mulch breaks down) and the costs of using them (in terms of labour hours and materials).
If commercial scale machines are used to lay down the mulches then the plots will need to be quite large which may limit the number of replicates and treatments. Although organic mulches can be simply applied to small scaleplotsbyhanditmaybedifficulttosimulatecommercialuseofsyntheticmulchesonaplotscale.Astripofabout 50 to 80cm is required between rows covered by mulches, regardless of type, to prevent cross movements of soil between adjacent plots.
References and further informationDecoteau, D. 2000.
Vegetable Crops. Prentice Hall. Upper Saddle River, New Hersey.Preece, J. and P. Read. 2005.
The Biology of Horticulture: an Introductory Textbook. Second Edition. John Wiley & Sons. Mulches for the vegetable garden. Colorado State University Extension. The website is: http://www.ext.
colostate.edu/mg/Gardennotes/715.html
3.4 Plant protection experiments
3.4.1 Evaluation of fungicides and insecticides in organic cropping
By Martin Koller and Ellen Richter (based on Martin Hommes, 2006)
Preconditions and site selectionBefore plant protection experiments are carried out it is advisable to understand the biology of the pest or the pathogen concerned and to collect information regarding its incidence in the experimental region. Appreciating therouteofinfectionofapathogen,forexample,iscrucialfordeterminingtheexperimentalprocedure.Forsoil-borne pathogens, such as the clubroot disease of Brassica species, a uniform contamination of the experimental side is of great importance. For exclusively seed borne pathogens, it is important that each seed batch is uniformly treated and the origin of the seed is recorded.
For pests or diseases which invade the experimental plots actively there is often a clear gradation of infestation fromanedgetowardsthefieldcentre.TheLatinsquareisasuitableexperimentaldesigntodealwiththesebordereffects.Iftheyaretransportedbythewindandinfestationisregularlydistributedwithinthefield,otherdesigns such as a randomised block design are as most suitable.

44 | Guidelines for Experimental Practice
Experiments with plant protection products, plant ‘strengtheners’, or ‘tonics’ suitable for organic production require particularly stringent design and implementation. The effects of these products may not be very strong andthereforesamplesizeandnumberofreplicatesshouldbeincreasedinordertodemonstratestatisticallysignificantdifferencesbetweenthetreatments.Ifproductshaveonlyapreventivebutnocurativeeffecttheymust be applied before infection and on a regular schedule as long as disease pressure persists. It has to be taken into account that most plant diseases have an incubation period between infection and outbreak of symptoms.
Moreover, it is important to know the mode of action and the physical and chemical characteristics of a product under test. For example, the bacterium Bacillus thuringiensis has to be taken up actively before it becomes effective in the gut of caterpillars. In addition, temperature affects larval feeding activity and bacterial growth, older instars show reduced susceptibility and the microorganism is inactivated very quickly by UV radiation or washed off by rainfall.
Application technology and water requirementTheapplicationtechniquecanhaveaconsiderableimpactontheefficacyofaproduct.Therefore,itisimportanttorecordtheexactapplicationparameters,suchassprayingequipment,nozzletype,applicationtechnique,amount of water, application rate, additives etc. In order to check the application technique, water sensitive paper can be attached to different parts of the canopy to record the degree of wetting. Additionally, the weather conditions should be noted during and after application.
The amount of water needed for water based applications of fungicides and insecticides depends on the crop development and the mode of action. In Germany, for example, the following amounts of water are generally recommended for typical vertical greenhouse crops such as tomato or cucumber:
Plant height < 0.5 m = 6 litres/100 m2.Plantheight0.5-1.25m=9litres/100 m2.Plant height > 1.25 m = 12 litres/100 m2.
If a thorough wetting of all plant parts is recommended (as it is for products with contact effect only such as insecticidal soaps or rape seed oil) the amount of water amount may be somewhat higher but excessive use of waterwilljustdripofftheplantsandtherebyreduceefficacy.Moreaccuratemethodstoestimatetheamountofwater needed are currently under development (e.g. Rueegg et al. 2012).
Assessments and artificial inoculationCounting, estimating and measurements of disease and pest infestation levels are better suited for an appropriate statistical evaluation than using scales. However, a scale from 1 to 9 may be appropriate if no statistical evaluation is planned.
At low infestation levels (< 10) pest numbers can easily be counted and with some experience high numbers may be estimated. The incidence and expression of disease and pest symptoms can be expressed in percentages (e.g. as disease incidence and disease severity). If assessments are conducted by several people, it is best to harmonizetheestimationofpestnumbersordiseaseseveritybeforehandandtomakesurethateachpersonevaluates all treatments in one replicate. This ensures that personal effects will not distort the results of the treatments. Inexpensive and accurate methods are also available today for measuring the leaf area damage through digital image analysis (e.g. Bock et al. 2010).
If pest infestation is very heterogeneous within the plots then it may be useful to mark certain plants and to follow pest development on these plants. In this case it is particularly important that the assessments do not compromise the development of the pest.
Ifthenaturalpestorpathogenincidenceisverylowartificialinoculationcanbeconsidered.Sometimesitmaybesufficienttoplaceartificiallyinoculatedplantsintotothedifferentplots.However,itisimportanttodistributethese plants equally to all replicates and treatments.
Guidelines for Experimental Practice | 45
Efficacy evaluation Fourmainformulasareavailabletocalculatethecorrectedefficacyinpesticidetrials.Theselectionoftheappropriate formula will depend on the trial conditions which means considering infestation or population stability and homogeneity as well as on the data available. When dealing with infestation levels or live individuals inuniformpestordiseasepopulationstheformulaaccordingtoAbbott(1925)isconvenient.Fornon-uniformpopulations, the Henderson and Tilton (1955) formula is suited which allows us to judge differences in the population development. In this formula the mortality ratio is corrected on the control mortality. If mortality is assessedassuch,theformulasafterSun-ShepardorSchneider-Orellishouldbeused(Püntener1981).
a)EfficacyformulaaccordingtoAbbott(1925)
b)EfficacyformulaaccordingtoHendersonandTilton(1955)
References and further informationGeneralinformationontrialsforefficacyevaluationofplantprotectionproductscanbefoundintwogeneral
EPPOguidelines:PP1/152(4)DesignandanalysisofefficacyevaluationtrialsandPP1/181(4)Conductandreportingofefficacyevaluationtrials,includingGoodExperimentalPractice.Manygeneral(forphytotoxicityassessment,minimumeffectivedose,etc.)andspecificEPPOstandardsareavailableathttp://pp1.eppo.int/
Abbott, W.S. 1925. Amethodofcomputingtheeffectivenessofaninsecticide.J.Econ.Entomol.,18:265-267.
Bock, H., G. H. Poole, P. E. Parker and T. R. Gottwald. 2010. Plant Disease Severity Estimated Visually, by Digital Photography and Image Analysis, and by Hyperspectral Imaging.CriticalReviewsinPlantSciences29(2):59-107.DOI:10.1080/07352681003617285C.
Henderson, C.F. and E. W. Tilton. 1955. Testswithacaricidesagainstthebrowwheatmite,J.Econ.Entomol.48:157-161.
Hommes. 2006. Chapter2.5.BesondersbeiPflanzenschutzversuchen(inGerman).In:LindnerandBillmann.Planning,Setupand Evaluation of Trials on Organic Vegetable Cultivation. An Experimental Design Manual
Püntener W. 1981. Manualforfieldtrialsinplantprotectionsecondedition.AgriculturalDivision,Ciba-GeigyLimited.
Rueegg J., M. Jermini, R. Total and S. Scettriniet. 2012. Leaf wall area and leaf area in cucumber, eggplant, sweet pepper and tomato grown in greenhouses in Switzerland.BulletinOEPP/EPPOBulletin12/2012,42(3):552-559.DOI:10.1111/epp.12003
3.4.2 Evaluation of bio control agents and natural enemies
By Gerben Messelink
IntroductionBiological control of greenhouse pests with natural enemies has been applied successfully in greenhouse crops for decades (Pilkington et al. 2010). However, there are still serious problems as some pest species are difficulttocontrolwithcurrentlyavailablenaturalenemies(Messelink2014).Theefficacyofnaturalenemiesmay strongly depend on the type of crop; existing species therefore need to be evaluated in different cropping systems. In this chapter, some practical advice is provided for evaluation experiments with natural enemies in greenhouse crops.
46 | Guidelines for Experimental Practice
Criteria for selecting natural enemiesThe selection of natural enemies for biological control was traditionally focused on specialist enemies that were released to obtain rapid control of the pests (Hussey and Bravenboer 1971), (van Lenteren and Woets 1988). Well-knownexamplesarethespidermitepredatorPhytoseiulus persimilis,thewhiteflyparasitoidEncarsia formosa, and aphid parasitoids of the genus Aphidius, which are still successfully used in many crops and countries(vanLenteren2012).Thesenaturalenemiesarereleasedassoonasthepestsareobserved,theso-called augmentative biological control. Criteria for selecting the most effective natural enemies for augmentative biological control according to van Lenteren and Woets (1988) were:•Internalsynchronizationwiththepest(abletodeveloptotheadultstage).•Adaptation to the greenhouse climate.•No negative effects on other natural enemies.•Mass production is possible.•High pest kill rate.•Good searching ability.
Although specialists are well adapted to their host and can be very effective, they often disappear when prey densities have been reduced and need to be released whenever pests resurge. As they are used mainly to obtain rapidcontrolofspecificpests,theirefficacyrequireshighquantitiesandqualityandintensivemonitoringtoassure accurate timing of the intervention.
Currently, biological control of pests is increasingly based on generalist predators combined with methods to conserve and augment them (Messelink et al. 2014a). For this approach, different criteria for evaluation are needed. These could be:•Abilitytoestablishonalternativeorplant-providedfoodsources.•Behaviour in food webs with multiple prey and food sources.•Adaptation to the greenhouse climate.
Other criteria such as the development on the target pest are less important as generalists can complement their diets with supplemental food sources. However, negative effects on other insects can often not be excluded, as most generalist predators not only feed on pests, but also on other natural enemies. This is not necessarily bad for biological control (Janssen et al. 2006, Messelink et al. 2012). Mass production is still important, but released densities of generalist predators can be rather low when crops are “inoculated” with natural enemies, thus generalists predators can even be interesting with a suboptimal mass production system. The high pest kill rate and good searching ability are also less relevant, as these criteria can be compensated by a good establishment and high predator densities.
For evaluation experiments with natural enemies, these different criteria need to be considered. A common mistakeisthatnaturalenemiesaremostlyjudgedontheirefficacywhenappliedcurativelyorontheirpredationcapacities per individual, thereby underestimating the effects on a population level. For example, generalist predatory mirid bugs were not effective in controlling aphids when released curatively, but preventive releases was very effective (Messelink et al. 2014b).
Quality control of natural enemies before trials beginNatural enemies obtained from commercial producers should always be checked for their quality. Quality control criteriainclude,forinstance,thenumberofenemiesdelivered,theiremergencerate,fitness,fecundity,sexratioetc.SomepracticalguidelinesareprovidedbytheInternationalOrganizationforBiologicalControl(IOBC)(vanLenteren 2003), which can be used in research. The natural enemies supplied by producers are not always of good quality and this may become worse during transport. Moreover, the age and storage conditions of natural enemyproductsareoftenunknownandthiscansignificantlyaffecttheirperformance.Forthesereasonsitishighly recommended to rear natural enemies for at least one generation for trial purposes in order to know the exactage,andtogettherightstageand“fit”naturalenemies.Thesamemaycountforthepestspeciesthatarereleasedtotestnaturalenemies.Itisfinallyimportanttorealizethatsomepeststagesareinvulnerabletotheirnatural enemies. Thereby, multiple releases of the pests and predators may be required to obtain a stable stage distribution.

Guidelines for Experimental Practice | 47
Setting up a greenhouse trial to test the efficacy of a natural enemyGreenhousetrialsforevaluatingnaturalenemiescanbecomplex,asmanyfactorsmayinfluencetheoutcomeof the trial. Firstly, the plants and the soil or growing media used should be free from pesticide residues. This is less of an issue in a dedicated organic research facility but organically acceptable chemicals will have effects on beneficialorganisms.Evenwhenpesticidesarenotapplied,theycouldstillunintentionallybeaddedtoplantsorsoil when low levels are present in, for example, the watering system. This should be checked carefully before starting an experiment. Secondly, vapours of earlier applied pesticides in greenhouse compartments can affect pests and natural enemies afterwards. Thirdly, pesticide applications used to control other organisms should be avoided as much as possible as these can strongly affects the results of the experiments. For example, sulphur used against powdery mildew will also affects predatory mites and bugs.
The setup of a greenhouse trial needs to take into account deviations in temperature, humidity, watering and light.Randomizedblockdesignsareoftenrequiredtocorrectdifferencesingreenhouseclimateandsunlightwithingreenhousecompartments.Alsothewateringandnutrientsupplyshouldbehomogenized.Fluctuationsin the watering systems which may strongly affect the behaviour of certain pests such as aphids should be prevented.Experimentalunitsneedtobeseparated,particularlywhennaturalenemiesandpestsareabletoflyor migrate. This can be achieved with separated greenhouse units. As budgets and facilities are often a limiting factor,scientistsmaychoosecagesfortheexperiments.Thenthemeshsizeoftheinsectgauzeneedstobesuitable to prevent insects from escaping. However, this also needs to be in balance with the ventilation capacity and light transmission. Finally, the number of plants per experimental unit should be high enough to handle a population increase (i.e. the carrying capacity). More plants are often also needed to get higher humidity levels. Plants should also be old enough to represent a real crop situation. For example, sweet pepper plants that have startedfloweringmaygivetotallydifferentresultsthannon-floweringplants,asthepollenandnectarcanbealternative food sources for both the pests and natural enemies.
Methods for observationsPopulations of pests and natural enemies can be followed by direct observations on the plants, but often samples need to be taken to do observations under a binocular microscope. Leaves or other plant parts can be cut from the plants and transported in separate bags to the laboratory. At low densities more samples should be taken; it is important to have enough plant material in each experimental unit to be able to do this. Some samples can be stored at about 10 °C when it is not possible to do all observations on one day. This works well for predatory mites,thrips,andwhiteflies,butlesssoforaphidsthatstarttowalkaround.Theobservednaturalenemiesandpestshouldalwaysbeidentifiedtospecieslevel.Thisisparticularlyimportantforsmallspeciesthataredifficultto distinguish, such as predatory mites or thrips. It often happens that species of natural enemies are found inexperimentsotherthanthosethatwerereleasedthroughinvasionsofnaturallyoccurringspecies-evenincages that you would expect to keep out unwanted organisms. Such organisms always need to be mounted in microscopicslidesandidentifiedunderamicroscope.
Summary of tips and tricksSelection criteria of natural enemies depend on the species and intended application:•Always check the quality of products with natural enemies, but preferably produce your own natural enemies
and pests for experiment.•Check the planting material, soil and facilities for pesticide residues.•Homogenizeyourgreenhouseset-upforeffectsoflight,temperature,humidity,andwaterandcorrectwith
block designs.•Use the right insect cages to separate units.•Adapt the sampling to the insect/mite densities.•Always check the identity of the observed species.
48 | Guidelines for Experimental Practice
References and further informationHussey, N. W., and L. Bravenboer. 1971.
ControlofpestsinglasshouseculturebytheintroductionofnaturalenemiesPages195-216inC.B.Huffaker,editor.BiologicalControl.PlenumPress,NewYork-London.
Janssen, A., M. Montserrat, R. HilleRisLambers, A. M. d. Roos, A. Pallini, and M. W. Sabelis. 2006. IntraguildPredationUsuallydoesnotDisruptBiologicalControl.Pages21-44inJ.BrodeurandG.Boivin,editors. Trophic and Guild Interactions in Biological Control. Springer Netherlands, Dordrecht.
Messelink, G. J. 2014. Persistent and emerging pests in greenhouse crops: Is there a need for new natural enemies? IOBC/wprs Bulletin102:143-150.
Messelink,G.J.,J.Bennison,O.Alomar,B.L.Ingegno,L.Tavella,L.Shipp,E.Palevsky,andF.L.Wäckers.2014a.
Approaches to conserving natural enemy populations in greenhouse crops: current methods and future prospects.BioControl59:377-393.
Messelink, G. J., C. M. J. Bloemhard, H. Hoogerbrugge, J. van Schelt, B. L. Ingegno, and L. Tavella. 2014b. Evaluation of mirid predatory bugs and release strategy for aphid control in sweet pepper. Journal of applied entomology:n/a-n/a.
Messelink, G. J., M. W. Sabelis, and A. Janssen. 2012. Generalistpredators,foodwebcomplexitiesandbiologicalpestcontrolingreenhousecrops.Pages191-214inM.L.LarramendyandS.Soloneski,editors.Integratedpestmanagementandpestcontrol-currentandfuture tactics. InTech, Rijeka.
Pilkington, L. J., G. Messelink, J. C. van Lenteren, and K. Le Mottee. 2010. "ProtectedBiologicalControl"-Biologicalpestmanagementinthegreenhouseindustry.BiologicalControl52:216-220.
van Lenteren, J. C. 2003. Quality control and production of biological control agents : theory and testing procedures. CABI, Wallingford.
van Lenteren, J. C. 2012. The state of commercial augmentative biological control: plenty of natural enemies, but a frustrating lack of uptake.BioControl57:1-20.
van Lenteren, J. C., and J. Woets. 1988. Biologicalandintegratedpestcontrolingreenhouses.AnnualReviewofEntomology33:239-269.
3.4.3 Enhancementstobiodiversityusingflowerstrips
By Jérôme Lambion
Habitatmanagementbyagro-ecologicalinfrastructures(suchasflowersstrips)aimsatenhancingthepresenceof indigenous predators and parasitoids and thus conserving natural enemies close to the crop which is to be protected. The ultimate goal is to provide natural enemies to the crop, preferably early in cropping season at low cost and with high populations.
Plant species choiceWhenchoosinghost-plantspecies,attentionshouldbepaidtothefollowingrequirements:•The crop should offer good ability to host the enemies. •The risk of hosting pests and diseases that may later move into the crop should be low. •The host plants should have good resilience (low requirements for water etc.).•Seed should be available commercially at a reasonable price. •Theannualorperennialcycleoftheplantsshouldbeabletodeveloptheagro-ecologicalinfrastructure(AEI).
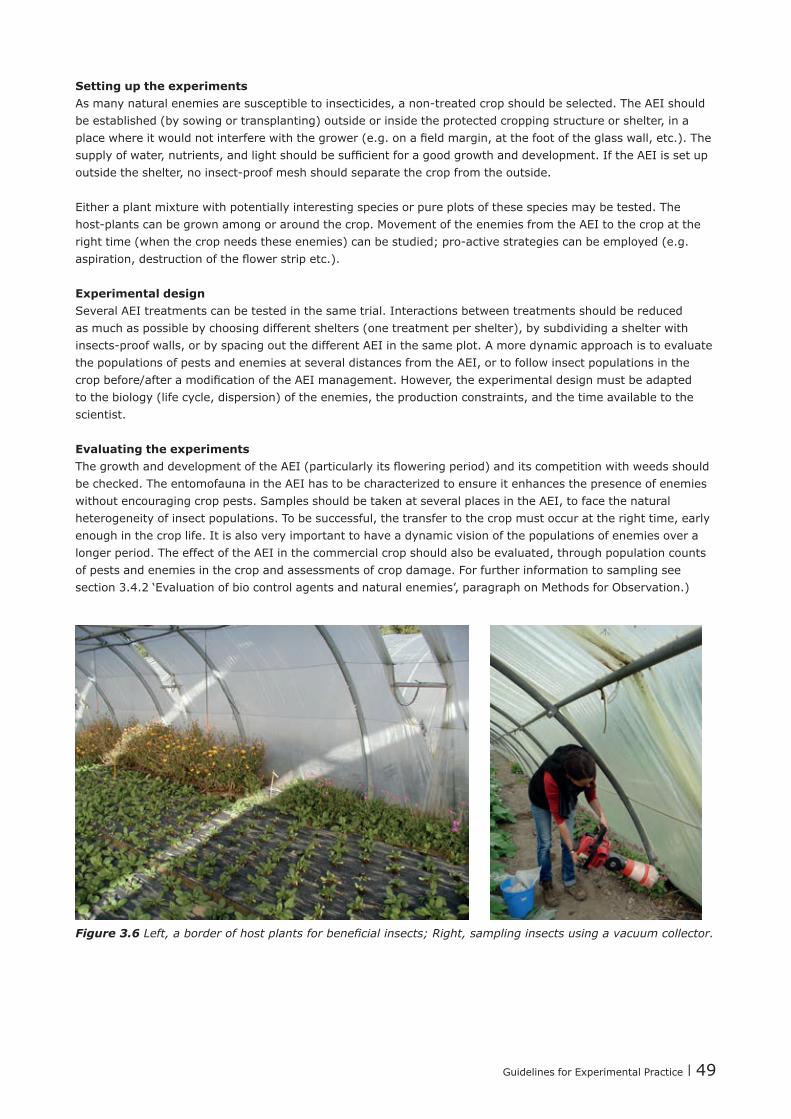
Guidelines for Experimental Practice | 49
Setting up the experimentsAsmanynaturalenemiesaresusceptibletoinsecticides,anon-treatedcropshouldbeselected.TheAEIshouldbe established (by sowing or transplanting) outside or inside the protected cropping structure or shelter, in a placewhereitwouldnotinterferewiththegrower(e.g.onafieldmargin,atthefootoftheglasswall,etc.).Thesupplyofwater,nutrients,andlightshouldbesufficientforagoodgrowthanddevelopment.IftheAEIissetupoutsidetheshelter,noinsect-proofmeshshouldseparatethecropfromtheoutside.
Either a plant mixture with potentially interesting species or pure plots of these species may be tested. The host-plantscanbegrownamongoraroundthecrop.MovementoftheenemiesfromtheAEItothecropattherighttime(whenthecropneedstheseenemies)canbestudied;pro-activestrategiescanbeemployed(e.g.aspiration,destructionoftheflowerstripetc.).
Experimental designSeveral AEI treatments can be tested in the same trial. Interactions between treatments should be reduced as much as possible by choosing different shelters (one treatment per shelter), by subdividing a shelter with insects-proofwalls,orbyspacingoutthedifferentAEIinthesameplot.Amoredynamicapproachistoevaluatethe populations of pests and enemies at several distances from the AEI, or to follow insect populations in the cropbefore/afteramodificationoftheAEImanagement.However,theexperimentaldesignmustbeadaptedto the biology (life cycle, dispersion) of the enemies, the production constraints, and the time available to the scientist.
Evaluating the experimentsThegrowthanddevelopmentoftheAEI(particularlyitsfloweringperiod)anditscompetitionwithweedsshouldbechecked.TheentomofaunaintheAEIhastobecharacterizedtoensureitenhancesthepresenceofenemieswithout encouraging crop pests. Samples should be taken at several places in the AEI, to face the natural heterogeneity of insect populations. To be successful, the transfer to the crop must occur at the right time, early enough in the crop life. It is also very important to have a dynamic vision of the populations of enemies over a longer period. The effect of the AEI in the commercial crop should also be evaluated, through population counts of pests and enemies in the crop and assessments of crop damage. For further information to sampling see section 3.4.2 ‘Evaluation of bio control agents and natural enemies’, paragraph on Methods for Observation.)
Figure 3.6 Left, a border of host plants for beneficial insects; Right, sampling insects using a vacuum collector.

50 | Guidelines for Experimental Practice
3.5 Other types of experiments
3.5.1 Evaluation of greenhouse infrastructure
By Frank Kempkes
The type of covering material of a protected cropping structure can have a huge effect on the indoor climate. Two main types of material are currently in use: glass and plastic. In principle the approach for an experimental setup does not differ between these two basic materials. The most important consideration regarding to the setup of the experiment is the greenhouse plot area. This can depend on location and season of the experiment. Sunlight can be diffuse or direct. If we have a fully clouded sky we can assume the light is diffuse. If we have a clear sky upto90%ofthelightcanbedirectbutalwaysatleastasmallfractionofthelightisdiffuse.Whetheryouhaveacover with a diffusing effect (as most plastics partially have) or no diffusing effect at all as for ordinary glass, the plotsizefortheexperimentcandiffersubstantiallyifweconsidermultispangreenhouses.
Figure 3.7 Shows how transmissivity of light through four contrasting materials depends on its wavelength. Some materials have a complete block of the UV light that can have negative effects on insects. For example, it is known that bumblebees need UV light for their orientation. If the covering material is made of polycarbonate thenbumblebeesarenotabletoflyandpollinatecrops.IncontrastPMMAtransmitsalmostallUVlightwhichcanhave negative effect on the life time of used plastics in the greenhouse. Glass is a kind of average between no UV transmittance and complete UV transmittance. For insects the UV A light with a wavelength between 315 and 400nmisofmostimportance.Somecrops(e.g.redlettuce)needsomeUV-Btodeveloptheircolour.
Figure 3.7 Transmissivity of different materials: Glass, PE fi lm, PMMA and PC. (Figure provided by Wageningen UR LightLab).
The transmission of light through a material is also dependent on the angle of incidence of the (direct) light (Figure 3.8). But what is the angle of incidence? In Figure 3.9 the maximum elevation of the sun for the longest and shortest day are shown, in the case of the Netherlands, for a typical ‘Venlo’ type greenhouse cover. The direct light of the sun never enters the greenhouse perpendicular through this cover at this location.
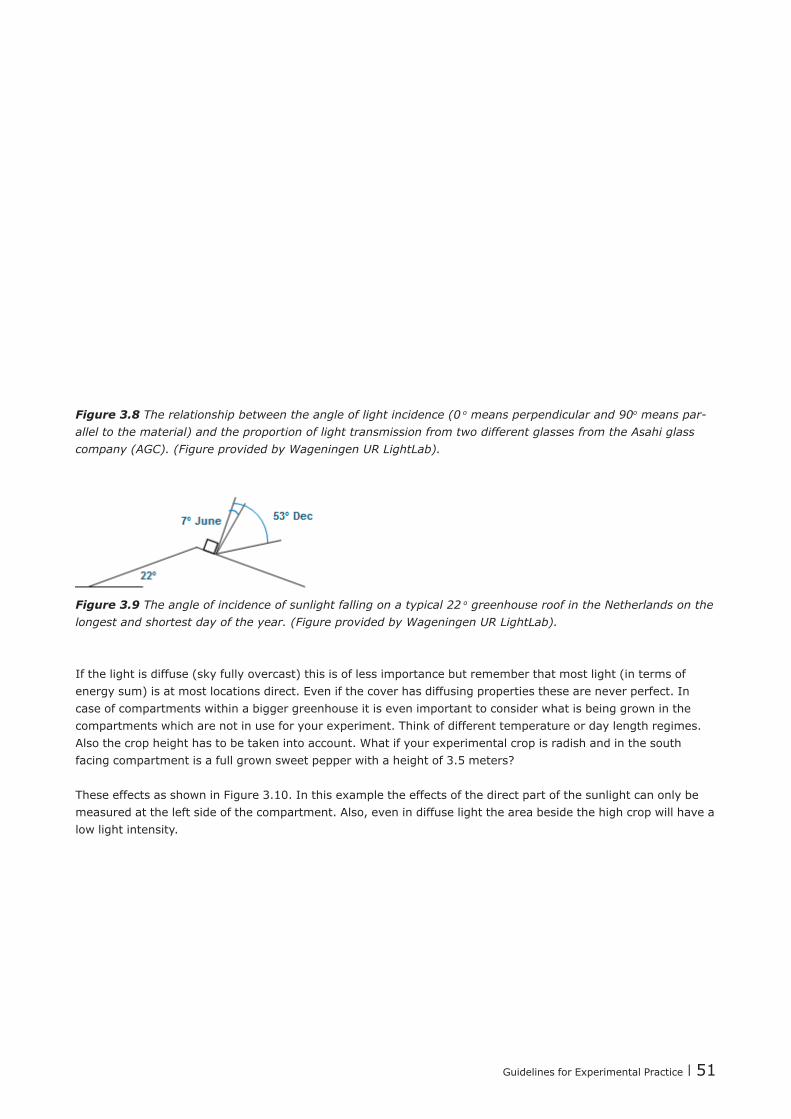
Guidelines for Experimental Practice | 51
Figure 3.8 The relationship between the angle of light incidence (0 o means perpendicular and 90o means par-allel to the material) and the proportion of light transmission from two different glasses from the Asahi glass company (AGC). (Figure provided by Wageningen UR LightLab).
Figure 3.9 The angle of incidence of sunlight falling on a typical 22 o greenhouse roof in the Netherlands on the longest and shortest day of the year. (Figure provided by Wageningen UR LightLab).
If the light is diffuse (sky fully overcast) this is of less importance but remember that most light (in terms of energy sum) is at most locations direct. Even if the cover has diffusing properties these are never perfect. In case of compartments within a bigger greenhouse it is even important to consider what is being grown in the compartments which are not in use for your experiment. Think of different temperature or day length regimes. Also the crop height has to be taken into account. What if your experimental crop is radish and in the south facing compartment is a full grown sweet pepper with a height of 3.5 meters?
These effects as shown in Figure 3.10. In this example the effects of the direct part of the sunlight can only be measured at the left side of the compartment. Also, even in diffuse light the area beside the high crop will have a low light intensity.
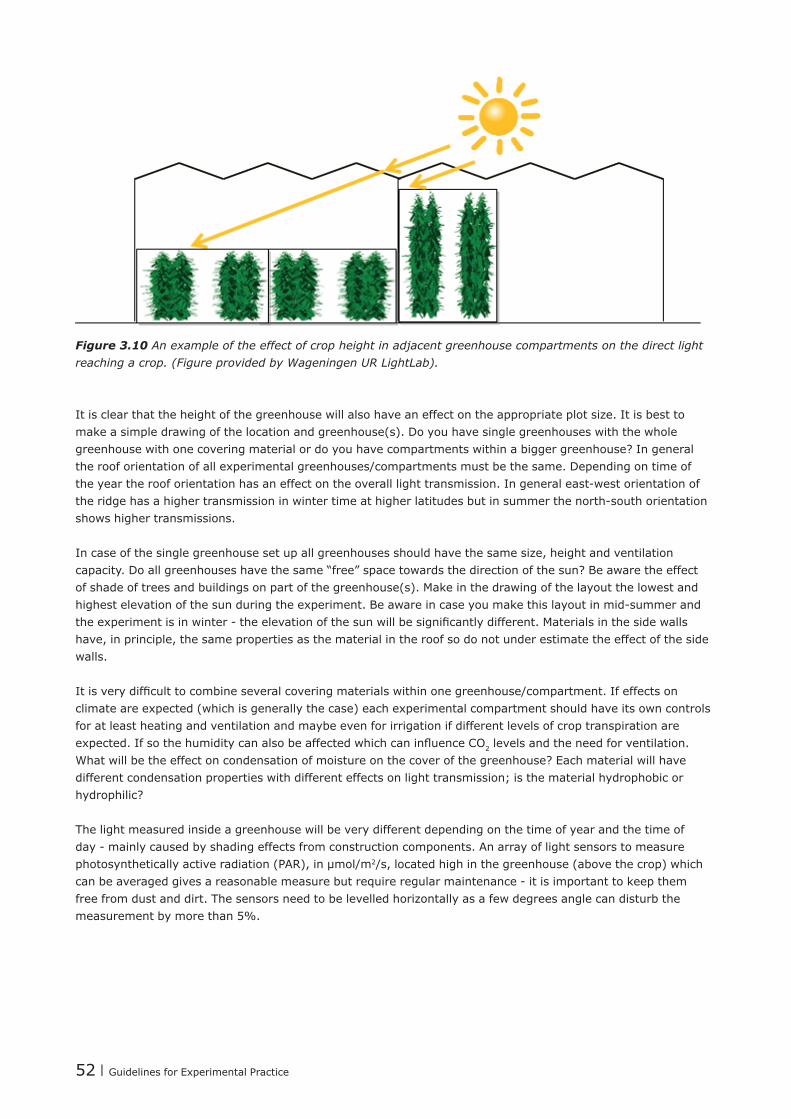
52 | Guidelines for Experimental Practice
Figure 3.10 An example of the effect of crop height in adjacent greenhouse compartments on the direct light reaching a crop. (Figure provided by Wageningen UR LightLab).
Itisclearthattheheightofthegreenhousewillalsohaveaneffectontheappropriateplotsize.Itisbesttomake a simple drawing of the location and greenhouse(s). Do you have single greenhouses with the whole greenhouse with one covering material or do you have compartments within a bigger greenhouse? In general the roof orientation of all experimental greenhouses/compartments must be the same. Depending on time of theyeartherooforientationhasaneffectontheoveralllighttransmission.Ingeneraleast-westorientationoftheridgehasahighertransmissioninwintertimeathigherlatitudesbutinsummerthenorth-southorientationshows higher transmissions.
Incaseofthesinglegreenhousesetupallgreenhousesshouldhavethesamesize,heightandventilationcapacity. Do all greenhouses have the same “free” space towards the direction of the sun? Be aware the effect of shade of trees and buildings on part of the greenhouse(s). Make in the drawing of the layout the lowest and highestelevationofthesunduringtheexperiment.Beawareincaseyoumakethislayoutinmid-summerandtheexperimentisinwinter-theelevationofthesunwillbesignificantlydifferent.Materialsinthesidewallshave, in principle, the same properties as the material in the roof so do not under estimate the effect of the side walls.
Itisverydifficulttocombineseveralcoveringmaterialswithinonegreenhouse/compartment.Ifeffectsonclimate are expected (which is generally the case) each experimental compartment should have its own controls for at least heating and ventilation and maybe even for irrigation if different levels of crop transpiration are expected.IfsothehumiditycanalsobeaffectedwhichcaninfluenceCO2 levels and the need for ventilation. What will be the effect on condensation of moisture on the cover of the greenhouse? Each material will have different condensation properties with different effects on light transmission; is the material hydrophobic or hydrophilic?
The light measured inside a greenhouse will be very different depending on the time of year and the time of day-mainlycausedbyshadingeffectsfromconstructioncomponents.Anarrayoflightsensorstomeasurephotosynthetically active radiation (PAR), in µmol/m2/s, located high in the greenhouse (above the crop) which canbeaveragedgivesareasonablemeasurebutrequireregularmaintenance-itisimportanttokeepthemfreefromdustanddirt.Thesensorsneedtobelevelledhorizontallyasafewdegreesanglecandisturbthemeasurementbymorethan5%.

Guidelines for Experimental Practice | 53
3.5.2 Irrigation systems
By Martine Dorais
Background According to the growing system (e.g. crops grown in soil or in containerised growing media) the irrigation management of organic greenhouse experiments should consider different factors such as soil characteristics (intermsofsoiltextureandstructure,soiltotalandair-filledporosity,soilheterogeneityandsalinity)andwaterquality. A good water management of organic crops will:•Fulfilplantwaterrequirementsinreal-time.•Optimizemicrobialsoilactivityandnitrogenmineralizationrate.•Prevent anaerobic conditions that reduce root respiration, mineral uptake and water movement in roots, and
consequently have a negative impact on plant growth and productivity that can increase plant susceptibility to disease.
Smartwatermanagementpracticesaregenerallyachievedbymeansofrootzoneorplantsensorsinadditiontoevapotranspirationandwater-uptakemodelsadaptedtoorganiccrops.Thefinetuningofirrigationfororganiccrops is much more complex than for conventional crops. This is due to plant heterogeneity, ion imbalances andpossiblebuild-upofsalinitywhenunbalancedamendmentsandfertilisersareused.Theoptimizationofsoil biological activity is particularly important as this is a main factor in plant productivity and plant health. Fromasustainabilitypointofview,over-irrigationtocontrolsoilsalinityshouldbelimitedtopreventnutrientlossesintotheenvironment.Althoughcropeffluentrecyclingisdifficultwithsoil-grownorganicgreenhousecrops, because collecting drains have to be installed with minimal soil disturbance and contamination from other nearby agricultural or industrial activities, recycling runoff from potted plants can be a successful management practice.Multipletechnologicalapproachesthatintegratebiologicalprocesses(e.g.sandfilter,wetland,passivebioreactor),membranefiltration,ozonation,UVtreatment,andthermaltreatmentmayalsobeusedtorecyclecropeffluentsfromorganiccrops.
Water quality Waterqualityisdefinedbyitschemical,physical,andbiologicalattributes.Itiscloselylinkedtothenativesoil components, the surrounding environment and land use. Irrigation water for organic crops should have a low concentration of salts (e.g. Na, Cl, SO4) and sodicity, be low in dissolved organic compounds, free of plant and human pathogens, heavy metals (e.g. Zn, Cu, Cd, Pb etc) and contaminants (e.g. pesticides, hormones, antibiotics)andnotcontainanyprohibitedcompoundslistedbyorganiccertificationbodies.Lowwaterqualitycanalsoresultindripirrigationcloggingproblems.NeutralizinghighwaterHCO3 content by adding citric oraceticacidstotheirrigationwaterpromotesbiofilmdevelopment,andcausescloggingofdripirrigationsystems. High concentrations of iron compounds in the irrigation water may also block the irrigation system by precipitation. Dissolved organic compounds in the irrigation water constitute a driving force for microbial growth in the distributed water and irrigation system which then compete for the oxygen and can provide a potential energysourceforsomeplantpathogens.Theuseofrainwatershouldbethefirstsourceofwaterfororganiccropsduetoitssustainability;itsuseisstronglyencouragedbytheorganiccertificationbodies.
Water requirement Plant water requirements depend on the crops, soil characteristics and water quality. They involve the concepts of the “3Rs”: water should be provided at the right moment, in the right amount, and in the right location. In regions threatened by water scarcity, agricultural water management should also be based on reduced, reused and recycled water use. Irrigation management should thus limit runoff from the surface, deep percolation beneaththerootzoneandsoilwaterevaporationafterirrigation.Inpractice,fororganicgreenhousecrops,the amount of water given to a crop is based on its evapotranspiration rate, which depends on incident solar radiation and greenhouse air temperature and humidity. For organic crops, irrigation practices should also consider the soil microbial activity, the water needs of cover crops (if present, to reduce water competition betweenbothcrops),andtheairhumidityandsoiltemperaturecontrol.Inordertoavoidanysignificantaccumulation of salt at the soil surface, more water is required when the EC of the irrigation water is greater than 0.5 dS /m.

54 | Guidelines for Experimental Practice
Weighinglysimetersareadirect,scientificallybasedmethodusedtoestimategreenhousecropevapotranspiration. This measurement technique is, however, limited in use due to the high cost of equipment.Ontheotherhand,evapotranspirationmodels(e.g.thePenman-Monteithequation)involvingenvironmental parameters and reference crops are widely used. Several evapotranspiration or physiological models have been proposed for greenhouse crops (e.g. Jolliet & Bailey, 1992; Baille et al. 1994;Gijzen,1994;Carmassi et al. 2007a; Elings and Voogt, 2008; Bacci et al. 2011; Ehret et al. 2011) to help achieve good water management in terms of crop performance, product quality, and resource use.
Forexperimentalpurposes,irrigationmanagementisoftenbasedoninterceptedsolarradiation(e.g.1-3mL/joule/cm2 for tomato). Even though there is a close relationship between light and plant evapotranspiration, and consequently their water need, a time lag may be observed between the root water supply and uptake and the physiological water need under some growing conditions. Therefore, soil water content and soil matric potential measurementsconstituteusefultoolstomonitorandcontroltheirrigation.Forthespecifictypeofsoilunderstudy, a water retention curve (i.e. the relationship between soil matric potential in kPa and volumetric water content in cm3 /cm3)canbeeasilydeterminedbymeasuringthewatercontentusingtimedomainreflectometry(TDR)readingstakenatmid-heightofsoilsamplesplacedonatensiontable(Lemay et al. 2012). This water retentioncurveisthenusedtodefinetheappropriateirrigationthreshold.Infact,relationshipsbetweenplantphysiological parameters such as photosynthetic parameters, stomatal conductance or plant transpiration rate and the soil water content or matric potential have been established for different growing media and plants (e.g. Lemay et al. 2012; Dorais et al. 2005). For greenhouse vegetables, the canopy temperature is a poor indicator of the matric potential but a good indicator of the substrate water content during spring (Dorais et al. 2005). Furthermore,measurementswithtimedomainreflectometryprobes(TDR)andloadcellshaveshowngoodcorrelations with the rate of CO2assimilationandChlorophyllafluorescenceFv/Fmratioofcropplants(Lemay et al. 2012; Dorais et al. 2005). However, the relationships between measurements of soil water content or matric potential, and physiological parameters usually vary with the growing media and season. Water requirement based on monitoring various plant stress characteristics such as trunk or branch diameter change, leafwaterpotentialandsapflowarealsousefulmethods(e.g.DeSwaefandSteppe,2010),butneedmoresophisticated apparatus.
Figure 3.11 Soil CO2 flux measurement varies according to soil temperature and moisture content.

Guidelines for Experimental Practice | 55
Water distributionDepending on the growing systems (e.g. soil grown crops or potted plants), different water distribution can be used.Foranexperimentalset-up,theselectedirrigationsystemsshouldensureuniformwaterdistributionwithinthe experimental plots. Each plant should receive the same amount of water per day. Drip irrigation, by using pressure-compensatingdrippers,islargelyusedforpottedplants.Forsoilgrownplants,thisdistributionsystemleavesdryareasbetweendrippersoremitters(driptape),reducingsoilmicrobialactivityandmineralizationrateandlimitingrootgrowthindryerzones.Ontheotherhand,irrigationmethodsthatusemicrosprinklers,whichwetalargerootzone,canresultingreaterNmineralizationincomparisonwithdripirrigation.Thus,stripirrigationwithsmallsprinklersprovidesamoreuniformlyirrigatedsoil,althoughdryzonesbetweenplantrowsstilloccur.Inordertoreduceanydryzone,severalirrigationlineswithemitters,drippersorsprinklersareused(e.g. 4 lines per vegetable crop bed). For leafy vegetables, low crops or seedlings, high level sprinkler irrigation or beam sprinkler irrigation can be used. This distribution system ensures uniform soil humidity but may increase the crop susceptibility to disease as the foliage gets wet.
Experimental design for irrigation studyDepending on the crop population heterogeneity and expected study effect, a representative number of plants per experimental unit and replicates should be used to get an acceptable statistical power, which is the chance that a study will detect an effect when there is an effect there to be detected. Thus, as the power increases, the likelihood of getting a false negative (Type II error) decreases. Power analysis can be used to calculate the minimumsamplesizerequired.Forgreenhouseexperimentaldesign,aminimumof10degreeoffreedomattheerror is generally used, with a minimum of 6 to 8 plants per experimental unit. However, when a large number of replicates is used, one plant per experimental unit can be enough to detect an effect (e.g. in a potted plant experiment).Inordertominimizeuncontrolledgreenhousevariability(e.g.light,temperaturegradient,andsoilheterogeneity),completelyrandomizedblockandLatinsquareexperimentaldesignsareoftenused.
When comparing different irrigation treatments, each experimental plot should be well delimited in order to limit any water or nutrient transfer between studied treatments. Plant guard rows are often used between each experimental plot when the greenhouse experimental area is large enough. In a situation where the greenhouse area is limited experimental plots can be delimited by inserting stiff plastic sheet (at least 30cm deep) between experimental plots. Only plants in the middle of the experimental plot should be sampled for experimental measurements as border plants can be affected by the physical soil barrier and soil disturbance.
Measuring water in soilSoilwatercontentshouldbemeasuredbymethodsthatareaccurateandprovidemeasurementsinreal-timeatspecificdepths,withminimalsoildisturbanceandacceptablespatialrepresentativeness.Thewaterbalancemethod, used to schedule the irrigation event of potted plants, measures the change in soil moisture over a time period, e.g. the weight difference between the water provided by the irrigation event and the losses due to crop evapotranspiration and drainage/runoff. Crop water requirement is then estimated from the available water in therootzone,allowablewaterdeficitofthecropspecies(e.g.40to60%oftheavailablewater)anddailysoilwater balance. For organic soil grown crops, weighing lysimeters can be used with high accuracy as described previously, but do require costly equipment.

56 | Guidelines for Experimental Practice
Figure 3.12 Suction lysimeters are used to collect soil nutrient solution at 15, 30 and 50 cm depth
Suction tensiometers are an indirect method to measure soil water content, since the matric potential has to beconvertedtoavolumetricwatercontentusingawaterretentioncurvespecifictoadefinedtypeofsoilorgrowing media. Because this curve changes whether under a wetting or drying cycle (i.e. soil water hysteresis), the estimation of soil water content based on measurements of matric potential may vary. Consequently, tensiometersaregenerallyusedtoestimateplantwaterflux,andnotthesoilwatercontentper se. Irrigation thresholds based on soil matric potential or soil moisture content have been established for different greenhouse crops.Forexample,amatricpotentialrangingfrom−22to−15mbarrelativetoacontainercapacityof−6mbarwasbeneficialforimprovingthephotosyntheticactivityandyieldofgreenhousetomatoplantsgrownincontainersfilledwithorganicgrowingmedia(Lemay et al. 2012). Based on soil activity, physiological parameters,yield,andfruitquality,matricpotentialthresholdsof−40to−100mbarwereproposedfororganicgreenhousetomatogrowninasandyloamsoil,althoughsimilarmineralizationrateswereobservedfororganicsoilsat−35and−250mbar,whilemaintainingahigherpotential(<−30mbar)resultedinalowersoilmineralcontent (Pepin et al. 2008).
Electronic water content probes are quite commonly used to monitor and control the irrigation of experimental plots. Sensors can be connected to a control system showing the minute to minute daily soil water status in response to irrigation events. For each studied treatment, at least one probe per experimental unit should be installed to get a representative mean value of its soil water status. The cost of these probes can be substantial butaminimumnumberofthreeprobespertreatment(e.g.oneprobeperreplicatewithinthreerandomizedreplicates) should be used to control the irrigation. If the soil or plant heterogeneity is too high (i.e. a large variabilitybetweenthethreeprobes),additionalprobesshouldbeusedtominimizethisvariabilityandincrease the power of the experimental design. The location of the probes within the experimental unit should be representative of the whole plot (experimental unit). For soil grown plants, the moisture probes or suction tensiometersshouldbelocatedwithinthefirst10to25cmdepth,wheremostoftherootsystemislocated.Fororganic potted plants, probes should be located at the mid substrate height. Prior the tensiometer installation, a hole must be made in the soil with a hand auger to limit any soil disturbance and air formation around the probe, whichcansignificantlybiasthereading.
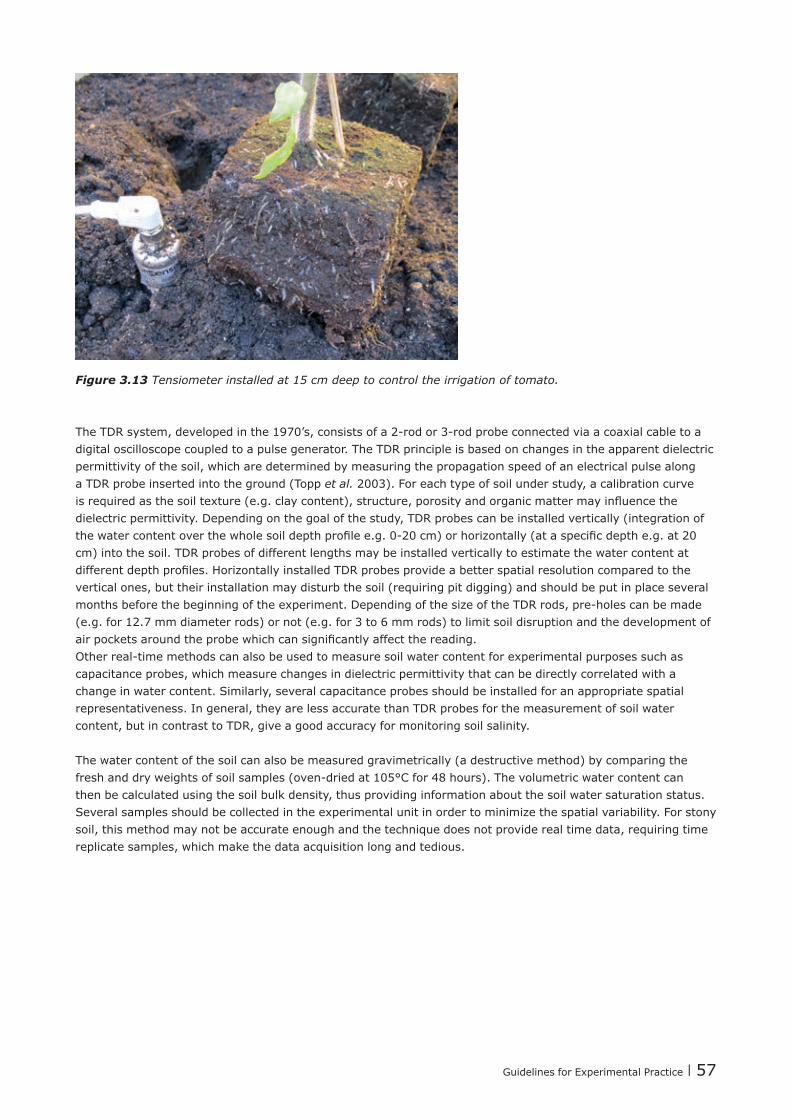
Guidelines for Experimental Practice | 57
Figure 3.13 Tensiometer installed at 15 cm deep to control the irrigation of tomato.
TheTDRsystem,developedinthe1970’s,consistsofa2-rodor3-rodprobeconnectedviaacoaxialcabletoadigital oscilloscope coupled to a pulse generator. The TDR principle is based on changes in the apparent dielectric permittivity of the soil, which are determined by measuring the propagation speed of an electrical pulse along a TDR probe inserted into the ground (Topp et al. 2003). For each type of soil under study, a calibration curve isrequiredasthesoiltexture(e.g.claycontent),structure,porosityandorganicmattermayinfluencethedielectric permittivity. Depending on the goal of the study, TDR probes can be installed vertically (integration of thewatercontentoverthewholesoildepthprofilee.g.0-20cm)orhorizontally(ataspecificdepthe.g.at20cm) into the soil. TDR probes of different lengths may be installed vertically to estimate the water content at differentdepthprofiles.HorizontallyinstalledTDRprobesprovideabetterspatialresolutioncomparedtothevertical ones, but their installation may disturb the soil (requiring pit digging) and should be put in place several monthsbeforethebeginningoftheexperiment.DependingofthesizeoftheTDRrods,pre-holescanbemade(e.g. for 12.7 mm diameter rods) or not (e.g. for 3 to 6 mm rods) to limit soil disruption and the development of airpocketsaroundtheprobewhichcansignificantlyaffectthereading.Otherreal-timemethodscanalsobeusedtomeasuresoilwatercontentforexperimentalpurposessuchascapacitance probes, which measure changes in dielectric permittivity that can be directly correlated with a change in water content. Similarly, several capacitance probes should be installed for an appropriate spatial representativeness. In general, they are less accurate than TDR probes for the measurement of soil water content, but in contrast to TDR, give a good accuracy for monitoring soil salinity.
The water content of the soil can also be measured gravimetrically (a destructive method) by comparing the freshanddryweightsofsoilsamples(oven-driedat105°Cfor48hours).Thevolumetricwatercontentcanthen be calculated using the soil bulk density, thus providing information about the soil water saturation status. Severalsamplesshouldbecollectedintheexperimentalunitinordertominimizethespatialvariability.Forstonysoil, this method may not be accurate enough and the technique does not provide real time data, requiring time replicate samples, which make the data acquisition long and tedious.

58 | Guidelines for Experimental Practice
Measured parameters for irrigation studyWhen conducting an irrigation study, a range of parameters should be measured (in addition to the effects on crop growth and yield): •The greenhouse climatic conditions (solar radiation, air and soil temperatures, humidity e.g. as Vapour PressureDeficit)shouldbecontinuouslymonitoredtoensurethattheirrigationtreatmentsarewelladaptedtothe prevailing growing season. All probes should be regularly checked and maintained to ensure an accurate daily reading.
•The daily water volume supplied per plant, the number of irrigation events and the uniformity of water distribution should be carefully recorded. Variation in the water supply by drip and sprinkle irrigation systems canbeashighas20%.Thisvariationcanbemuchhigherwhendripperandnozzlecloggingoccurduetopoorwaterquality,fertilisationprecipitationandbiofilmformation.
•Drainage water should be measured for each treatment. Suction lysimeters can be installed in each experimental unit to monitor the soil nutrient content, electrical conductivity and pH of the soil solution. Collecting runoff water will also help to control soil salinity and improve water management to reduce nutrient losses to the underground water.
•Soilbiologicalactivityshouldalsobemeasuredonaregularbasistoensuregoodmineralizationrate,forexamplebyusingthefluoresceindiacetatehydrolysis(FDA)methodofAdamandDuncan(2001)orsoilCO2 flux.
References and further informationAdam, G. and Duncan, H. 2001.
Development of a sensitive and rapid method for the measurement of total microbial activity using fluoresceindiacetate(FDA)inarangeofsoils.SoilBiol.Biochem.33:943-951.
Bacci, L., Battista, P., Cardarelli, M., Carmassi, G., Rouphael, Y., Incrocci, L., Malorgio, F., Pardossi, A., Rapi, B. and Colla, G., 2011,
ModellingEvapotranspirationofContainerCropsforIrrigationScheduling,Evapotranspiration-FromMeasurementstoAgriculturalandEnvironmentalApplications,Dr.GiacomoGerosa(Ed.),ISBN:978-953-307-512-9.
Baille, M., Baille, A. and Laury, J.C., 1994, Asimplifiedmodelforpredictingevapotranspirationrateofnineornamentalspeciesvsclimatefactorsandleafarea,ScientiaHorticulturae,Vol.59,217-232.Carmassi,G.,
DoraisM.,Caron,J.,Bégin,G.,Gosselin,A.,GaudreauL.andMénard,C. Equipment performance for determining water needs of tomato plants grown in sawdust based substrates androckwool.2005.ActaHort.691:293-304.
Incrocci, L., Maggini, R., Malorgio, F., Tognoni, F. and Pardossi, A., 2007, An aggregated model for water requirements of greenhouse tomato grown in closed rockwoll culture with salinewater,Agriculturalwatermanagement,Vol.88,73-82.DeSwaefT.,SteppeK.,2010.Linkingstemdiametervariationstosapflow,turgorandwaterpotentialintomato.FunctionalPlantBiology.37,429–438.
Ehret D.L., Hill B.D., Helmer T., Edwards D.R. 2011. Neural network modelling of greenhouse tomato yield, growth and water use from automated crop monitoring data. Computers and Electronics in Agriculture 79:82–89.
Elings, A., Voogt, W., 2008. Managementofgreenhousecroptranspiration:thewayforward.ActaHorticulturae801,1221-1228.
Gijzen,H.,1994. Development of a simulation model for transpiration and water uptake, and of an integral crop model. Report 18,AB-DLO,Wageningen.
Jolliet, O. and Bailey, B.J., 1992. The effect of climate on tomato transpiration in greenhouse: measurements and models comparison. Agr. Forest Meteorol. 58, 43–62.
Lemay, I., Caron, J., Dorais, M., and Pepin, S. (2012) Definingirrigationsetpointsbasedonsubstratepropertiesforvariableirrigationandconstantmatricpotentialdevicesingreenhousetomato.HortScience47,1141-1152.

Guidelines for Experimental Practice | 59
Pepin,S.,Dorais,M.,Gruyer,N.andMénard,C.(2008). Changes in mineral content and CO2 release from organic greenhouse soils incubated under two different temperatures and moisture conditions (poster). In: Cultivating the Future Based on Science, Vol. 1, Organic CropProduction,Proceedingsofthe2ndScientificConferenceoftheInternationalSocietyofOrganicAgriculture Research. ISOFAR, Modena, Italy, pp. 648–651.
Topp G.C., Davis J.L., Annan A.P. 2003. TheearlydevelopmentofTDRforsoilmeasurements.VadoseZoneJournal2:492-499.
3.5.3 Pollination
By Yüksel Tüzel
Theyieldofmostfruit-bearinggreenhousevegetablesdependsonthesuccessoffruitsetwhichislinkedtopollination. Pollination is the transfer of pollen grains to the stigma. Pollen grains are released from the anthers andusuallyfallontothestigmabutingreenhouses,incontrasttoopenfieldproduction,pollinationneedsassistance due to the limited air movement and high humidity. Pollination can be assisted either by using mechanical vibration or by bees and other insects. However, pollen viability and the amount of pollen, both of which are dependent particularly on temperature, are also important for successful pollination.
Mechanical vibrationVibrators, generally battery powered ones, are used in tomato crops by holding them against the stalk of each truss for a few seconds. This should be done at least three times a week between 10.00 am and 3.00 pm due to the lower humidity and higher amount of pollen available during this period (Hochmuth, 2011). Although this methodisgoodpractice,itistime-consuming.
Example of experimental design:Recommended replicates: at least 3Minimum number of plants per treatment: 20 (fruit set should be checked 2 to 3 days after pollination)
Bumble bees Many different bee species can be used as pollinators e.g. hornfaced bees (Osmia cornut) the, honey bee (Apis mellifera) and different bumble bees species (Bombus sp.).The large earth bumble bee (Bombus terrestris) has provedtobemostefficientandiscurrentlyusedasanexcellentpollinationagentingreenhousesworldwide.Bumblebeesareplacedinthegreenhousewithinthehivesandarethenactiveforabout6-8weeks.Theuseof bumble bees increases the yield and fruit quality due to their effects on fruit number and mean fruit weight (Dasgan et al. 2004).
Thehivesareintroducedtothegreenhousewhentheflowersareopen.Theapproximatepollinationrangeperhive is different with different greenhouse vegetable crops (Table 3.1).
Table 3.1The number of hives needed for effective pollination in different vegetable crops (Tuzel, 2013).
Crop Pollination range per hive (m2)
Tomato 2000
Pepper 1000
Eggplant 1000
Melon 1000
Courgette 1000
Strawberry 1000

60 | Guidelines for Experimental Practice
The hives are placed between 0.5 and 1 metre above the ground. They should be protected against sun and condensation of water and efforts should be made to prevent ants or other insects from entering the hives. After placingthehiveinagreenhouse,thebumblebeesneedsometime(½-1hour)tosettledownbeforetheflightholeisopened.Theiractivitydependsonthefloweringofthecropandtinybrownspotsonthestamensshowwhentheyhavevisitedtheflowers.
Figure 3.14 Bobus terrestris pollinating a tomato flower.
Example of experimental design: The bee treatment should ideally be in a different greenhouse or compartment to a control having the same environmentalconditions.Ifithastobeinthesamegreenhousethentheflowersofnon-beetreatmentsshouldbeenclosedwithpaperorfinemuslinforashortperioduntilthefruithasset.Recommended replicates: at least 3 in the greenhouse (randomly placed).Minimum number of plants per treatment: 20.
Flowers should be checked to see if there are brown, bruised spots on the anther cones (a symptom of too much activity/density). Bumble bee activity can be monitored 3 times per week by examining these marks on the antherconesofsenescingflowersin20plantsthatarespreadthroughthegreenhouse(Dogterom et al. 1998; VergaraandFonseca-Buendía,2012).
Assessments can include:•Fruit set: number of regularly grown fruits on a previously marked truss on 20 separate plants. •Fruitsize:Averageweightoffruits(g/fruit).•Fruitdiameter:Fruitscanbeclassifiedintogroups(e.g.1st class/ 2nd class).•Fruit shape: Having the correct variety characteristics (not misshapen). •Seed number: Seed number of each fruit (number/fruit).
References and further informationHochmuth, G.J., 2011.
ProductionofGreenhouseTomatoes-FloridaGreenhouseVegetableProductionHandbook.HS788.Vol3.Hort. Sci. Dept., Florida Cooperative Extension Service, Inst. of Food and Agric. Sciences, Univ. of Florida. http://edis.ifas.ufl.edu/cv266.
Dasgan,H.Y.,Ozdoğan,A.O.,Kaftanoglu,O.andAbak,K.,2004. Effectivenessofbumblebeepolinationinanti-frostheatedtomatogreenhousesintheMediterraneanBasin.TurkJ.Agric.andFor.,28;73-82.
Dogterom, M.H., Matteoni, J.A., Plowright, R.C., 1998. Pollination of Greenhouse Tomatoes by the North American Bombus vosnesenskii (Hymenoptera: Apidae). ApicultureandsocialInsectsJ.Econ.Entomol.91(1):71-75.http://www.entsoc.org/PDF/Pubs/Periodicals/JEE/JEETOCS/PDF/ec019800071.pdf
Guidelines for Experimental Practice | 61
Tuzel,Y.,2013. Cultural practices (Chapter 14). In Good Agricultural Practices for greenhouse Vegetable crops. FAO Plant ProductionandProtectionPaper217:379-398.
Vergara,C.H.,Fonseca-Buendía,P.,2012. Pollination of greenhouse tomatoes by the Mexican bumblebee Bombus ephippiatus (Hymenoptera: Apidae). JournalofPollinationEcology,7(4):27-30.
3.6 Economic evaluation of crop trials
By Ulrich Schmutz
BackgroundOrganicgreenhousehorticultureisaneconomicactivitysoaneconomic(andsocio-economic)assessmentofitis important. Trials to test different varieties or other aspects such as green manures, composts, or biological pest control therefore also require an economic assessment of the measured physical differences in any trial. Forexample,astatisticallysignificantdifferenceinatreatmentalsowillmakeaneconomicdifferencebutthisdifference may have only a very minor economic impact compared to other factors. On the other hand, there maybeeffectswhicharenotsignificantlydifferentata10%,5%or1%errorlevel,butthatneverthelesscouldhaveasizableeconomicorsocialoutcome.Carefulinterpretationisneededtoensurethatanyconclusionsthatare drawn are valid. In general variety trials follow the standards of natural science while economics, as a social science, adds different assessment methods (models, risk assessments, probabilities, proxy values) which can be added (interdisciplinary) or combined (transdisciplinary) into the research design.
Foraneconomicanalysisnospecificchangestoatrialareneeded.Anyexperimentaldesignappliedtomeasurephysicalchangecanalsobeusedasabasisforanadd-oneconomicanalysis.
Experimental design – the gross margin methodA basic method to assess horticultural crops is the gross margin method (Brandao et al. 2005). This is a production economics method to measure the outputs (yield multiplied by price; Y x P) and the inputs which vary directly with the level of production. For example doubling the plants grown means doubling the seed number and the costs for those seeds vary directly (they also double) with the higher production. One could argue that buying or producing seeds in very large quantities can reduce unit costs as a lower price may be negotiated, but this level of detail is not usually considered as it only applies to much larger numbers. All the variable inputs into a crop have costs and they are added together and called ‘variable costs’. The gross margin (GM) is the subtractionofvariablecosts(VC)fromoutput(O)values(cropyieldsorotherby-products).
GM=O-VCwith(O=YxP)
The gross margin method is adopted in both the conventional and organic farm management literature (Nix, 2015 and Lampkin et al. 2014) in the English language and e.g. with some minor changes also as ‘Deckungsbeitrag’ in the German language in the KTBL farm business literature (Redelberger, 2004).
Besides variable costs there are further costs which cannot be directly allocated to the crop grown and among those in protected horticulture are infrastructure costs (glasshouse and machinery) rent, depreciation, certification,officecostsandothers.Thesecostsarecalledfixedcosts(FC)oroverheadcosts.
If the business has only one enterprise with one simple output like milk or tomatoes they are often added in a full-costcalculationandgivefull-costperunitofproduction(e.g.€/litremilkor€/kgtomato)andabreak-evencost,showingatwhatpricetheenterprisebreaksevenandstartsmakingaprofit.Forthepurposeoforganicresearch trials this method is, however, not very useful as an organic business should have at least several crop enterprisesorgreenmanurecropsinarotation.Inaddition,itismoredifficulttosourcefixedandoverheadcosts as they are not published in farm management handbooks. Other farm accountancy publications are needed(orfarmspecificdata,whichisoftenconfidential).

62 | Guidelines for Experimental Practice
Partial budgeting methodA more appropriate method for trials is the partial budget analysis method used in combination with the gross margin method described before. The partial budgeting method assumes that the effect of a change in one input istheonlycauseforanychangeinoutput.Itisthereforeapartialbudget-assumingthatallotherinputsstaythe same and the change in output is only caused by the change input.
We can study this in more detail by using an example of a compost application trial. The trial has four different treatments of compost e.g. control (no compost) low, medium, and high application rate. We record the cost of the compost and the cost of application. The cost of the compost increases with application rate while the application cost (time) is remains the same for all rates. The partial budget method now assumes that all changes measured in yield are only due to the compost directly (and not due to effects of compost on, for example,possiblyreducedpest-controlcosts).
Table 3.2 shows the example results of this type of trial with 4 replications showing the average yields. These areallsignificantlydifferentata5%errorlevelandthisisindicatedbymarkingwithdifferentletters.Itcanthereforebeconcludedthatthebesttreatmentisthehighcompostapplicationbecauseitdeliverssignificantlythe highest yield of 18 kg/m2.
Table 3.2An example of economic evaluation from a compost trial with high compost costs.
Short Unit Control Low Medium High
Compost costs Euro/m2 0 10 20 30
Compost application costs Euro/m2 0 10 10 10
All other variable costs Euro/m2 30 30 30 30
Total variable costs VC Euro/m2 30 50 60 70
Yield Y kg/m2 10a 16b 17c 18d
Price P Euro/kg 4 4 4 4
Output O Euro/m2 40 64 68 72
Gross margin GM Euro/m2 10 14 8 2
However, looking at the gross margin derived by the partial budget this conclusion may be premature. The highest gross margin (14 Euro/m2) is achieved with the low compost treatment. Analysis of variance is here not applicableasthesearemodelledfiguresfromatrialalthoughothermethods(e.g.sensitivityanalysisorMonteCarlo simulation) may be used. It may even be concluded, by some growers, that compost applications are not worth the risk at all at the high compost costs assumed in this example because the increase of gross margin from 10 to 14 Euro/m2 is not enough to compensate for the higher costs and the potentially not so much higher yield. From a grower’s perspective the cost for the inputs are certain at the beginning of the crop while the yield increase is uncertain and high costs at the beginning of a crop without secured higher yield are a burden on cash-flow. In Table 3.3 we have calculated the different situation with lower compost cost (at which compost costs 3, 6 and 9 Euro/m2 for the low, medium and high treatments respectively). Now the highest yielding treatment would also bethemostprofitableone.
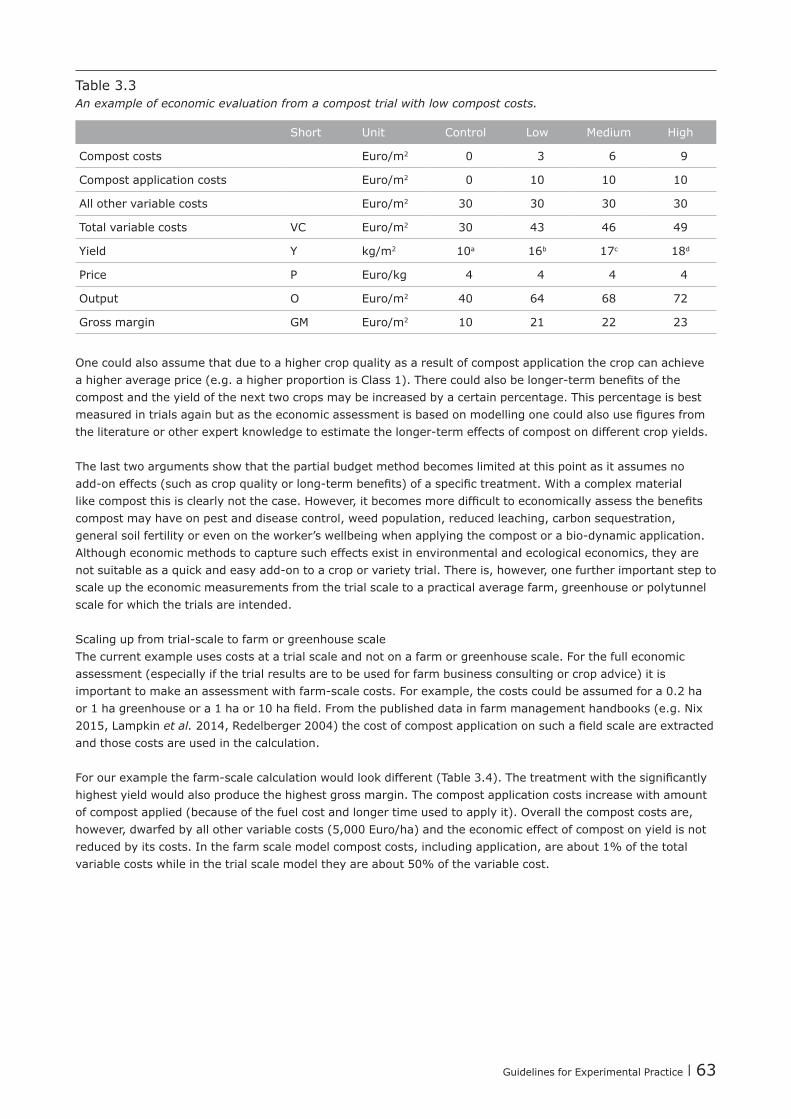
Guidelines for Experimental Practice | 63
Table 3.3An example of economic evaluation from a compost trial with low compost costs.
Short Unit Control Low Medium High
Compost costs Euro/m2 0 3 6 9
Compost application costs Euro/m2 0 10 10 10
All other variable costs Euro/m2 30 30 30 30
Total variable costs VC Euro/m2 30 43 46 49
Yield Y kg/m2 10a 16b 17c 18d
Price P Euro/kg 4 4 4 4
Output O Euro/m2 40 64 68 72
Gross margin GM Euro/m2 10 21 22 23
One could also assume that due to a higher crop quality as a result of compost application the crop can achieve ahigheraverageprice(e.g.ahigherproportionisClass1).Therecouldalsobelonger-termbenefitsofthecompost and the yield of the next two crops may be increased by a certain percentage. This percentage is best measuredintrialsagainbutastheeconomicassessmentisbasedonmodellingonecouldalsousefiguresfromtheliteratureorotherexpertknowledgetoestimatethelonger-termeffectsofcompostondifferentcropyields.
The last two arguments show that the partial budget method becomes limited at this point as it assumes no add-oneffects(suchascropqualityorlong-termbenefits)ofaspecifictreatment.Withacomplexmateriallikecompostthisisclearlynotthecase.However,itbecomesmoredifficulttoeconomicallyassessthebenefitscompost may have on pest and disease control, weed population, reduced leaching, carbon sequestration, generalsoilfertilityorevenontheworker’swellbeingwhenapplyingthecompostorabio-dynamicapplication.Although economic methods to capture such effects exist in environmental and ecological economics, they are notsuitableasaquickandeasyadd-ontoacroporvarietytrial.Thereis,however,onefurtherimportantsteptoscale up the economic measurements from the trial scale to a practical average farm, greenhouse or polytunnel scale for which the trials are intended.
Scalingupfromtrial-scaletofarmorgreenhousescaleThe current example uses costs at a trial scale and not on a farm or greenhouse scale. For the full economic assessment (especially if the trial results are to be used for farm business consulting or crop advice) it is importanttomakeanassessmentwithfarm-scalecosts.Forexample,thecostscouldbeassumedfora0.2haor1hagreenhouseora1haor10hafield.Fromthepublisheddatainfarmmanagementhandbooks(e.g.Nix2015, Lampkin et al. 2014,Redelberger2004)thecostofcompostapplicationonsuchafieldscaleareextractedand those costs are used in the calculation.
Forourexamplethefarm-scalecalculationwouldlookdifferent(Table3.4).Thetreatmentwiththesignificantlyhighest yield would also produce the highest gross margin. The compost application costs increase with amount of compost applied (because of the fuel cost and longer time used to apply it). Overall the compost costs are, however, dwarfed by all other variable costs (5,000 Euro/ha) and the economic effect of compost on yield is not reducedbyitscosts.Inthefarmscalemodelcompostcosts,includingapplication,areabout1%ofthetotalvariablecostswhileinthetrialscalemodeltheyareabout50%ofthevariablecost.
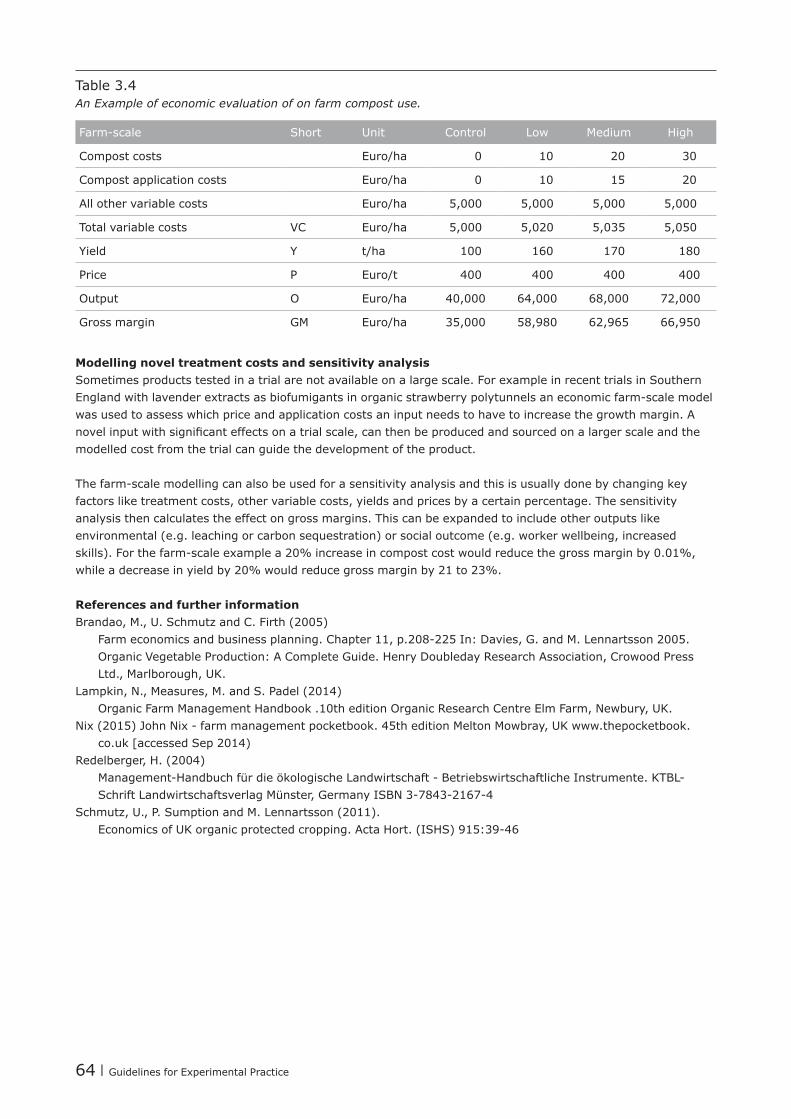
64 | Guidelines for Experimental Practice
Table 3.4An Example of economic evaluation of on farm compost use.
Farm-scale Short Unit Control Low Medium High
Compost costs Euro/ha 0 10 20 30
Compost application costs Euro/ha 0 10 15 20
All other variable costs Euro/ha 5,000 5,000 5,000 5,000
Total variable costs VC Euro/ha 5,000 5,020 5,035 5,050
Yield Y t/ha 100 160 170 180
Price P Euro/t 400 400 400 400
Output O Euro/ha 40,000 64,000 68,000 72,000
Gross margin GM Euro/ha 35,000 58,980 62,965 66,950
Modelling novel treatment costs and sensitivity analysisSometimes products tested in a trial are not available on a large scale. For example in recent trials in Southern Englandwithlavenderextractsasbiofumigantsinorganicstrawberrypolytunnelsaneconomicfarm-scalemodelwas used to assess which price and application costs an input needs to have to increase the growth margin. A novelinputwithsignificanteffectsonatrialscale,canthenbeproducedandsourcedonalargerscaleandthemodelled cost from the trial can guide the development of the product.
Thefarm-scalemodellingcanalsobeusedforasensitivityanalysisandthisisusuallydonebychangingkeyfactors like treatment costs, other variable costs, yields and prices by a certain percentage. The sensitivity analysis then calculates the effect on gross margins. This can be expanded to include other outputs like environmental (e.g. leaching or carbon sequestration) or social outcome (e.g. worker wellbeing, increased skills).Forthefarm-scaleexamplea20%increaseincompostcostwouldreducethegrossmarginby0.01%,whileadecreaseinyieldby20%wouldreducegrossmarginby21to23%.
References and further informationBrandao,M.,U.SchmutzandC.Firth(2005)
Farmeconomicsandbusinessplanning.Chapter11,p.208-225In:Davies,G.andM.Lennartsson2005.Organic Vegetable Production: A Complete Guide. Henry Doubleday Research Association, Crowood Press Ltd., Marlborough, UK.
Lampkin, N., Measures, M. and S. Padel (2014) Organic Farm Management Handbook .10th edition Organic Research Centre Elm Farm, Newbury, UK.
Nix(2015)JohnNix-farmmanagementpocketbook.45theditionMeltonMowbray,UKwww.thepocketbook.co.uk[accessedSep2014)
Redelberger, H. (2004) Management-HandbuchfürdieökologischeLandwirtschaft-BetriebswirtschaftlicheInstrumente.KTBL-SchriftLandwirtschaftsverlagMünster,GermanyISBN3-7843-2167-4
Schmutz,U.,P.SumptionandM.Lennartsson(2011). EconomicsofUKorganicprotectedcropping.ActaHort.(ISHS)915:39-46

Guidelines for Experimental Practice | 65
3.7 Participative experiments and on farm research
By Ulrich Schmutz and Francis Rayns
Participatory action research (PAR)This is an approach to conduct research in association with communities and stakeholders involving participation and practical action. PAR seeks to understand the world by trying to change it, collaboratively and following reflection.Ithasbeenusedinmanydifferentpartsoftheworldandworksequallywellwithfarmersandgardenersasstakeholders.PARaddressestheresearchquestionsimportantforthosewhoparticipateasco-researchers. The participants are included in identifying the research question, the research design, practical fieldresearch,andintheanalysisandinterpretationoftheresults.PARemergedinthe1950s,especiallyinrural and community development in the Global South. An online description of participatory research methods is given by Bergold and Thomas (2012), and a leading handbook of Action Research is published by Reason and Bradbury (2006).
Theterm‘citizenscience’isarecentlycoinedtermandenteredtheOxfordEnglishDictionaryin2014.Citizensciencecanbedefinedasscientificworkundertakenbymembersofthepublic,oftenincollaborationwith,orunderthedirectionof,scientificinstitutions.Assuchitcanbeseenasasub-typeofPAR.However,citizenscienceisonlyparticipativeandactionbasedwhencitizensareincludedintotheresearchprocessateverystage.Ifcitizensareonlyusedtocollectdatafromalargesampleunderinstructionfromaninstitutionthiscannot be called PAR.
AusefulbackgrounddocumentoncitizenscienceistheEUCommission’sgreenpaper(Socientze,2013)andwhitepaper(Socientze,2014).Thesepublicationsaimtofostertheinteractionbetweenthecitizensciencestakeholders and the EU policy institutions, reinforcing the culture of consultation and dialogue in the EU. This whitepaperdefinescitizenscience,as“broadnetworksofpeoplecollaboratingwhereparticipantsprovideexperimentaldataandfacilitiesforresearchers,raisenewquestionsandco-createanewscientificculture”.Thisnewco-createdscientificculturecanbesimilartotheonetowhichPARaspires.Apracticalguidetocitizenscience,specificallytostudybiodiversityandtheenvironment,canbedownloadedfromtheUKEnvironmentalObservation Framework (Tweddle et al. 2012).
Example of PAR and citizen scienceTherearemanygoodPARexamples,howeveroneofthemostlong-runningisthatoftheUKcharityHenryDoubledayResearchAssociation(HDRA,currentworkingnameGardenOrganic),whichhasconductedcitizenscience experiments for more than 50 years. They are known as “Members’ Experiments” and the idea was (and stillis)thatcitizensinterestedinorganichorticultureandagricultureformamembershiporganisationwhichthenco-developsresearchintoorganichorticulture“amongfarmers,gardenersandschools”(HDRA,1960;Dehnen-Schmutz et al. 2014). Each year three to ten experiments have been organised with between 50 and 400 participants per experiment. They are provided with background information, methodology/instructions, recording forms, seeds and any specialist materials required. Recurring topics have included soil fertility (especially the use of comfrey), pest and disease control, novel crops and varieties, and biodiversity surveys.

66 | Guidelines for Experimental Practice
Results are shared with all the charities’ members and the wider public (i.e. not only those taking part in the research).Detailedresultsarepublishedinamembermagazineandmanyofthenowwell-knowntechniquesoforganichorticultureweresupportedbyresultsfromtheseexperiments.Somefindingshavealsomadetheirwayintothepeer-reviewedacademicliteraturebutmostofthemarenotopen-accessandhenceremainratherinaccessible.
A recent example of a Member’s Experiment was the use of biochar as a soil amendment. For this more than 300 participants were asked to establish a 1 m2 control plot and an equivalent biochar plot (2 kg per m2). The soil pH and soil structure were assessed by the participants. Participants were given seeds and asked to use the same date, time and sowing method for control and treatment plots. Crop management, watering, and weeding also had to be similar. Measurements were made on crop yield by separating above ground fresh biomass from below ground and weighing separately. Photographs of the produce were taken for a visual comparison and they also recorded harvest time and exact location. An experiment webpage was maintained with guidance, feedback and discussion boards.
WhattoconsiderwhenplanningPARandcitizenscience?Before you start:•Include participants in planning the research and framing the research questions as much as possible.•Createanon-hierarchicalatmospherewhereallknowledge(e.g.practicalexperience,artisticknowledge,scientificexpertise)isequallyvalid.
•Usedsimpleclearwordsratherthanscientificjargon.•Buildalong-standingresearchnetwork–notshort-term,earlyexitresearch.
During the experiment:•In the research design use simple but effective questions, don’t overload participants with data recording.•Provide good guidance on the research background and material and methods used.•Provide seeds and any other materials needed for the research, together with clear instructions.•Aim for a large as possible participation as this will make the results more robust.•Interactwithparticipantsregularly(e.g.throughawebsite)notjustwhentheprojectisfinished.•Include other social and environmental aspects like economics, biodiversity, health and wellbeing.•Askforfeedback,includingsocialandenvironmentalaspects,evenifthismoredifficulttoanalyseandcaptureandincorporatethefeed-backintonextyear’sresearchdesign.
After the experiment:•Usegoodunderstandablegraphics,picturesandvisualaidstocommunicateresultswiththecitizenscience
community.•Use statistical analysis wherever appropriate.•Publishinappliedjournalsandusermagazinesreadbyyouraudience.Useinternet,smarttechnologyand
social media as appropriate.•Alsopublishinpeer-reviewedjournals,howeveronlyifthesehaveopen-accesstocitizenscientists.•Buildalong-standingresearchnetwork,uselessonslearnedfornextyear’sexperiments.

Guidelines for Experimental Practice | 67
References and further informationBergold, J. and S. Thomas (2012).
Participatory Research Methods: A Methodological Approach in Motion. Forum: Qualitative Social Research, 13(1).Art.30,www.qualitative-research.net/index.php/fqs/article/view/1801/3334
Dehnen-Schmutz,K.,G.Foster,S.PerselloandF.Rayns(2014): GardenOrganicMembers'Experiments:A50yearhistoryofcitizenscienceinthegarden.WildlifeGardeningConference:CitizenScienceandBiologicalRecordingintheGarden.NaturalHistoryMuseum,London,Nov-2014, http://bit.ly/1GdVum6
Henry Doubleday Research Association – HDRA (1960) Memorandum: About the association. www.gardenorganic.org.uk
Reason, P. and H. Bradbury Editors (2006) Handbookofactionresearch.SagePublications,London,UK,ISBN978-1-4129-2030-8.
Socientize/EUCommission(2013) Greenpaperoncitizenscience.CitizenscienceforEurope.Towardsabettersocietyofempoweredcitizensandenhancedresearch.Socientizeproject.www.socientize.eu
Socientize/EUCommission(2014) WhitepaperoncitizenscienceforEurope.Socientizeproject.www.socientize.eu
Tweddle, J., L. Robinson, M. Pocock, and H. Roy (2012). Guidetocitizenscience:developing,implementingandevaluatingcitizensciencetostudybiodiversityandtheenvironmentintheUK.NaturalHistoryMuseumandNERCCentreforEcology&HydrologyforUK-EOF.www.ukeof.org.uk/resources/citizen-science-resources

68 | Guidelines for Experimental Practice

Guidelines for Experimental Practice | 69
4 Guidelines for Selected Crops
4.1 Introduction
By Francis Rayns
ThischapterprovidesspecificinformationforthemajorgreenhousecropsgrowninEuropeandisintendedtosupport Chapters 2 and 3. It is arranged by crop type (fruit vegetables, leafy vegetables, other vegetables, transplants, herbs, perennial fruit and ornamentals). Not every possible crop is included; if the one you intend to use is missing then read though the sections that cover the most similar ones. To avoid too much repetition the most important crops (e.g. tomatoes) are covered in most detail.
General crop requirementsThis section describes the characteristics of the crop, the maximum and minimum temperatures that it can be grown under and other factors such as any need for pollinating insects.
Experimental guidelinesHerewesuggesttheminimumplotsize/minimumnumberoftestplantsandthenumberofreplicatesthatareneeded. To some extent this will depend on the purpose of the experiment; as discussed earlier it is possible to conduct variety screening trials with only two replicates but at least four are needed for pest and disease control trials. For trials of soil amendments, especially if these are to run for several years, then larger border areas are needed around the experimental plots. Ideally the same experiment should be repeated in several locations and insuccessiveseasonsbeforetheresultsarepublishedtomakesurethatthefindingsarerepeatable.Sometimesthe standard farm practice with regard to the density of planting varies across Europe and may depend on whether the greenhouse is heated or not. The tables therefore contain several columns for the typical spacing in the various situations. We have divided Europe into `Northern`, `Central` and `Mediterranean` Zones but these are obviously generalisations and it is advisable to check on local practice as altitude and proximity to theseawithalsohaveaneffect.IfindoubtfollowtheCPVOprotocols(e.g.TP-117/1foreggplant,TP-44/4fortomatoes).
Sowing and plantingTheinformationinthissectionisagaindividedintogeographicalzonesandaccordingtotheheatingregimeofthe greenhouses. Suggested sowing/planting/harvest times are suggested although these are more relevant to some crops than others – short term salad crops are often sown successively for year round production.
Plant nutritionThe tables in this section are a guide to the nutrient demand of each crop NOT a fertiliser requirement. The numbers given are a compilation of different sources (see Appendix B). The nutrients are usually supplied from the mineralisation of soil organic matter in combination with soil amendments brought into the greenhouse. Forsomecropsitissufficientforthesetobeaddedtothesoilbeforeplantingbutlong-termfruitcrops,e.g.tomatoes, are normally fed, in addition, during the growing period itself. Under ideal growing conditions of temperature and water availability etc. crops will require more nutrients from the soil in order to attain maximum yield. Remember that only a proportion of the total nutrient content of any organic soil amendment will be availabletoplantsinthefirstyearafterapplication.Moreover,theremayfurtherrestrictionsfromyourlocalauthorities or organic growing associations in amount and kind of fertilisers which are acceptable.
For some crops tissue analysis can be used as a guide to appropriate nutrient supply. Typical concentrations are listed in Appendix C.
Crop managementSome crops require pruning and training on support wires etc. This section outlines the main considerations but wherever possible it is best to check that what is suggested conforms to local standard farming practice.
70 | Guidelines for Experimental Practice
Diseases, pests and physiological disordersThe main problems arising from bacteria, fungi, viruses, insects, mites, and nutritional imbalances are outlined here.
Observations and assessment of growthThissectionisconcernedwiththeusuallynon-destructiveassessmentsthatcanbemadeastheplantsgrow.These are particularly important in the characterisation of different varieties.
Harvest and yield assessmentsMethodsaresuggestedforthequantificationoftotalandmarketableyield.Somespecificationsaresuggestedwithregardtoacceptablesizecategoriesetc.butthesewilldifferdependingonmarketchannels.Specificationsfor supermarkets will be much more stringent than for box schemes, resulting in a lower proportion of the crop being considered marketable; this will have an effect on any subsequent economic assessment.
References and further informationThese guidelines are not intended to be a textbook on crop husbandry. It is always worthwhile referring to textbooks and information provided by seed companies etc. Trials should be relevant to real farming conditions and so it is always worthwhile making contacts with local commercial growers and visiting them whenever possible.
The following websites provide guidelines on assessments, particularly with regard to the characterisation of crop varieties:www.eppo.int(European&MediterraneanPlantProtectionOrganization–EPPO).www.cpvo.europa.eu(CommunityPlantVarietyOffice–CPVO).www.upov.int (International Union for the Protection of New Varieties of Plants).
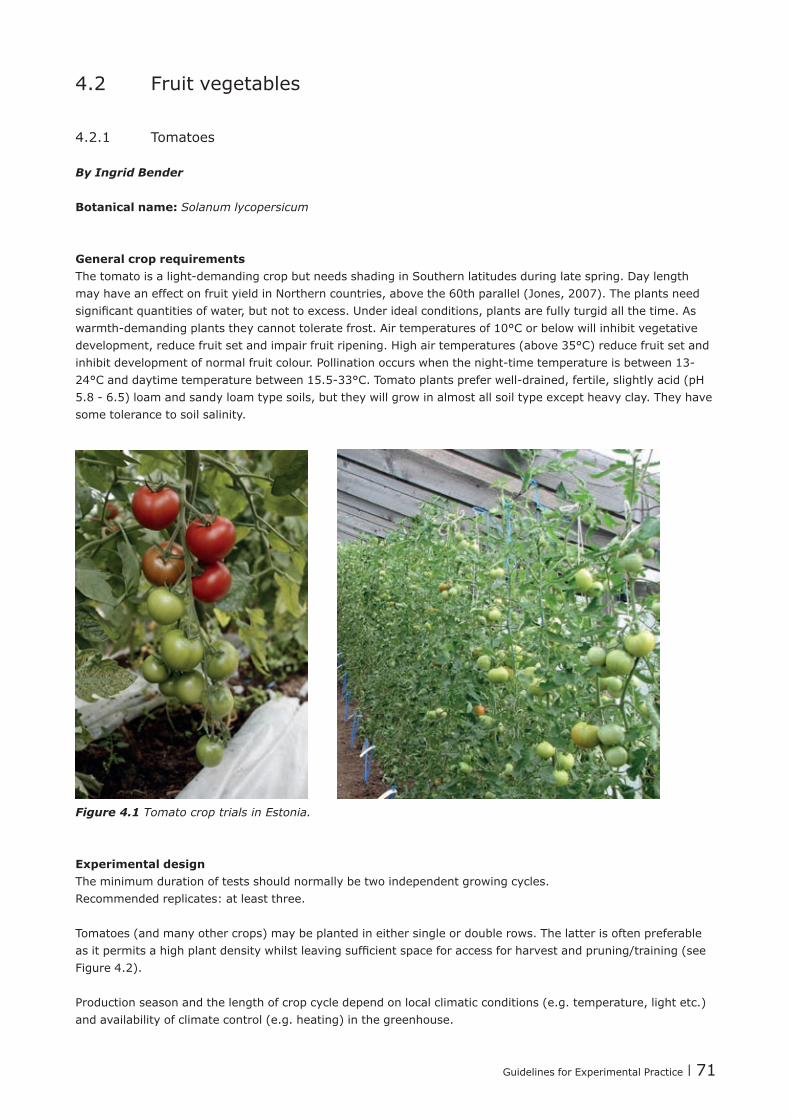
Guidelines for Experimental Practice | 71
4.2 Fruit vegetables
4.2.1 Tomatoes
By Ingrid Bender
Botanical name: Solanum lycopersicum
General crop requirements Thetomatoisalight-demandingcropbutneedsshadinginSouthernlatitudesduringlatespring.Daylengthmay have an effect on fruit yield in Northern countries, above the 60th parallel (Jones, 2007). The plants need significantquantitiesofwater,butnottoexcess.Underidealconditions,plantsarefullyturgidallthetime.Aswarmth-demandingplantstheycannottoleratefrost.Airtemperaturesof10°Corbelowwillinhibitvegetativedevelopment, reduce fruit set and impair fruit ripening. High air temperatures (above 35°C) reduce fruit set and inhibitdevelopmentofnormalfruitcolour.Pollinationoccurswhenthenight-timetemperatureisbetween13-24°Canddaytimetemperaturebetween15.5-33°C.Tomatoplantspreferwell-drained,fertile,slightlyacid(pH5.8-6.5)loamandsandyloamtypesoils,buttheywillgrowinalmostallsoiltypeexceptheavyclay.Theyhavesome tolerance to soil salinity.
Figure 4.1 Tomato crop trials in Estonia.
Experimental design The minimum duration of tests should normally be two independent growing cycles.Recommended replicates: at least three.
Tomatoes (and many other crops) may be planted in either single or double rows. The latter is often preferable asitpermitsahighplantdensitywhilstleavingsufficientspaceforaccessforharvestandpruning/training(seeFigure 4.2).
Production season and the length of crop cycle depend on local climatic conditions (e.g. temperature, light etc.) and availability of climate control (e.g. heating) in the greenhouse.

72 | Guidelines for Experimental Practice
Figure 4.2 Diagram showing the layout of tomato plants using single or double rows (diagram provided by FiBL).
Table 4.1Typical tomato plant spacing and number of plants required for trials.
North & CentralUnheated
North & Central Heated
Mediterranean Unheated (frost-free)
Minimum number of plants / core plot 8 8 8
Minimumsizecoreplot(m²) 3.5 3.5 3.5
Plant density / m² 2.5-3 2.5-3 up to 4
Row distance (cm) double rows e.g. 50 / 100* e.g. 60 / 120* e.g. 50 / 170*
Distance within the row (cm) 30-50 30-50 30-50
*double rows – see Figure 4.2
Table 4.2Typical tomato sowing and harvesting dates.
Region -Productiontype
Sowing Planting Start of harvest
End of harvest Remarks
North & Central -Unheated March Apr-May June October
Ungrafted or grafted crops
-SeasonalHeated December March May October Grafted crops
-LongcycleHeated November January April November Grafted crops
Mediterranean -Longcycle July September November July Grafted crops
-ShortcycleSpring December February April July Grafted crops
-ShortcycleAutumn July September November January Grafted crops

Guidelines for Experimental Practice | 73
Table 4.3Temperatures required for the production of tomato seedlings and plants.
Germination temperature day/ night
Days until germination Temperature for seedlings day / night
Weeks until planting
25 / 20°CVentilation from 26°C
6-8 21 / 19°CVentilation from 24°C
4-7
Table 4.4Optimal temperatures for tomato growth and fruit production.
Day Night Ventilation from
After planting: 22-24°C 20-18°C 25°C
For fruit production 19-22°C 17-19°C 20-24°C
Plant nutritionTomatoes are nutrient demanding plants because of their long growing season (especially when grown in heated greenhouses). Adequate potassium is particularly important for good fruit development.
Table 4.5Tomato plant nutrient requirements.
Yield expectation (kg/m2) N g/m2 P g/m2 K g/m2 Mg g/m2
10 32 4 52 5
25 70 10 114 12
40 92 16 148 20
* adapted from various sources, see Appendix B. Leaf nutrient content given in Appendix C.
Transplant productionAgoodtransplantisonethatisaswideasitistallandisnotyetflowering(Heuvelink,2005).
Pruning and training De-leafingisrequiredtoremoveoldleavesfromthelowerpartoftheplanttoimproveairmovementundertheplantsandtomakethegrowingplantseasiertomanage.Shortlybeforethefirstharvest,thelowerleavescanberemoveduptothefirstfruittruss.Itisthencontinuouslydefoliateduntilthenextharvestabletruss.Atleast16 leaves must be left on the plant. Ungrafted tomatoes are grown with one shoot. Grafted plants can also be cultivated with two shoots. The plants must be regularly pruned by removing all lateral (side) shoots. In normal culture the plants are pruned after reaching the tension wire. In longer culture duration with greenhouses of sufficientheighttheplantscanalsobeconsideredasa'layercrop'.Here,whentheshootreachesthetensionwire more cord is let down to allow the base of the stem to lie along the ground. If the oldest fruit is misshapen ('bunker fruit') it is removed. The optimal fruit number per truss is 14 for cherry tomatoes, 12 for cocktail tomatoes,6to8forregularly-sizedfruitsand4forbeefsteaktypes.
PollinationForpollination,theflowersmustbemechanicallyvibratedtwoorthreetimesperweekorbumblebeesusedaspollinators. One hive is recommended for 2000 m2.Theoptimumtemperatureforpollentubegrowthis21˚C.Above or below this temperature the germination and growth of the pollen tube is reduced, with very poor resultsbelow10˚Corabove35˚C.

74 | Guidelines for Experimental Practice
IrrigationGreenhousetomatoesrequirelargeamountsofwater.Amaturetomatocropuses2-3litresofwaterperplantper day. A greenhouse irrigation system should be able to provide at least 8 litres per m2 per day. Plants should be watered immediately after planting. One week after planting has taken place it is possible to withhold water untilfloweringbegins–thisencouragesgoodrootgrowthastherootsbegintoseekmoisturedeeperintheground.Duringfloweringthedemandforwaterincreases.Waterisbestappliedtothebaseoftheplant(withoutgetting foliage wet) where the entire root area should be thoroughly moistened.
MulchingWhen a mulch is used the moisture is retained for longer, soil temperature is increased and yield improved. Before mulching it is necessary to wait until the plants are rooted and the soil has warmed – about two weeks after setting plants in the greenhouse. Suitable mulch materials include organic mulches such as leaves, grass clippings, several types of straw, pine needles, shredded bark etc. as well as the woven plastic types.
Disease and pest infestation, physiological disorders and other abiotic damageSince there are hardly any effective means for direct control of fungal diseases in organic tomato production, optimalclimatecontroliscritical-especiallysufficientventilationandthereductionofhumidity.Pestsanddiseases may be assessed once or more depending on the length of cultivation. Disease incidence, disease severity and date of assessment (growth stage) should be recorded. For a detailed description of diseases and pestsseetheEuropeanandMediterraneanPlantProtectionOrganizationwebsite:http://www.eppo.int
Diseases (with references to available EPPO Guidelines)•Powderymildew-Oidium lycopersicum, (PP 1/57 (3): Powdery mildew of cucurbits and other vegetables).•Greymold-Botrytis cinerea, (PP 1/54 (3): Botrytis spp. and Sclerotinia spp. on vegetables).•Lateblight-Phytophthora infestans. •Didymellastemandfruitrot-Didymellalycopersici.•Leafmould-Fulvia fulva.•Fusariumwilt-Fusarium oxysporum f sp. Lycopersici. •Bacterialwilt-Clavibacter michiganense subsp. Michiganensis.
Viruses •Tomato mosaic virus (ToMV).•Potato virus Y (PVY).•Spotted wilt disease (SWV).•Double streak (TMV+PVX – potato virus X or CMV).•Pepino mosaic virus.
Pests•Spider mites (PP 1/37 (2) Tetranychus urticae on vegetables). •Whitefly-Trialeurodes vaporariorum EPPO reference (PP 1/36 (2).•Sweetpotatowhitefly-Bemisia tabaci. •Leafminers-Tuta absoluta. Liriomyza bryoniae EPPO reference: (PP 1/177 (2) Leaf miners on vegetables)•Tomatorussetmite-Aculops lycopersici. •Root knot nematodes – e.g. Meloidogyne incognita, M. arenaria and M. hapla.

Guidelines for Experimental Practice | 75
Abiotic damage•Blossom end rot (blackening of fruit due to problems with calcium transport).•Cracking (is the splitting of the epidermis when the internal expansion is faster than the expansion of the
epidermis).•Catface (misshapen fruit caused by something internal or external that occurs during the formation of the flower).
•Internal white tissue (white hard areas in vascular region caused by high temperatures and too much exposure to sun light). Greenback, green shoulder, yellow eye and yellow shoulder are all names for the same condition but with different severities).
•Gold spots (calcium oxalate deposition under the skin).•Puffiness(opencavitiesbetweentheseedgelareaandouterwallcausedbytoolowortoohightemperatures
during fruit set).
Assessments made during crop growth•Overall vigour (1 to 9 scale).•Uniformity of structure (1 to 9 scale).•Side shoot formation (1 to 9 scale).•Leafmass(leafsizeandnumber,1to9scale).•Inter-nodelength(measuredonthreeplantsperplotbetweenthe1stand4thinflorescence,eachthreetimes
to specify the average).•Numberofinflorescences(thenumberoffruitclustersiscountedonfiveplantsperplot).•Missing plants (counted before harvest begins).
Assessments made at harvest •Thetimeofharvestisreachedwiththefirstfruitripening.Thecropyieldwillneedtobeassessedonrepeated
dates during the life of the crop.•Thecropissorted,weighedandcountedaccordingtorecognisedqualitystandards(marketableandnon-
marketable).•Thenon-marketablecropisdividedintomainreasonsforrejectione.g.diseasedfruits,insectdamageand
fruits with physiological disorders.•Taste testing.•Nutritional analysis.
Overall value scoreThis is particularly appropriate for variety trials. It takes into account all the criteria for the cultivation and marketing of the variety, based on expert opinion as evaluated by researchers based on information from farmers, wholesalers and consumers (1 = very low, 3 = low, 5 = medium, 7 = high, 9 = very high).
References and further informationJones, J.,B., 2007.
Tomato Plant Culture: In the Field, Greenhouse, and Home Garden, Second Edition. CRC Press, 404 p.Lattuschke G. 2004.
AnbauvonGewächshausgemüse.HinweisezumumweltgerechtenAnbau.SächsischeLandesanstaltfürLandwirtschaft, Dresden, Germany. (in german). 219 p.
Scharpf and Weier, 1994. Düngung von Unterglasgemüse in Bodenkulturen, Gemüse11/94623-626
Heuvelink, E. (Editor), 2005. Tomatoes. E. CABI Publishing, London, UK, 341 p.
http://www2.ca.uky.edu/entomology/entomology.phphttp://www7.inra.frhttp://www.rhs.org.ukhttp://www.eppo.inthttp://www.cpvo.europa.eu/main/enUPOV Guidelines for the conduct of tests for distinctness, uniformity and stability. Tomatoes (TP/44/4). http://
www.upov.int

76 | Guidelines for Experimental Practice
4.2.2 Eggplant
By Yüksel Tüzel
Botanical name: Solanum melongena Common names: Eggplant,aubergine,melanzana,brinjal,gardenegg,guineasquash
General crop requirementsEggplant is a perennial crop in warm climates. However, it is cultivated as an annual crop under moderate climatic conditions. Plants require high temperatures. The optimum growing temperature range is 21°–30°C. Temperatures above 35°C and below 15°C reduce fruit set. High light intensity from 12 to 14 hours per day is important for plant growth. It is grown in greenhouse conditions in the Mediterranean region while its culture is rare in Northern climatic conditions. Pollination with bumble bees has a positive effect on fruit setting and fruit size.
Figure 4.3 Eggplant crop trials in Belgium.
Experimental design Recommended replicates: A minimum of three.
Sowing and planting: temperature requirements Production season and the length of crop cycle depend on local climatic conditions (e.g. temperature, light) and availability of climate control (e.g. heating) in the greenhouses. Growing season and length of cycle affects plant density. Lower plant densities are recommended for longer seasons. If grafted plants are used, the plant density could be lower.

Guidelines for Experimental Practice | 77
Table 4.6Typical eggplant plant spacing and number of plants required for trials.
North & Central Unheated
North & CentralHeated
Mediterranean Unheated (frost-free)
Minimum number of plants / core plot 12 12 12
Minimumsizecoreplot(m²) 6 6 6
Plant density / m² 1.8-2 2-3 2
Stem density / m² 5-6 4-6 4
Row distance (cm) 80 120 / 80 * 90-100
Distance within the row (cm) 60-70 50 50-60
* double rows – see Figure 4.2
Table 4.7Typical eggplant sowing and harvesting dates.
Region -Productiontype
Sowing at Planting at Start of harvest
End of harvest Remarks
North & Central -Unheated Feb-Mar Apr-May June-July October
Rarely grown in Northern Europe
-SeasonalHeated Jan-Feb Mar-Apr May-June October
Mediterranean -Longcycle
August
Sept-Oct
Jan-Feb
July
Unheated greenhouses
-ShortcycleSpring Oct-Dec February May July Unheated greenhouses
Sowing is carried out in multipots into appropriate growing medium. Temperature demand for germination and seedling growth is high. The seedlings are grown in the nurseries. For grafted seedlings, the seeds of rootstocks are sown three days after the scion seeds. Seedlings are planted when 30cm tall in Northern countries. However, those having developed only two true leaves are transferred to the greenhouse in Mediterranean countries.
Table 4.8Temperatures required for the production of eggplant seedlings and plants.
Region Germination temperature °C day/ night
Days until germination
Temperature for seedlings in °C day / night
Weeks before planting out
North & Central
24-25 3-5 1st stage 22 / 20, later on 20/18 Vent at 25°C
7-9
Mediterranean 24-25 3-5 24 – 26 / 20Vent at 28°C
4
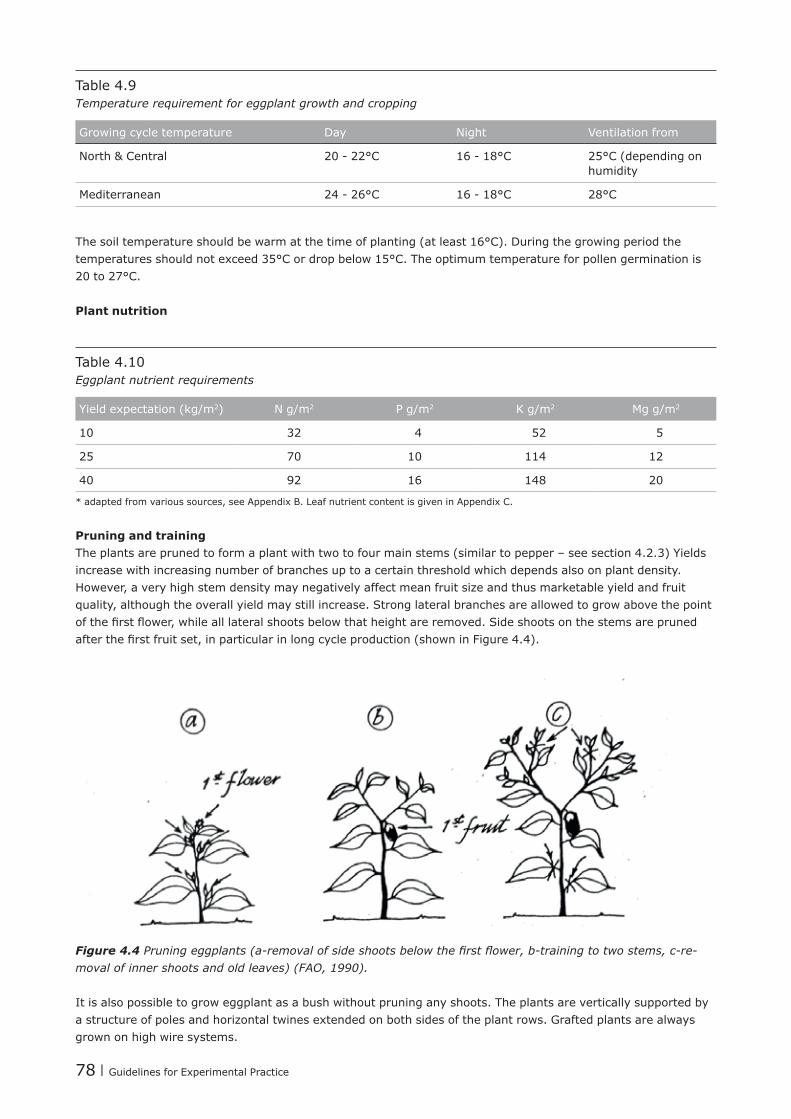
78 | Guidelines for Experimental Practice
Table 4.9Temperature requirement for eggplant growth and cropping
Growing cycle temperature Day Night Ventilation from
North & Central 20-22°C 16-18°C 25°C (depending on humidity
Mediterranean 24-26°C 16-18°C 28°C
The soil temperature should be warm at the time of planting (at least 16°C). During the growing period the temperatures should not exceed 35°C or drop below 15°C. The optimum temperature for pollen germination is 20 to 27°C.
Plant nutrition
Table 4.10Eggplant nutrient requirements
Yield expectation (kg/m2) N g/m2 P g/m2 K g/m2 Mg g/m2
10 32 4 52 5
25 70 10 114 12
40 92 16 148 20
* adapted from various sources, see Appendix B. Leaf nutrient content is given in Appendix C.
Pruning and trainingThe plants are pruned to form a plant with two to four main stems (similar to pepper – see section 4.2.3) Yields increase with increasing number of branches up to a certain threshold which depends also on plant density. However,averyhighstemdensitymaynegativelyaffectmeanfruitsizeandthusmarketableyieldandfruitquality, although the overall yield may still increase. Strong lateral branches are allowed to grow above the point ofthefirstflower,whilealllateralshootsbelowthatheightareremoved.Sideshootsonthestemsareprunedafterthefirstfruitset,inparticularinlongcycleproduction(showninFigure4.4).
Figure 4.4 Pruning eggplants (a-removal of side shoots below the first flower, b-training to two stems, c-re-moval of inner shoots and old leaves) (FAO, 1990).
It is also possible to grow eggplant as a bush without pruning any shoots. The plants are vertically supported by astructureofpolesandhorizontaltwinesextendedonbothsidesoftheplantrows.Graftedplantsarealwaysgrown on high wire systems.

Guidelines for Experimental Practice | 79
PollinationOne bumble bee hive is recommended for every 1000 m2.
IrrigationAteachirrigationeventitisimportanttoensurethatsoilismoistenedsufficiently.Eggplantismoderatelysensitive to salinity.
Mulching and weedingMulching is useful to prevent evaporation and for weed control. Poultry can be useful for weed control too if the plants are not too small and vulnerable.
Disease and pest problems and physiological disordersMore information can be found at www.eppo.int – the European and Mediterranean Plant Protection Organization. Particular problems include:
•Powdery mildew: (Oidium longipes). See EPPO reference (PP 1/57(3) Powdery mildew of cucurbits and other vegetables).
•Grey mould: Botrytis spp. See EPPO reference (PP 1/54(3) Botrytis spp. and Sclerotinia spp. on vegetables).•Verticillium wilt: Verticillium albo- atrum and V. dahliae. •Viral diseases: Cucumber mosaic virus and eggplant special strains of tobamovirus. There are varieties with
resistance to both viruses.
•Insect and mite pests (Shirinivasan, 2009; (more information can be found at www.avrdc.org. AVRDC Publication:09-729.ISBN92-9058-176-X).
• Calcium deficiency: This leads to the formation of uneven fruit. The fruit is then prone to splitting open, especially when growth and water uptake occurs quickly.
Assessments made during crop growth•Vigour.•Missing plants.•Growth habit (1, Very upright; 3, Upright; 5, Intermediate; 7, Prostrate; 9, Very prostrate.•Plant height (1, very short; 3, short; 5, medium; 7, tall; 9, very tall).
Assessments made at harvestYieldEggplantsareharvestedunripewhenthefruitsreachmarketsizeandbeforeseedsbecomelargeandturnbrown in colour. The fruit surface should be glossy. If the outer skin is dull and brown seeds are inside then the optimal harvest time has been exceeded. In a variety trial, harvesting is carried out once a week.
Thecropisclassifiedaccordingtothequalitystandardsformarketableandnon-marketableproduce,andthefruitsineachfractionareweighedandcounted.Theexactsizesspecifiedwilldependonthelocationandthemarket channel but they would typically be:
Elongated fruit shape: Minimum diameter 40 mm, minimum length 80 mm.Rounded fruit shape: No guidelines for minimum diameter, but minimum length should be 70 mm, minimum weight 100 g.
Average fruit weight is mostly around 300 g, depending on the type of fruit. If it is relevant to the question of theexperiment,themarketablefruit,byweight,canbefurthersorted(e.g.100-300g;300-500g;500gandabove).Thenon-marketablefruitscanbesubdividedintothefollowingcategories:smallfruits,rottenanddiseasedfruits,othernon-marketablefruits. Fruit shape and colour Sample at least ten marketable fruits per plot on three separate occasions during harvesttimetoassessfruitshapeandcolourintensity,distributionofcolour(stripesetc.),firmness,lustreandspininess of the calyx. This can be done using 1 to 9 scales (for example Figure 4.5). Fruit length and diameter can also be measured. See CPVO guidelines for more information on how to assess the crop.
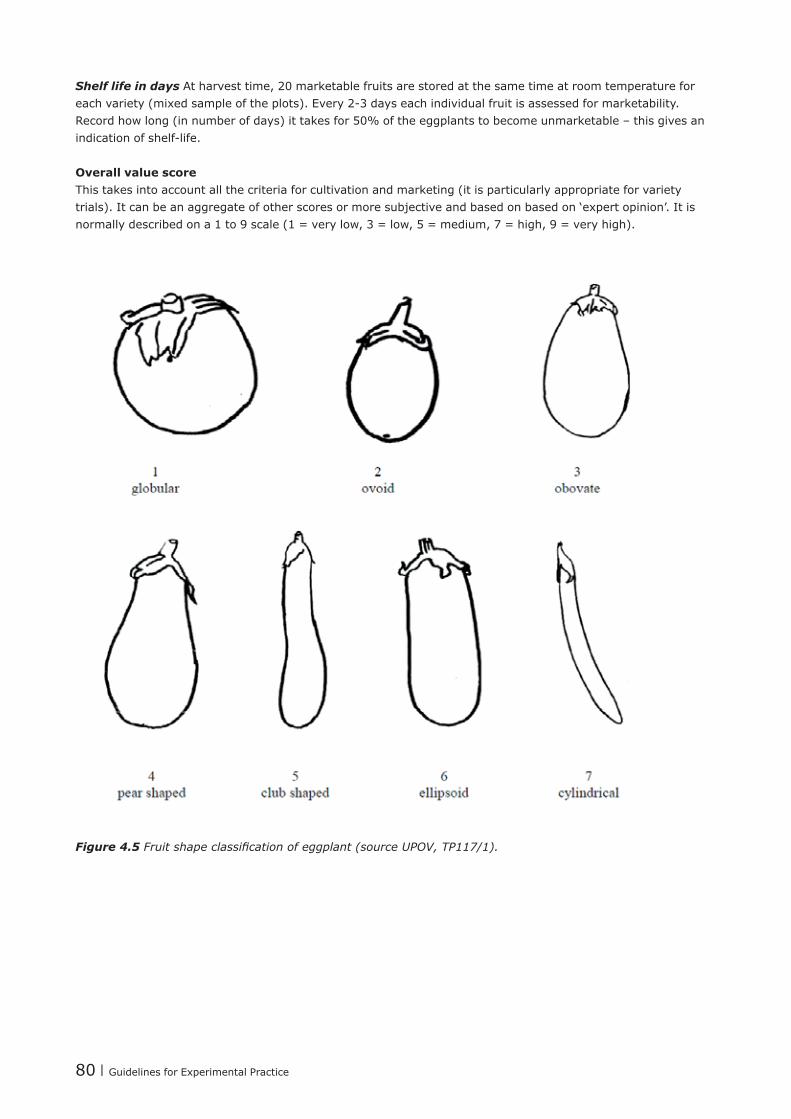
80 | Guidelines for Experimental Practice
Shelf life in days At harvest time, 20 marketable fruits are stored at the same time at room temperature for eachvariety(mixedsampleoftheplots).Every2-3dayseachindividualfruitisassessedformarketability.Recordhowlong(innumberofdays)ittakesfor50%oftheeggplantstobecomeunmarketable–thisgivesanindicationofshelf-life.
Overall value scoreThis takes into account all the criteria for cultivation and marketing (it is particularly appropriate for variety trials). It can be an aggregate of other scores or more subjective and based on based on ‘expert opinion’. It is normally described on a 1 to 9 scale (1 = very low, 3 = low, 5 = medium, 7 = high, 9 = very high).
Figure 4.5 Fruit shape classification of eggplant (source UPOV, TP117/1).

Guidelines for Experimental Practice | 81
References and further informationAnon., 2008.
Minimum descriptors for eggplant, Capsicum (sweet and hot pepper) and tomato. ECPGR Working Group on Solanaceae. (www.ecpgr.cgiar.org)
FAO, 1990. Protected Cultivation in the Mediterranean Climate. FAO Plant Production and Protection paper 90. 313 p.
Gianquinto,G.,Munoz,P.,Pardossi,A.,Ramazzotti,S.,Savvas,D.,2013. Soil fertility and plant nutrition. In Good Agricultural Practices for greenhouse Vegetable crops. FAO Plant ProductionandProtectionPaper217:215-270.
Maas, E.V. 1990. MAAS E.V., 1990. Crop salt tolerance. In: Tanji K.K. (ed.), Agricultural salinity assessment and management. ASCE Manual Reports on Engineering Practices, 71: 262–304.
Shirinivasan, R.,2009. InsectsandMitePestsonEggplant.AfieldguideforidentificationandManagement:(www.avrdc.org.AVRDCPublication:09-729.ISBN92-9058-176-X).
UPOV, 2002. Guidelines for the conduct of tests for distinctness, uniformity and stability. Eggplant (Solanum melongena). TP 117/1. http://www.upov.int
http://www.eppo.inthttp://www.cpvo.europa.eu/main/en
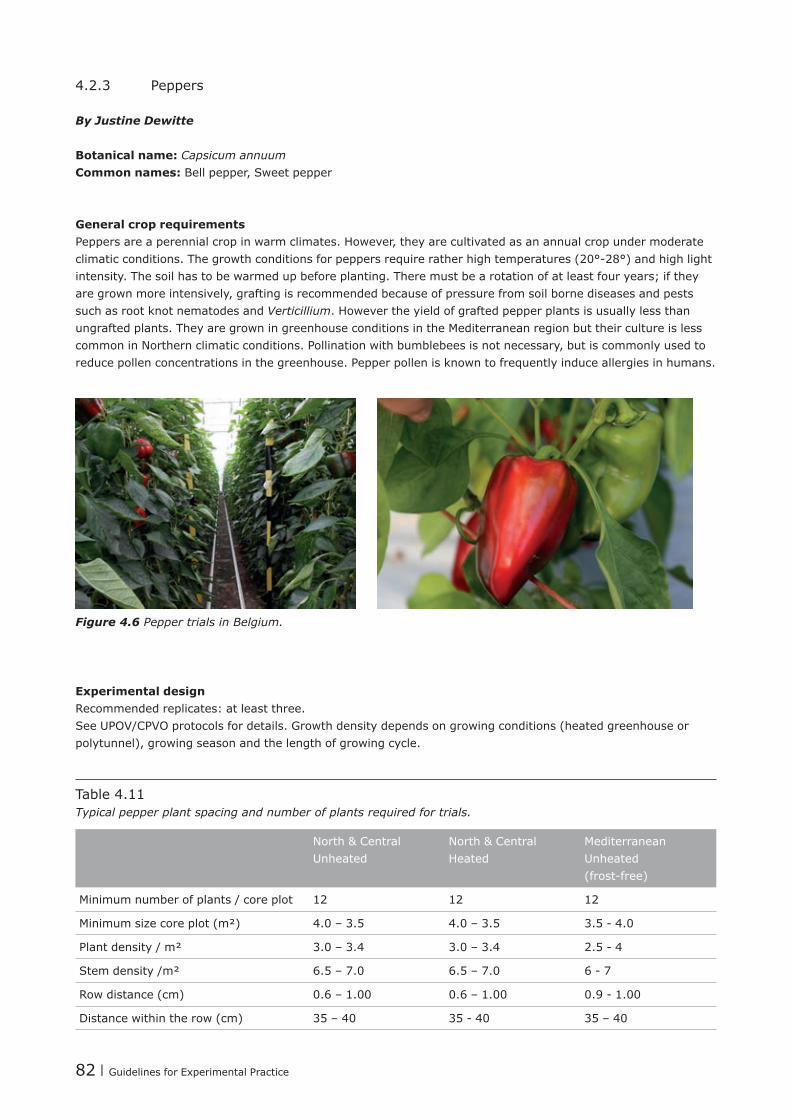
82 | Guidelines for Experimental Practice
4.2.3 Peppers
By Justine Dewitte
Botanical name: Capsicum annuumCommon names: Bell pepper, Sweet pepper
General crop requirements Peppers are a perennial crop in warm climates. However, they are cultivated as an annual crop under moderate climaticconditions.Thegrowthconditionsforpeppersrequireratherhightemperatures(20°-28°)andhighlightintensity. The soil has to be warmed up before planting. There must be a rotation of at least four years; if they are grown more intensively, grafting is recommended because of pressure from soil borne diseases and pests such as root knot nematodes and Verticillium. However the yield of grafted pepper plants is usually less than ungrafted plants. They are grown in greenhouse conditions in the Mediterranean region but their culture is less common in Northern climatic conditions. Pollination with bumblebees is not necessary, but is commonly used to reduce pollen concentrations in the greenhouse. Pepper pollen is known to frequently induce allergies in humans.
Figure 4.6 Pepper trials in Belgium.
Experimental design Recommended replicates: at least three. See UPOV/CPVO protocols for details. Growth density depends on growing conditions (heated greenhouse or polytunnel), growing season and the length of growing cycle.
Table 4.11Typical pepper plant spacing and number of plants required for trials.
North & Central Unheated
North & CentralHeated
Mediterranean Unheated (frost-free)
Minimum number of plants / core plot 12 12 12
Minimumsizecoreplot(m²) 4.0 – 3.5 4.0 – 3.5 3.5-4.0
Plant density / m² 3.0 – 3.4 3.0 – 3.4 2.5-4
Stem density /m² 6.5 – 7.0 6.5 – 7.0 6-7
Row distance (cm) 0.6 – 1.00 0.6 – 1.00 0.9-1.00
Distance within the row (cm) 35 – 40 35-40 35 – 40

Guidelines for Experimental Practice | 83
Sowing and planting Production season and the length of crop cycle depend on local climate conditions (e.g. temperature, light) and availability of climate control (e.g. heating) in the greenhouse.
Table 4.12Pepper sowing and harvesting dates.
Region -Productiontype
Sowing at Planting at Start of harvest End of harvest Remarks
North & Central -Unheated
Feb – Mar (heat required at this stage )
April-May June October Ungrafted crops
-SeasonalHeated
January March May October Ungrafted or grafted crops
-LongcycleHeated November January April November Grafted crops
Mediterranean -Longcycle
July August November June Ungrafted or grafted crops
-ShortcycleSpring Oct-Nov Jan – Feb May June Ungrafted or grafted crops
Sowing is carried out in trays or pots. The temperature demand of the crop is high during germination and seedlinggrowthsotheseedlingsaregrowninheatednurseries.After2-3weeks,transplantingorgraftingiscarriedout.Thesowingdateoftherootstockandthescioncandifferbythreetofivedays,dependingonthevigour of the varieties.
Table 4.13Conditions required for the production of pepper seedlings.
Germination temperature °C Day/ Night
Days until germination
Temperature for seedlings in °C Day/ Night
Potsize Weeks until planting
26° / 24°Ventilation from 28°
10-15 20° / 20°Ventilation from 28°
5-10cm pot
7-10
Whentheseedlingsare20cmhightheyareplantedintowarmsoil.Theyshouldhave4-6leaves.Graftedplantsshould not be planted too deeply to avoid adventitious roots developing from the scion. Temperatures should be22-24°Cduringthedayand18-20°Cduringthenight.Thecropshouldbeventilatedwhentemperaturesreach26-28°C.
Plant nutritionPeppersarenutrient-demandingcrops.Beforeplanting,abasicsoilamendmentsuchasgreencompostorcomposted manure should be added to the soil. During the growing season an additional dressing of organic commercial fertiliser will be needed. Several organic fertilisers are suitable such as blood meal, soy scrap, horn shavings,maltaflor,vinasse,etc.Itisrecommendedtousepartialslow-releasefertilisers.
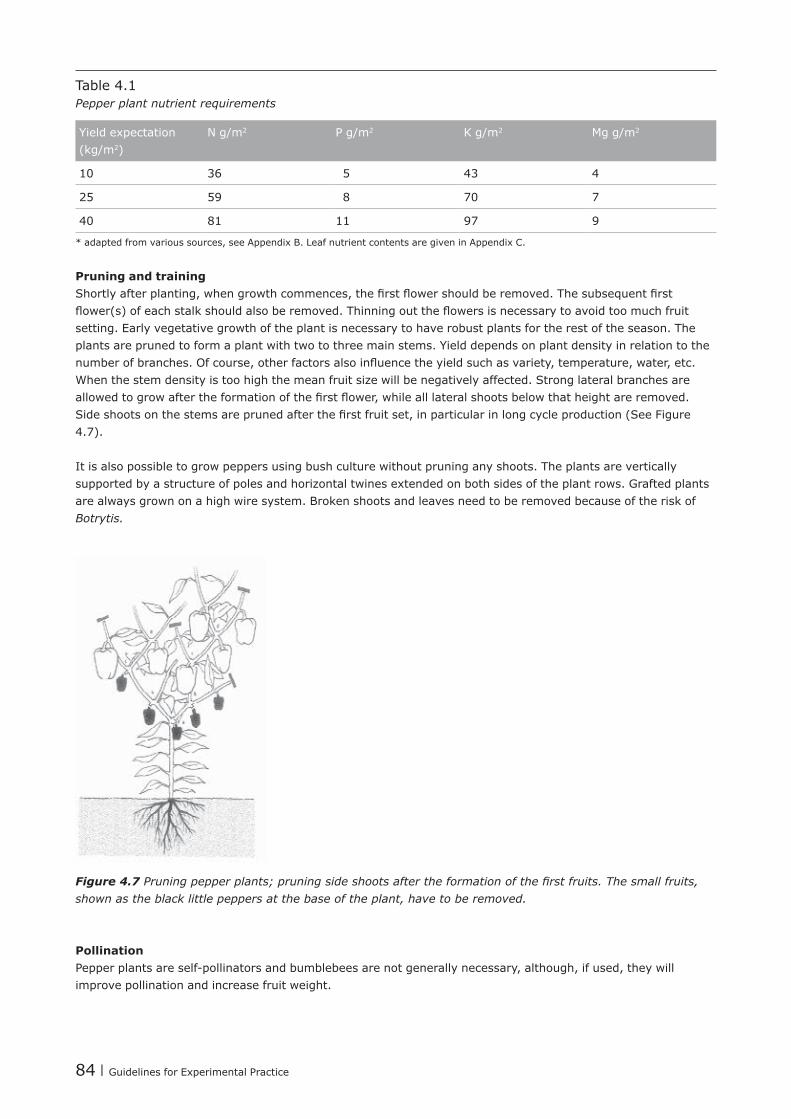
84 | Guidelines for Experimental Practice
Table 4.1Pepper plant nutrient requirements
Yield expectation (kg/m2)
N g/m2 P g/m2 K g/m2 Mg g/m2
10 36 5 43 4
25 59 8 70 7
40 81 11 97 9
* adapted from various sources, see Appendix B. Leaf nutrient contents are given in Appendix C.
Pruning and trainingShortlyafterplanting,whengrowthcommences,thefirstflowershouldberemoved.Thesubsequentfirstflower(s)ofeachstalkshouldalsoberemoved.Thinningouttheflowersisnecessarytoavoidtoomuchfruitsetting. Early vegetative growth of the plant is necessary to have robust plants for the rest of the season. The plants are pruned to form a plant with two to three main stems. Yield depends on plant density in relation to the numberofbranches.Ofcourse,otherfactorsalsoinfluencetheyieldsuchasvariety,temperature,water,etc.Whenthestemdensityistoohighthemeanfruitsizewillbenegativelyaffected.Stronglateralbranchesareallowedtogrowaftertheformationofthefirstflower,whilealllateralshootsbelowthatheightareremoved.Sideshootsonthestemsareprunedafterthefirstfruitset,inparticularinlongcycleproduction(SeeFigure4.7).
It is also possible to grow peppers using bush culture without pruning any shoots. The plants are vertically supportedbyastructureofpolesandhorizontaltwinesextendedonbothsidesoftheplantrows.Graftedplantsare always grown on a high wire system. Broken shoots and leaves need to be removed because of the risk of Botrytis.
Figure 4.7 Pruning pepper plants; pruning side shoots after the formation of the first fruits. The small fruits, shown as the black little peppers at the base of the plant, have to be removed.
PollinationPepperplantsareself-pollinatorsandbumblebeesarenotgenerallynecessary,although,ifused,theywillimprove pollination and increase fruit weight.
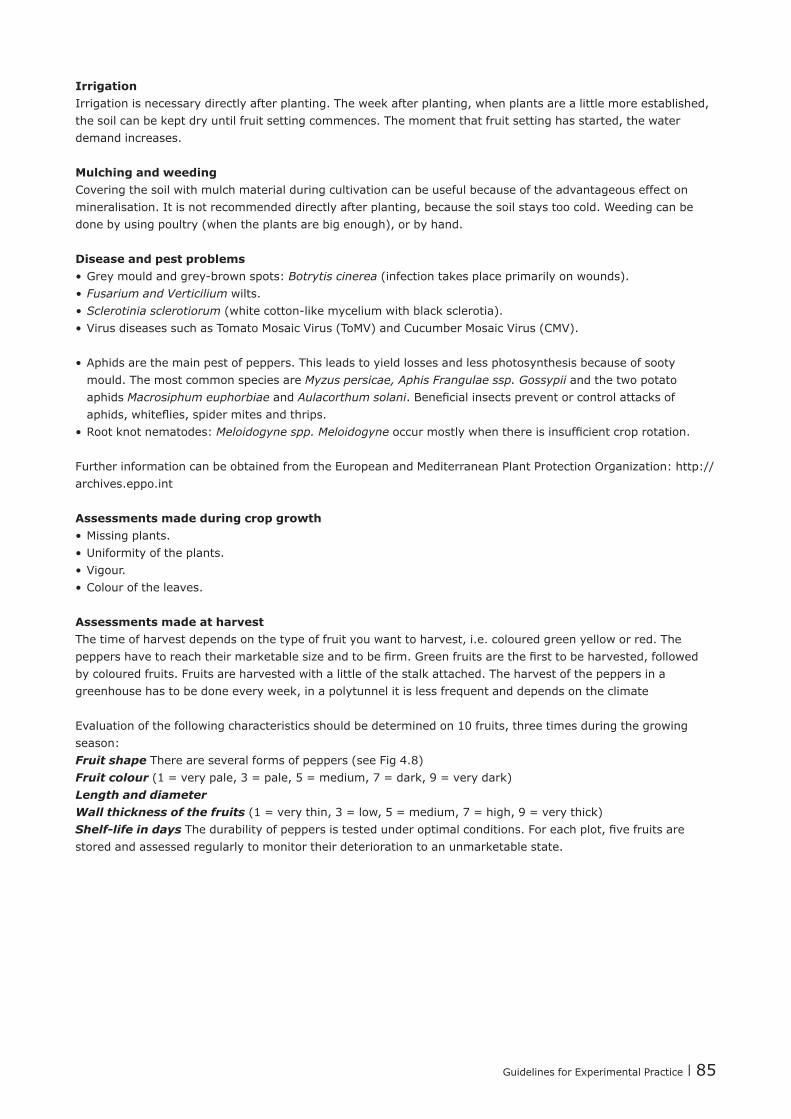
Guidelines for Experimental Practice | 85
IrrigationIrrigation is necessary directly after planting. The week after planting, when plants are a little more established, the soil can be kept dry until fruit setting commences. The moment that fruit setting has started, the water demand increases.
Mulching and weedingCovering the soil with mulch material during cultivation can be useful because of the advantageous effect on mineralisation. It is not recommended directly after planting, because the soil stays too cold. Weeding can be done by using poultry (when the plants are big enough), or by hand.
Disease and pest problems•Greymouldandgrey-brownspots:Botrytis cinerea (infection takes place primarily on wounds).• Fusarium and Verticilium wilts.• Sclerotinia sclerotiorum(whitecotton-likemyceliumwithblacksclerotia).•Virus diseases such as Tomato Mosaic Virus (ToMV) and Cucumber Mosaic Virus (CMV).
•Aphids are the main pest of peppers. This leads to yield losses and less photosynthesis because of sooty mould. The most common species are Myzus persicae, Aphis Frangulae ssp. Gossypii and the two potato aphids Macrosiphum euphorbiae and Aulacorthum solani.Beneficialinsectspreventorcontrolattacksofaphids,whiteflies,spidermitesandthrips.
•Root knot nematodes: Meloidogyne spp. Meloidogyneoccurmostlywhenthereisinsufficientcroprotation.
FurtherinformationcanbeobtainedfromtheEuropeanandMediterraneanPlantProtectionOrganization:http://archives.eppo.int
Assessments made during crop growth•Missing plants. •Uniformity of the plants.•Vigour.•Colour of the leaves.
Assessments made at harvestThe time of harvest depends on the type of fruit you want to harvest, i.e. coloured green yellow or red. The peppershavetoreachtheirmarketablesizeandtobefirm.Greenfruitsarethefirsttobeharvested,followedby coloured fruits. Fruits are harvested with a little of the stalk attached. The harvest of the peppers in a greenhouse has to be done every week, in a polytunnel it is less frequent and depends on the climate
Evaluation of the following characteristics should be determined on 10 fruits, three times during the growing season:Fruit shape There are several forms of peppers (see Fig 4.8)Fruit colour (1 = very pale, 3 = pale, 5 = medium, 7 = dark, 9 = very dark)Length and diameterWall thickness of the fruits (1 = very thin, 3 = low, 5 = medium, 7 = high, 9 = very thick) Shelf-life in daysThedurabilityofpeppersistestedunderoptimalconditions.Foreachplot,fivefruitsarestored and assessed regularly to monitor their deterioration to an unmarketable state.

86 | Guidelines for Experimental Practice
Marketable and unmarketable yield This will need to be done repeatedly throughout the productive phase of the crop. The fruits are sorted (and counted) according to recognised quality standards. There may be a subsequentdivisionintoClass1andClass2produce.Thenon-marketablecropisdividedintomainreasonsforrejection:•Fruitsizetoosmall.•Rotten fruits.•Distorted fruits.•Fruits damaged by pests or diseases.
flat-round round broadblocky smallblocky
smalltriangular triangular cordate trapezoidal
Figure 4.8. Classification of pepper fruit shapes (source UPOV TG/76/8).
Overall value scoreThis takes into account all the criteria for cultivation and marketing (it is particularly appropriate for variety trials). It can be an aggregate of other scores or more subjective and based on ‘expert opinion’. It is normally described on a 1 to 9 scale (1 = very low, 3 = low, 5 = medium, 7 = high, 9 = very high).
References and further informationAnon., 2008.
Minimum descriptors for eggplant, Capsicum (sweet and hot pepper) and tomato. ECPGR Working Group on Solanaceae. (www.ecpgr.cgiar.org)
UPOV, 2002. Guidelines for the conduct of tests for distinctness, uniformity and stability. Peppers (TG/76/8). http://www.upov.int
Dedeene, L., De Kinder, G. Groente & Fruit Encyclopedie (2009), Kosmos, p.131. Van Boxem, H., Buysse, G.,Maes,B.,Robinet,P.,Williame,F.HandboekEcologischTuinieren(2006),Veltvzw.P561.Malais,M.H., Ravensberg, W.J.
Kennenenherkennen:Levenswijzenvankasplagenenhunnatuurlijkevijandenhttp://www.eppo.inthttp://www.cpvo.europa.eu/main/en
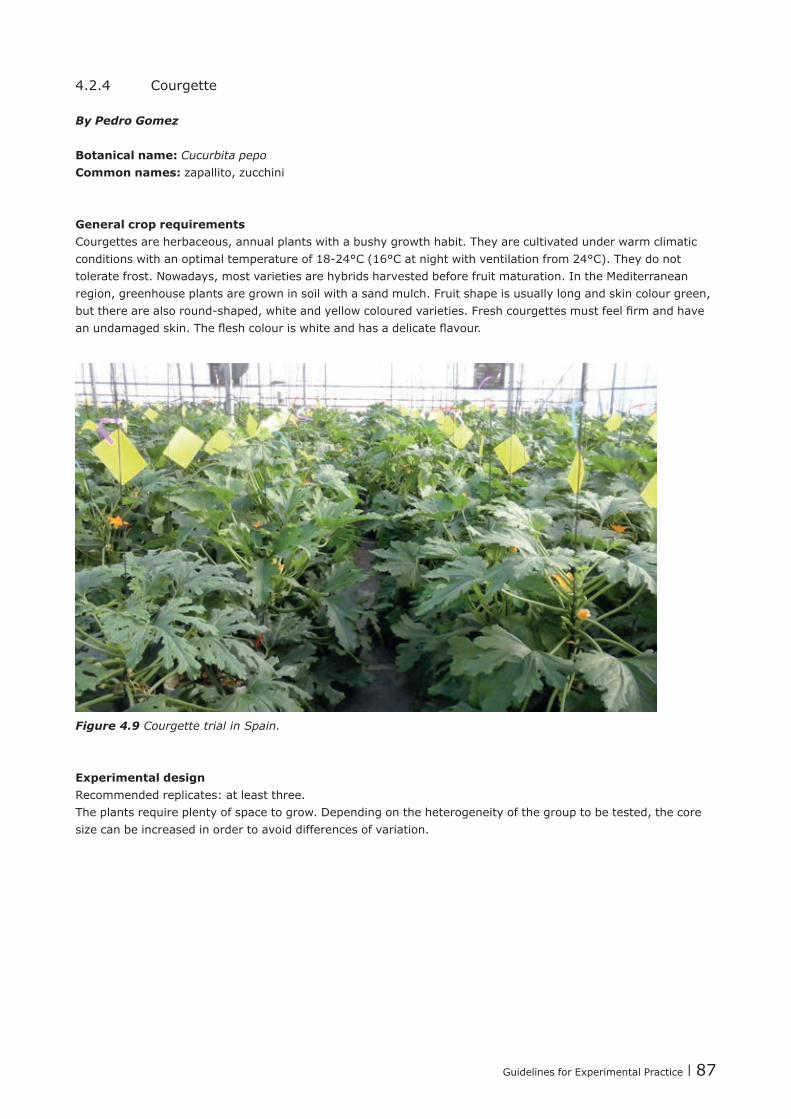
Guidelines for Experimental Practice | 87
4.2.4 Courgette
By Pedro Gomez
Botanical name: Cucurbita pepoCommon names: zapallito,zucchini
General crop requirements Courgettes are herbaceous, annual plants with a bushy growth habit. They are cultivated under warm climatic conditionswithanoptimaltemperatureof18-24°C(16°Catnightwithventilationfrom24°C).Theydonottolerate frost. Nowadays, most varieties are hybrids harvested before fruit maturation. In the Mediterranean region, greenhouse plants are grown in soil with a sand mulch. Fruit shape is usually long and skin colour green, buttherearealsoround-shaped,whiteandyellowcolouredvarieties.Freshcourgettesmustfeelfirmandhaveanundamagedskin.Thefleshcolouriswhiteandhasadelicateflavour.
Figure 4.9 Courgette trial in Spain.
Experimental design Recommended replicates: at least three. The plants require plenty of space to grow. Depending on the heterogeneity of the group to be tested, the core sizecanbeincreasedinordertoavoiddifferencesofvariation.
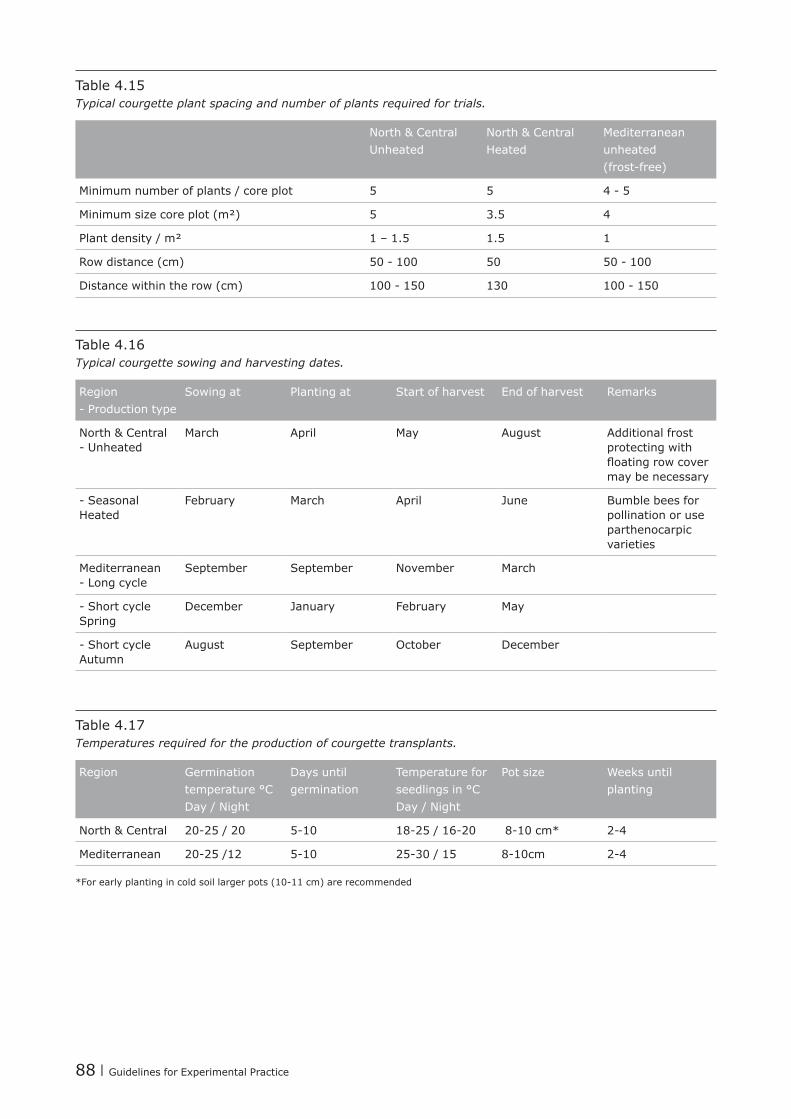
88 | Guidelines for Experimental Practice
Table 4.15Typical courgette plant spacing and number of plants required for trials.
North & Central Unheated
North & CentralHeated
Mediterranean unheated (frost-free)
Minimum number of plants / core plot 5 5 4-5
Minimumsizecoreplot(m²) 5 3.5 4
Plant density / m² 1 – 1.5 1.5 1
Row distance (cm) 50-100 50 50-100
Distance within the row (cm) 100-150 130 100-150
Table 4.16Typical courgette sowing and harvesting dates.
Region -Productiontype
Sowing at Planting at Start of harvest End of harvest Remarks
North & Central -Unheated
March April May August Additional frost protecting with floatingrowcovermay be necessary
-SeasonalHeated
February March April June Bumble bees for pollination or use parthenocarpic varieties
Mediterranean -Longcycle
September September November March
-ShortcycleSpring
December January February May
-ShortcycleAutumn
August September October December
Table 4.17Temperatures required for the production of courgette transplants.
Region Germination temperature °C Day / Night
Days until germination
Temperature for seedlings in °C Day / Night
Potsize Weeks until planting
North & Central 20-25/20 5-10 18-25/16-20 8-10cm* 2-4
Mediterranean 20-25/12 5-10 25-30/15 8-10cm 2-4
*Forearlyplantingincoldsoillargerpots(10-11cm)arerecommended

Guidelines for Experimental Practice | 89
Table 4.18Courgette plant nutrient requirements.
Yield expectation (kg/m2)
N g/m2 P g/m2 K g/m2 Mg g/m2
4 16 3 26 2
8 32 6 52 4
Source: adapted from various sources, see Appendix B
Growing requirementsPruning is not required. Courgettes are grown both outdoors and under glass. In greenhouses, the plants are sometimes tied up, just like tomato plants. When grown outdoors, courgette plants tend to be fairly compact. One courgette plant can produce up to 30 courgettes. Courgettes can reach a length of up to 30 cm.
Pollination by Bombus terrestris is recommended, introducing 10 hives / ha.
Irrigationat2.5-3l/m2 a day is recommended.
Disease and pest problems and physiological disorders
Diseases•Powderymildew-Sphaerotheca fuliginea.•GummyStemBlight-Didymella bryoniae.•Botrytis-Botrytis cinerea.•ZYMV (Zucchini Yellow Mosaic Virus).•WMV-2(WatermelonMosaicVirus-2).•CMV (Cucumber Mosaic Virus).•CVYV (Cucumber vein yellowing virus).•ToLCNDV (Tomato Leaf Curl New Delhi Virus).•CYSDV (Cucumber Yellow Stunt Disorder Virus).
Pests•Thrips-Frankliniella occidentalis.•Whitefly-Trialeurodes vaporariorum, Bemisia tabaci.•Aphids-Aphis gossypii, Myzus persicae.•Redmite-Tetranychus spp.•Leafminer- Liriomyza trifolii), Liriomyza strigata, Lyriomyza bryoniae•Greenworm-Spodoptera exigua.
Physiological disorders•Silver leaf (associated with some cultivars).•Fruitsabort(causedbyinsufficientpollinationorplantautoregulation).•Fruittorsion-malformation(causedbyinsufficientpollination).
Assessments during growth Missingplants,uniformityofcrop,vigour,numberoffaults,proportionoffemaleflowersperplant,numberoffruitsperstem,leafsize,virusresistance,resistanceofrootstoFusariumandnematodes.Whenquantificationisdifficultascoringsystemcanbeused(1=verylow,3=low,5=medium,7=high,9=verylarge/high).

90 | Guidelines for Experimental Practice
Assessments at harvestCourgettesarenon-climactericfruitandshouldbeharvestedbeforematurity(beforetheybecomemarrows)whenfruitsreach20-30cm.Harvestperiodicallyevery2-3days.Thecropshouldbesortedaccordingtorecognisedqualitystandardsintonon-marketablefractions(rejectingtwistedfruit,abortedetc.).Theacceptablesizedependsonthecultivar.Factorstoassessspecifically(oftenusinga1to9scale)include:•Colour and brightness of the skin.•Fleshtextureandfirmness.•Flesh colour.•Diameter.•Shape.
Overall value scoreThis takes into account all the criteria for the cultivation and marketing of a variety, based on expert opinion as evaluated by researchers using information from farmers, wholesalers and consumers (1 = very low, 3 = low, 5 = medium, 7 = high, 9 = very high).
References and further informationMaynard, D. N. and G. J. Hochmuth. 2007.
Knott's Handbook for Vegetable Growers. Hoboken, NJ, John Wiley & Sons, IncUPOV Guidelines for the conduct of tests for distinctness, uniformity and stability. Courgette (TP/119/1). http://
www.upov.intReche J. 1997
CultivodeCalabacínenInvernadero(Spanish).EdColegioOficialdeIngenierosTécnicosAgrícolas
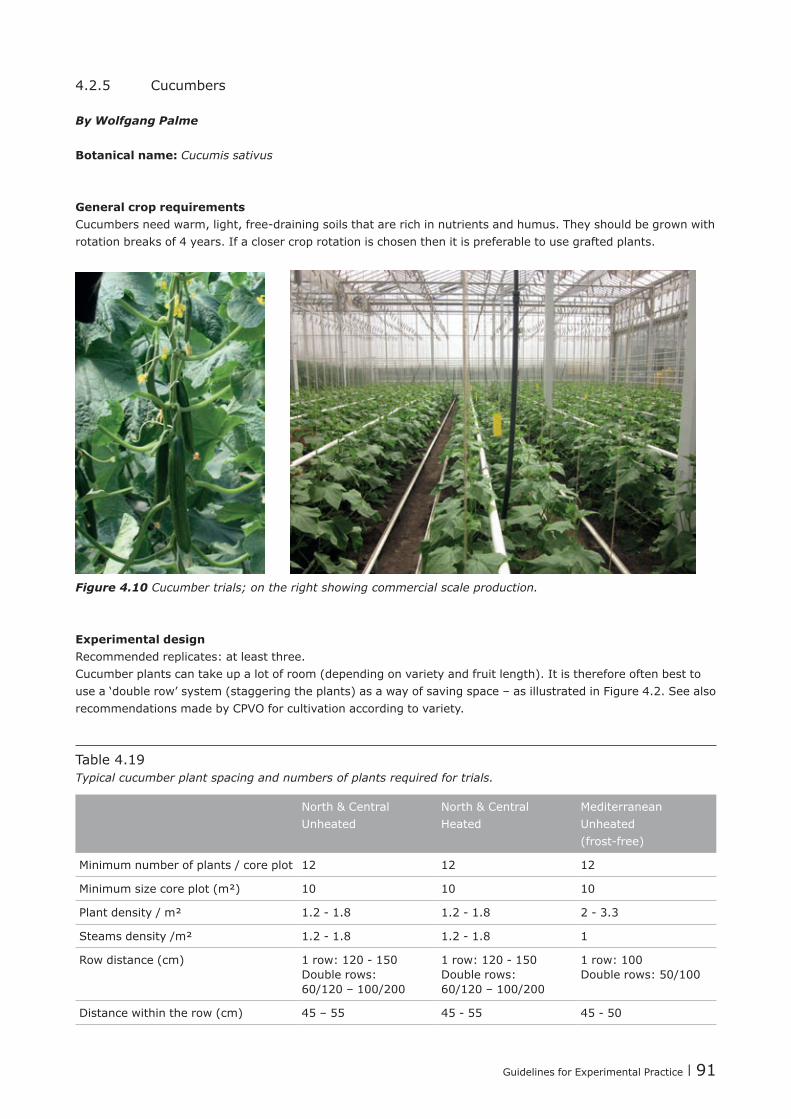
Guidelines for Experimental Practice | 91
4.2.5 Cucumbers
By Wolfgang Palme
Botanical name: Cucumis sativus
General crop requirements Cucumbersneedwarm,light,free-drainingsoilsthatarerichinnutrientsandhumus.Theyshouldbegrownwithrotation breaks of 4 years. If a closer crop rotation is chosen then it is preferable to use grafted plants.
Figure 4.10 Cucumber trials; on the right showing commercial scale production.
Experimental design Recommended replicates: at least three. Cucumber plants can take up a lot of room (depending on variety and fruit length). It is therefore often best to use a ‘double row’ system (staggering the plants) as a way of saving space – as illustrated in Figure 4.2. See also recommendations made by CPVO for cultivation according to variety.
Table 4.19Typical cucumber plant spacing and numbers of plants required for trials.
North & Central Unheated
North & CentralHeated
Mediterranean Unheated (frost-free)
Minimum number of plants / core plot 12 12 12
Minimumsizecoreplot(m²) 10 10 10
Plant density / m² 1.2-1.8 1.2-1.8 2-3.3
Steams density /m² 1.2-1.8 1.2-1.8 1
Row distance (cm) 1row:120-150Double rows: 60/120 – 100/200
1row:120-150Double rows: 60/120 – 100/200
1 row: 100Double rows: 50/100
Distance within the row (cm) 45 – 55 45-55 45-50
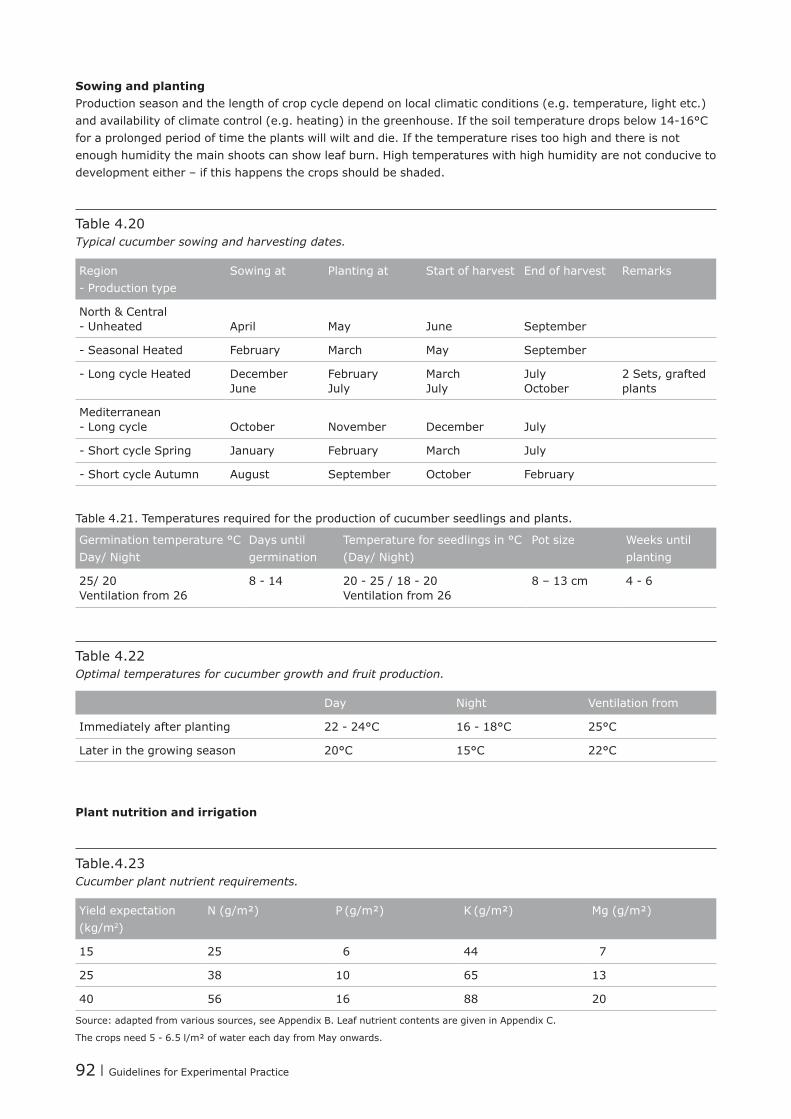
92 | Guidelines for Experimental Practice
Sowing and plantingProduction season and the length of crop cycle depend on local climatic conditions (e.g. temperature, light etc.) andavailabilityofclimatecontrol(e.g.heating)inthegreenhouse.Ifthesoiltemperaturedropsbelow14-16°Cfor a prolonged period of time the plants will wilt and die. If the temperature rises too high and there is not enough humidity the main shoots can show leaf burn. High temperatures with high humidity are not conducive to development either – if this happens the crops should be shaded.
Table 4.20Typical cucumber sowing and harvesting dates.
Region -Productiontype
Sowing at Planting at Start of harvest End of harvest Remarks
North & Central -Unheated April May June September
-SeasonalHeated February March May September
-LongcycleHeated December June
February July
March July
July October
2 Sets, grafted plants
Mediterranean -Longcycle October November December July
-ShortcycleSpring January February March July
-ShortcycleAutumn August September October February
Table 4.21. Temperatures required for the production of cucumber seedlings and plants.
Germination temperature °C Day/ Night
Days until germination
Temperature for seedlings in °C (Day/ Night)
Potsize Weeks until planting
25/ 20Ventilation from 26
8-14 20-25/18-20Ventilation from 26
8 – 13 cm 4-6
Table 4.22Optimal temperatures for cucumber growth and fruit production.
Day Night Ventilation from
Immediately after planting 22-24°C 16-18°C 25°C
Later in the growing season 20°C 15°C 22°C
Plant nutrition and irrigation
Table.4.23Cucumber plant nutrient requirements.
Yield expectation(kg/m2)
N (g/m²) P (g/m²) K (g/m²) Mg (g/m²)
15 25 6 44 7
25 38 10 65 13
40 56 16 88 20
Source: adapted from various sources, see Appendix B. Leaf nutrient contents are given in Appendix C.
Thecropsneed5-6.5l/m²ofwatereachdayfromMayonwards.

Guidelines for Experimental Practice | 93
Training and pruningCucumberscanbegrownviatwomethodsusingcords(verticalstringstiedtoahorizontaltopwire).Sideshoots, tendrils and fruits are removed up to a height of 0.75 m.
Forthefirstmethod(seeFigure4.11),onlytendrilsandsideshootsareremovedfromaheightof0.30m-0.75m.Onefruitperaxilshouldbeleft.Themainshoothastobecutwhenitreachesthetopwire.Thelast2-3sideshootsareallowedtohangdownfromthetopwire.Thiswayofpruningthecucumbercropiscalled“Kring-method”.
For the second method (termed ‘high cord culture’), all the side shoots have to be removed. One fruit in every two is also removed. In this case one axil will be empty, another will have just one fruit. The main shoot does not have to be cut, but grows along the cords. When it reaches the top wire, its cord has to be let down to allow the base of the stem to lie along the ground.
Figure 4.11 Training and pruning of cucumbers according to the Kring method.
Disease and pest infestation, physiological disorders and other abiotic damage•Downymildew-alsoaffectinglettuceandothervegetables(Pseudoperonospora cubensis).•Powdery mildew of cucurbits and other vegetables (Sphaerotheca fuliginea and Erysiphe cichoracearum).•Leafspots of vegetables (Didymella bryoniae).• Sclerontinia sclerotiorum.•Other diseases such as Colletotrichum, Verticillium, Fusarium.

94 | Guidelines for Experimental Practice
• Thrips on greenhouse crops.• Spider mites (Tetranychus urticae).•Aphids,whiteflies,leafminersetc.
Assessments made during growthMany parameters can be assessed using a 1 to 9 scale (1 = very low, 3 = low, 5 = medium, 7 = high, 9 = very large / high) but quantitative measurements are preferable whenever possible.•Number of missing plants.•Uniformity of crop.•Vigour/density of the crop.•Regeneration capacity after harvesting.•Internode length.•Leafsize.•Colour of the leaves.•Total length of the plant (at the end of cultivation).
Assessments made at harvestHarvesting should usually begin when fruits have an average weight of more than 400g (later in the year they should reach more than 500g). However, in Northern and Central Europe early fruits of more than 300g are permitted. Harvesting should be done regularly (three times a week). The crop should be sorted according to EU qualitystandards.Cropsaredividedintomarketableandnon-marketable(undersized,rotten,odd-shapedoryellow). Fruits are counted and weighed.
Length and diameter of the fruit should be recorded. At least three times per year ten marketable fruits from the main stem and ten from the side shoots are measured. Diameter is determined at the thickest point.
Evaluation of the following quality parameters are assessed for ten fruits, three times a year:•Ridged fruits.•Colour of the fruits.•Relationshipbetweenfleshandseedconstruction.•Shelf-lifeindays.
Overall value scoreThis is particularly appropriate for variety trials. It takes into account all the criteria for the cultivation and marketing of the variety based on expert opinion as evaluated by researchers using information from farmers, wholesalers and consumers (1 = very low, 3 = low, 5 = medium, 7 = high, 9 = very high).
References and further informationUPOV Guidelines for the conduct of tests for distinctness, uniformity and stability. Cucumber (TP/61/2).
www.upov.int
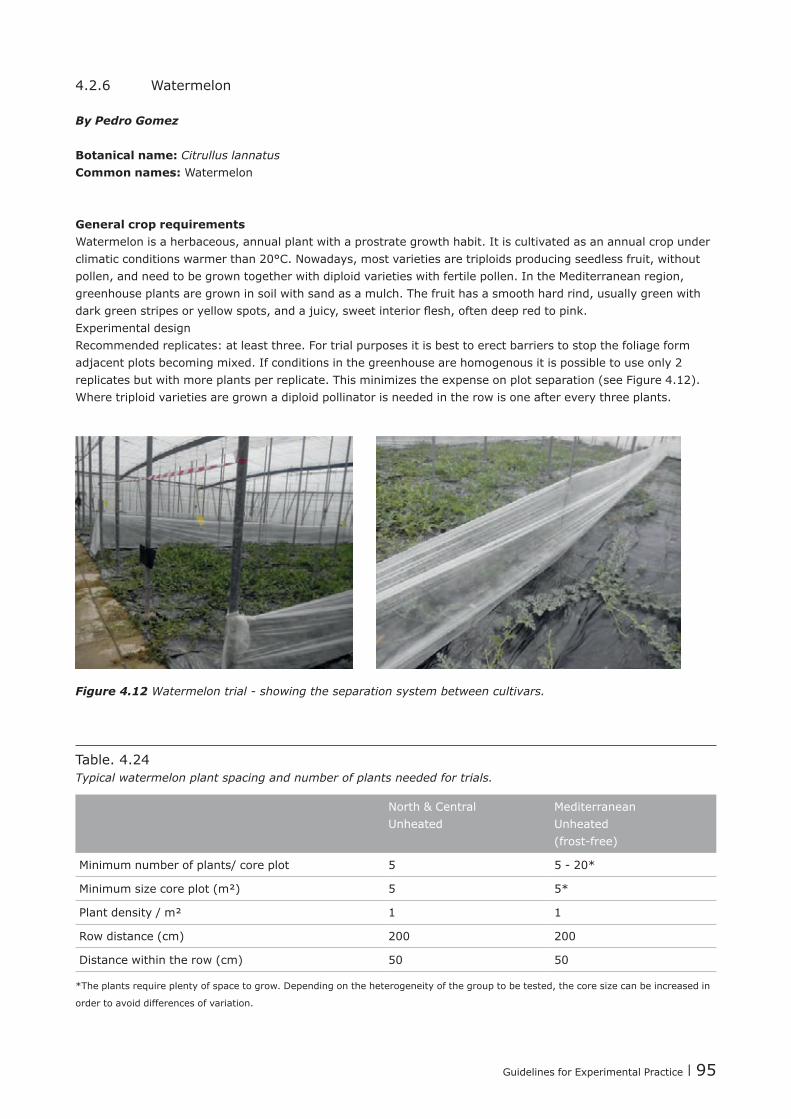
Guidelines for Experimental Practice | 95
4.2.6 Watermelon
By Pedro Gomez
Botanical name: Citrullus lannatusCommon names: Watermelon
General crop requirements Watermelon is a herbaceous, annual plant with a prostrate growth habit. It is cultivated as an annual crop under climatic conditions warmer than 20°C. Nowadays, most varieties are triploids producing seedless fruit, without pollen, and need to be grown together with diploid varieties with fertile pollen. In the Mediterranean region, greenhouse plants are grown in soil with sand as a mulch. The fruit has a smooth hard rind, usually green with darkgreenstripesoryellowspots,andajuicy,sweetinteriorflesh,oftendeepredtopink.Experimental design Recommended replicates: at least three. For trial purposes it is best to erect barriers to stop the foliage form adjacent plots becoming mixed. If conditions in the greenhouse are homogenous it is possible to use only 2 replicatesbutwithmoreplantsperreplicate.Thisminimizestheexpenseonplotseparation(seeFigure4.12).Where triploid varieties are grown a diploid pollinator is needed in the row is one after every three plants.
Figure 4.12 Watermelon trial - showing the separation system between cultivars.
Table. 4.24Typical watermelon plant spacing and number of plants needed for trials.
North & CentralUnheated
Mediterranean Unheated (frost-free)
Minimum number of plants/ core plot 5 5-20*
Minimumsizecoreplot(m²) 5 5*
Plant density / m² 1 1
Row distance (cm) 200 200
Distance within the row (cm) 50 50
*Theplantsrequireplentyofspacetogrow.Dependingontheheterogeneityofthegrouptobetested,thecoresizecanbeincreasedin
order to avoid differences of variation.

96 | Guidelines for Experimental Practice
Table 4.25Typical watermelon sowing and harvesting dates.
Region -Productiontype*
Sowing at Planting at Start of Harvest
End of harvest Remarks
North & Central -Unheated
April May July September
Mediterranean-ShortcycleSpring
Dec Jan Apr May Grafted crops
Mediterranean-ShortcycleAutumn
Feb Feb May Jun Grafted crops
*Watermelons are not usually grown using heated production (seasonal) or in Mediterranean long cycle production.
Table 4.26Temperatures required for the production of watermelon seedlings and
Region Germination temperature °C Day / Night
Days until germination
Temperature for seedlings in °C Day / Night
Potsize Weeks until planting
North & Central 20-25/20 5-10 18-25/16-20 10 cm 2-4
Mediterranean 17-30/15 7-15 17-30/10Ventilation from 20-25
10 cm 3-4
Table 4.27 Optimal temperatures for watermelon growth and fruit production in the Mediterranean.
Day (°C) Night (°C) Ventilation from (°C)
Planting in February / harvest end April 18-27 10-14 20-25
Table.4.28Watermelon plant nutrient requirements.
Yield expectation(kg/m2)
N (g/m²) P (g/m²) K (g/m²) Mg (g/m²)
5 12 3 15 3
10 17 6 23 5
Source: adapted from various sources, see Appendix B. Leaf nutrient contents are given in Appendix C.
Crop management Pruning is advisable in order to control the architecture of the plant. The main shoot is cut before growth exceeds 5-6leaves,toencourage4-5secondaryshoots.
Pollination by Apis mellifera,isrecommended,introducing2-4beehives/ha.Triploidwatermelonsneeddiploidwatermelonswithviablepollenaspollinators.Itisimportanttoestablisharatioof25-30%pollinatordiploidcultivars amongst triploid cultivars.
Irrigationat2.5-3l/m2 a day is recommended.

Guidelines for Experimental Practice | 97
Disease and pest infestation, physiological disorders and other abiotic damageDiseases:•Powderymildew-Sphaerotheca fuliginea. •GummyStemBlight-Didymella bryoniae.•Fusarium-Fusarium oxysporum.•MNSV (Melon Necrotic Spot Virus).•ZYMV (Zucchini Yellow Mosaic Virus).•WMV-2(WatermelonMosaicVirus-2).•CMV (Cucumber Mosaic Virus).•CVYV (Cucumber vein yellowing virus).
Pests:•Redmite-Tetranychus spp.•Whitefly-Trialeurodes vaporariorum, Bemisia tabaci.•Aphids-Aphis gossypii , Myzus persicae.•Thrips-Frankliniella occidentalis.•Leafminer-Liriomyza trifolii, Liriomyza strigata, Lyriomyza bryoniae.•Greenworm-Spodoptera exigua.•Nematodes-Meloidogyne spp. (roots nodules), M. javanica, M. arenaria, M. incognita.
Physiological disorders•Fruit breakage (caused by excess relative humidity and temperature changes, conductivity changes, poor
ventilation etc.).•Fruitsabort(causedbyexcessivevigourorplantauto-regulation).•Root anoxia, resulting in adventitious roots and wilting with high soil water content (caused by a lack of oxygen
in the soil).
Assessments made during growthThese include: Missing plants, number of pollinator plants, uniformity of crop, number of stems and vigour, regenerationcapacity,numberoffruitsperstem,leafsize,rootresistance:(Fusariumandnematodes),physiological damage caused by salininty. Many of these can best be assessed on a 1 to 9 scale when measurements are not possible (1 = very low, 3 = low, 5 = medium, 7 = high, 9 = very large / high).
Assessments made at harvest Watermelonsarenon-climactericfruit,harvestedinmaturity,whenfruitshavedevelopedatleast12o Brix sugar content. After harvest, plants can be left to regenerate a second crop. Fruits should be sorted into marketable and unmarketable categories according to recognised quality standards. Unmarketable fruits should be categorisedaccordingtothereasonsforrejection.Theacceptablesizedependsonthecultivar.
Quality parameters include:•Total soluble solids (oBrix).•Fruitsize(diameter).•Width of stripes (very narrow to very broad).•Skingroundcolour(yellowtoverydarkgreen)-basedonUPOVwatermelonDUSguidelines.•Colourofflesh(whitetodarkred)-basedonUPOVwatermelonDUSguidelines.•Seediness.•Fleshtextureandfirmness.•Symmetry.

98 | Guidelines for Experimental Practice
Overall valueThis takes into account all the criteria for the cultivation and marketing of a variety, based on expert opinion as evaluated by researchers using information from farmers, wholesalers and consumers (1 = very low, 3 = low, 5 = medium, 7 = high , 9 = very high).
References and further informationUPOV Guidelines for the conduct of tests for distinctness, uniformity and stability. Watermelon (TP/142/2).
www.upov.intReche J. 1997
CultivodeSandiaenInvernadero(Spanish).EdColegioOficialdeIngenierosTécnicosAgrícolas

Guidelines for Experimental Practice | 99
4.2.7 Melons
By Pedro Gomez
Botanical name: Cucumis meloCommon names: muskmelon, honeydew melon, cantaloupe melon.
General crop requirements Melon plants are herbaceous, annual plants, with a prostrate habit. The crop is grown under warm climatic conditions with optimal temperatures higher than 20°C. Nowadays, most varieties are hybrids, harvested when they reach maturity, and usually very sweet. In Mediterranean greenhouses plants are grown in soil with sand as a mulch. In experimental crops of melon, where varieties are being evaluated, the most productive method of growing is to stake plants. Fruit shape depends of cultivar, from long to round and skin colour can vary from green,yelloworwhite.Fruitskinisstrong,andfleshacquiresvariablecolourfromwhitetoorange.
Experimental design Recommended replicates: at least three.
Table 4.29Typical melon plant spacing and number of plants required for trials.
North & CentralHeated
Mediterranean Unheated (frost-free)
Minimum number of plants / core plot 7 6*
Minimumsizecoreplot(m²) 5 3*
Plant density / m² 1.3 2
Stem density / m² 1.3-2.6 4
Row distance (cm) 150 150-200
Distance within the row (cm) 50 50-100
*Theplantsrequireplentyofspacetogrow.Dependingontheheterogeneityofthegrouptobetested,thecoreplotsizecanbe
increased in order to avoid too much variation.
Table 4.30Typical melon sowing and harvesting dates.
Region -Productiontype
Sowing at Planting at Start of harvest
End of harvest
Remarks
North & Central* -Unheated
April May July September Vertical string trained (recommended) or along the soil.
Mediterranean -Longcycle
November December April May
-ShortcycleSpring
December January May June
*Melons are not usually grown in heated greenhouses in the North and Central region.
100 | Guidelines for Experimental Practice
Table 4.31Conditions required for the production of melon seedlings and plants.
Region Germination temperature °C Day / Night
Days until germination
Temperature for seedlings in °C Day / Night
Weeks until planting
North & Central 20-25/20 5-10 18-25/16-20
Mediterranean 20-25/12 5-10 25-30/15 1.5-2
Table 4.32Melon plant nutrient requirements.
Yield expectation(kg/m2)
N (g/m²) P (g/m²) K (g/m²) Mg (g/m²)
4 18 2 19 2
7 21 4 29 4
Source: adapted from various sources, see Appendix B. Leaf nutrient contents are given in Appendix C.
Crop management Staking the plants increases productivity and improves fruit quality. Pruning is recommended to leave two stems per plant. For cultivars with prostrate growth, it is advisable to cut the primary stem to encourage several secondarystemstodevelopwhichwillcarrythefruit.Onestemwillproduce2-4fruitsdependingofthefruitsizeofthecultivar.
The most effective way of pollination is by Apis melliphera (2 hives/ha) and Bombus terrestris(2-4hives/ha).Ifonly a smaller area of melons are being grown the number of hives will need to be maintained.
Disease and pest problems, physiological disorders and other abiotic damageDiseases:•Powderymildew-Sphaerotheca fuliginea. •GummyStemBlight-Didymella bryoniae.•Botrytis-Botrytis cinerea.•ZYMV (Zucchini Yellow Mosaic Virus).•WMV-2(WatermelonMosaicVirus-2).•CMV (Cucumber Mosaic Virus).•CVYV (Cucumber vein yellowing virus).•ToLCNDV (Tomato Leaf Curl New Delhi Virus).•CYSDV (Cucumber Yellow Stunt Disorder Virus).
Pests:•Thrips-Frankliniella occidentalis.•Whitefly-Trialeurodes vaporariorum, Bemisia tabaci.•Aphids-Aphis gossypii , Myzus persicae.•Redmite-Tetranychus spp.•Leafminer-Liriomyza trifolii, Liriomyza strigata, Lyriomyza bryoniae.•Greenworm-Spodoptera exigua.
Physiological disordersSudden wilt (associated to some cultivars at certain growth stages during some climatic conditions).Excessivevegetativegrowthresultinginareductionofflowering.Fruitsabort(duetoinsufficientpollinationorplantauto-regulation).Fruit splitting (due to imbalances of temperature and water, or uneven maturity).

Guidelines for Experimental Practice | 101
Assessment during growthTheseinclude:Missingplants,uniformityofcrop,vigour,numberoffaults,numberoffemaleflowersperplant,numberoffruitsperstem,leafsize,virusresistanceandsalinityresponses.Whencountingisnotpossiblethesecan be scored on a scale (1 = very low, 3 = low, 5 = medium, 7 = high, 9 = very large / high).
Assessments at harvestIt is very important to determine the correct moment for harvest. Fruit must reach the appropriate °Brix level according to the type of cultivar. There are several characteristics that alter during ripening (e.g. skin colour, aroma). Cracks at the stem base as well as a sweet smell from the fruit indicate ripeness. Fruits are usually picked on a weekly basis. The crop should be harvested into marketable and unmarketable according to recognisedstandardsandthereasonsforrejectionrecorded(brokenfruit,twistedfruit,incorrectsizeetc.).Scores(ona1-9scale)ormeasurementscanbemadeoffruitparametersincluding:•Colour and skin characteristics.•Fleshtextureandfirmness.•Colourofflesh.•Diameter.•Shape.
Overall value scoreThis is particularly appropriate for variety trials. It takes into account all the criteria for cultivation and marketing, based on expert opinion as evaluated by researchers using information from farmers, wholesalers and consumers (1 = very low , 3 = low, 5 = medium, 7 = high , 9 = very high).
References and further informationUPOV Guidelines for the conduct of tests for distinctness, uniformity and stability. Melons (TP/104/2).
www.upov.intReche J. 1997
Cultivo de melón en Invernadero (Spanish). Ed Consejeria de Agricultura y PescaMaynard, D. N. and G. J. Hochmuth. 2007.
Knott's Handbook for Vegetable Growers. Hoboken, NJ, John Wiley & Sons, Inc
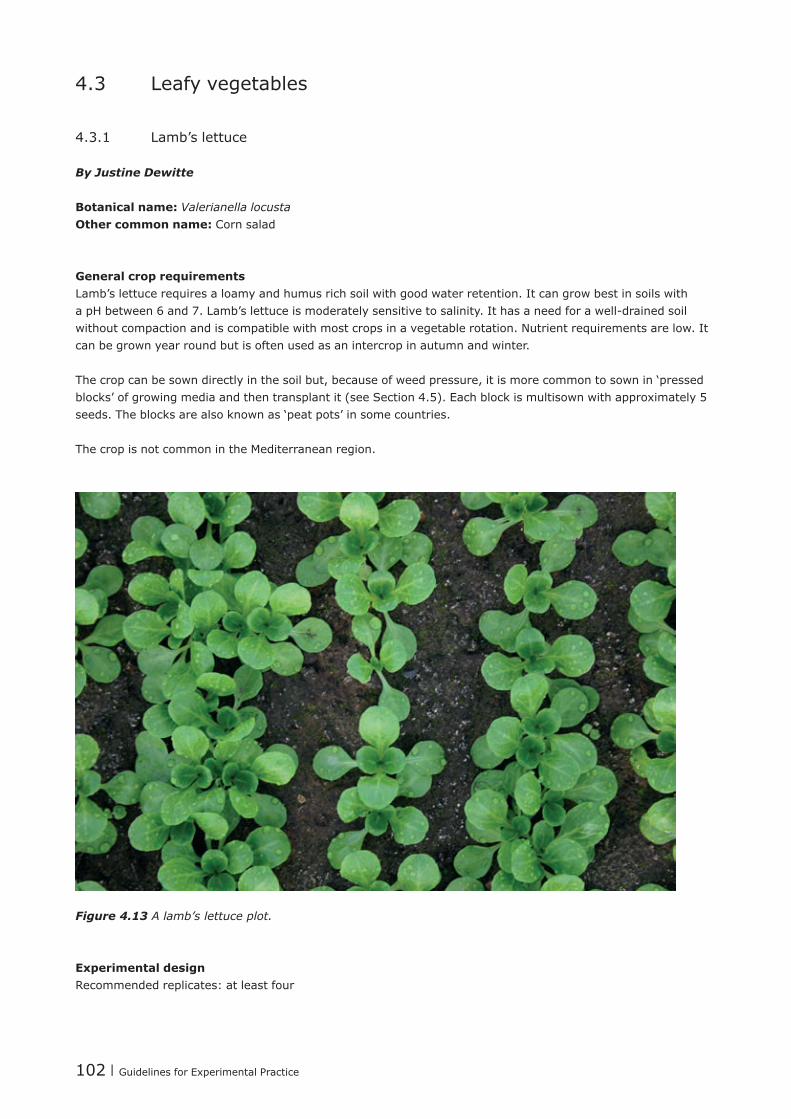
102 | Guidelines for Experimental Practice
4.3 Leafy vegetables
4.3.1 Lamb’s lettuce
By Justine Dewitte
Botanical name: Valerianella locusta Other common name: Corn salad
General crop requirements Lamb’s lettuce requires a loamy and humus rich soil with good water retention. It can grow best in soils with apHbetween6and7.Lamb’slettuceismoderatelysensitivetosalinity.Ithasaneedforawell-drainedsoilwithout compaction and is compatible with most crops in a vegetable rotation. Nutrient requirements are low. It can be grown year round but is often used as an intercrop in autumn and winter.
The crop can be sown directly in the soil but, because of weed pressure, it is more common to sown in ‘pressed blocks’ of growing media and then transplant it (see Section 4.5). Each block is multisown with approximately 5 seeds. The blocks are also known as ‘peat pots’ in some countries.
The crop is not common in the Mediterranean region.
Figure 4.13 A lamb’s lettuce plot.
Experimental design Recommended replicates: at least four

Guidelines for Experimental Practice | 103
Table 4.33Typical lamb’s lettuce plant spacing and number of plants required for trials.
North & central unheated (or frost free)
Minimum number of plants/ core plot 240 (multisown pressed blocks) ; 1200 (direct sown)
Minimumsizecoreplot(m²) 3
Density sown seeds/m² 600-700
Density of transplanted pressed blocks / m² 80
Row distance (cm) 8-15
Distance within the row (cm) 8-12(transplantedinblocks);2-3(directsown)
Table 4.34Typical lamb’s lettuce sowing and harvesting dates.
Region -Productiontype
Sowing at Planting at Start of Harvest End of harvest Remarks
North & central -Unheated
August to November
September to January
October March Lamb’s lettuce can be grown year round, but is typical during autumn and winter
Table 4.35Temperature requirements for lambs lettuce sowing and planting.
Germination temperature °C Day/ Night
Days until germination
Temperature for seedlings in °C Day/ Night
Blocksize Time until planting (in weeks)
12-18 7-10 10-18/7-18Ventilation from 20
3 – 4 cm, 5 plants in each
3-6
If the greenhouse can be slightly heated at the beginning of the cultivation period then this will accelerate germination. A soil temperature of 10°C is optimal. When temperature is above 21°C the seed will become dormant.Lamb’slettucecanwithstandmildfrost(-5oC). The leaves can be deformed when the temperature exceeds 20°C (this is known as spooning).
Table.4.36Lamb’s lettuce plant nutrient requirements.
Yield expectation(kg/m2)
N (g/m²) P (g/m²) K (g/m²) Mg (g/m²)
0.6 2.5 0.2 4 0.2
1 4 0.3 6 0.3
1.3 5 0.4 8 0.4
Source: adapted from various sources, see Appendix B

104 | Guidelines for Experimental Practice
Disease and pest infestation, physiological disorders and other abiotic damageAlso see the relevant EPPO Guidelines: www.eppo.int.
• Acidovorax valerianellae sp.• Botrytis.•Powderymildew-Golovinomyces orontii. •Downymildew-Peronospora valerianella.• Phoma valerianellae.• Pythium.• Rhizoctonia solani.• Sclerotinia.
Assessments during growthA range of parameters are best assessed using a 1 to 9 scale (1 = very low, 3 = low, 5 = medium, 7 = high, 9 = very high):•Germination.•Uniformity of crop.•Sizeofplants.•Leafsize.•Leaf shape.•Colour of the leaves.•Losses (from disease etc.).
Assessments at harvest The correct time of harvest depends on light hours and temperature. The lamb’s lettuce is harvested by cutting off the leaves in the soil just above the roots. The crop should be sorted according to recognised quality standardsintomarketableandnon-marketableproduce,identifyingthereasonsforrejection(e.g.pestordisease damage, bolted plants etc.).
Overall value scoreThis takes into account all the criteria for the cultivation and marketing of a variety, based on expert opinion as evaluated by researchers using information from farmers, wholesalers and consumers (1 = very low , 3 = low, 5 = medium, 7 = high , 9 = very high).
References and further informationDedeene, L., De Kinder, G.
Groente & Fruit Encyclopedie (2009), Kosmos Uitgevers. p.86.Van Boxem, H., Buysse, G., Maes, B., Robinet, P., Williame, F. Handboek Ecologisch Tuinieren (2006),
Veltvzw.P.419.UPOV Guidelines for the conduct of tests for distinctness, uniformity and stability. Lamb’s lettuce (TP/75/2).
www.upov.int

Guidelines for Experimental Practice | 105
4.3.2 Lettuce
By Wolfgang Palme
Botanical name: Lactuca sativa Subspecies: capitata; crispa, longifoliaCommon types: Butterhead Lettuce, Iceberg Lettuce, Oak Leaf Lettuce, Romaine Lettuce, Baby Cos Lettuce, Battavia Lettuce
General conditionsLettuces need loose soils with good structure. Especially suitable are sandy loams with high humus content and pHof6.5-7.Headlettuceissensitivetohighsalinity.
Figure 4.14 A lettuce variety trial in Austria.
Experimental designTrial with at least four replications.
Table 4.37Typical lettuce plant spacing and number of plants required for trials.
North and Central
Minimum number of plants per core plot 20-30
Minimumsizeofcoreplot(m²) 2-3
Plant density (plants/m²) 11
Distance between plants (cm) 30 x 30
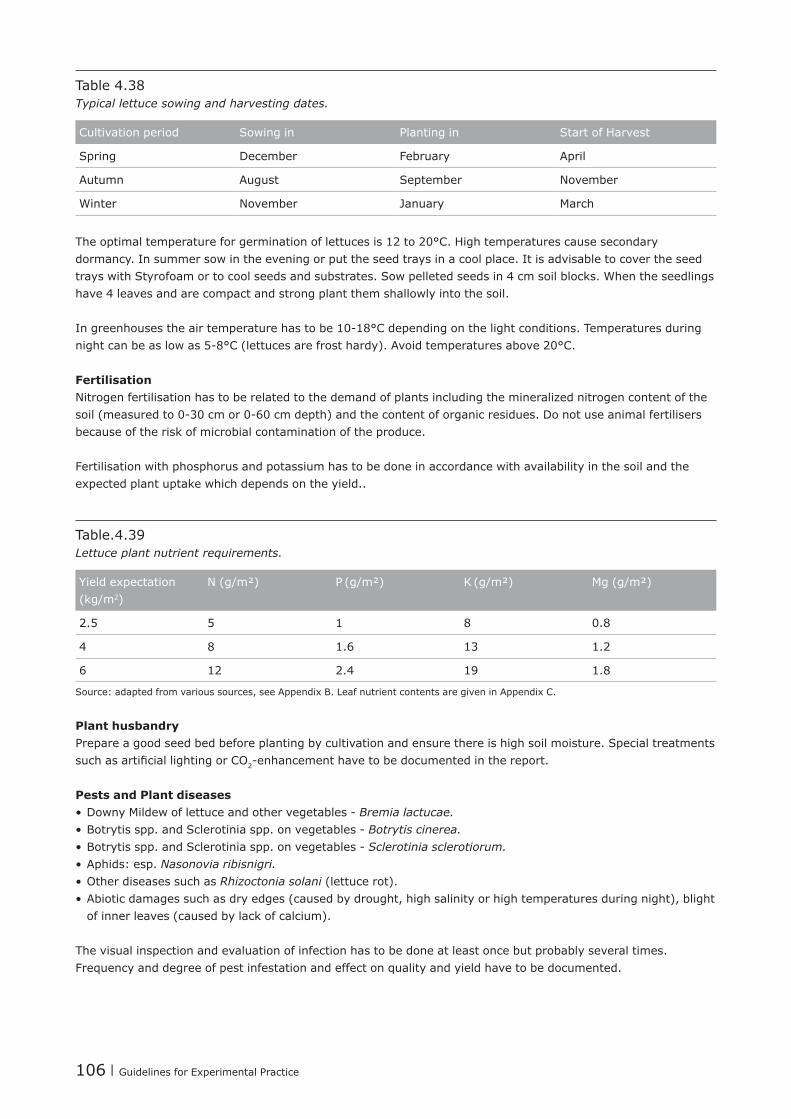
106 | Guidelines for Experimental Practice
Table 4.38 Typical lettuce sowing and harvesting dates.
Cultivation period Sowing in Planting in Start of Harvest
Spring December February April
Autumn August September November
Winter November January March
The optimal temperature for germination of lettuces is 12 to 20°C. High temperatures cause secondary dormancy. In summer sow in the evening or put the seed trays in a cool place. It is advisable to cover the seed trays with Styrofoam or to cool seeds and substrates. Sow pelleted seeds in 4 cm soil blocks. When the seedlings have 4 leaves and are compact and strong plant them shallowly into the soil.
Ingreenhousestheairtemperaturehastobe10-18°Cdependingonthelightconditions.Temperaturesduringnightcanbeaslowas5-8°C(lettucesarefrosthardy).Avoidtemperaturesabove20°C.
Fertilisation Nitrogenfertilisationhastoberelatedtothedemandofplantsincludingthemineralizednitrogencontentofthesoil(measuredto0-30cmor0-60cmdepth)andthecontentoforganicresidues.Donotuseanimalfertilisersbecause of the risk of microbial contamination of the produce.
Fertilisation with phosphorus and potassium has to be done in accordance with availability in the soil and the expected plant uptake which depends on the yield..
Table.4.39Lettuce plant nutrient requirements.
Yield expectation(kg/m2)
N (g/m²) P (g/m²) K (g/m²) Mg (g/m²)
2.5 5 1 8 0.8
4 8 1.6 13 1.2
6 12 2.4 19 1.8
Source: adapted from various sources, see Appendix B. Leaf nutrient contents are given in Appendix C.
Plant husbandryPrepare a good seed bed before planting by cultivation and ensure there is high soil moisture. Special treatments suchasartificiallightingorCO2-enhancementhavetobedocumentedinthereport.
Pests and Plant diseases •DownyMildewoflettuceandothervegetables-Bremia lactucae.•Botrytisspp.andSclerotiniaspp.onvegetables-Botrytis cinerea.•Botrytisspp.andSclerotiniaspp.onvegetables-Sclerotinia sclerotiorum.•Aphids: esp. Nasonovia ribisnigri.•Other diseases such as Rhizoctonia solani (lettuce rot).•Abiotic damages such as dry edges (caused by drought, high salinity or high temperatures during night), blight
of inner leaves (caused by lack of calcium).
The visual inspection and evaluation of infection has to be done at least once but probably several times. Frequency and degree of pest infestation and effect on quality and yield have to be documented.

Guidelines for Experimental Practice | 107
Assessment during crop growthMany parameters can be assessed using a 1 to 9 scale (1, very low; 9, very high) but measurements are preferable when possible:•Sizeofplants.•Sizeofheads(whenapplicable,e.g.iceberglettuce).•Green Colour.•Other colours (by anthocyanins).•Heading.•Firmness of heads.•Leafshapeandleafsize.•Losses.•Date of bolting.
Assessments at harvestEverycultivarhastobeharvestedattheoptimaltime.Theheadshavetoshowtheircharacteristicweight,sizeandfirmness.Thecropshouldbeclassifiedaccordingtoqualitystandards.Marketableheadsareweighedandcounted:•Minimum weight of heads (in greenhouses) of butterhead lettuce: 100 g.•Minimum weight of heads (in greenhouses) of iceberg lettuce: 200 g.
Non marketable lettuces are sorted into•Bolted plants.•Rotten heads.•Others.
A range of quality parameters can also be assessed (e.g. uniformity of crop, tightness/looseness of foliage, firmnessofstems,blistering,amountofouterleaves,effortofcleaningetc.).Thisisnormallydoneon10lettuces taken from each plot using a 1 to 9 scale. The number of side shoots can be counted
Overall value scoreThis is particularly appropriate for variety trials. The total value includes all parameters of cultivation and marketing. Give numbers from 1 (poor) to 9 (excellent).
References and other informationUPOV Guidelines for the conduct of tests for distinctness, uniformity and stability. Lettuce (TP/13/5).
www.upov.int

108 | Guidelines for Experimental Practice
4.3.3 Rocket and other baby leaf brassica salads
By Wolfgang Palme
Botanical and common names: Eruca sativa (rocket or arugula), Diplotaxis tenuifolia (wall rocket or wild rocket), Brassica rapa (e.g.mizuna),Brassica juncea (e.g. mustard greens, brown mustard).
General conditions Loose, well structured soils with high humus content and good water supply are needed. Adequate soil moisture levels are important to prevent bolting. During summer the growing site can be lightly shaded. Do not grow repeated crops of rocket or oriental greens or follow other Brassicas because of disease issues. Avoid following a crop which leaves high nitrogen residues.
Experimental layout An experimental layout with four replicates should be used.
Table 4.40Typical rocket plant spacing and number of plants required for trials.
Sown directly Planted
Minimumsizecoreplot(m²) 2 2
Plant density / m² 200-400 33substrateblockseachwith5-7plants
Row distance (cm) 10-15 15-20
Distance in the range/row (cm) 10-15
Sowing and planting, temperature requirements It is possible to sow all year round although from March to April oriental greens tend to bolt. They are very frost hardy and fast growing crops.
Fertilisation and IrrigationThe nutrient requirement is low because of the short cultivation period. Avoid organic fertilisers such as manure. Ensure a regular water supply.
Table.4.41Rocket plant nutrient requirements.
Yield expectation(kg/m2)
N (g/m²) P (g/m²) K (g/m²) Mg (g/m²)
2 14 1.2 10 1.4
3 21 1.8 15 2.1
Source: adapted from various sources, see Appendix B
Crop management and phytosanitary measures Ensurethecropiskeptweedfreebymechanicalmethods.Topreventfleabeetleattackcoverwithinsectproofnetting.

Guidelines for Experimental Practice | 109
Disease and pest infestationDisease and pest infestation should be assessed one or more times during the cropping period. Disease/pest incidence, disease/pest severity, and optionally the effect on quality and yield have to be noted (see also section 2.5). Key problems include:•Downy mildew.•Botrytis.•Pseudomonas.•Xanthomonas.•Phoma.•Alternaria.•Fleabeetle-Phyllotretaundulata.•Assessments during growth.•Speedofgermination(daysaftersowingbywhich50%ofseedlingshavegerminated).•Uniformity of crop (1 = very low, 3 = low, 5 = medium, 7 = high, 9 = very high).•Timebeforebolting(daysbywhich10%ofplantshavestartedtobolt).•Colour (1 = very light, 3 = light, 5 = medium, 7 = intense, 9 = very dark).•Number of missing plants (counted before harvest begins).•Time to harvest.
Assessments at harvestThecropisnormallyharvestedatthe‘babyleaf’stage(8-10cm).Theyshouldnotbelongerthan20cm.Repeatedharvestsarepossiblebeforethecropfinallybolts.Yieldofpickedleavesshouldberecordedoneachharvesting occasion – these are divided into marketable and unmarketable fractions (e.g. excluding diseased leaves).
Total valueThe total value takes into account all criteria for the cultivation and marketing of the variety (1 = very low, 3 = low, 5 = medium, 7 = high, 9 = very high). It is particularly suitable for variety trials.
References and other informationUPOV Guidelines for the conduct of tests for distinctness, uniformity and stability. Wild rocket (TG/244/1). www.upov.int
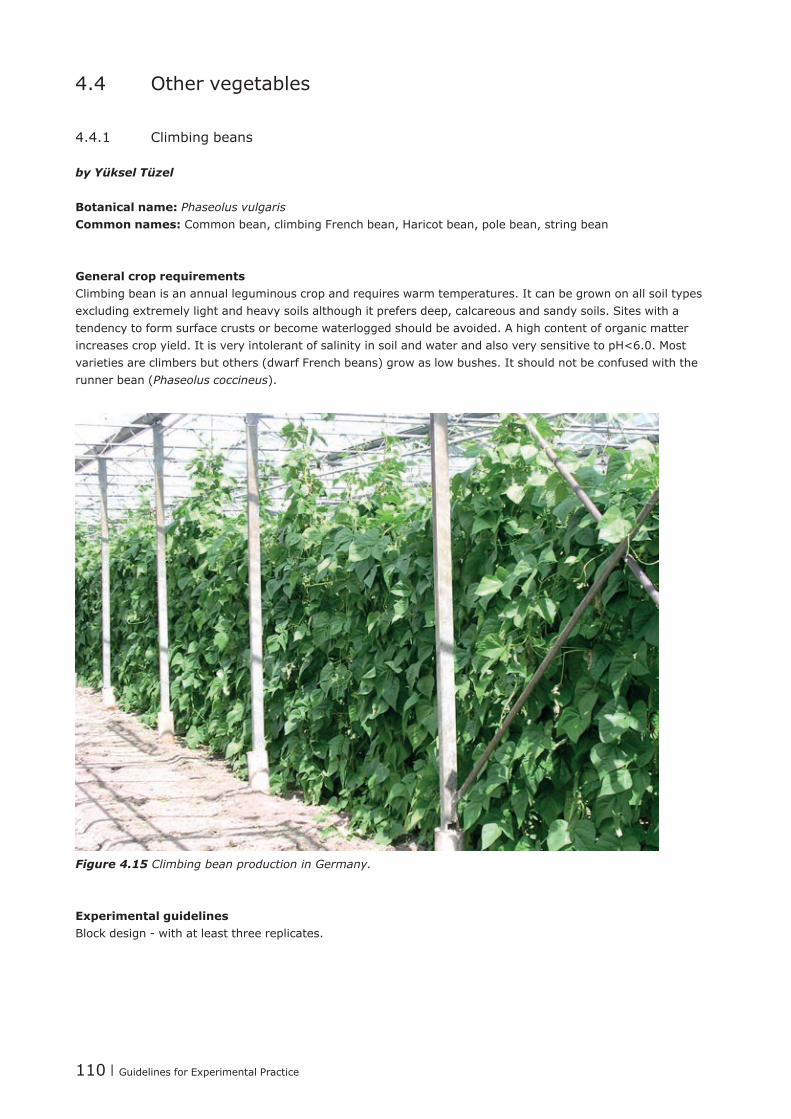
110 | Guidelines for Experimental Practice
4.4 Other vegetables
4.4.1 Climbing beans
by Yüksel Tüzel
Botanical name: Phaseolus vulgaris Common names: Common bean, climbing French bean, Haricot bean, pole bean, string bean
General crop requirementsClimbing bean is an annual leguminous crop and requires warm temperatures. It can be grown on all soil types excluding extremely light and heavy soils although it prefers deep, calcareous and sandy soils. Sites with a tendency to form surface crusts or become waterlogged should be avoided. A high content of organic matter increases crop yield. It is very intolerant of salinity in soil and water and also very sensitive to pH<6.0. Most varieties are climbers but others (dwarf French beans) grow as low bushes. It should not be confused with the runner bean (Phaseolus coccineus).
Figure 4.15 Climbing bean production in Germany.
Experimental guidelinesBlockdesign-withatleastthreereplicates.

Guidelines for Experimental Practice | 111
Table 4.42Typical bean plant spacing and number of plants required for trials.
All regions
Minimum number of plants per plot/ core 75 (on 25 support cords)
Minimumsizecoreplot(m²) 7.5
Number of plants 4 per support cord
Row spacing (cm) 100 – 110
Distance within the row (cm) 35
Sowing and planting, temperature requirements Production season and the length of crop cycle depend on local climatic conditions. Beans can be grown by direct seed sowing or transplanting the seedlings. Four to six seeds are sown into each pot with a depth of approximately 3 cm. After emergence, the weakest are thinned by pinching out. The remainder are planted about two weeks after sowing, before the shoots are about 10 cm long. Temperatures below 15°C and above 24°Candstrongtemperaturefluctuationsleadtoincreasedsheddingofflowersandpoorfruitset.
Table 4.43 Typical bean planting and harvesting dates
Region -Productiontype
Sowing at Start of Harvest End of harvest Remarks
North & central -Unheated
Apr Jun Sept Planting 2 weeks after sowing
-SeasonalHeated Jan
Mid Febto Mid Mar
Apr
May
Late May
Aug
Planting 2 weeks after sowing
Mediterranean -ShortcycleAutumn
EndAug-Sep
Dec
Feb
Unheated greenhouses
-ShortcycleSpring Dec-Jan Mar Jun Unheated greenhouses
Table 4.44Temperatures (°C) required for production of been seedlings and plants.
Germination temperature °C Day / Night
Days until germination Temperature for seedlings in °C Day / Night
Weeks before transplanting
22 / 24 1-2 22 / 18 2
Table 4.45 Temperatures required for been plant growth and pod production.
Growing cycle temperature Day°C Night°C Ventilation from°C
22-24 16-18 26
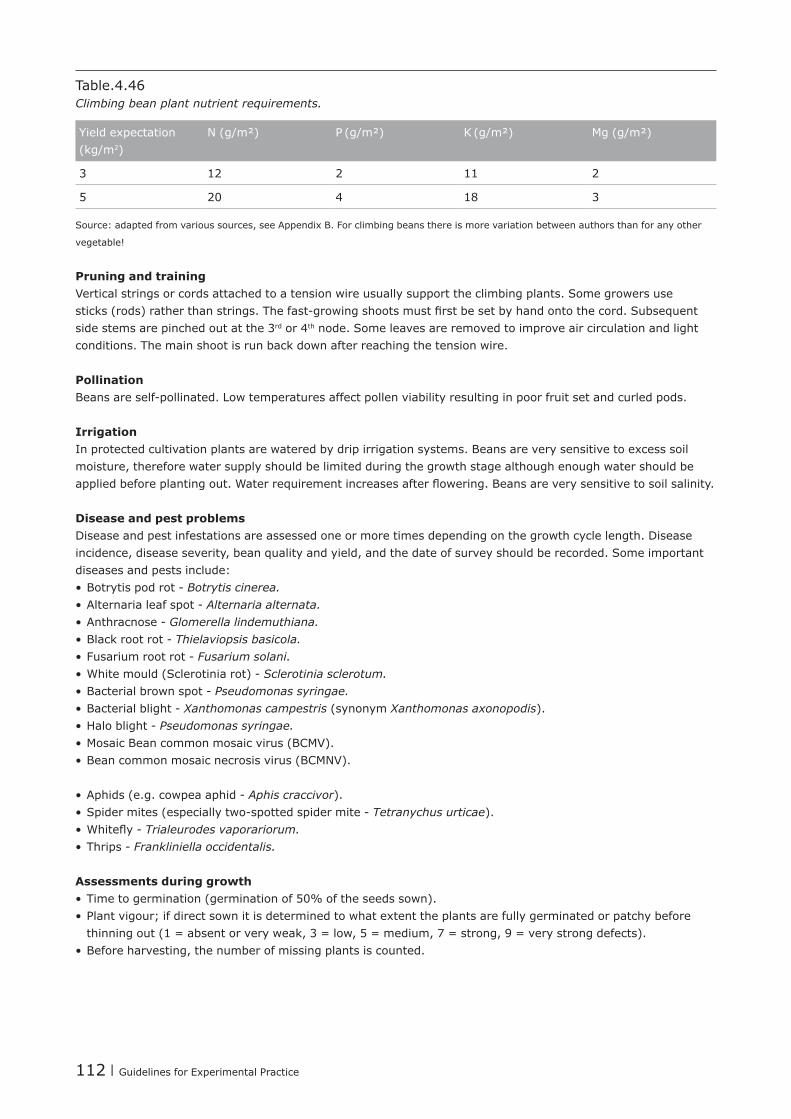
112 | Guidelines for Experimental Practice
Table.4.46Climbing bean plant nutrient requirements.
Yield expectation(kg/m2)
N (g/m²) P (g/m²) K (g/m²) Mg (g/m²)
3 12 2 11 2
5 20 4 18 3
Source: adapted from various sources, see Appendix B. For climbing beans there is more variation between authors than for any other
vegetable!
Pruning and trainingVertical strings or cords attached to a tension wire usually support the climbing plants. Some growers use sticks(rods)ratherthanstrings.Thefast-growingshootsmustfirstbesetbyhandontothecord.Subsequentside stems are pinched out at the 3rd or 4th node. Some leaves are removed to improve air circulation and light conditions. The main shoot is run back down after reaching the tension wire.
PollinationBeansareself-pollinated.Lowtemperaturesaffectpollenviabilityresultinginpoorfruitsetandcurledpods.
IrrigationIn protected cultivation plants are watered by drip irrigation systems. Beans are very sensitive to excess soil moisture, therefore water supply should be limited during the growth stage although enough water should be appliedbeforeplantingout.Waterrequirementincreasesafterflowering.Beansareverysensitivetosoilsalinity.
Disease and pest problemsDisease and pest infestations are assessed one or more times depending on the growth cycle length. Disease incidence, disease severity, bean quality and yield, and the date of survey should be recorded. Some important diseases and pests include:•Botrytispodrot-Botrytis cinerea. •Alternarialeafspot-Alternaria alternata.•Anthracnose-Glomerella lindemuthiana.•Blackrootrot-Thielaviopsis basicola.•Fusariumrootrot-Fusarium solani.•Whitemould(Sclerotiniarot)-Sclerotinia sclerotum.•Bacterialbrownspot-Pseudomonas syringae.•Bacterialblight-Xanthomonas campestris (synonym Xanthomonas axonopodis).•Haloblight-Pseudomonas syringae.•Mosaic Bean common mosaic virus (BCMV).•Bean common mosaic necrosis virus (BCMNV).
•Aphids(e.g.cowpeaaphid-Aphis craccivor).•Spidermites(especiallytwo-spottedspidermite-Tetranychus urticae).•Whitefly-Trialeurodes vaporariorum.•Thrips-Frankliniella occidentalis.
Assessments during growth•Timetogermination(germinationof50%oftheseedssown).•Plant vigour; if direct sown it is determined to what extent the plants are fully germinated or patchy before
thinning out (1 = absent or very weak, 3 = low, 5 = medium, 7 = strong, 9 = very strong defects).•Before harvesting, the number of missing plants is counted.
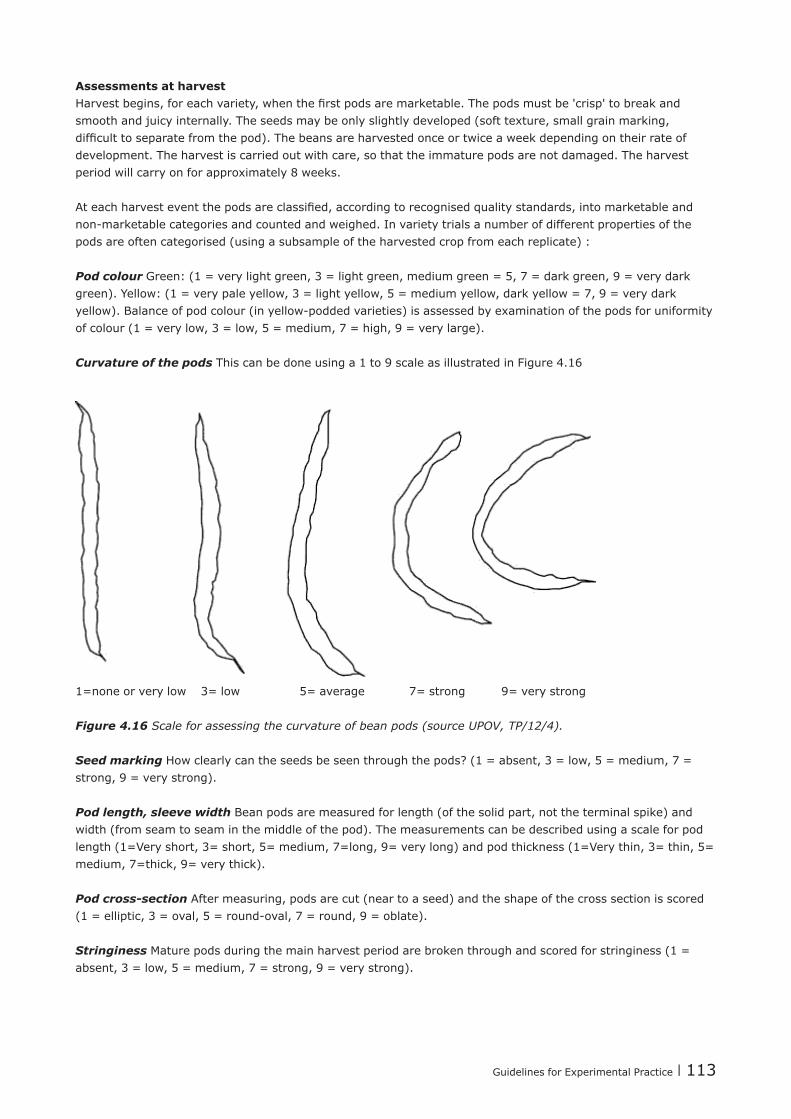
Guidelines for Experimental Practice | 113
Assessments at harvestHarvestbegins,foreachvariety,whenthefirstpodsaremarketable.Thepodsmustbe'crisp'tobreakandsmooth and juicy internally. The seeds may be only slightly developed (soft texture, small grain marking, difficulttoseparatefromthepod).Thebeansareharvestedonceortwiceaweekdependingontheirrateofdevelopment. The harvest is carried out with care, so that the immature pods are not damaged. The harvest period will carry on for approximately 8 weeks. Ateachharvesteventthepodsareclassified,accordingtorecognisedqualitystandards,intomarketableandnon-marketablecategoriesandcountedandweighed.Invarietytrialsanumberofdifferentpropertiesofthepods are often categorised (using a subsample of the harvested crop from each replicate) :
Pod colour Green: (1 = very light green, 3 = light green, medium green = 5, 7 = dark green, 9 = very dark green). Yellow: (1 = very pale yellow, 3 = light yellow, 5 = medium yellow, dark yellow = 7, 9 = very dark yellow).Balanceofpodcolour(inyellow-poddedvarieties)isassessedbyexaminationofthepodsforuniformityof colour (1 = very low, 3 = low, 5 = medium, 7 = high, 9 = very large).
Curvature of the pods This can be done using a 1 to 9 scale as illustrated in Figure 4.16
1=none or very low 3= low 5= average 7= strong 9= very strong
Figure 4.16 Scale for assessing the curvature of bean pods (source UPOV, TP/12/4).
Seed marking How clearly can the seeds be seen through the pods? (1 = absent, 3 = low, 5 = medium, 7 = strong, 9 = very strong).
Pod length, sleeve width Bean pods are measured for length (of the solid part, not the terminal spike) and width (from seam to seam in the middle of the pod). The measurements can be described using a scale for pod length (1=Very short, 3= short, 5= medium, 7=long, 9= very long) and pod thickness (1=Very thin, 3= thin, 5= medium, 7=thick, 9= very thick).
Pod cross-section After measuring, pods are cut (near to a seed) and the shape of the cross section is scored (1=elliptic,3=oval,5=round-oval,7=round,9=oblate). Stringiness Mature pods during the main harvest period are broken through and scored for stringiness (1 = absent, 3 = low, 5 = medium, 7 = strong, 9 = very strong).

114 | Guidelines for Experimental Practice
Field life This is assessed using the crop from at least 2 strings per replicate. These can be in the plot border areas so as not to interfere with the yield measurements. For this purpose, refrain from harvest during the main harvesttime.Aboutaweekafterthelastharvestthefibrousnessandstringinessofmaturepodsisscored(usingat least 10 pods per replicate). Fibrousnessbeginswithwhitishdiscolorationoftheinitially'glassy',juicypodfleshinthedorsalandventralsuture(seam).Alittlelateryoucanseetheformationofaninnerthinfleece-likepericarpskinwhenyouopenthepod.Thefleshbecomesincreasinglydry.Toassessthefibrousness,thepodsarebrokenandopened.Withincreasing maturity, they break less easily (1 = absent or very weak, 3 = low (whitish discoloration in the area of thedorsalandventralsuture),5=medium,7=strong,9=verystrong-beanwillnolongerbreak).
Overall value scoreThistakesintoaccountallcriteriaforcultivationandcommercializationofthevariety(1=verylow,3=low,5=medium, 7 = high, 9 = very high).
References and further informationCABI Crop Protection Compendium. (2008).
Phaseolusvulgarisdatasheet.Availableat:http://www.cabi.org/cpc/datasheet/40626.[Accessed23December 14]. Paid subscription required.
Drost, D. (2010). Beans in the Garden. Utah State University Cooperative Extension. Available at: https://extension.usu.edu/files/publications/publication/HG_Garden_2005-08.pdf.[Accessed23December14].Freetoaccess.
FAO, 1990. ProtectedCultivationintheMediterraneanClimate.FAOpaper90:249-251.
Biddle, A.J., Cattlin, N.D., 2007. Pests, Diseases and Disorders of Peas and Beans. A colour handbook. Academic Press, USA.
Gianquinto,G.,Munoz,P.,Pardossi,A.,Ramazzotti,S.,Savvas,D.,2013. Soil fertility and plant nutrition. In Good Agricultural Practices for greenhouse Vegetable crops. FAO Plant ProductionandProtectionPaper217:215-270.
Schwartz,H.F.,Steadman,J.R.,Hall,R.&Forster,R.L.(2005) Compendium of Bean Diseases. Available at: http://www.apsnet.org/apsstore/shopapspress/Pages/43275.aspx. Available for purchase from APS Press.
UPOV Guidelines for the conduct of tests for distinctness, uniformity and stability. French beans (TP/12/4). http://www.upov.int

Guidelines for Experimental Practice | 115
4.4.2 Kohlrabi
By Martin Koller
Botanical name: Brassica oleracea L. var. gongylodes (Brassicaceae)Other common names: German turnip, turnip cabbage
WithappropriatemodificationstheinformationinthissectioncanalsobeusedasatemplateforsimilarcropslikeChinesecabbage,Pak-choi,Swisschardorcelery.
General crop requirements Kohlrabi can be cultivated all year around with a low temperature requirement but in greenhouses, winter production is most important. Some varieties are sensitive to low temperature at the seedling stage in order to avoid leaf deformation and heartlessness. A uniform water supply prevents cracks and woodiness of the tuber. Kohlrabi in greenhouses are grown in Central and Northern Europe, but very rarely in the Mediterranean.
Experimental design Recommended replicates: at least 4.
Table 4.47Typical kohlrabi plant spacing and number of plants required for trials.
North & central un-heated
North & centralheated
Minimum number of plants/ core plot 30 40
Minimumsizecoreplot(m²) 2.5-3.5 2.5
Plant density / m² 12-16 16
Row distance (cm) 25 – 30 25
Spacing within the row (cm) 25 – 30 25
Table 4.48Typical kohlrabi sowing and harvesting dates.
Region -Productiontype
Sowing at Planting at Start of Harvest End of harvest Remarks
North & central -Unheated*
DecJul
Feb Aug
Apr Oct
Apr Nov
Spring crop Autumn crop
-Seasonalheated
Nov Aug
Jan Sept
March Dec
March Dec
Spring crop Autumn crop
*Transplants are produced in heated greenhouses even if the production phase is unheated.
Table 4.49Kohlrabi temperature requirements for sowing and seedling development.
Germination temperature °C Day/ Night
Days until germination
Temperature for seedlings in °C Day/ Night
Pots Weeks until plantation
16-20/14Ventilationfrom20-25
6 – 12 12-16/10Ventilation from 20 – 25
4 – 5 cm peat pot
4 – 8
116 | Guidelines for Experimental Practice
Table 4.50Optimal temperatures for plant growth after planting.
Day Night Ventilation from
Planting in late February / harvest end April
10-15°C 7-8°C 20-24°C
Table 4.51Kohlrabi plant nutrient requirements.
Yield expectation(kg/m2)
N (g/m²) P (g/m²) K (g/m²) Mg (g/m²)
2.5 8 1.5 9 2
4.5 14 3 17 3
Source: adapted from various sources, see Appendix B
IrrigationRegular irrigation of 15 to 20 mm is needed (on sandy soils). The soil must not be allowed to dry out in order to avoid cracks and woodiness.
Disease and pest infestation, physiological disorders and other abiotic damageTohelpidentifydiseasesseee.g.“CompendiumofBrassicaDisease”(APS,ISBN978-0-89054-344-3).Relevantpests and diseases, with link to relevant EPPO Guidelines, include:
•Downymildew-Peronospora parasitica(PP1/65(3)-Downymildewsoflettuceandothervegetables).Yellowspotsontheleafsurfaceandgrey-brownishsporangia’sandtheunderside(alsooncotyledons).
•Clubroot Plasmodiophora brassicae (PP 1/39(2)).•Black leaf spot, Alternaria brassicae and A. brassicicola (PP 1/121(2) Leafspots of vegetables)
Round, black spots on the leaf surface.•CabbagefleabeetlePhyllotreta spp. (on rape) (PP 1/218(1).
•Cabbagerootfly(PP1/9(3)Delia radicum).•Caterpillars e.g. Plutella xylostella, Pieris sp., Mamestra brassicae:(PP1/83(2)-Caterpillarsonleafbrassicas)•Cabbage aphids Brevicoryne brassicae: (PP 1/24(2) Aphids on potato, sugar beet, pea, broad bean and other
vegetables).
Assessments during growthSee: UPOV Guidelines T/65/4
Amount and size of leaves The leaf mass is scored before the beginning of harvest (1 = very low, 3 = low, 5 = medium, 7 = high, 9 = very large).
Leaf position The leaf position of the majority of the leaves is assessed before the beginning of harvest. This scoring should be carried out in the morning. Kohlrabi with leaves in an upright position are easier to harvest and toputinboxes(3=erect/upright,5=semi-erect/semi-upright,7=horizontal).
Shape of bulb (UPOV characteristic 21). Shape of bulb in longitudinal section, see UPOV page 13 ( 1 = transverse narrow elliptic, 2 = transverse elliptic, 3 = transverse broad elliptic, 4 = circular, 5 = broad elliptic).
Colour of skin (UPOV characteristic 20). 1 = white green, 2 = green, 3 pale violet, 4 = dark violet

Guidelines for Experimental Practice | 117
Stability of plants 1 = very low, 3 = low, 5 = medium, 7 = high, 9 = very large
Missing plants Missing plants should be counted before harvest begins.
Assessments at harvest Kohlrabi can be harvested as soon as a certain diameter is reached (e.g. Germany > 80 mm for spring crop, for autumn crop 70 mm). Some plants develop more quickly than others and so the whole crop requires more than oneharvest.ThecroppingofaKohlrabivarietyingreenhousesshouldbefinishedafterthreeharvests.Moreharvests are considered as uneconomic. The crop is sorted and weighed according to the quality standards for marketableandnon-marketableproduce.Thenon-marketablecropisdividedintomainreasonsforrejection:•Bulbs with cracks.•Bolters.•Others (rot, diseased, misshaped, too small, cracks because of weevils).
In addition to yield a number of other parameters can be determined:
Stalk length Before removing the root, the stalk length is scored. With a too short stalk, there is a risk that the bulbs get dirty and rot. Too long stalk may have unfavourable effect on the stability of the plant in the ground (1 = very short, 3 = short, 5 = medium, 7 = long, 9 = very long).
Woodiness On the day with the biggest harvest a slice of approximately 1 mm thickness is cut of the middle of 10 marketable bulbs. The woodiness is determined by chewing on the slice. In addition, the bulb halves can be driedforonetotwodaysinawarmgreenhouse.Thefibreswillafterwardsbedefinedmoreclearly(1=absentor very low, 3 = low, 5 = medium, 7 = strong, 9 = very strong).
Overall value scoreThis takes into account all criteria for the cultivation and marketing of the variety, based on expert opinion as evaluated by researchers using information from farmers, wholesalers and consumers (1 = very low, 3 = low, 5 = medium, 7 = high , 9 = very high).
References and further informationRimmer S. R., Shattuck V.I. and Buchwaldt L.(Eds). 2007.
CompendiumofBrassicaDisease.AmericanPhytopathologicalSociety.(ISBN978-0-89054-344-3)International Union for the Protection of New Varieties of Plants (UPOV):
Kohlrabi TG/65/4 www.upov.int
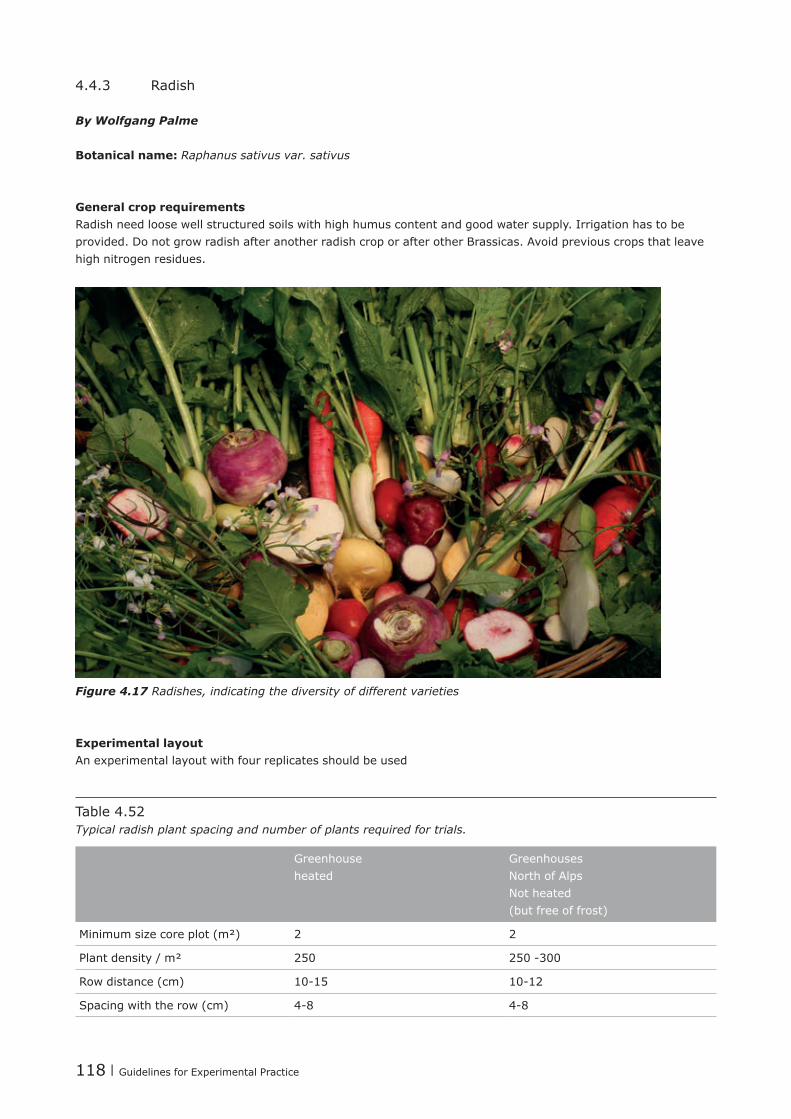
118 | Guidelines for Experimental Practice
4.4.3 Radish
By Wolfgang Palme
Botanical name: Raphanus sativus var. sativus
General crop requirementsRadish need loose well structured soils with high humus content and good water supply. Irrigation has to be provided. Do not grow radish after another radish crop or after other Brassicas. Avoid previous crops that leave high nitrogen residues.
Figure 4.17 Radishes, indicating the diversity of different varieties
Experimental layout An experimental layout with four replicates should be used
Table 4.52Typical radish plant spacing and number of plants required for trials.
Greenhouseheated
Greenhouses North of Alps Not heated (but free of frost)
Minimumsizecoreplot(m²) 2 2
Plant density / m² 250 250-300
Row distance (cm) 10-15 10-12
Spacing with the row (cm) 4-8 4-8
Guidelines for Experimental Practice | 119
Table 4.53Typical radish sowing dates and growing periods.
Region -Productiontype
Sowing at Cultivation period (days)
North & central -Unheated
Feb-MarchSept.
40-5535-55
North & central -Seasonalheated
Jan-FebSept.-Oct
40-7035-70
It is best, if possible, to sow using a precision seeder that sets seeds at controlled spacing. If they are sown at an excessive density the seedlings have to be singled after germination. For optimum seed placement and best germinationtheseedbedshouldberolled.Iftheseedsaresowntoodeeply(>1-1.5cm)rootscanbecomedeformed.
Conditionsforgermination:12-15°Cairtemperature,ventilation>20°C.Soiltemperature:>10°.Aftergermination:5-6°C,ventilation:>15°C.
Crop nutritionThe nutrient requirement is low because of the short cultivation period. If a contribution from crop residues of the previous crop is available no fertilisation is needed. Avoid organic fertilisers such as manure.
Table.4.54Radish plant nutrient requirements.
Yield expectation(kg/m2)
N (g/m²) P (g/m²) K (g/m²) Mg (g/m²)
2 6 0.8 6 1
4 12 1.6 12 2
6(e.g.Daikon-alongwhiteAsianradish) 18 2.4 18 3
Source: adapted from various sources, see Appendix B
IrrigationEnsure there is a regular water supply. Irregular irrigation causes quality defects such as cracking. A lack of water makes the roots spongy.
Crop management and phytosanitary measures Ensurethatthecropiskeptweedfree.Beforesowingandevenaftergerminationflameweedingispossible.Tobeeffectiveagainstfleabeetlesandsummercabbagefliescoverwithinsectproofnetting.
Disease and pest problemsThe disease and pest infestation (incidence and severity) should be assessed one or more times during the crop growth (see also section 2.5). Key problems include:•Downymildew-Peronospora parasitica.•Blackscurf-Rhizoctonia solani.• Fusarium.•Clubroot-Plasmodiophora brassicae.•Whiterust-Aphanomyces raphanin/Albugo candida.
•Fleabeetle-Phyllotreta undulata.•Cabbagerootfly-Delia radium.

120 | Guidelines for Experimental Practice
Observations during growth Date of emergence(90%ofgerminatedseedlingshowexpandedcotyledons)Plant density (measured per running meter on a representative spot in the crop)Missing plants (counted before harvest begins)
Assessments at harvestThe time of harvest has come when bulb diameter is >20 mm (or in autumn >25 mm). Not more than two or three harvests should be carried out. The crop should be sorted according to recognised quality standards into marketableandnon-marketablefractionsandthereasonsforrejectionindentified.Thesecouldinclude:•Bulbs with cracks.•Undersizedbulbs(<10mm).•Rotten, diseased, bulbs.•Bolters (stems >3 cm).•Others (misshaped, miscoloured).
In addition to yield a number of other parameters can also be assessed including:
Uniformity of bulbs (1 = very low, 3 = low, 5 = medium, 7 = high, 9 = very high)
Size of main root Ideally the main root base should be small. (1 = very small, 3 = small, 5 = medium, 7 = thick, 9 = very thick).
Length of leaves 10 bulbs of marketable produce are measured concerning leaf. If the leaves are too long the storage life is reduced. If it is too short it is not easy to manage bundling.
Diameter of bulbs 10 bulbs of marketable produce are measured. Cultivars with oblong shape are also measured in length.
Sponginess On the day of harvesting 20 marketable bulbs are cut longitudinally. Sponginess is determined (1 = very soft, 9 = very hard).
Total value scoreThe total value takes into account all criteria for the cultivation and marketing of the variety (1 = very low, 3 = low, 5 = medium, 7 = high, 9 = very high).
References and further informationUPOV
Guidelines for the conduct of tests for distinctness, uniformity and stability. Radish (TP/64/2). http://www.upov.int
Guidelines for Experimental Practice | 121
4.4.4 Spring onion
By Karin Postweiler
Botanical name: Allium cepa and Allium fistulosum
Spring onions are divided into types with bulbs and early leaf development and types without bulbs (bunching types).ThesetypesbelongtothespeciesAlliumfistulosumorarecrossingsbetweenA.cepaandA.fistulosum.Both types are harvested with their leaves.
General crop requirementsSpring onions need soils with high humus content, with a pH 6.5 to 7.5. Plots with high nitrogen residues are not appropriate. Do not grow spring onions after other Allium crop. Throughout the cultivation period a regular watersupplyandsufficientirrigationisnecessary.Springonionscanbeestablishedbydirectsowing(ideallywith precision seeders) or transplanted (3 or 4 seeds per ‘pressed block’). Seeds usually take 10 to 25 days to germinate and the crop has a cultivation period of 220 to 240 days.
Experimental designAn experimental layout with four replicates should be used.
Table 4.55Typical spring onion spacing and number of plants required for trials
Greenhouse unheated (free of frost)types with bulbs
Greenhouse unheated (free of frost)types without bulbs
Minimumsizecoreplot(m²) 4 4
Plant density / m² 200 250
Row distance (cm) 20 15
Plant distance with the row (cm) 2 2
Crop nutrition and irrigationSufficientirrigationisnecessarytopreventdroughtdamage.Nitrogenfertilisationshouldbesuppliedaccordingto the residues in the soil.
Table.4.56Spring onion plant nutrient requirements.
Yield expectation(kg/m2)
N (g/m²) P (g/m²) K (g/m²) Mg (g/m²)
2 5 1.2 5 1
4 10 2.4 9 2
Source: adapted from various sources, see Appendix B
Crop management and phytosanitary measuresAimforaweedfreecrop.Beforesowingorplantingflamweedingispossible.Topreventdamagebyinsectsmesh covers can be used.

122 | Guidelines for Experimental Practice
Disease and pest problemsThe disease and pest infestation should be assessed one or more times during the cropping period. Disease/pest incidenceandseverityshouldbenoted.Effectofspecificpestsanddiseasesoncropqualityatharvestcanalsorecorded.
•Downymildew-Peronospora destructor.• Botrytis squamosa.•Alliumrootrot-Sclerotium cepivorum.•Fusarium.
Onionthrips-Thrips tabaciOnionflies-Delia antiquaLeekmoth-Acrolepiopsis assectellaAlliumleafminer-Phytomyza gymnostoma
Assessments during crop growthDate of emergenceThenumberofdaysfromsowingto50%emergence.Plant density Counted per running meter on a representative spot in the crop.Position of the Foliage Before harvest the position of the leaves is determined. For better bunching upright leaves are preferable. Number of bolters These should be counted
Assessments at harvestThe harvest of spring onions is reached when bulb diameter is about 10 mm. The harvest should all be done on one date. The weighed yield measurement are carried out on the marketable onions per plot. The crop is sorted according to recognised quality standards. For the bulb producing species the crop can be further sorted accordingtosize,forexamplewithdiametersof:•10-20mm.•20-30mm.•over 30 mm.
To characterise a variety length of the plant and length of the shaft should be measured on at least 10 plants per plot.
Thenon-marketablecropisdividedintomainreasonsforrejection:•Rotten, diseased bulbs.•Others , misshaped, to small.
Overall value scoreThis takes into account all criteria for the cultivation and marketing of a variety (1= very low, 3 = low, 5 = medium, 7 = high, 9 = very high).
Other informationUPOV
Guidelines for the conduct of tests for distinctness, uniformity and stability. Onions (TP/46/2 and TP/161/1). http://www.upov.int

Guidelines for Experimental Practice | 123
4.5 Transplants
4.5.1 Vegetable transplants
By Yuksel Tüzel
SystemsVegetable seedlings are increasingly being raised in module systems (i.e. plug trays) which have many cells each with a small volume. Each transplant is grown in its own cell resulting in the elimination of the damage caused by tearing apart matted root systems of plants grown together (Doolan et al. 1999).
Inmodularsystems,traysdifferintermsofnumber,shapeandsizeofcells(i.e.from70to600).Thematerialcan be expanded polystyrene, rigid polyethylene or polypropylene. The growing media used must provide an appropriate environment for seed germination, support the plant and provide water and limited amount of nutrients. Many trials are concerned with nutrient supply and the composition of growing media (especially the use of alternatives to peat) – see Sections 3.2.5 and 3.2.6.
Other systems in use are:•Pressed blocks; these can be made a variety of substrates and hold together without the need for a ‘container’. Itisconsidereddifficulttousegrowingmediaotherthanpeatthathavetherequiredcharacteristicsandtheuse of peat is considered unethical in certain countries e.g. the UK.
•Bare root transplants (e.g. leeks, cabbage, or in some regions tomatoes and lettuce).
The appropriate system will depend on cropping season, temperature, and vegetable species.
Figure 4.18 Left, Lamb’s lettuce transplants grown in pressed block (70% peat); Right, cabbage transplants (‘speedy plants’) grown in module trays.
Experimental guidelinesRecommended replicates: at least 4Minimum number of plants per treatment: One tray per replication (or similar amount of bare rooted transplants)

124 | Guidelines for Experimental Practice
Evaluation•Fresh matter (and dry matter) weight of shoot of the seedling.•Colour of the seedling leaves (e.g. using Chlorophyll Meter Minolta SPAD 502).•Establishment in the soil of the seedlings, by planting out seedlings and count the success within 1 and 2
weeks (biomass could easily be assessed).•Crop yield of different methods after transplanting and earliness of yield.
Figure 4.19 Tomato plants grown in peat-free growing media containg a high proportion of composted wood chips.
References and further informationDoolan, D.W., Leonardi, C., Baudoin, W.O., 1999.
Vegetable Seedling Production Manual. FAO Plant Production and Protection Paper 155.

Guidelines for Experimental Practice | 125
4.6 Herbs
Many different species of herbs can be grown in greenhouses. Out of them, parsley was chosen as a typical crop to grown in soil and basil as a typical potted herb. They can serve as ’model systems’ for other herbs.
4.6.1 Parsley
By Martin Koller and Justine Dewitte
Botanical name: Petroselinum crispum
General crop requirements Parsley is in the Apiaceae family and so is related to celery, carrots, fennel and dill. It is a biennial plant. The leavestolerateonlyminimalfreezingtemperaturesbuttherootishardy.Thefirstyearisthevegetativephaseand the second year starts the generative phase. As a herb crop it is grown for only one year.
Two types are grown: •Curly leaf (P. crispum crispum group). This can be divided in sub types, according to their leaves characteristicse.g.Curled(typeperlé),Finecurled,Paramount,double/triplecurled,frisévertfonce,“Mooskrause”. Unfortunately the names for different types are not used consistently.
•Italian,orflatleaf(P. crispum neapolitanum group/ P. crispum ssp. latifolium).
Plantscangrow30-60cmtall;theflatleafparsleygrowstallerthanthecurlyleafparsley.
Parsley prefers moist, deep and rich soil. It is sensitive to dry conditions but resistant to cold. There should be a breakofatleastfiveyearsbetweentwoparsleycropsintherotation.The leaves can either be cut mechanically or picked by hand – the sowing density is different in each case. Darkness is needed for germination so direct sowing has to be done at a depth of 2.5 to 3 cm. If transplanted three to four seeds are sown in each 4cm diameter pressed block. Parsley has a taproot, so the plants have to be planted at the right time because the roots do not have enough space to develop in the blocks.
The crop requires regular watering as it cannot withstand dry periods. A plastic mulch, preferably with preformed holes, can be used.
Figure 4.20 Parsley crop, plants being grown through a plastic mulch.
Experimental design Recommended replicates: at least 3.
126 | Guidelines for Experimental Practice
Table 4.57Typical parsley plant spacing and number of plants required for trials.
Direct sown (for cutting) Planted (for picking)
Minimum number of plants/ core plot 2800-3200 55-135
Minimumsizecoreplot(m²) 10 5
Plant (or block) density / m² 280-320 11-27multisownpeatblocks
Row distance (cm) 10-25 25-30
Distance between the rows (cm) 2-15 15-25
Table 4.58Typical parsley sowing and harvesting dates.
Region -Productiontype
Sowing at Planting at Start of Harvest
End of harvest
Remarks
North & central Winter crop
Mid Jul Sept Nov Apr/May UnheatedorFrost-freegreenhouseor polytunnel. In summer parsley isgrowninopenfieldonly.
Table 4.59Temperatures required for parsley germination and seedling growth.
Germination temperature °C Day/ Night
Days until germination
Temperature for seedlings in °C Day/ Night
Peatblocksize Time from sowing to planting (weeks)
20/ 18 °Ventilation from 22 -25
5 – 12 12-16/10Ventilation from 20 – 25
4 – 5 cm 4 – 8
Table 4.60Optimal temperature and critical temperature for parsley crop production
Day Night Ventilation from
Winter crop (optimal) 10 – 15°C 7-8°C 18°C
Winter crop (critical) 5-6°C* 5-6°C 18°C
Table.4.61Parsley plant nutrient requirements.
Yield expectation(kg/m2)
N (g/m²) P (g/m²) K (g/m²) Mg (g/m²)
2 10 1.4 8 1
3.5 17 2.5 14 1.5
Source: adapted from various sources, see Appendix B

Guidelines for Experimental Practice | 127
Disease and pest infestation, physiological disorders and other abiotic damageThe disease and pest incidence and severity should be scored several times during cropping (see also section 2.5). For the main problems the corresponding EPPO test guidelines are:•Septorialeafspotdisease-Septoria petroselini (PP 1/121 (2) of leaf spots on vegetables).•Downymildew-Plasmopara crustosa (PP 1/65 (3) Downy mildews of lettuce and other vegetables).•Powdery mildew (PP 1/57(3) Powdery mildew of cucurbits and other vegetables).•Aphids (PP 1/24(2) Aphids on potato, sugar beet, pea, broad bean and other vegetables). Yellow dwarf virus is
spread by aphids.
Otheremergingdiseasesandpests(suchasvirusdiseases,bacterialleafspots,sclerotina,aphids,carrotfly,parsley weevil) should be mentioned in the trial report or recorded individually if different infestations in the treatments occur.
Assessments during crop growth •Fordirectsowncrops-thenumberofdaysbetweensowingandgermination(thedatebywhichapproximately50%oftheplantshavegerminated).
•Crop establishment (1 = absent or very weak, 3 = low, 5 = moderate, 7 = strongly, 9 = very strong).•Standdensity-about4weeksafteremergence,theplantnumberina1mlengthofrowiscountedinatypical
area of the plot. •Colour (1 = pale green, 3 = light green, 5 = medium green, 7= dark green, 9 = very dark green)•Curliness of leaves (1 = absent or very weak, 3 = low, 5 = moderate, 7 = strongly, 9 = very strong)•Yellowing of lower (older) leaves (1 = absent or very weak, 3 = low, 5 = moderate, 7 = strongly, 9 = very
strong)•Canopy height – the crop height is measured at 5 locations per plot.•Missingplants-gapsofmorethan25cminlengthshallbemeasured.
Assessments at harvestHarvesting is done three times by hand or power mower (e.g. baby leaf harvester) approximately 5 cm above the soil. Each treatment is harvested when both yield and quality reach an optimum (e.g. begin for curly types whencanopyheightisgreaterthan20cm,beginforflatleaftypeswhenthecanopyisgreaterthan40cmorthelowerleavesareturningyellow).Thetotalharvestofthecoreplotshouldbeweighedandtheproportionofnon-marketable crop determined (rejecting, for example, yellowed, red and diseased leaves). The leaf / stem ratio is determined by sorting and weighing a sub sample of 1000g of the crop.
Parsley may be grown for processing as dry produce. To assess this samples of each plot should be dried gently at40-45°C(forabout18hrs.).Thefoliageisthenweighed.Insomeexperimentsitisdesirabletodeterminethequantityofessentialoilinthefoliage(%v/m).
Overall value scoreThis takes into account all criteria of the variety, based by on expert opinion as evaluated by researchers using information from farmers, wholesalers and consumers (1 = very low, 3 = low, 5 = medium, 7 = high, 9 = very high).
References and Further information.International Union for the Protection of New Varieties of Plants (UPOV). 2004.
Parsley TG/136/5 (Draft). www.upov.intR. M. Davis & R. N. Raid (Eds). 2002.
Compendium of Umbelliferous Crop Diseases. American Phytopathological Society APS, Minnesota, USA. ISBN:0-89054-287-2.

128 | Guidelines for Experimental Practice
4.6.2 Basil-growninpots
By Martin Koller and Robert Koch
Botanical name: Ocimum basilicum
Crop requirements Therearemanydifferenttypesavailable,butonlythebigleavedGenovesetypeisofsignificantcommercialinterest. Beside sweet basil other varieties are cultivated, like Thai basil (O. basilicum var. thyrsiflora), lemon basil (O. x citriodorum) and holy basil (Ocimum tenuiflorum). Most of the basil types are annual but some can be perennial, e.g. African blue basil (Ocimum kilimandscharicum × basilicum 'Dark Opal').
Basil has a high warmth and light requirement. The crop is sensitive to wet leaves and should therefore be irrigatedfrombelow(e.g.usinganebb-floodsystem).Ifexperimentsaretobeconductedinwinterinregionswithshortdaylengththenartificiallightningshouldbeconsidered(e.g.inGermanyanadditional7hlightingwith2000-3500lux).Differenttypesofbasil(likeredleaftypes,smallleaf)shouldbewateredseparately.Thiscan cause complications in a trial using both types.
The cultivation period depends on the temperature and light; it can vary from 4 weeks in the summer to 9 weeks in the winter (from sowing date to point of sale). Temperatures below 16°C should be avoided, because red-brownishorbrightyellowleafspotsmaydevelop.Basilisgrownindifferentpotsizesaccordingtomarketdemand.Smallerpotsizes(9to10cmdiameter)arechosenifitisintendedfortheconsumercutitonceortotransplantit.Biggerpotsizes(>12cmdiameter)areusedwhenitisintendedthattheconsumeriswillkeepitinthat pot for several weeks.
Experimental design Recommended replicates: at least 4 The core plots should be surrounded by ‘guard’ pots.
Figure 4.21 Basil grown in pots, on the greenhouse floor (left)or on benches (right).

Guidelines for Experimental Practice | 129
Table 4.61Typical number of basil plants for trials using two pot sizes.
Pots Ø 9 cm
Pots Ø 12 cm
Minimum number of plants/ core plot 15 15
Minimumsizecoreplot(m²) 0.5 0.6
Pot density / m² 30-35 25
Plants per pot 25-30 40-50
Table 4.63Temperature requirements for germination and growth of basil.
Germination temperature °C Day/ Night
Days until germination Optimal heating temperature for cultivation in °C Day/ Night
20 / 18°CVentilation from 22°C
5-8 18 / 16 °CVentilation from 22 – 25°C
Crop nutrition
Table 4.64Basil plant nutrient requirements.
Potsize N (mg/pot) P (mg/pot) K (mg/pot) Mg (mg/pot)
9 cm 320 50 200 50
12 cm 750 100 300 100
Thenutrientrequirementisdependentonthepotsizeandthenumberofplantsperplot.Ifgrowingmediawith20%compostisusedadditionalphosphorusandpotassiumfertilisationisusuallynotneeded.Ifnecessarygranulated organic fertiliser can be added. It should be noted that the nitrogen availability rate for organic fertilisersisestimatedtobeonlyabout60%(Navailable/Ntotal).Ifthegrowingperiodislongerthanfiveweeksitisbest to apply a supplementary feed of organic fertiliser (either in liquid or solid form).
Crop management Pruning of shoots is not common (with the exception of perennial types) but it will prolong the cultivation time. Basil is sensitive to excessive water application.
Disease and pest infestation, physiological disorders and other abiotic damageThis list includes links to relevant EPPO Guidelines:Colletotrichumleafspots-Colletotrichum gloeosporioides (PP 1/121(2) Leafspots of vegetables)Downymildew-Peronospora behlbarii(PP1/65(3)-Downymildewsoflettuceandothervegetables)
Sciaridflys(fungusgnat,Bradysia sp.) are common in basil crop: Natural enemies, like Steinernema feltiae or bio control agents (Bacillus thuringiensis israelensis) should be applied preventively (drench application). Hypoaspis miles may useful in perennial basil.
The occurrence of other diseases and pests, like Fusarium, Botrytis, Rhizoctoniaorpestslikeaphidsorwhitefliesshould be recorded in the report.

130 | Guidelines for Experimental Practice
Assessments during growth•Leaf colour (1 = very light green, 3 = light green, 5 = medium green, 7=dark green, 9 = very dark green).•Anthocyanin-inred-leafedvarieties(1=absentorveryweak,3=low,5=moderate,7=strongly,9=very
strong).•Leafsize-(1=verysmall,3=small,5=moderate,7=large,9=verylarge).•Leaf blistering (1 = absent or very weak, 3 = low, 5 = moderate, 7 = strongly, 9 = very strong).•Uniformity of crop (1 = very poor, 3 = low, 5 = moderate, 7 = strongly, 9 = very uniform).•Growth habit (1 = very erect, 3 = erect, 5 = moderate, 7 = compact, 9 = very compact).•Number of plants per pot (the number of plants should be counted in 5 pots of each treatment).
Assessments at harvestThe crop is usually harvested with a plant height of 12 to 15 cm (although this may vary depending on local requirements). Shoots are cut 0.5 cm above the growing media, from at least 10 pots. Plant height, fresh weight and dry weight should be measured. The leaves are very sensitive to pressure.
If intended for processing into a herbal drug then extra assessments may be carried out. According to the European Pharmacopoeia:•Leaves without stems will be dried at maximum of 30°C.•Contentofessentialoilinml/100g(%v/m).•Contentofestragol(in%ofessentialoil).
Overall value scoreThis takes into account all criteria for the cultivation and marketing of a variety, based on expert opinion as evaluated by researchers using information from farmers, wholesalers and consumers (1 = very low, 3 = low, 5 = medium, 7 = high, 9 = very high).
References and further informationInternational Union for the Protection of New Varieties of Plants (UPOV). 2004.
Basil TG/200/1. www.upov.int

Guidelines for Experimental Practice | 131
4.7 Perennial fruits
4.7.1 Strawberries
By Stella Cubison
Botanical name: Fragaria sp., Fragaria x ananassa
General crop requirementsStrawberriescanbegrownintheopenfieldinmostEuropeanclimates,buttheyarealsoincreasinglygrownunder protective structures. In most cases this will be a polytunnel. These are either permanent structures (they canlast3-10years)ortheyaredismantledaftereveryseasoninordertocomplywithplanningregulations,as they are unpopular structures in certain rural settings. In some cases strawberries may also be grown in greenhouses under glass, but this is not common. Strawberry production is highly intensive due to the high input of labour required. Whilst most EU countries are capable of producing their own spring and summer crops, Spain is the principal Mediterranean country supplying strawberries to other countries during the winter months, but Portugalisalsoarelativelylargeproducer.InSpain,over90%ofthisproductiontakesplaceintheSWcornerof the country (Huelva region), which has a Mediterranean climate and high light levels. Similarly, most of the production in Portugal is concentrated in the South of the country, which includes the Ribatejo, Oeste, Alentejo and Algarve regions. However, only a small percentage of this production is organic.
UnderUKconditions,June-bearing(short-day)ratherthanEver-bearingvarietiesaremoresuitedtotrialsworksincetherearemorecultivarsavailable,agreaterchoiceofplantingmaterialandaquickturn-aroundispossiblefromplantingtoharvest.Harvestisalsocondensedintoashorterperiodoftime(2-4weeks).Floweringandharvest are also relatively unaffected by high temperatures. Such cultivars are equally suited to trials in other European and Mediterranean countries, and are often grown on an annual basis commercially during the winter months in countries with warm Mediterranean climates (such as Spain).
Site and soilStrawberriesrequireamediumsand-orsilt-loamsoilwithhighhumuscontentforoptimumperformance,butcanbegrownsuccessfullyonarangeofsoiltypes,providedtheyarenotpoorly-drainedandcompacted.AsoilpHof6.0-6.5isideal.Strawberriesrequirehighlevelsofpotassium.Lowlevelsofphosphateandnitrogencanbe tolerated, except during establishment. An application of bulky organic manure applied in early spring before planting should provide most nutrients required. Even under protected production, the most favourable site is on agentlesouth-facingslopewhichisshelteredfromstrongwindsandawayfromfrostpockets.
Experimental designIt is best to use a trial with at least 3 replications. CPVO protocols recommend using at least two trials which will give satisfactory crops of fruit.
Strawberries grown under protection (in tunnels) commercially are usually grown on raised beds. Two rows per raisedbedisbestpracticeinorganicsystems,thoughhigherdensities(three-row-beds)areusedinconventionalproduction, using staggered planting. It is generally uneconomical to use raised beds for single rows. In intensive conventional systems, plants are also frequently grown in substrate in ‘table top’ systems where plants are growningrow-bagsonstructurespositionedataconvenientheightforpicking.Plantingdensitytendstobehigher in such systems (10 plants / m2).Astandard-sizedpolytunnelbayofabout8metreswillspanfiveraisedbeds.Plantscanalsobegrownassinglerowsonflatbeds,butwhilstthisisfineforoutdoorproductionitisobviouslylesseconomicalforprotectedcropping.
132 | Guidelines for Experimental Practice
Figure 4.23 Raspberry fruit (left) and commercial production in polytunnels in Scotland (right).
Table 4.65Typical strawberry plant spacing and number of plants required for trials.
North & Central / MediterraneanUnheated
Minimum number of plants / core plot 20
Minimumsizeofcoreplot(m²) 4
Plant density (plants/m²) 4-5
Row distance (cm) Singlerows:50-75cmDoublerows:30-35cm*Triplerows:20-25cm*
Distance within the row (cm) 25-35cm
*Usually grown on raised beds
Table 4.66Typical strawberry planting and harvesting dates.
Region-Production type
Planting material Planting at Start of Harvest (Harvest lasts2-4weeks)
North & CentralUnheated
Fresh dug runnersCold-storedrunners
February – April*February-April
May-June(year2)May-June('60day')
Long cycle (unheated) Fresh dug runnersCold-storedrunners
August – NovemberJune-July*
May-JuneApril-June
Mediterranean -Springcycle
Tray (fresh green) plants orfresh-dugrunners January April-May
Mediterranean -Autumncycle
Tray (fresh green) plants orfresh-dugrunners September-December December-April
*Removeblossomsafterplantinginfirstyear
June-bearing(short-day)varietiesofstrawberryarelessaffectedbyextremesoftemperaturethanever-bearingvarieties, but tunnels and glasshouses should still be vented once temperatures exceed 26° C during the day. The optimumtemperaturerangeisbetween15-25° Cduringflowering,foroptimumpollinationandbetween21-26°
C for growth. Vents and covers should be rolled back to allow access by pollinating insects during warm weather atflowering.Iftherearenonaturally-occurringpollinatinginsectsaround,itisadvisabletouseanartificialhive(onehiveshouldbesufficientfora1.5haarea).

Guidelines for Experimental Practice | 133
Fertilisation Dependingonsoilanalysis,strawberrieswillbenefitfromahighnitrogenfertiliserduringestablishment(thiscan be applied through the irrigation system), switching to a high potassium feed thereafter, dependant on the needs of the crop. Little additional feed may be necessary during the growing season following manure applied to the soil before planting, but if the plants are to remain (and crop) in place for more than a year, supplementary feeding will be required the following year(s) in the form of permitted organic fertilisers or foliar feed.
Table.4.67Strawberry plant nutrient requirements.
Yield expectation(kg/m2)
N (g/m²) P (g/m²) K (g/m²) Mg (g/m²)
1.8 6 2 10 1
4 14 4.5 22 2
Source: adapted from various sources, see Annex B. Leaf nutrient content is given in Appendix C.
IrrigationIt is usual practice to use a trickle irrigation system beneath plastic mulch, along the crop rows. Overhead irrigation may be used during plant establishment, but after this trickle irrigation is preferred in order to avoid botrytis (grey mould) infection. Plants should be kept irrigated in hot weather and also after fruiting, if the plants are to be allowed to remain in the ground to fruit the following year.
HarvestStraw (preferably organic or untreated) is used to keep the rows clean and to keep fruit away from contact with the soil. Straw is laid just prior to fruit ripening. Once ripe, the berries will need picking over regularly (daily in hotweather)andthefruitcooledasquicklyaspossibleafterharvesttoremovefieldheat.Fruitisbestpickedearly in the morning. After harvest, the foliage above the crowns of the plant should be mown off (2.5 cm above the crown) to reduce the incidence of disease and to encourage the plants to produce fresh leaves and to build reserves for the following year's crop. Runners should also be removed. If the plants are at the end of their cropping life, they can be removed or incorporated deep into the soil, to prevent regrowth.
Diseases and pests•Powdery mildew (Sphaerotheca macularis).•Grey mould (Botrytis cinerea). •Post-harvestrots(e.g. Mucor spp., Cladosporium spp., Rhizopus spp.,).•Verticillium wilt (Verticillium dahliae).• Phytophthora spp: red core (Phytophthora fragariae var. fragariae) & crown and leather rot (Phytophthora
cactorum).
•Spider mites (Tetranychus urticae, Phytonemus pallidus fragariae).•Slugs / Snails.•Aphids spp. (e.g. Chaetosiphon fragaefolii, Myzus ascalonicus, Macrosiphum euphorbiae, Aphis gossypii).•Blossom weevil (Anthonomus rubi).•Spotted wing drosophila (Drosophila suzukii).•European Tarnished plant bug (Lygus rugulipennis). •Common Green Capsid (Lygocoris pabulinus).•Vine weevil (Otiorhynchus sulcatus).•Westernflowerthrip(Frankliniella occidentalis).•Nematodes spp. (Longidorus, Xiphenema, Ditylenchus, Aphelenchoides).
A comprehensive database of strawberry pests and diseases is available from www.eppo.int (European & MediterraneanPlantProtectionOrganization).UK-specificinformationonstrawberrypestsanddiseasesisalsoavailable in the ‘Strawberry Crop Walker’s Guide’ (available from the HDC).

134 | Guidelines for Experimental Practice
Assessments during crop growthPlantgrowthassessmentscouldbecarriedoutsoonafterplanting,duringfloweringandjustbeforeoratharvestby measuring the plant diameter (two ways across each plant). Other parameters to be recorded may include:•Plant height, vigour and growth habit, health and number of leaves (foliage density).•Runner (stolon) production.•Inflorescence(numberofflowers).•Leafmineralanalysis(andpossiblysoilanalysis)mightbedesirableatfloweringand/orharvest.•Visual estimation of Verticillium wilt and Powdery mildew can be carried out by counting the number of plants
showing disease symptoms. Other pests and diseases are likely to be more localised and could just be noted if seen, unless a full assessment of pest / disease infestation and effect on quality and yield is desirable.
Assessments at harvestEvaluatingtheyieldofastrawberryharvestrequiresmuchmanuallabour.Plantsneedtobehand-pickedevery2-3days(minimum)forapproximatelyfourweeks,untilharvestceases.ItisgenerallyeasiertorecordtheyieldofClass1&2fruitsfromeachplot,takingsub-samplesfromasmallernumberofplantstoexaminefruitquality in more detail (e.g. fruit number, weight and reasons for pest/disease damage). At each picking, it is easier to remove everything other than unripe fruit. Rotten/diseased/damaged fruit must be removed to avoid contaminatingripeningberries.Scalesandpunnetswillneedtobeon-siteduringharvest.Fruitsize,shape,colour,firmnessandsugars/solublesolids(oBrix) can be recorded for a detailed variety trial, otherwise this is often done by eye by the farm's pickers, who pick and grade simultaneously. Further information on what to assess can be found in the CPVO protocols for the evaluation of strawberry crops; (www.cpvo.europa.eu).
References and further informationhttp://www.eppo.int(European&MediterraneanPlantProtectionOrganization–EPPO)http://cpvo.europa.eu(CommunityPlantVarietyOffice–CPVO)Alford, D.V. 1999,
‘A Colour Atlas of Fruit Pests’ (Manson Publishing Ltd). ISBN 0723408165HDC / AHDB (2013):
Crop Walkers’ Guide – ‘Strawberry,’ available from www.hdr.org.uk.BerryYearbook&BuyersGuide-PublishedannuallyinUKbyACTPublishing(www.actpub.co.uk)International Union for the Protection of New Varieties of Plants (UPOV). 2004.
Strawberry TG/22/10. www.upov.int

Guidelines for Experimental Practice | 135
4.7.2 Raspberries
By Carolyn Mitchell
Botanical name: Rubus idaeus
General crop requirementsOrganicraspberriesaretypicallygrownunderpolytunnelsintheUKandEurope.Openfieldproductionisalsopossible(withoutcovers)forsmall-scalegrowerssupplyinglocalmarketsandpick-your-ownenterprises,although use of temporary tunnels ensures better fruit quality and season extension. As with strawberry production,SpainandPortugalarethelargestproducersofconventionally-grownraspberriesinaMediterraneanclimate.Muchofthisfruitisexportedtosupply‘off-season’fruittoNorthandCentralEuropeancountriesbetweenautumnandspringfromannualcroppingusinglong-caneplantingmaterial,butthispractiseisnotcarried out to any great extent for organic crops.
Production costs of raspberries are high since they are labour intensive in terms of harvesting and general husbandry and a trellis system is required to support the plants. Floricanes and primocanes are both suited to trialworkbuttheyshouldbeassessedindependently.Floricane(Summer-fruiting)varietiesproducevegetativecanesintheirfirstyearofgrowth,beforefloweringandfruitingontwo-year-oldcanes.Thefruitedcanesarethencutdownafterharvest,leavingthenewcanestobetiedintothesupportingwires.Primocane(Autumn-fruiting)varietiesproducenewcaneswhichflowerandfruitwithinthesameyear.Theycropinlatesummer–autumn,butthecanescanalsobeprunedtoencourageasecondflushofearlyfruitthefollowingspring–atechnique known as ‘double cropping’ (although this is rarely carried out in organic production). If not ‘double cropped’ the cane is cut down during late winter – early spring following cropping. This helps to stimulate theproductionofnewcanesalmostimmediately.Theseguidelineshavebeenwrittenprimarilyforfloricaneproduction. Harvest time is very dependent on variety chosen and this should be taken into consideration. The plantsmustbesourcedfromknownhealthystockse.g.certifiedstock.
Site and soilRaspberriesrequireasandyloamsoilwithgooddrainage.AsoilpHof5.6-6.2isrequired.RaspberriesrequireN3:P2:K9 during establishment with additional potassium during fruiting. It is preferred that the ground has notpreviouslybeenusedforraspberryproductiontoreducethepossibilityofsoil-bornepathogens.Themostfavourablesiteisagentlesouth-facingslopewhichisshelteredfromthewind.Inconventionalproductionthereisamovetowardsusingcoir-basedsubstrateintheUKandEuropetoreducetheinfectionbysoilbornepathogens,especiallyPhytophthorarootrot,butorganicgrowersarenotpermittedtousethissoil-lessgrowingmethod.
Experimental design
Table 4.69Typical raspberry plant spacing and number of plants required for trials.
North & Central Unheated
Minimum number of plants per trial plot 5-10
Number of replicates 4
Cane density (plants/m²) 6-8
Distance between plants (cm) 60
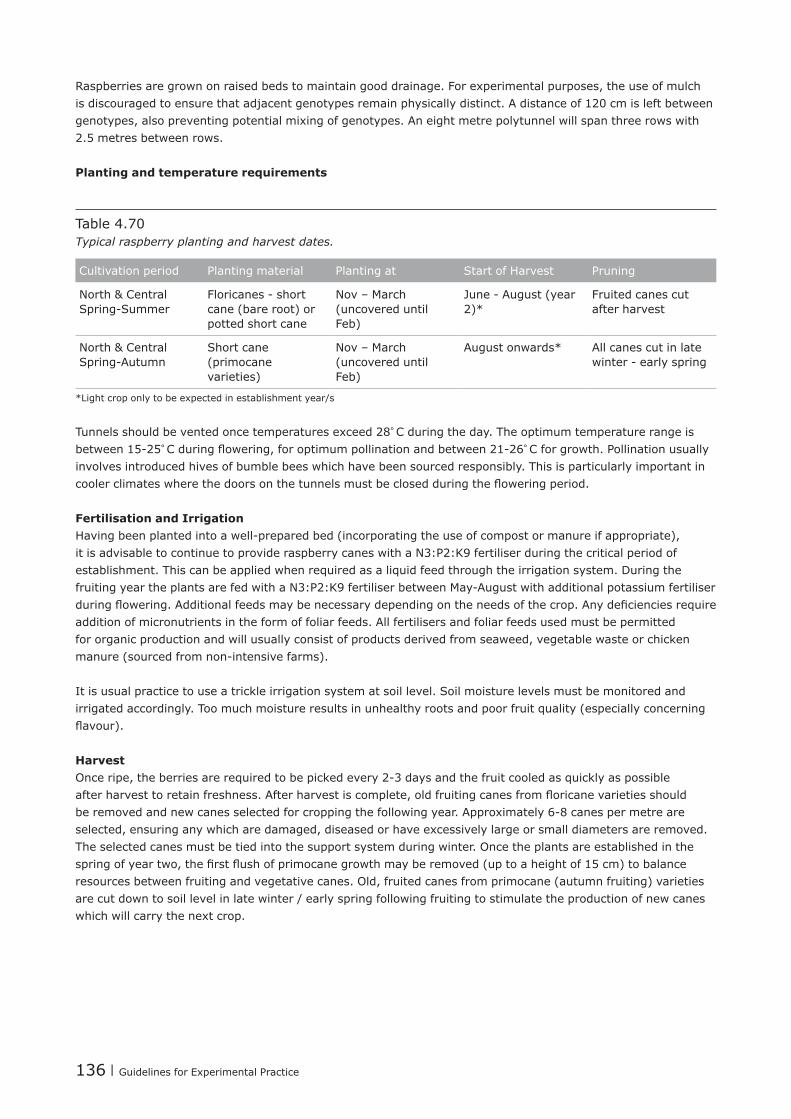
136 | Guidelines for Experimental Practice
Raspberries are grown on raised beds to maintain good drainage. For experimental purposes, the use of mulch is discouraged to ensure that adjacent genotypes remain physically distinct. A distance of 120 cm is left between genotypes, also preventing potential mixing of genotypes. An eight metre polytunnel will span three rows with 2.5 metres between rows.
Planting and temperature requirements
Table 4.70Typical raspberry planting and harvest dates.
Cultivation period Planting material Planting at Start of Harvest Pruning
North & CentralSpring-Summer
Floricanes-shortcane (bare root) or potted short cane
Nov – March (uncovered until Feb)
June-August(year2)*
Fruited canes cut after harvest
North & CentralSpring-Autumn
Short cane (primocane varieties)
Nov – March (uncovered until Feb)
August onwards* All canes cut in late winter-earlyspring
*Light crop only to be expected in establishment year/s
Tunnels should be vented once temperatures exceed 28° C during the day. The optimum temperature range is between15-25° Cduringflowering,foroptimumpollinationandbetween21-26° C for growth. Pollination usually involves introduced hives of bumble bees which have been sourced responsibly. This is particularly important in coolerclimateswherethedoorsonthetunnelsmustbeclosedduringthefloweringperiod.
Fertilisation and IrrigationHavingbeenplantedintoawell-preparedbed(incorporatingtheuseofcompostormanureifappropriate),it is advisable to continue to provide raspberry canes with a N3:P2:K9 fertiliser during the critical period of establishment. This can be applied when required as a liquid feed through the irrigation system. During the fruitingyeartheplantsarefedwithaN3:P2:K9fertiliserbetweenMay-Augustwithadditionalpotassiumfertiliserduringflowering.Additionalfeedsmaybenecessarydependingontheneedsofthecrop.Anydeficienciesrequireaddition of micronutrients in the form of foliar feeds. All fertilisers and foliar feeds used must be permitted for organic production and will usually consist of products derived from seaweed, vegetable waste or chicken manure(sourcedfromnon-intensivefarms).
It is usual practice to use a trickle irrigation system at soil level. Soil moisture levels must be monitored and irrigated accordingly. Too much moisture results in unhealthy roots and poor fruit quality (especially concerning flavour).
HarvestOnceripe,theberriesarerequiredtobepickedevery2-3daysandthefruitcooledasquicklyaspossibleafterharvesttoretainfreshness.Afterharvestiscomplete,oldfruitingcanesfromfloricanevarietiesshouldberemovedandnewcanesselectedforcroppingthefollowingyear.Approximately6-8canespermetreareselected, ensuring any which are damaged, diseased or have excessively large or small diameters are removed. The selected canes must be tied into the support system during winter. Once the plants are established in the springofyeartwo,thefirstflushofprimocanegrowthmayberemoved(uptoaheightof15cm)tobalanceresources between fruiting and vegetative canes. Old, fruited canes from primocane (autumn fruiting) varieties are cut down to soil level in late winter / early spring following fruiting to stimulate the production of new canes which will carry the next crop.

Guidelines for Experimental Practice | 137
Diseases and pests•Powderymildew-Sphaerotheca macularis•Canebotrytis-Botrytis cinerea•Spurblight-Didymella applanata•Caneblight-Leptosphaeria coniothyrium•Raspberryrootrot-Phytophthora rubi•Verticilliumwilt-Verticillium spp.•Raspberryyellowrust-Phragmidium rubi-idaei •Crowngall-Agrobacterium spp.•Post-harvestrotse.g.Cladosporium spp., Mucor spp., Rhizopus spp., Botrytis spp.
•Aphidspecies-Amphorophora idaei, Aphis idaei, Macrosiphum euphorbiae•Blackvineweevil-Otiorhynchus sulcatus•Spottedwingdrosophila-Drosophila suzukii•Raspberryleafandbudmite-Phyllocoptes gracilis•Twospottedspidermite-Tetranychus urticae•Raspberrybeetle-Byturus tomentosus•Earwigs-Forficula auricularia•Canemidge-Resseliela theobaldi
Assessments during crop growthThe following plant growth assessments can be carried out throughout the year.•Planthabit-vigour,primocanenumberandheight•Presentation of fruit – lateral length and strength•Cane spine density or absence•Cane splitting•Cropdevelopment–dateofbudbreakandfirstflower•Visual estimation of any serious pest or disease incidence
Assessments at harvestPlantsneedtobehand-pickedevery2-3daysforthedurationoffruitproduction.Assessmentsaremadeonceaweekonfruitsize(weight),totalyieldand oBrix level (soluble solids). An arbitrary score is used to record firmness,flavourandcolour.Shelflifecanbeassessedthroughtheseasonbypickingasmallsamplewhichisstoredat4°Candassessedforpost-harvestappearance,firmnessandrotafter4-7days.
References and further informationInternational Union for the Protection of New Varieties of Plants (UPOV). 2004.
Raspberry TG/43/7. www.upov.int

138 | Guidelines for Experimental Practice
4.7.3 Table grapes
By Samih Abu Baker
European grapes: Vitis vinifera American grapes: Vitis labrusca
General crop requirements Grapescangrowandsurviveinareaswherethetemperaturegoeswellbelowfreezinginthewinter;somegrapespeciescansurvivetemperaturesaslowas-40°C.However,Vitis vinifera is much more tender and cannot withstandtemperaturesbelow-15°C.Thethresholdof10°Cisusedforgrapevinestocalculategrowingdegreeday (GDD) because there is little biological activity in plants below this temperature. Grapes prefer a sunny site withwell-drainedsoil.Claysoilsshouldbeamendedwithorganicmatter(compostormanure).
Experimental design Forfieldexperiments,arandomizedcompleteblockdesignisusedwithaminimumnumberofblockswithapredeterminednumberofvinesforeachblock.Potexperimentsarealsoutilizedforsalinityresearch.
Planting and cultural practicesCommon ways to plant vines are with a mechanical furrow planter, an auger, or by hand with a spade. The use of tree planters is not recommended as correct positioning of the roots is not possible; roots should not be bent upwards in the hole or furrow as this discourages growth and can result in root diseases, such as blackfoot (Cylindrocarpon and Campylocarpon spp.),becomingestablished.Afterplanting,andafternewgrowthfirstappears, prune the plant back to two buds on each stem. Grapes need some type of support such as a fence, arbour,trellis,orhorizontalwiresbetweenpostssetbetween2and2.7mapart.Forthefirstyear,alargedepressionshouldbeleftaroundtheplanttoallowforamplewatering.Mulchwithbarkorcompostforthefirsttwo years or until the plant is well established.
Training, trellising and pruningTrellisingistheartofarrangingthevineinadesignatedspace.Thegoalsaretomaximizelightinterception,tominimizethenumberofadditionalinputs(e.g.labour,materialcosts,maintenance,etc.),toprovidephysicalsupport and to be compatible with the management situation, which includes machinery. Types of support system and factors to consider include:•Self-orstake-supportedsystems.•Single wire system.•Hedge-typesystem.•Systems which divide the canopies (Geneva Double Curtain “GDC”, Lyre System, Vertical Shoot Positioning “VSP”,Scott-Henry,Smart-Dyson).Oftenthesewillseparatevegetativeandfruitingareas.
•Other trellising systems (pergola and parronal). •Vineyardfloormanagement.•Frost management.•Canopy management.
Thegoalforcanopymanagementistooptimizelightinterceptionbybothleavesandfruit.Itcanbeachievedby:•Shoot thinning.•Shoot positioning.•Shoot topping and hedging.•Leaf removal.
The principal method of pruning is cane and spur (also known as cordon pruning). The aims of pruning are to:•Establish / maintain the vine in the desired form.•Produce fruit of the target composition.•Select nodes that will produce fruitful shoots.•Regulate shoot number/crop load.•Regulate vegetative growth.

Guidelines for Experimental Practice | 139
Themostsignificantfacttorememberisthatallfruitwilldeveloponshootsthatcomefrombudsonthepreviousyear’s growth. The bark of last year’s growth is smooth. All previous, and now unproductive wood, has rough bark. Each year in spring, prune last year’s growth back to leave only two, three, or four buds. These buds will produce long shoots and bear fruit. Once fruit is set, canes producing clusters of grapes need to be pruned back to allow only two leaves beyond the last cluster of grapes. This helps direct the vine’s energy into producing grapes rather than growing more leaves.
PollinationPollinationismostlybywind,thoughinsectsmayalsocontribute.Self-pollinationisthenorm,thoughsomestudieshavesuggestedthatcross-pollinationresultsinbiggerfruitandhigherseedcounts.
IrrigationInsomeareas,naturalrainfallissufficientforcommercialproductionofgrapesandevenfortheestablishmentof young vines. In other areas application of supplementary water is necessary. Water may be applied by hand, byfloodirrigationorsometypeoftubulardripirrigationwatersystem.Overheadsprinklerirrigationisnotrecommended for grape production due to the adverse effect it has on disease incidence. Irrigation with a lateral tubewithbuilt-inemittersisalsoutilized.
WeedingWeeds can be prevented from growing, or be destroyed at a critical growth stage, usually by cultural or mechanical methods.
Disease and pest problems, physiological disorders and other abiotic damage
Fungal diseases:• Botrytisbunchrotorgreymould-Botrytis cinerea. •Powderymildew-Erysiphe necator.•Downymildew-Plasmopara viticola. •Caneandleafspot-Phomopsis viticola. •Eutypadieback-Eutypa lata.•Blackrot-Guignardia bidwellii.•Anthracnose-Elsinoe ampelina.•Blackfootdisease-Cylindrocarpon & Campylocarpon spp.
Bacterial diseases: •Pierce’sdisease- Xylella fastidiosa.•Crowngall-Agrobacterium tumefaciens.
Viral diseases:•Grapevinefanleafvirus“GFLV”-genusNepovirus. •Grapevineleafrollvirus-genusClosterovirus.
Insects:•Phylloxera-Phylloxera vitifoliae.•Leafhoppers-Empoasca spp.•Grapevinemoth-Lobesia botrana.•Mealybugs-Planococcus spp.•Grapeberrymoth-Paralobesia viteana.•Thrips-variousspeciesincludingDrepanothrips and Frankliniella spp.•Vineleafbeetle-Bromius obscurus.•Mites-variousspeciesincludingPanonychus and Tetranychus spp.
140 | Guidelines for Experimental Practice
Other pests: •Nematodes (various species including Meloidogyne and Xiphinema).•Vine-grazingpests(deer,rabbitsetc.).•Berry-eatingpests(e.g.rodentsetc.).
Disorders: •Nutritionaldisorders(e.g.mineraldeficiencies).•Environmentaldisorders(drought,excesswater,heat,winterinjury,springfreeze.•hail, salt and air pollution).
For a detailed description of diseases and pests on vines see the European and Mediterranean Plant Protection Organization website: http://www.eppo.int.
Assessments at harvestThe timing of harvest has perhaps the greatest impact on grape composition. Therefore, knowing what the grapes are going to be used for is vital in determining when and how to harvest. The harvesting method is also of importance to product quality. In some cases, hand harvesting is required and machine harvesting is not acceptable.
Conventionalcropestimationdependsuponareasonablyaccurateprojectedbunchsize.Theaverageweightperbunch for a given cultivar harvested from a particular vineyard is crucial to good crop estimation. The more years for which data have been acquired (a sort of “track record”), the better the accuracy of crop estimation.
Information required:Numberofbunchespervine.Selectarandomsampleofvines(equivalentto5%ofthevineyardisrecommended), count the number of bunches for each vine and determine the average number of bunches per vine (sample at least 20 vines).Number of bearing vines per hectare (e.g. 1090 vines/ha at 2.4m x 3.6m spacing or 1300 vines/ha at 2.4 x 3m spacing).The average cluster weight for that cultivar from that vineyard (in kg).
The simple formula is:Yield = Clusters per vine x vines hectare x weight per cluster
Theharvestedcropissortedquantitativelyaccordingtorecognisedqualitystandardsintomarketableandnon-marketablefractions.Thenon-marketablecropiscategorisedaccordingtothemainreasonsforitsrejection(weight,berrysize,rot,etc.).
Further parameters to measure might include: •Quality of the grapes (e.g. °Brix using a refractometer).•Thesizeandtheformoftheberries.•The amount of seeds in berries.•Colour of berries.
Overall value scoreThis takes into account all criteria for the cultivation and marketing based on expert opinion as evaluated by researchers using information from farmers, wholesalers and consumers (1 = very low , 3 = low, 5 = medium, 7 = high , 9 = very high).
References and further informationGlen L. Creasy and Leory L. Creasy. Grapes. 2009.
CABI International. University of Nebraska – Lincoln,
Department of Agronomy and Horticulture website (www.agronomy.unl.edu) – details of the Viticulture Programme can be found under the Horticulture/Crops section.

Guidelines for Experimental Practice | 141
4.7.4 Papaya
By Virginia Pinillos
Botanical name: Carica papaya Common names: papaya, pawpaw
General crop requirements Papayaisasemi-woody,latex-producing,usuallysingle-stemmedandshort-livedperennialherb.Theplantcanliveupto20yearsbutitisnormallycultivatedin24-36monthscycles.Majorcommercialproductionofpapayaisfound primarily between 23°N and S latitudes, but it is also grown, especially in greenhouses, in higher latitudes (up to 32°). The papaya plant is a tropical species very sensitive to frost with high thermal requirements to grow,developandripenfruits.Normalgrowinganddevelopmentoccursbetween21-33°C(22-28°Coptimum).Greenhouseswouldnormallybeheatedto25-30°C(day)and11-16°C(night).
Low temperatures (<17°C) favour carpellody (a plant disorder that results in misshapen fruits caused by abnormaldevelopmentoftheovule-bearingpartoftheflower)andadecreaseinfruitsizeandsweetness;hightemperatures(>35°C)favourfemalesterility.Highrelativehumidityisrequired(>65%).Papayagrowsbestinwell-drained,aeratedsoilsrichinorganicmatter.Itiseasilykilledbyanexcessofsoilmoisture.TheoptimumpHranges between 5.5 and 7. Papaya is moderately sensitive to salinity in the soil or the irrigation water (2 dS/m).
Figure 4.24 Papaya fruit (left) and commercial production in polytunnels in Spain (right).
Experimental design Recommended replicates: at least three.
142 | Guidelines for Experimental Practice
Table 4.71Typical papaya plant spacing and number of plants required for trials.
Mediterranean Unheated
Minimum number of plants/ core plot 5
Minimumsizeofcoreplot(m²) 15
Plant density / m² 0.17-0.22
Row distance (m) 2-3
Distance within the row (m) 1.5-2
Sowing and planting Papaya is propagated mostly through seeds although vegetative propagation methods may beused (cutting, grafting or micropropagation).
Planting may be done at different times of year depending on local conditions and growers preferences. First fruit maturationmayoccur7-10monthsafterplanting.Insubtropicalclimatesthefruitsetdeclinesduringthecolderwinter months.
Table 4.72Typical papaya sowing and harvesting times.
Region -Productiontype
Sowing at Planting at Start of harvest End of harvest
Mediterranean Greenhouses (and Canary Islands)
April-May(yearI) June-July(yearI) March-April(year II)
November(year III)
September(year I)
November(year I)
November(year II)
November(year III)
Jan-Feb(year I)
March-April(yearI) Nov-Dec(year I)
November (year III)
Table 4.73Temperature required for production of papaya seedling and plants.
Germination temperature °C
Days until germination
Temperature for seedlings in °C (day / night)
Pots Weeks until planting
25-30* 7-21 25-30/11-16
10 cm diameter pot with growing media
4-8
*Seedgerminationisimprovedbytheremovalofthesarcotesta(thefleshyseedcoat)orgibberellicacidapplication.
Table 4.74Papaya plant nutrient requirement.
N P K
180 g plant / year 35 g plant / year 224 g plant / year
ItisparticularlyimportantthatsufficientKisavailableduringfruitdevelopment
Guidelines for Experimental Practice | 143
Crop management Papaya plants can be hermaphrodite, monoecious or dioecious; a change of sex may even occur depending on temperature.Forcultivationhermaphroditeplants(self-pollinated)arepreferred.Becausethesexoftheplantisnotknownuntilflowering,additionalplantsneedtobeplantedineachplantinghole(3-4plantsifgrowinghermaphroditeplantsisintended).Later,afterthefirstflowering,undesiredfemaleplantsarethinnedandonlyone hermaphrodite plant is kept.
Papaya plants are not pruned because their main growing point is terminal, and branched trees do not produce as well. Leaf removal is recommended to increase ventilation. Fruit thinning to avoid overcrowding may be neededtoimprovefruitquality.Also,abnormalflowersandmisshapenfruitsmusttoberemovedassoonaspossible.
Dripandmicro-sprinklersarerecommendedforirrigatingpapaya(5-12lperplantperday).Overheadsprinklersmay be useful to increase relative humidity.
Disease and pest problems and physiological disorders Diseases:•Oidium-Oidium caricae. •Root/shootrot-Phytophthora palmivora. •Anthracnose-Colletotrichum gloeosporioides. •PRSV (Papaya Ring Spot Virus).
Pests:•Whitefly-Trialeurodes vaporariorum. •Broadmite-Polyphagotarsonemus latus. •Redmite-Tetranychus spp.•Mealybug-Pseudococcus grasii.•Bananamoth-Opogona sacchari. •Nematodes-Meloidogyne spp. (causes root nodules).
Physiological disorders:•Skinfreckle-thecauseisunknownbutrelatedtolowtemperatures,highdailythermaloscillation,andhigh
relative humidity.
Assessments during growthThese can include:•Plant height.•Leaf production rate.•Stem diameter.•Time and height of initial bearing.•Numberofflowersandfruitspernode.•Incidence of carpellody and sterility.•Resistance to papaya spot virus.
Assessments at harvest Papaya is a climacteric fruit. Fruit must be harvested after the colour begins to change but before it becomes fullyyellow.Fruitmustreachatleast11.5°Brix(itdoesnotincreaseinsweetnessafterharvest).Thesizedepends on the variety.
Theharvestisdividedaccordingtorecognisedqualitystandardsformarketableandnon-marketableproduce.Thenon-marketablecropissortedbythemainreasonsforrejection(e.g.diseasedfruits,insect-damagedfruits,fruits with skin bruises, latex burn and mechanical injuries, shrivelled and discoloured fruits). The yield can be expressed as number of fruits/plant, kg fruits/plant or kg/ha.

144 | Guidelines for Experimental Practice
Specificaspectsofcropqualitycanbeevaluatedquantitativelyorusinga1-9scale:•Length, diameter and weight of the fruit.•Soluble solids content (°Brix).•Colour of the skin.•Freedom of defects (sunburn, skin abrasions, pitting, blotchy coloration).•Freedom of decay.•Colourofflesh.•Fleshandskinfirmness.
Overall valueThe overall takes into account all criteria for the cultivation and marketing of a variety, based on expert opinion as evaluated by researchers using information from farmers, wholesalers and consumers (1= very low, 3 = low, 5 = medium, 7 = high, 9 = very high).
References and further informationJiménez,V.M.,Mora-NewcomerE.,Gutierrez-Soto,M.V.2014.
Biology of the Papaya Plant. In: Genetics and Genomics of the Papaya, Plant Genetics and Genomics: Cropsandmodels,R.MingandP.H.Moore(eds.).DOI10.1007/978-1-4614-8087-7_2,©SpringerScience+Business Media New York.
Marin, S.L.D., Gomes, J.A., Salgado, J.S., Martins, D.S., Fullin, E.A. 1995. Recomendações para a cultura do mamoeiro dos grupos Solo e Formosa no Estado do Espírito Santo. 4.ed. Vitória: EMCAPA, 57p.
Morton, J. 1987. Papaya. https://www.hort.purdue.edu/.../morton/papaya_ars. html
International Union for the Protection of New Varieties of Plants (UPOV). 2004. Papaya TG/264/1. www.upov.int
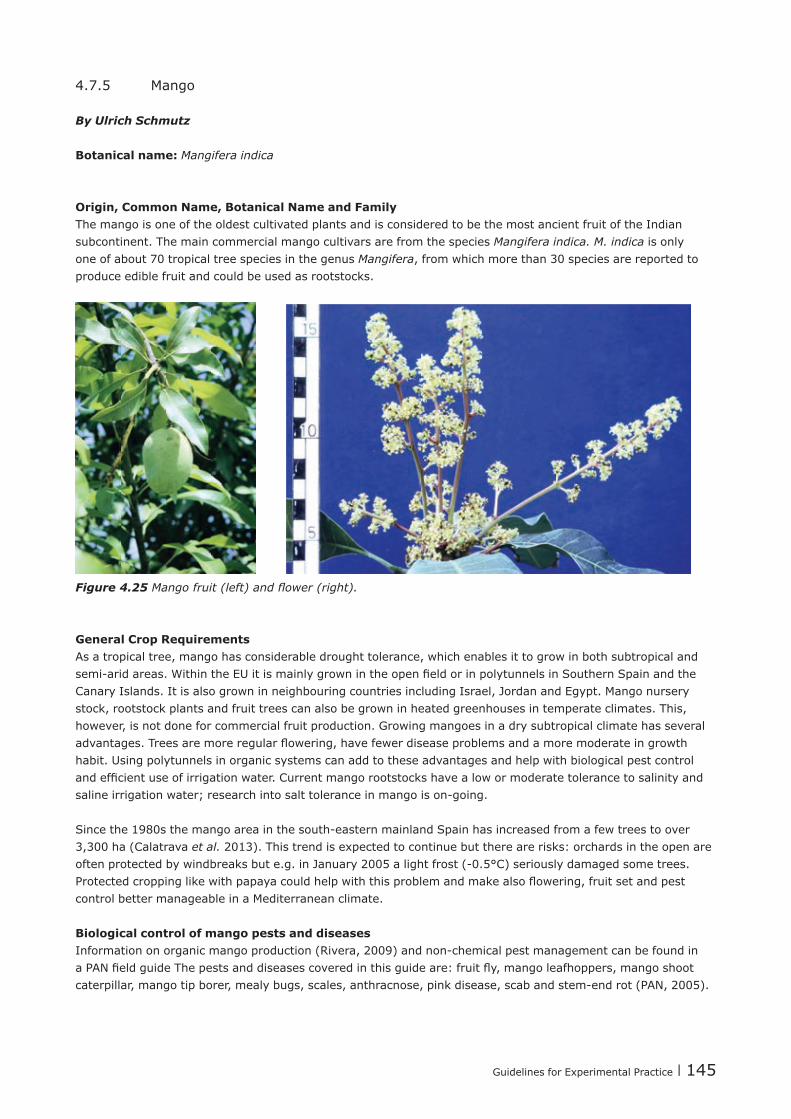
Guidelines for Experimental Practice | 145
4.7.5 Mango
By Ulrich Schmutz
Botanical name: Mangifera indica
Origin, Common Name, Botanical Name and FamilyThe mango is one of the oldest cultivated plants and is considered to be the most ancient fruit of the Indian subcontinent. The main commercial mango cultivars are from the species Mangifera indica. M. indica is only one of about 70 tropical tree species in the genus Mangifera, from which more than 30 species are reported to produce edible fruit and could be used as rootstocks.
Figure 4.25 Mango fruit (left) and fl ower (right).
General Crop RequirementsAs a tropical tree, mango has considerable drought tolerance, which enables it to grow in both subtropical and semi-aridareas.WithintheEUitismainlygrownintheopenfieldorinpolytunnelsinSouthernSpainandtheCanary Islands. It is also grown in neighbouring countries including Israel, Jordan and Egypt. Mango nursery stock, rootstock plants and fruit trees can also be grown in heated greenhouses in temperate climates. This, however, is not done for commercial fruit production. Growing mangoes in a dry subtropical climate has several advantages.Treesaremoreregularflowering,havefewerdiseaseproblemsandamoremoderateingrowthhabit. Using polytunnels in organic systems can add to these advantages and help with biological pest control andefficientuseofirrigationwater.Currentmangorootstockshavealowormoderatetolerancetosalinityandsalineirrigationwater;researchintosalttoleranceinmangoison-going.
Sincethe1980sthemangoareainthesouth-easternmainlandSpainhasincreasedfromafewtreestoover3,300 ha (Calatrava et al. 2013). This trend is expected to continue but there are risks: orchards in the open are oftenprotectedbywindbreaksbute.g.inJanuary2005alightfrost(-0.5°C)seriouslydamagedsometrees.Protectedcroppinglikewithpapayacouldhelpwiththisproblemandmakealsoflowering,fruitsetandpestcontrol better manageable in a Mediterranean climate.
Biological control of mango pests and diseasesInformationonorganicmangoproduction(Rivera,2009)andnon-chemicalpestmanagementcanbefoundinaPANfieldguideThepestsanddiseasescoveredinthisguideare:fruitfly,mangoleafhoppers,mangoshootcaterpillar,mangotipborer,mealybugs,scales,anthracnose,pinkdisease,scabandstem-endrot(PAN,2005).

146 | Guidelines for Experimental Practice
Experimental designForfieldexperimentsandexperimentsinpolytunnels,usuallyonetreeoragroupoftwotothreetreesareusedasaplot.Becauseofthesizeofthetreesandthelimitedsizeofpolytunnels,thenumberoftreesperplotandthenumberofreplicationsisseverelylimited.However,totestfertiliserorirrigationwatertreatments,semi-hardwood cuttings from stock plants can be used to achieve uniform plant material. When grown in pots they can be kept much smaller and can be produced in large numbers, which make larger plots and replication numbers of three to six possible (n=6). Such a design represents a compromise to achieve larger replication numbers and statisticallysignificantresults.However,thetreesarenotfull-sizeandthe‘modelplants’onlyrepresentlargertreesinthefieldorinpolytunnels.
Toproducesemi-hardwoodcuttings,15to20cmlongcuttingsfromnewgrowth(fromtheprevioussixmonths)of mango stock plants are taken. To induce rooting, cuttings are dipped for a few seconds in an auxin solution. Prior to dipping, two 2 cm deep crosswise cuts are made at the basal end of the cutting and 4 to 5 leaves are left. Leaf tips are then cut to reduce transpiration and enhance new growth. Cuttings are placed in a mist chamber withinagrowingmediumcontainingcoarseandfinesandandkeptat28°C.Dependingonthevariety,alargeproportion of uniform cuttings can be rooted, ready for further experiments.
Example of a greenhouse experiment:The cuttings can be transplanted in the soil or into plastic pots (e.g. 2.5 litre) and then should be grown for at least another four weeks before treatments start. In a greenhouse, each pot with a uniform cutting can be treatedasaplotandthenarandomizedcompleteblockdesignwithsixreplicationspertreatmentispossible.ThestatisticalanalysisisthendoneusingANOVAandF-test.Togiveanexample,agreenhousepotplantexperiment with seven different irrigation water treatments (one of them a control) and six replications would require7x6=42experimentalplantsasuniformcuttings.Assumingan80%successrateatrootingandsomeadditionalselectionforpoorly-rootedplants,about80cuttingsfromstockplantsarenecessaryforthisexperiment (n=6).
Figure 4.26 Mango experiments, in a greenhouse (left) and in a growth chamber (right).
Using pot plants also has the advantage of controlling the root temperature and using this as a treatment in greenhouse experiments. In growth chambers and environmental simulation labs, even more controlled environments are possible, however this comes at the expense of replication and treatment number. For example, to continuously measure root and shoot respiration of tree crops cuvettes are necessary and expensive gas chromatographs are needed which allow only 2 treatments and 3 replications with uniform cuttings from the same stockplant (n=3).

Guidelines for Experimental Practice | 147
References and further informationCalatrava, J., Sayadi, S., Sarmiento, D. and Guirado, E. (2013)
Returnanalysisof‘Osteen’and‘Kent’mangoorchardsinsouth-easternmainlandSpain.ActaHort.992:85-92, DOI: 10.17660/ActaHortic.2013.992.9
Hermoso,J.M.,Guirado,E.,González-Fernández,J.J.andFarré,J.M.(2015) Study on performance of ‘Keitt’ mango on different rootstocks in a Mediterranean climate. Acta Hort. 1075, 115-119,DOI:10.17660/ActaHortic.2015.1075.11
PAN (2005) FieldGuidetoNon-chemicalpestmanagementinMangoProduction,Pesticideactionnetwork,Germany,Hamburg,www.oisat.org/downloads/field_guide_mango.pdf
Rivera R. (2009) A guide to growing organic mango with natural farming system. Philippines, FAO Asian Regional Pesticide Risk Reduction Programme www.vegetableipmasia.org
Sayadi, S., Calatrava, J., Guirado, E. and Sarmiento, D. (2013) Aneconomicanalysisofculturemechanization:thecaseoftheSpanishmango.ActaHort.992:221-224,DOI: 10.17660/ActaHortic.2013.992.28
Sayadi, S. and Calatrava, J. (2009). StructureandProductivityofSpanishMangoIndustry:aFarmersSurveyAnalysis.ActaHort.820,47-56DOI: 10.17660/ActaHortic.2009.820.2
International Union for the Protection of New Varieties of Plants (UPOV). 2004. Mango TG/112/4. www.upov.int

148 | Guidelines for Experimental Practice
4.8 Ornamentals
Many different bedding and pot plant species are grown. Out of them Pelargonium is the most important bedding plant and it is described here as an example for other ornamental bedding plants that may be grown in pots.
4.8.1 Pelargoniums cultivated in pots
By Martin Koller and Robert Koch
Botanical name: Pelargonium zonale and Pelargonium peltatum
General crop requirements Pelargoniums are sensitive to frost. Mostly they are propagated vegetatively and rooted cuttings are transplanted directlyintothefinalpot.Fororganicgrowingamoderatetemperature(between12–16°C)isrecommendedinorder to obtain strong plants with short internodes. The two important species (P. peltatum (ivy leaved) and P. zonale)havecompactgrowthtypesthatarebettersuitedtoorganiccultivationthanstronger-growingtypes.
Thecultivationperioddependsonthetemperature,light,thesizeofthepotandthestageatwhichplantsareto be sold; it can vary from 10 to 16 weeks. A shorter cultivation period is needed for plants in smaller pots (less than 11cm diameter). The plants should be irrigated with caution in order not to stimulate the longitudinal growth.
Figure 4.27 Plants from a pelargonium pot trial to compare integrated with organic production.
Experimental design Recommended replicates: at least four.

Guidelines for Experimental Practice | 149
Table 4.75Typical plant spacing for pelargoniums.
Pot diameter12 cm
Minimum number of plants / core plot 20
Pot density / m² 24
Plants per pot 1
Table 4.76Recommended heating temperature after transplanting the rooted transplant into the pot.
Growing stage Day°C Night°C Ventilation from (°C)
Direct after transplanting 20 18 25
Cultivation after roots are established
14-16 12-14 18
Temperaturesbelow12°Cshouldbeavoidedbecausenutrientmineralizationinthegrowingmediumwillbetooslow.Acultivationtemperatureof16-18°Cisusuallyrecommendedforconventionalplantsbutwill,intheabsence of growth retardants, lead to elongated plants. A ‘cool morning technique’ (temperature drop of 8°C before or with the sunrise for 4 h) is recommended to control shoot growth.
Crop nutritionThenutrientdemandwillvarydependingonthegrowthhabitandpotsize.Ifgrowingmediawithacompositionof20%ormoreofcompostisused,additionalphosphorusorpotassiumfertiliserisusuallynotneeded.Itshouldbenotedthattheavailabilityratefornitrogeninorganicfertilisersisestimatedat60-70%(Navailable/Ntotal).
Table 4.77Nutrient demand of a potted pelargonium plant.
Potsize N P K Mg
12 cm (mg / pot) 500-700(1) 40-60 420-580 40-80
Crop management Pinchoutshoottipstopromotebushinessisrecommendedforstrong-growingZonale-Types(onceortwice)and for most of the Peltatum types (twice), possibly from two weeks after transplanting until eight weeks before marketing.
Disease, pest problems and physiological disordersDiseases:•Bacterialblight-Xanthomonas hortorum pv. pelargonii (Syn. X. campestris pv. pelargonii).•Rust-Puccinia pelargonii-zonalis(OnlyaproblemonP.zonale).
Pests:Aphids-manydifferentspecies
Physiological disorder:Oedema (Edema) is caused by high substrate moisture and low transpiration. P. peltatum are especially susceptible.
150 | Guidelines for Experimental Practice
Theoccurrenceofotherdiseasesandpests(e.g.whiteflies)shouldberecordedinanyreport.
Assessments of growth and qualityFor cultivar testing a detailed protocol for a wide range of characteristics is available from UPOV and CPVO. Assessments are usually made at the stage when the plants are marketed. These can include:
•Uniformity of crop (1 = absent or very weak, 3 = low, 5 = moderate, 7 = strongly, 9 = very strong).•Growth habit (1 = very vigorous, 3 = vigorous, 5 = moderate, 7 = compact, 9 = very compact).•Branching habit (1 = very poorly branched, 3 poorly branched, 5 = moderately branched, 7 = highly branched,
9 = very highly branched).•Leaf colour (very light green, 3 = light green, 5 = medium green, 7=dark green, 9 = very dark green).•Numberofflowers.Thenumbersofflowersperplantiscounted(orestimated)atleaston10plants.•Plant height. The height and the width of plant is measured at least on 10 plants at the stage at which the
plants are normally marketed (and if appropriate also once or twice during the growing period). The width of the plant is measured at the maximum diameter of the plant and a second time in a 90 ° angle (because of the irregularity of growth). Afterwards the mean of these two measurements is calculated.
•Root development. For at least ten plants the pot is removed and the root development on the surface of thegrowingmediaisassedatthestageatwhichtheplantsarenormallymarketed-andifappropriatealsoonce or twice during the growing period (1 = very poor root development, 3 = poor root development, 5 = moderate root development, 7 = densely rooted, 9 = very densely rooted).
•Shoot weight. After the growth assessment, the weight of the shoot is measured fresh and also after drying until the sample reaches a constant weight.
Overall valueThe overall value takes into account all criteria for the cultivation and marketing of a variety, based by expert opinion as evaluated by researchers using information from farmers, wholesalers, consumers (1 = very low, 3 = low, 5 = medium, 7 = high, 9 = very high).
References and further informationhttp://www.cpvo.europa.euInternational Union for the Protection of New Varieties of Plants (UPOV). 2004.
ZonalePelargonium,IvyLeaved-PelargoniumTG/28/9.http://www.upov.int
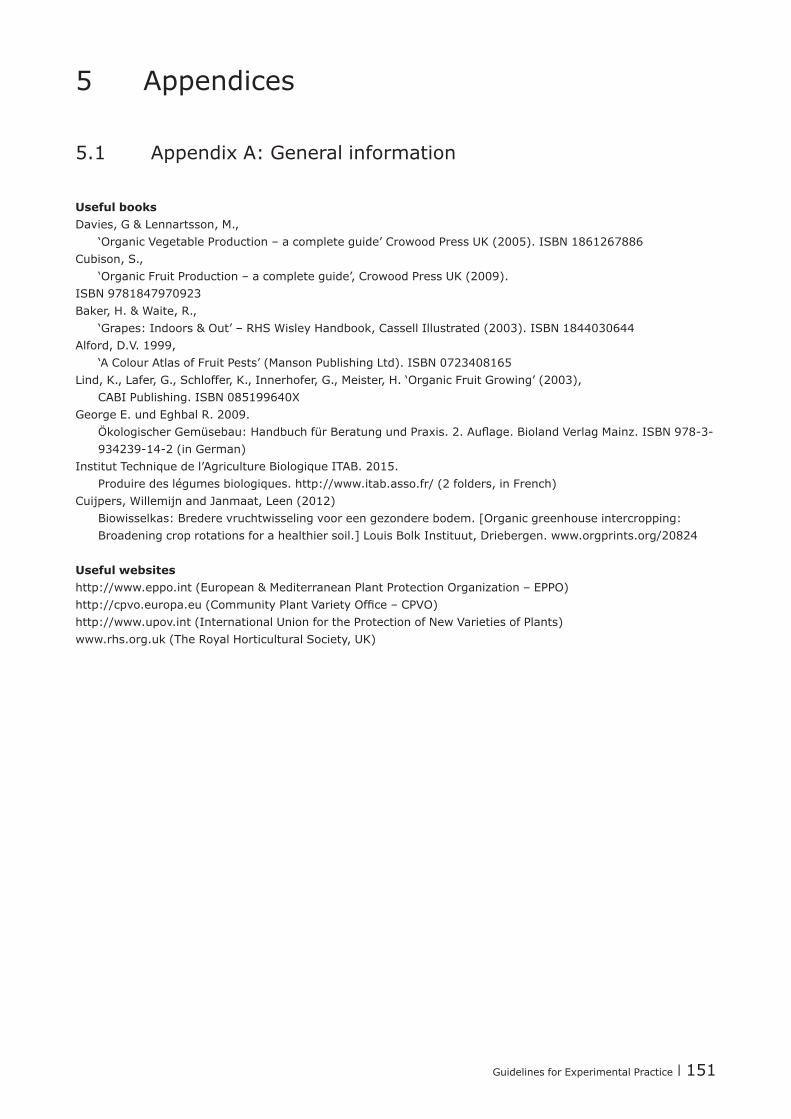
Guidelines for Experimental Practice | 151
5 Appendices
5.1 Appendix A: General information
Useful books Davies, G & Lennartsson, M.,
‘Organic Vegetable Production – a complete guide’ Crowood Press UK (2005). ISBN 1861267886Cubison, S.,
‘Organic Fruit Production – a complete guide’, Crowood Press UK (2009). ISBN 9781847970923Baker, H. & Waite, R.,
‘Grapes: Indoors & Out’ – RHS Wisley Handbook, Cassell Illustrated (2003). ISBN 1844030644Alford, D.V. 1999,
‘A Colour Atlas of Fruit Pests’ (Manson Publishing Ltd). ISBN 0723408165Lind, K., Lafer, G., Schloffer, K., Innerhofer, G., Meister, H. ‘Organic Fruit Growing’ (2003),
CABI Publishing. ISBN 085199640XGeorge E. und Eghbal R. 2009.
ÖkologischerGemüsebau:HandbuchfürBeratungundPraxis.2.Auflage.BiolandVerlagMainz.ISBN978-3-934239-14-2(inGerman)
Institut Technique de l’Agriculture Biologique ITAB. 2015. Produiredeslégumesbiologiques.http://www.itab.asso.fr/(2folders,inFrench)
Cuijpers, Willemijn and Janmaat, Leen (2012) Biowisselkas:Brederevruchtwisselingvooreengezonderebodem.[Organicgreenhouseintercropping:Broadening crop rotations for a healthier soil.] Louis Bolk Instituut, Driebergen. www.orgprints.org/20824
Useful websiteshttp://www.eppo.int(European&MediterraneanPlantProtectionOrganization–EPPO)http://cpvo.europa.eu(CommunityPlantVarietyOffice–CPVO)http://www.upov.int (International Union for the Protection of New Varieties of Plants)www.rhs.org.uk (The Royal Horticultural Society, UK)

152 | Guidelines for Experimental Practice
5.2 Appendix B: Summary table of crop nutrient demand
Crop N (g/kg yield) P (g/kg yield)
Source: 1 2 3 4 5 1 2 3 4 5
Tomato 2.3 – 3.2 3.3 3.5(2-7.4) 2.5 1.3 0.4 0.5 0.4(0.3-0.9) 0.4 0.2
Pepper 5.1– 4.4 4.4 4.5(3.0-8.0) 3.9 2.7 0.6 0.6(0.3-1.1) 0.4 0.4
Eggplant 5.0(3.0-7.0) 5.4 2.2 0.7(0.1-1) 0.9 0.5
Cucumber 1.4 – 1.7 1.5 2.1(1.5-3.6) 1.6 1.2 0.4 0.4 0.5(0-1.4) 0.3 0.3
Courgette 4.5(3.8-5.0) 3.8 2.7 1.3(0.7-1.7) 0.7 0.2
Watermelon 2.3(1.7-3.7) 1.7 0.6(0.3-0.8) 0.6
Melon 4.4(2.5-6.4) 3.0 0.6(0.2-1.1) 0.7
Lamb’s Lettuce 4.0 4.0 4.2 0.7 0.7 0.4
Lettuce 2.0 2.0 3.2(1.5-5.8) 2.3 2.0 0.4 0.4 0.5(0.1-0.9) 0.3 0.3
Rocket 7.0 0.6
Climbing beans 4.0 4.0 9.3(1.3-19) 7.5 0.8 0.8 0.8 2(0.9-3.5) 0.9 0.7
Kohlrabi 3.1 0.6
Radish 3.6 3.6 3.9(1.2-5.8) 3.0 1.5 0.5 0.5 1.1(0.2-2.1) 0.4 0.3
Spring Onion 0.4(2.2-4.6) 2.7 0.7(0.2-1.2) 0.6
Parsley 5.4 5.4 3.2(2.2-4.8) 4.8 3.3 0.7 0.7 0.7(0.3-0.9) 0.7 0.7
Strawberries 4.7 3.5 0.9(0.1-1.5) 1.1

Guidelines for Experimental Practice | 153
Crop K (g/ kg yield) Mg (g/kg yield)
Source: 1 2 3 4 5 1 2 5
Tomato 3.7-5.2 5.0 5.2(2.9-11) 4.0 1.9 0.5 0.5 0.4
Pepper 5.35-5.2 5.4(3.7-11.3) 4.2 3.5 0.5 0.45 0.5
Eggplant 5.2(2.1-9.3) 5.0 3.2 0.6
Cucumber 2.2-2.9 2.8 2.6(1.7-4) 2.2 1.3 0.2 0.19 0.5
Courgette 7.9(6.4-10.4) 7.5 2.5 0.2
Watermelon 2.9(2.3-5.6) 2.3
Melon 4.8(2.1-6.7) 4.2
Lamb’s Lettuce 6.0 6.0 0 4.2 0.3 0.33 0.8
Lettuce 3.2 3.1 5(3.3-6.4) 4.0 2.9 0.3 0.27 0.5
Rocket 0 5.0 0.7
Climbing beans 3.6 3.6 6.9(5-8.3) 5.0 3.0 0.6 0.6 0.6
Kohlrabi 0 3.7 0.7
Radish 4.4 4.4 3.1(2.4-4.2) 2.5 2.1 0.2 0.2 0.5
Spring Onion 3.2(1.5-4.4) 2.3
Parsley 9.4 9.4 3.8(3.3-4) 4.0 2.8 0.4 0.40 0.7
Strawberries 7.4(1.8-11.9) 5.4
Sources (indicated by numbers in column headings for each element):
1)ScharpfH.andWeierU.1994.DüngungvonUnterglasgemüseinBodenkulturen.Gemüse,Heft11,623-626
2)Lattauschke,G.2004.AnbauvonGewächshausgemüse.HinweisezumumweltgerechtenAnbau.SächsischeLandesanstaltfür
Landwirtschaft. Dresden. www.publikationen.sachsen.de/bdb/artikel/13405/documents/15179
3)Gianquinto,G.,P.Muñoz,A.Pardossi,S.Ramazzotti&D.Savvas.2013.Soilfertilityandplantnutrition.In:GoodAgricultural
Practices for greenhouse vegetable crops. Principles for Mediterranean climate areas. FAO Plant Production and Protection Paper 217.
4)RER-GAP.2010.RegioneEmiliaRomagnaGAP.CRPV.In:Gianquinto et al. 2013 (see Nr. 3).
5)NeuweilerR.2011.DüngungsrichtlinienfürdenGemüsebau.AgroscopeWädenswil.www.agroscope.admin.ch/publikationen

154 | Guidelines for Experimental Practice
5.3 Appendix C: Summary of nutrient content of crop tissues
Table C1Optimal range of macronutrients in greenhouse crops in terms of percentage of dry matter (DM) (Gianquin-to et al. 2013).
Crop N %DM
P %DM
K %DM
Ca %DM
Mg %DM
Sampled plant part
Tomato 3.0–5.0 0.20–0.60 3.5–6.0 2.0–4.0 0.35–0.80 1)
Pepper 3.0–4.5 0.30–0.60 3.0–7.5 1.0–2.5 0.35–0.90 1)
Eggplant 4.0–5.5 0.30–0.60 4.0–6.5 1.0–2.2 0.30–1.00 1)
Cucumber 4.5–6.0 0.30–0.80 2.5–5.5 3.0–6.0 0.50–1.20 2)
Zucchini 4.0–6.0 0.30–0.50 2.5–5.0 2.0–3.5 0.25–1.00 2)
Melon 4.0–5.5 0.30–0.70 3.5–5.5 2.0–3.5 0.35–0.80 2)
Watermelon 2.0–5.0 0.20–0.60 2.5–4.5 1.5–3.5 0.40–0.80 2)
Bean 3.0–6.0 0.25–0.75 3.0–7.5 0.8–3.0 0.25–0.80 1)
Lettuce 4.0–5.5 0.30–0.70 5.5–12 0.8–2.5 0.25–0.90 3)
Strawberry 2.1–4.0 0.20–0.45 1.5–2.5 0.6–2.5 0.25–0.70 4)
Table C2Optimal range of micronutrients in greenhouse crops in terms of mg per kg dry matter (DM) (Gianquinto et al. 2013).
Crop Fe mg / kg DM
Mn mg / kg DM
Zn mg / kg DM
Cu mg / kg DM
B mg / kg DM
Sampled plant part
Tomato 40–150 30–150 20–80 5–20 30–80 1)
Pepper 60–300 30–150 20–100 6–25 25–80 1)
Eggplant 50–300 30–250 20–200 5–15 25–80 1)
Cucumber 50–300 50–500 25–300 6–18 30–10 2)
Zucchini 50–200 50–250 20–200 10–25 25–75 2)
Melon 50–300 50–250 20–200 7–30 25–60 2)
Watermelon 50–300 40–250 20–250 5–20 25–80 2)
Bean 50–400 30–300 20–200 5–30 25–80 1)
Lettuce 50–300 30–250 25–250 6–25 25–60 3)
Strawberry 50–250 30–350 20–70 6–20 25–70 4)
Sampled plant part:3. Most recent fully expanded leaf4. Fifth leaf from the top of the shoot5. All leaves at head formation6. Young, fully expanded leaves
Source:
Gianquinto,G.,P.Muñoz,A.Pardossi,S.Ramazzotti&D.Savvas.2013.Soilfertilityandplantnutrition.In:GoodAgriculturalPractices
for greenhouse vegetable crops. Principles for Mediterranean climate areas. FAO Plant Production and Protection Paper 217.


ResearcCOST is supported bythe EU Framework ProgrammeHorizon 2020
COST (European Cooperation in Science and Technology) is a pan-European intergovernmental framework. Its mission is to enable break-through scientifi c and technological developments leading to new concepts and products and thereby contribute to strengthening Europe’s research and innovation capacities. It allows researchers, engineers and scholars to jointly develop their own ideas and take new initiatives across all fi elds of science and technology, while promoting multi- and interdisciplinary approaches. COST aims at fostering a better integration of less research intensive countries to the knowledge hubs of the European Research Area. The COST Association, an International not-for-profi t Association under Belgian Law, integrates all management, governing and administrative functions necessary for the operation of the framework. The COST Association has currently 36 Member Countries. www.cost.eu.
Link to the Action:http://www.cost.eu/COST_Actions/fa/FA1105And:http://www.biogreenhouse.org/


![ESA 322/3 Structural Dynamics [Dinamik Struktur]eprints.usm.my/30599/1/ESA_322_Structural_Dynamics_JUN_2015.pdf · Finite Element method ... Consider one-dimensional rod structure](https://static.fdocuments.net/doc/165x107/5a78e58c7f8b9a5a148d5a8b/esa-3223-structural-dynamics-dinamik-struktur-element-method-consider-one-dimensional.jpg)


