Cost Plus World Market 2001 Annual Report · Cost Plus World Market’s unique retail concept. The...
26
Cost Plus World Market 2001 Annual Report
Transcript of Cost Plus World Market 2001 Annual Report · Cost Plus World Market’s unique retail concept. The...

Cost Plus World Market 2001 Annual Report

Browsing through a truly unique, always compelling
and very successful retail concept.

CPWM 3
You feel it the moment you walk into Cost Plus World Market —that our stores are different, that they aren’t quite like anyother retail concept. No other retailer has our unique mix ofhome furnishings, kitchenware, collectibles, bed and bathitems, garden products, and gifts plus a large selection ofgourmet foods, coffees, teas and wines. No one else creates a
shopping environment that is at once as relaxed and stimulat-ing as an open-air market in a foreign city. And certainlyno other retailer sells such high-quality merchandise at suchaffordable prices. We do, and our unique approach has madeCost Plus World Market one of the most successful anddurable retailers operating today.
Visit our stores and you’ll understand why: we offer high-quality merchandise you won’t findanywhere else, prices you won’t believe and a casual atmosphere that makes shopping fun.
Discovering

4 CPWM
In 2001, Cost Plus World Market faced its most challenging yearin a decade. Like many retailers, we were confronted by a slow-ing economy and the dramatic decline in consumer spendingwhich followed the events of September 11. Additionally, prob-lems that arose during the development and deployment of newdistribution systems and processes temporarily impeded the flow
of merchandise to our stores, further damaging third quartersales. I’m pleased to report, however, that we rose to meet all ofthese challenges. In the fourth quarter, merchandise flowed morequickly and smoothly than ever in our history, and our fourthquarter operating results were at record levels. This momentumhas continued into fiscal 2002.
To Our Shareholders
Murray H. Dashe >Chairman, Chief Executive Officer and President
CPWM 5

CPWM 76 CPWM
“In its successful national expansion, Cost Plus World Market has proven the continuing powerand popularity of its unique retail concept.”
Solid Operating Results For the 52 weeks ended February 2,2002, Cost Plus World Market sales were $568.5 million, up15.2% from $493.7 million for the 53 weeks of fiscal 2000. Themajority of this sales growth came from our stores outsideCalifornia, since the impact of the recession has been greaterin our home state. Same store sales for the year rose 0.3%, pri-marily reflecting the softness of the midyear period, but fourthquarter same store sales rebounded to a 2.7% increase year-to-year. While net income for fiscal 2001 at $20.2 million, or$0.93 per share, lagged the prior year’s $21.7 million, or $1.00per share, the Company’s strong return to record earnings of$19.8 million, or $0.91 per share, in the fourth quarter, providedevidence that we had effectively resolved the issues facing us.
Along the way we improved operating efficiencies and elimi-nated weaknesses. The challenges of this past year also provedthe capability of a number of key employees whose performancesin the face of adversity were truly exceptional. Some of thesepeople have recently been promoted in recognition of their con-tributions, and this letter would be incomplete without acknowl-edging their efforts — and indeed, the efforts of all Cost PlusWorld Market’s employees — during 2001. We are confident thatour management team is now the strongest it has ever been, andamong the finest in the retail industry.
From management’s perspective, then, the Company emergedfrom fiscal 2001 leaner and stronger, and able to identify andsolve tough problems effectively. We also feel that our solidfinancial results for the year and the consistently strong perfor-mance of our new stores demonstrate the continuing power ofCost Plus World Market’s unique retail concept.
The rest of this year’s annual report is devoted to describingthis successful concept in more detail, and you are encouragedto read on to learn how the particular attributes that differentiate
Cost Plus World Market — our unique product assortment, ourvalue orientation, and the casual, comfortable and fun shop-ping environment of our stores — translate into competitiveadvantage and consistently strong operating results.
A Unique — and Proven — Retail Concept At the heart of thisconcept is our ability to source, develop and sell products thatshoppers often won’t find anywhere else. Customers come toCost Plus World Market knowing they’ll find great values andhigh quality, but they also expect to find originality andauthenticity. That has always been one of our hallmarks and itis why as much as 60% of our product assortment is new everyyear. Doing this successfully requires a clear sense of markettrends — which comes from listening carefully to our customers— coupled with a great deal of creativity from our buyers andproduct development teams. It also requires constant experi-mentation. Throughout the year, we test new product ideas ina limited number of stores to determine which merchandise hasenduring, broad-based appeal. Those products are then rolledout into all our stores. The most successful products can evolveinto categories; the most successful categories can grow intoentire departments.
The ability to develop and establish popular new product lineshas made Cost Plus World Market an increasingly strong com-petitor in the growing market for home furnishings. It has alsohelped drive our top and bottom line growth for more than adecade. In 2001, for example, we saw steadily rising consumerdemand for our home office furniture and bed and bath fur-nishings, both of which are recent experiments that have quicklygrown into popular new product categories. By focusing ahigher percentage of our November and December marketingefforts around these and other home furnishing categories, wewere able to stimulate increased sales of all our home merchan-dise during the important Holiday selling season. The Holiday
season is traditionally very strong for our food and beverageproducts, and this year was no exception. However, the shift in sales mix toward our higher-margin home furnishing offer-ings had a positive impact on our fourth quarter profitability.And, again, we are seeing these sales trends continuing intofiscal 2002.
A Commitment to Profitable Growth Supporting such a large,eclectic and continuously changing product assortment requires ahighly efficient distribution operation, and as previously noted, in fiscal 2001 we implemented new systems and significantlystrengthened our distribution management Company-wide inorder to improve our overall inventory management. That goalhas been achieved.
This success has resulted from the hard work of many individu-als throughout the Company and is reflected in how much moreefficient our distribution operations are today. We have learneda great deal from our distribution development experience, andwe are putting those lessons to work as we prepare for the mid-2002 opening of our new 500,000 square-foot distribution centernear Norfolk, Virginia. With exhaustive planning, in-depth train-ing and a carefully phased rollout, we are confident that thenew facility will come online successfully and be operating effi-ciently at needed capacity by the Holiday season.
Building on Our Momentum in Fiscal 2002 Indeed, as we moveforward into fiscal 2002, we are confident about all aspects ofCost Plus World Market’s operations. Our unique and evolvingproduct assortment is generating strong store traffic and growing
customer interest in our expanded home furnishings offering.Our Company-wide cost control efforts continue to improve ouroperating efficiency. And our concept is proving very popular ineach new market we enter. Our goal for fiscal 2002 is to add a net of 25 new stores — mostly in the Midwest, East andSoutheast — for a total of 175 stores in 23 states at year end,with more than 70% of our stores outside our home base ofCalifornia. Ultimately we believe we can operate up to 450stores nationwide located in both large and medium-sized met-ropolitan markets, meaning there is still a great deal of growthpotential for Cost Plus World Market.
Our job now is to realize that potential, and all of us at theCompany are committed both to improving our operating perfor-mance and to translating our success into increased shareholdervalue at Cost Plus World Market. We look forward to reportingto you on our continued progress toward these goals in themonths and years ahead.
Murray H. DasheChairman, Chief Executive Officer and PresidentMarch 2002

CPWM 9
< Visit the Marketplace
At Cost Plus World Market, we believe that every shopper, atheart, is a browser. That’s why we’ve created a store layoutand atmosphere that encourages shoppers to wander, linger,and explore. For example, there are very few straight aislesin our stores. Instead, merchandise is arranged informally insmall stacks, in wooden buckets, in wicker baskets, on crates,or in stand-alone collections creating creative groupings of
furniture, artwork, rugs, chairs and housewares that inspire asense of discovery. Different sections of the store aren’t distinct departments but are designed to flow together natu-rally. Lighting is warm, colors are vibrant, and the environ-ment is purposely casual with smooth concrete floors andexposed wooden rafters. The overall feeling is comfortableand unhurried and uniquely Cost Plus World Market.
Believe it or not, shopping used to be one of life’s little pleasures. Believe it or not, it stillcan be. Just ask a Cost Plus World Market customer.
Exploring

At the back of each Cost Plus World Market is TheMarketplace, an eclectic and inviting collection of foods,coffees, teas, spices, candies and wines from around theworld. The atmosphere of The Marketplace is energetic
and interactive and reflects our commitment to makingshopping fun. With its colorful packaging, enticing aromasand overflowing product displays it is a treat for the sens-es that attracts customers deep into the store.
Part high-quality kitchen supply, part international grocer, completely out of the ordinary,the Marketplace is made for browsing.

10 CPWM
Ask Cost Plus World Market shoppers what a trip to our storesfeels like and they are likely to say “an adventure.” It’s not hardto see why. We offer items you won’t find anywhere else, and —because we source merchandise from more than 70 countries— our products often come from parts of the world most of usonly read about. We also change about 60% of our product
assortment every year, so there’s always something new to dis-cover. And our unique mix of merchandise — nowhere else canyou find high-quality furniture, accessories and garden productssold side-by-side with kitchenware, gourmet foods and wines —keeps our customers coming back regularly, while ensuring thatthey enjoy the adventure each time they do.
Cost Plus World Market shoppers rarely hurry. They come to see what’s new (lots) and what’sinteresting (everything). That’s why their average store visit lasts almost an hour.
53 Minutes Later
CPWM 11
CPWM 13
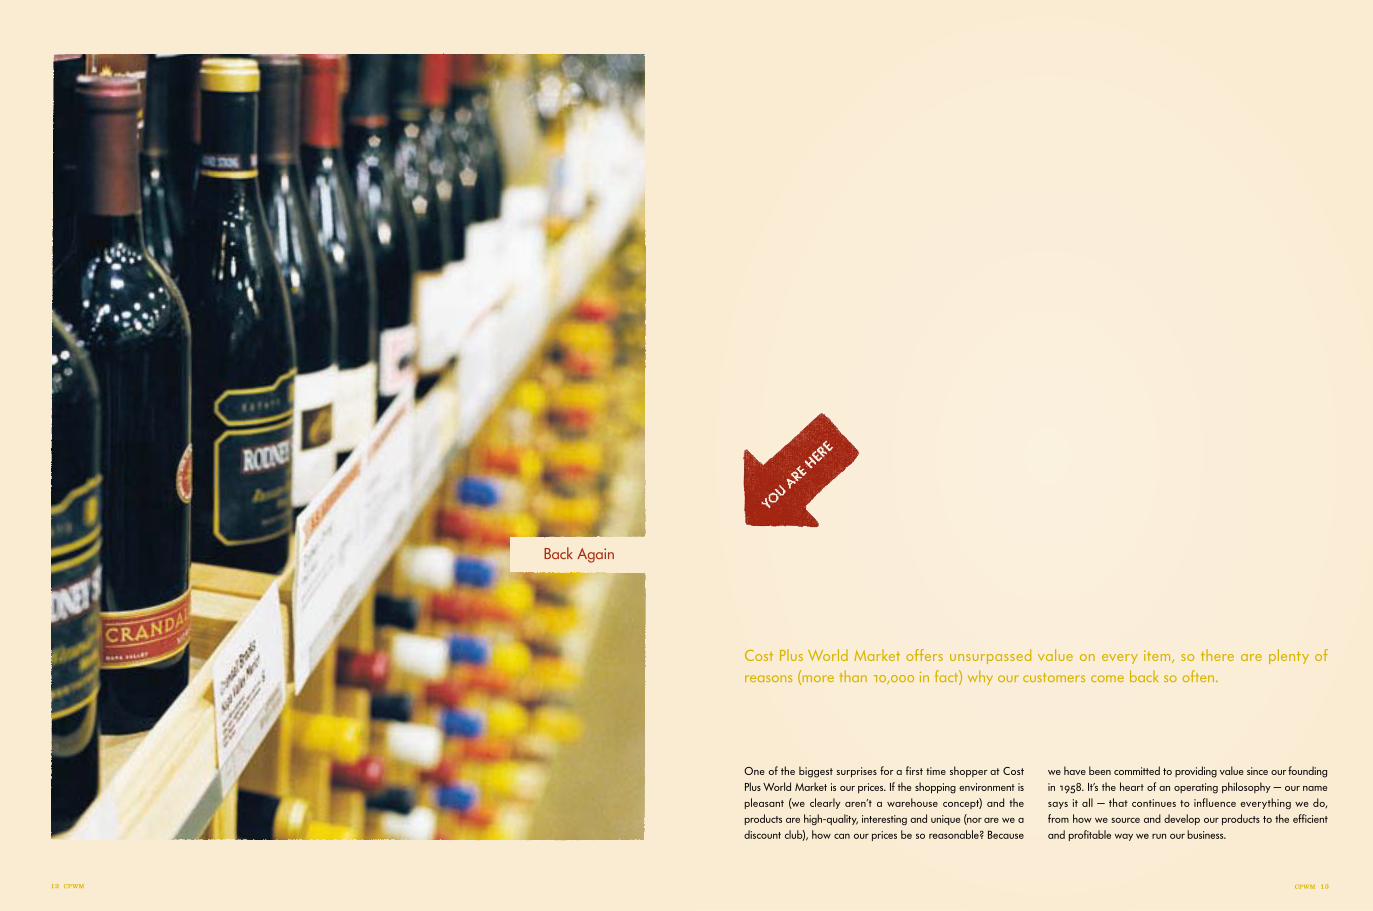
One of the biggest surprises for a first time shopper at CostPlus World Market is our prices. If the shopping environment ispleasant (we clearly aren’t a warehouse concept) and theproducts are high-quality, interesting and unique (nor are we adiscount club), how can our prices be so reasonable? Because
we have been committed to providing value since our foundingin 1958. It’s the heart of an operating philosophy — our namesays it all — that continues to influence everything we do,from how we source and develop our products to the efficientand profitable way we run our business.
Cost Plus World Market offers unsurpassed value on every item, so there are plenty ofreasons (more than 10,000 in fact) why our customers come back so often.
Back Again
12 CPWM

14 CPWM
Cost Plus World Market has been improving steadily formore than forty years, and we aren’t about to stop now.Over the past year alone, we enhanced the design of ournew store prototype, and we significantly strengthenedour distribution efficiency with new systems and our soon-to-be-opened East Coast distribution center. We have also introduced several exciting new product categories —
including our popular home office and bed and bath productlines — and we are expanding our highly successful privatelabel program. In short, we continue to find ways to makeshopping more engaging, more casual, more exciting,more pleasant, more adventurous, and more affordable.That’s Cost Plus World Market: shopping that’s more fun.What a concept.
Even the best retail concepts have room for improvement. At Cost Plus World Market, wenever stop looking for ways to get better.
Visit our Locations >
Everywhere

Quality, value and fun are attractive to shoppers every-where. It’s how Cost Plus World Market has established astrong national presence. The stores outside of Californianow account for close to 70% of our store base, and with our
concept proving successful in both large metropolitan andmidsized urban markets, we believe Cost Plus World Marketcan ultimately grow to 450 stores across the country.
Cost Plus World Market has more than 153 stores* in 19 states. And we’re just getting started.
*153 stores as of April 2, 2002.

CPWM 17
16 CPWM
Having a superior retail concept is only a partial victory. To be truly successful, you have totranslate it into superior financial performance.
260.5
Net Salesdollars in millions
315.1
402.3
493.7
568.5
97 98 99 00 01
18.1
Operating Incomedollars in millions
22.9
33.1
36.2
34.1
97 98 99 00 01
10.0
Net Incomedollars in millions
13.2
19.7
21.7
20.2
97 98 99 00 01
21% 21%
Five Year CompoundAnnual Growth Rate1997-2001
18%
22%
Stor
es
Sale
s
Ope
ratin
g In
com
e
Net
Inco
me
CPWM 17
Management’s Discussion and Analysis 18Five Year Summary of Selected Financial Data 22Consolidated Balance Sheets 27Consolidated Statements of Operations 28Consolidated Statements of Shareholders’ Equity 29Consolidated Statements of Cash Flows 30Notes to Consolidated Financial Statements 31Independent Auditors’ Report 41Directors, Officers and Corporate Data 42Store Locations 43
In The Black

An asterisk “*” denotes a forward-looking statement reflecting current expectations that involve risks and uncertainties.Actual results may differ materially from those discussed in such forward-looking statements and shareholders of CostPlus, Inc. (the “Company” or “Cost Plus”) should carefully review the cautionary statements set forth in this Annual Report,including “Quarterly Results and Seasonality” beginning on page 23. The Company may from time to time make addi-tional written and oral forward-looking statements, including statements contained in the Company’s filings with theSecurities and Exchange Commission and in its reports to shareholders. The Company does not undertake to update anyforward-looking statement that may be made from time to time by or on behalf of the Company.
Critical Accounting Policies and Estimates
Cost Plus, Inc. and its subsidiaries’ discussion and analysis of its financial condition and results of operations are basedupon the Company’s consolidated financial statements, which have been prepared in accordance with accounting prin-ciples generally accepted in the United States of America. The preparation of these financial statements requires theCompany to make estimates and judgments that affect the reported amounts of assets, liabilities, revenues and expensesand related disclosure of contingent assets and liabilities. Estimates and assumptions include, but are not limited to,inventory values, fixed asset lives, intangible asset values, deferred income taxes, self-insurance reserves and the impactof contingencies and litigation. The Company bases its estimates on historical experience and on various other assump-tions that are believed to be reasonable under the circumstances, the results of which form the basis for making judg-ments about the carrying values of assets and liabilities that are not readily apparent from other sources. Actual resultsmay differ from those estimates under different assumptions or conditions. The Company has also chosen certainaccounting policies when options are available, including:
> the retail inventory method of accounting for inventories.> the intrinsic value method to account for common stock incentive awards.
These accounting policies are applied consistently for all years presented. Operating results would be affected if otheralternatives were used. Information about the impact on operating results by using APB Opinion No. 25 “Accounting forStock Issued to Employees” is included in footnote 7 to the consolidated financial statements.
Although not all inclusive, the Company believes that the following represent the more critical estimates and assump-tions used in the preparation of the consolidated financial statements.
Revenue Recognition The Company’s revenue recognition process does not involve significant judgment or estimates. Aprovision for sales returns is estimated and recorded in the current year based on actual returns subsequent to year end.
Net Sales Net sales consist of sales from comparable stores and non-comparable stores. A store is not included in com-parable store sales until the first day of the fiscal month beginning with the fourteenth full fiscal month of sales. Non-comparable store sales include sales in the current fiscal year from stores opened during the previous fiscal year beforethey are considered comparable stores and new stores opened during the current fiscal year.
Inventory Inventories are stated at the lower of cost or market under the retail inventory method (“RIM”), in which thevaluation of inventories at cost and the resulting gross margins are calculated by applying a calculated cost-to-retailratio to the retail value of inventories. RIM is an averaging method that is widely used in the retail industry due to itspracticality. Also, the Company’s use of the retail inventory method will result in valuing inventories at lower of cost ormarket as markdowns are currently taken as a reduction of the retail value of inventories. Inherent in the RIM calculationare certain significant management judgments and estimates including, among others, merchandise markon, markdowns
Management’s Discussion and Analysis of Financial Condition and Results of Operations
18 CPWM CPWM 19
and shrinkage, which impact the ending inventory valuation at cost as well as resulting gross margins. These estimates,coupled with the fact that the RIM is an averaging process can, under certain circumstances, produce distorted or inac-curate cost figures. To reduce the potential of such distortions in the valuation of inventory, the Company’s RIM utilizes26 departments in which fairly homogeneous classes of merchandise inventories having similar gross margins aregrouped. In addition, failure to take timely markdowns could result in an overstatement of cost under the lower of cost ormarket principle. When necessary, the Company records a markdown allowance that reduces inventory value to thelower of cost or market. Management believes that the Company’s RIM provides an inventory valuation that reasonablyapproximates cost and results in carrying inventory at the lower of cost or market.*
Insurance / Benefits The Company records estimates for certain health and welfare, workers’ compensation and casualtyinsurance costs that are self-insurance programs with per occurrence and aggregate limits on losses. Should a greateramount of claims occur compared to what was estimated or costs of medical care increase beyond what was anticipated,reserves recorded may not be sufficient and additional costs to the consolidated financial statements could be required.
Other Accounting Estimates Estimates inherent in the preparation of the Company’s financial statements include thoseassociated with the evaluation of the recoverability of deferred tax assets and goodwill as well as those used in thedetermination of liabilities related to litigation, claims and assessments. Various assumptions and other factors underliethe determination of these significant estimates. The process of determining significant estimates is fact specific and takesinto account factors such as historic experience and current and expected economic conditions. The Company constant-ly reevaluates these significant factors and makes adjustments where facts and circumstances dictate. To date, actualresults have not significantly deviated from those determined using the estimates described above.
The Company has not recorded a valuation allowance to reduce its deferred tax assets. The Company has consideredfuture taxable income and ongoing prudent and feasible tax planning strategies in assessing the need for the valuationallowance. In the event the Company were to determine that it would not be able to realize all or part of its net deferredtax assets in the future, an adjustment to the deferred tax assets would be charged to income in the period such determina-tion was made. Likewise, should the Company determine it would be able to realize deferred tax assets in the future inexcess of the net recorded amount, an adjustment to the deferred tax asset would increase income in the period such deter-mination was made.
The Company had goodwill in the amount of $4.2 million at February 2, 2002. In connection with the adoption ofStatement of Financial Accounting Standard (SFAS) No. 142, “Goodwill and Other Intangible Assets,” the Company per-formed an impairment test which resulted in no impairment being identified.
The Company is involved in litigation, claims and assessments incidental to its business, the disposition of which is notexpected to have a material effect on the Company’s financial position or results of operations.* It is possible, however, thatfuture results of operations for any particular quarterly or annual period could be materially affected by changes in theCompany’s assumptions related to these proceedings.* The Company accrues its best estimate of the probable cost for theresolution of claims. When appropriate, such estimates are developed in consultation with outside counsel handling the mat-ters and are based upon a combination of litigation and settlement strategies. To the extent additional information arises orthe Company’s strategies change, it is possible that the Company’s best estimate of its probable liability in these mattersmay change.*

Forward-Looking Statements and Factors Affecting Future Performance
This report includes a number of forward-looking statements, which reflect the Company’s current beliefs and estimateswith respect to future events and the Company’s future financial performance, operations and competitive position. Thewords “expect,” “anticipate,” “estimate,” “believe,” “looking ahead,” forecast,” “plan” and similar expressions identify for-ward-looking statements.
The Company’s continued success depends, in part, upon its ability to increase sales at existing locations, to open newstores and to operate stores on a profitable basis. There can be no assurance that the Company’s existing strategies andstore expansion program will result in a continuation of revenue and profit growth. Future economic and industry trends thatcould potentially impact revenue and profitability remain difficult to predict.
The forward-looking statements that are contained in this report are subject to known and unknown risks and uncer-tainties that could cause the Company’s actual results to differ materially from historical results or current expectations.These factors include, without limitation, a general deterioration in economic trends, ongoing competitive pressures in theretail industry, obtaining acceptable store locations, timely introduction and customer acceptance of its merchandise offer-ing, the Company’s ability to successfully open its new distribution center in a timely and cost-effective manner, theCompany’s ability to successfully extend its geographic reach into new markets, unseasonable weather trends, changes inthe level of consumer spending on or preferences for home-related merchandise, the Company’s ability to attract and retainthe retail talent necessary to execute its strategies, international political strife and the effects on the flow or price of mer-chandise from overseas, further terrorist attacks and our nation’s response thereto and the Company’s ability to implementand integrate various new systems and technologies. In addition, the Company’s corporate headquarters, one of its distrib-ution centers and approximately one-third of its stores are located in California. Therefore, a downturn in the Californiaeconomy or a major natural disaster there could significantly affect the Company’s operating results and financial condition.
In addition to the above factors, the retail industry is highly seasonal. The net sales of the Company for the fourth(Holiday) fiscal quarter are historically higher than each of the first three fiscal quarters. The Company has realized a sig-nificant portion of its profits in each fiscal year during the fourth fiscal quarter. If intensified price competition, lower thananticipated consumer demand or other factors were to occur during the fourth fiscal quarter, the Company’s fiscal yearresults could be adversely affected.
Results of OperationsFiscal 2001 Compared to Fiscal 2000
Net Sales Net sales increased $74.8 million, or 15.2%, to $568.5 million in fiscal 2001, a 52-week fiscal year, from$493.7 million in fiscal 2000, a 53-week fiscal year. The increase in net sales was attributable to new stores and a slightincrease in comparable store sales. Comparable store sales rose 0.3% for fiscal 2001, compared to a 4.6% increase infiscal 2000. Comparable store sales were impacted by lower sales in the third fiscal quarter due primarily to the weakeconomy, temporarily exacerbated by the September 11th tragedy and an impeded flow of goods to stores associatedwith the installation of a new warehousing system. Comparable store sales decreased 7.4% in the third fiscal quarter, yetrecovered to a 2.7% increase for the fourth fiscal quarter of 2001. As of February 2, 2002, the Company operated 150stores compared to 127 stores as of February 3, 2001.
20 CPWM CPWM 21
Gross Profit As a percentage of net sales, gross profit was 34.4% in fiscal 2001 and 35.9% in fiscal 2000. The reductionis substantially explained by a sales mix shift to lower margin consumable goods and higher markdowns to stimulate foottraffic. Reduced leverage on occupancy costs from a higher percentage of new stores in the base and increased trans-portation costs also negatively impacted margin. Newer stores generally have higher occupancy costs as a percentageof sales until they reach maturity.
Selling, General and Administrative (“SG&A”) Expenses As a percentage of net sales, SG&A expenses increased slightlyto 27.6% in the current year from 27.5% last year. The increase in the SG&A expense rate resulted primarily fromreduced sales leverage on lower comparable store sales growth, higher depreciation due to new stores and new infor-mation systems.
Store Preopening Expenses Store preopening expenses, which include grand opening advertising and preopening mer-chandise setup expenses, were $4.6 million in fiscal 2001 and $5.0 million in fiscal 2000. Expenses vary depending onthe particular store site and whether it is located in a new or existing market. The Company opened 23 stores in fiscal2001 compared to 24 stores in fiscal 2000.
Net Interest Expense Net interest expense, which includes interest on capital leases and interest expense net of interestincome, was $962,000 in fiscal 2001 and $666,000 in fiscal 2000. The increase in net interest expense was due to lowerinterest earned on investments due to a significant drop in the prime rate and higher average borrowings.
Income Taxes The Company’s effective tax rate was 39.0% in both fiscal 2001 and fiscal 2000.
Fiscal 2000 Compared to Fiscal 1999
Net Sales Net sales increased $91.4 million, or 22.7%, to $493.7 million in fiscal 2000, a 53-week fiscal year, from$402.3 million in fiscal 1999, a 52-week fiscal year. The increase in net sales was attributable to new stores and anincrease in comparable store sales. Comparable store sales rose 4.6% for fiscal 2000, as a result of a larger averagetransaction. As of February 3, 2001, the Company operated 127 stores compared to 103 stores as of January 29, 2000.
Gross Profit As a percentage of net sales, gross profit was 35.9% in fiscal 2000 and 36.5% in fiscal 1999. This change issubstantially explained by heavier promotional and clearance markdowns to meet competitive sales pressures, reducedleverage on occupancy costs from a higher percentage of new stores in the base, as well as increased fuel and trans-portation costs. Newer stores generally have higher occupancy costs as a percentage of sales until they reach maturity.
Selling, General and Administrative (“SG&A”) Expenses As a percentage of net sales, SG&A expenses increased slightlyto 27.5% in the current fiscal year from 27.4% in fiscal 1999. The increase in the SG&A expense rate resulted primarilyfrom higher advertising expenditures to respond to a more difficult retail environment in the fourth quarter.
Store Preopening Expenses Store preopening expenses, which include grand opening advertising and preopening mer-chandise setup expenses, were $5.0 million in fiscal 2000 and $3.7 million in fiscal 1999. Expenses vary depending onthe particular store site and whether it is located in a new or existing market. The Company opened 24 stores in fiscal2000 compared to 18 stores in fiscal 1999.
Net Interest Expense Net interest expense, which includes interest on capital leases and interest expense net of interestincome, was $666,000 in fiscal 2000 and $859,000 in fiscal 1999. The modest decrease in net interest expense was due tohigher interest rates on short-term investments and a modest increase in the average cash balances available for investment.
Income Taxes The Company’s effective tax rate was 39.0% in both fiscal 2000 and fiscal 1999.

Inflation
The Company does not believe that inflation has had a material effect on its financial condition and results of operationsduring the past three fiscal years. However, there can be no assurance that the Company’s business will not be affectedby inflation in the future.
Quarterly Results and Seasonality
The following table sets forth the Company’s unaudited quarterly operating results for the eight most recent quarterly periods.
Fiscal Quarters Ended
(In thousands, except per share data and number of stores) May 5, 2001 August 4, 2001 November 3, 2001 February 2, 2002
Net sales $112,915 $112,101 $113,544 $229,912Gross profit 37,261 37,342 36,294 84,627Net income (loss) 1,233 1,509 (2,321) 19,781Net income (loss) per share
Basic $ 0.06 $ 0.07 $ (0.11) $ 0.93Diluted $ 0.06 $ 0.07 $ (0.11) $ 0.91
Number of stores open at end of period 132 137 145 150
Fiscal Quarters Ended
(In thousands, except per share data and number of stores) April 29, 2000 July 29, 2000 October 28, 2000 February 3, 20011
Net sales $ 92,238 $ 92,765 $101,913 $206,745Gross profit 31,791 31,633 35,333 78,404Net income 1,133 1,449 283 18,807Net income per share
Basic $ 0.06 $ 0.07 $ 0.01 $ 0.90Diluted $ 0.05 $ 0.07 $ 0.01 $ 0.87
Number of stores open at end of period 109 113 122 127
1 The three months ended February 3, 2001 was a fourteen-week period as compared to the three months ended February 2, 2002 which was a thirteen-week period.
The Company’s business is highly seasonal, reflecting the general pattern associated with the retail industry of peak salesand earnings during the fourth quarter (Holiday) season. Due to the importance of the Holiday selling season, the fourthquarter of each fiscal year has historically contributed and the Company expects it will continue to contribute, a dispro-portionate percentage of the Company’s net sales and most of its net income for the entire fiscal year.* Any factors neg-atively affecting the Company during the Holiday selling season in any year, including unfavorable economic conditions,could have a material adverse effect on the Company’s financial condition and results of operations. The Company gen-erally experiences lower sales and earnings during the first three quarters and, as is typical in the retail industry, mayincur losses in these quarters. The results of operations for these interim periods are not necessarily indicative of theresults for a full fiscal year. In addition, the Company makes decisions regarding merchandise well in advance of the season in
22 CPWM CPWM 23
Fiscal Year
(In thousands, except per share and selected operating data) 2001 20001 1999 1998 1997
Statement of Operations Data:Net sales $568,472 $493,661 $402,292 $315,135 $260,494Cost of sales and occupancy 372,948 316,500 255,383 200,023 164,394
Gross profit 195,524 177,161 146,909 115,112 96,100Selling, general and administrative
expenses 156,832 135,923 110,108 89,261 75,238Store preopening expenses 4,612 5,044 3,671 2,927 2,744Income from operations 34,080 36,194 33,130 22,924 18,118Net interest expense 962 666 859 1,226 1,679Income before income taxes 33,118 35,528 32,271 21,698 16,439Income taxes 12,916 13,856 12,586 8,462 6,432Net income $ 20,202 $ 21,672 $ 19,685 $ 13,236 $ 10,007Net income per share — basic $ 0.95 $ 1.04 $ 0.97 $ 0.67 $ 0.53Net income per share — diluted $ 0.93 $ 1.00 $ 0.93 $ 0.65 $ 0.51Weighted average shares
outstanding — basic 21,355 20,813 20,321 19,724 18,734Weighted average shares
outstanding — diluted 21,756 21,568 21,189 20,363 19,574
Selected Operating Data:Percent of sales:
Gross profit 34.4% 35.9% 36.5% 36.5% 36.9%Selling, general and
administrative expenses 27.6% 27.5% 27.4% 28.3% 28.9%Income from operations 6.0% 7.3% 8.2% 7.3% 7.0%
Number of stores:Opened during period 23 24 18 15 12Closed during period — — — — —Open at end of period 150 127 103 85 70
Average sales per selling square foot2 $ 258 $ 273 $ 269 $ 258 $ 259Comparable store sales increase 0.3% 4.6% 8.6% 5.5% 7.0%
Balance Sheet Data (at period end):Working capital $117,381 $ 98,001 $ 80,663 $ 61,031 $ 52,630Total assets 317,940 252,865 214,699 173,141 152,000Note payable and capital lease
obligations, less current portion 33,216 13,474 14,416 15,110 15,692Total shareholders’ equity 198,709 169,121 138,335 109,403 95,609Current ratio 2.54 2.59 2.47 2.43 2.52Debt to equity ratio 17.2% 8.2% 10.9% 14.3% 16.9%
1 The Company’s fiscal year end is the Saturday closest to the end of January. Fiscal 2000 was 53 weeks and ended on February 3, 2001. All other fiscal years presented consisted of 52 weeks.
2 Calculated using net sales for stores open during the entire period divided by the selling square feet of such stores.
Five Year Summary of Selected Financial Data

which it will be sold, particularly for the Holiday selling season. Significant deviations from projected demand for prod-ucts could have a material adverse effect on the Company’s financial condition and results of operations, either by lostgross sales due to insufficient inventory or lost gross margin due to the need to mark down excess inventory.
The Company’s quarterly results of operations may also fluctuate based upon such factors as delays in the flow of mer-chandise, changes in the anticipated opening of the Company’s new distribution center in mid-2002, the number and timingof store openings and related store preopening expenses, the amount of net sales contributed by new and existing stores,the mix of products sold, the timing and level of markdowns, store closings, refurbishments or relocations, competitive fac-tors, changes in fuel and other shipping costs, general economic conditions, increases in utility costs in California and otherstates where the Company has operations, labor market fluctuations, changes in accounting rules and regulations andunseasonable weather conditions.
Liquidity and Capital Resources
The Company’s primary uses for cash are to fund operating expenses, inventory requirements and new store expansion.Historically, the Company has financed its operations primarily from internally generated funds and seasonal borrowingsunder the Company’s revolving credit facility. The Company believes that the combination of its cash and cash equiva-lents, internally generated funds and available borrowings under a revolving line of credit will be sufficient to finance itsworking capital and capital expenditure requirements for at least the next twelve months.*
Net cash provided by operating activities totaled $28.0 million for fiscal 2001, an increase of $5.9 million from fiscal2000. The increase in net cash provided by operating activities is primarily due to an increase in current liabilities, partiallyoffset by an increase in inventories and deposits on equipment for the Company’s second distribution center to be opened infiscal 2002.
Net cash used in investing activities, primarily capital expenditures for new stores, totaled $27.4 million in fiscal 2001compared to $26.5 million in fiscal 2000. The Company estimates that fiscal 2002 capital expenditures will approximate$26.5 million, including approximately $14.0 million for new stores, $5.0 million for information systems projects, themost significant of which is a warehouse management system for the Virginia distribution center (VDC), and $5.1 millionfor distribution center projects, primarily equipment to outfit the VDC.* Additionally $4.5 million of equipment purchasesfor the VDC will be financed under capital lease arrangements.*
Net cash provided by financing activities was $6.0 million in fiscal 2001 and $4.8 million in fiscal 2000 which were pri-marily proceeds from the issuance of common stock in connection with the Company’s stock option and stock purchase plans.
The table below presents significant contractual obligations of the Company at February 2, 2002.
Contractual Obligations (in millions) Less than 1 year 1-3 years 4-5 Years After 5 Years Total Amount Committed
Operating leases $ 42.3 $ 117.4 $ 70.4 $ 121.0 $ 351.1Capital leases (principal and interest) 4.0 12.1 8.0 52.0 76.1Total contractual obligations $ 46.3 $ 129.5 $ 78.4 $ 173.0 $ 427.2
As of February 2, 2002, the Company did not have any other debt outstanding. The Company has no financial arrange-ments involving special purpose entities or lease agreements commonly described as synthetic leases.
24 CPWM CPWM 25
The Company has an unsecured revolving line of credit agreement with a bank. The agreement allows for cash borrow-ings and letters of credit up to $25.0 million from January 1, 2002 through the expiration date of June 1, 2002. Interest ispaid monthly based on the Company’s election of the bank’s reference rate minus 0.75% (4.00% at February 2, 2002) orIBOR/LIBOR plus 0.9%. The Company is subject to certain financial covenants customary with such agreements. AtFebruary 2, 2002, the Company had no outstanding borrowings under the line of credit and $8.2 million outstanding underletters of credit.
The line of credit represents the Company’s only commercial credit facilities. The Company believes the line of credit issufficient to provide for borrowing needs.*
The Company has received two proposals for an unsecured credit facility to replace the agreement expiring on June 1,2002. The terms of each of the proposals provide up to a maximum of $75 million in available credit. The Company antici-pates it will be subject to certain financial covenants customary with such agreements.
New Accounting Pronouncements
The Company adopted SFAS No. 133 “Accounting for Derivative Instruments and Hedging Activities,” as amended, in fiscal 2001. Adoption of this statement does not have an impact on the Company’s current financial position or results of operations.
In July 2001, the Financial Accounting Standards Board (FASB) issued SFAS No. 142, “Goodwill and Other IntangibleAssets” (effective for the Company for fiscal 2002). SFAS No. 142 specifies that goodwill and certain intangible assets willno longer be amortized but instead will be subject to periodic impairment testing. The adoption of the new standard willreduce annual amortization expense by approximately $312,000, in fiscal 2002.*
In October 2001, the FASB issued SFAS No. 144, “Accounting for the Impairment or Disposal of Long-Lived Assets,”which becomes effective for the Company for fiscal 2002. Adoption of this standard is not expected to have a materialeffect on the Company’s financial position or results of operations.*
Quantitative and Qualitative Disclosure About Market Risk
The Company is exposed to financial market risks, which include changes in U.S. interest rates and, to a lesser extent,foreign exchange rates. The Company does not engage in financial transactions for trading or speculative purposes.
Interest Rate Risk The interest payable on the Company’s bank line of credit is based on variable interest rates and istherefore affected by changes in market interest rates. If interest rates on existing variable rate debt were to rise 40basis points (a 10% change from the Company’s borrowing rate as of February 2, 2002), the Company’s results of oper-ations and cash flows would not be materially affected. In addition, the Company has fixed and variable income invest-ments consisting of cash equivalents and short-term investments which are also affected by changes in market interest rates.
Foreign Currency Risks The Company enters into a significant amount of purchase obligations outside of the UnitedStates of America which are settled in U.S. Dollars and, therefore, the Company has only minimal exposure to foreigncurrency exchange risks. The Company does not hedge against foreign currency risks and believes that foreign currencyexchange risk is immaterial.

26 CPWM CPWM 27
February 2, February 3,
(In thousands, except share amounts) 2002 2001
AssetsCurrent assets:
Cash and cash equivalents $ 45,420 $ 38,815Merchandise inventories 131,344 109,829Other current assets 16,789 11,107
Total current assets 193,553 159,751Property and equipment, net 110,922 78,694Goodwill 4,178 4,340Other assets 9,287 10,080
Total assets $317,940 $252,865
Liabilities and Shareholders’ EquityCurrent liabilities:
Accounts payable $ 43,990 $ 31,592Income taxes payable 10,082 9,933Accrued compensation 8,305 8,506Other current liabilities 13,795 11,719
Total current liabilities 76,172 61,750Capital lease obligations 33,216 13,474Other long-term obligations 9,843 8,520Shareholders’ equity:
Preferred stock, $.01 par value: 5,000,000 shares authorized; none issued and outstanding — —
Common stock, $.01 par value: 67,500,000 shares authorized; issued and outstanding 21,549,643 and 21,005,337 shares 215 210
Additional paid-in capital 131,730 122,349Retained earnings 66,764 46,562
Total shareholders’ equity 198,709 169,121Total liabilities and shareholders’ equity $317,940 $252,865
See notes to consolidated financial statements.
Consolidated Balance Sheets
Stock Activity
The Company’s common stock is currently traded on the over-the-counter market and is quoted on the Nasdaq NationalMarket under the symbol “CPWM.” The following table sets forth the high and low closing sales prices, for the periodsindicated, as reported by the Nasdaq National Market.
Price Range
High Low
Fiscal Year Ended February 2, 2002First Quarter $ 27.81 $21.13Second Quarter 30.18 25.25Third Quarter 27.00 15.29Fourth Quarter 27.94 20.20
Fiscal Year Ended February 3, 2001First Quarter $ 35.19 $15.94Second Quarter 35.88 24.13Third Quarter 38.81 24.81Fourth Quarter 31.94 19.19
As of April 9, 2002, the Company estimated it has approximately 6,200 shareholders. The Company’s present policy isto retain its earnings to finance growth and does not intend to pay cash dividends.

28 CPWM CPWM 29
Fiscal Year Ended
February 2, February 3, January 29,
(In thousands, except per share amounts) 2002 2001 2000
Net sales $568,472 $493,661 $402,292Cost of sales and occupancy 372,948 316,500 255,383
Gross profit 195,524 177,161 146,909Selling, general and administrative expenses 156,832 135,923 110,108Store preopening expenses 4,612 5,044 3,671Income from operations 34,080 36,194 33,130Interest income 882 1,293 1,179Interest expense (1,844) (1,959) (2,038)Income before income taxes 33,118 35,528 32,271Income taxes 12,916 13,856 12,586Net income $ 20,202 $ 21,672 $ 19,685Net income per share
Basic $ 0.95 $ 1.04 $ 0.97Diluted $ 0.93 $ 1.00 $ 0.93
Weighted average shares outstandingBasic 21,355 20,813 20,321Diluted 21,756 21,568 21,189
See notes to consolidated financial statements.
Consolidated Statements of Operations
Common Stock Additional TotalPaid-in Retained Shareholders’
(In thousands, except shares) Shares Amount Capital Earnings Equity
Balance at January 30, 1999 19,936,517 $199 $103,999 $ 5,205 $109,403Stock issued under Employee
Stock Purchase Plan 9,332 — 249 249Exercise of stock options 576,035 6 4,761 4,767Tax effect of disqualifying
stock dispositions 4,231 4,231Net income 19,685 19,685Balance at January 29, 2000 20,521,884 205 113,240 24,890 138,335Stock issued under Employee
Stock Purchase Plan 15,768 — 380 380Exercise of stock options 467,685 5 5,138 5,143Tax effect of disqualifying
stock dispositions 3,591 3,591Net income 21,672 21,672Balance at February 3, 2001 21,005,337 210 122,349 46,562 169,121Stock issued under Employee
Stock Purchase Plan 16,417 — 355 355Exercise of stock options 527,889 5 6,029 6,034Tax effect of disqualifying
stock dispositions 2,997 2,997Net income 20,202 20,202Balance at February 2, 2002 21,549,643 $215 $131,730 $66,764 $198,709
See notes to consolidated financial statements.
Consolidated Statements of Shareholders’ Equity

30 CPWM CPWM 31
Fiscal Year Ended
February 2, February 3, January 29,
(In thousands) 2002 2001 2000
Cash Flows From Operating Activities:Net income $20,202 $21,672 $ 19,685Adjustments to reconcile net income to net cash
provided by operating activities:Depreciation and amortization 16,320 13,887 11,052Loss on disposal of property and equipment 203 407 173Deferred income taxes 234 (2,103) (2,425)Changes in assets and liabilities:
Merchandise inventories (21,515) (18,427) (20,722)Other assets (5,667) (3,172) (997)Accounts payable 12,398 6,520 6,515Other liabilities 5,832 3,317 9,119
Net cash provided by operating activities 28,007 22,101 22,400
Cash Flows From Investing Activities:Purchases of property and equipment (27,411) (26,529) (17,023)
Net cash used in investing activities (27,411) (26,529) (17,023)
Cash Flows From Financing Activities:Principal payments on capital lease obligations (380) (691) (582)Proceeds from the issuance of common stock 6,389 5,523 5,016
Net cash provided by financing activities 6,009 4,832 4,434
Net increase in cash and cash equivalents 6,605 404 9,811
Cash and Cash Equivalents:Beginning of period 38,815 38,411 28,600End of period $45,420 $38,815 $38,411
Supplemental Disclosures of Cash Flow Information:Cash paid for interest $ 912 $ 669 $ 960Cash paid for taxes $ 9,537 $11,672 $ 9,724
Non-cash Financing:Capital lease obligation related to distribution center $20,632 $ — $ —
See notes to consolidated financial statements.
Consolidated Statements of Cash Flows
Note 1. Summary of Business and Significant Accounting Policies
Business Cost Plus, Inc. and subsidiaries (the “Company”) is a specialty retailer of casual home living and entertainingproducts. At February 2, 2002, the Company operated 150 stores in 19 states under the names “World Market,” “CostPlus World Market,” “Cost Plus” and “Cost Plus Imports.” The Company’s product offerings are designed to provide solu-tions to customers’ casual home furnishing and home entertaining needs. The offerings include home decorating itemssuch as furniture and rugs, as well as a variety of tabletop and kitchen products. Cost Plus World Market stores alsooffer a number of gift and decorative accessories including collectibles, cards, wrapping paper and other seasonal items.In addition, Cost Plus World Market offers its customers a wide selection of gourmet foods and beverages, includingwine, micro-brewed and imported beer, coffee and tea. The Company accounts for its operations as one operating segment.
Fiscal Year The Company’s fiscal year end is the Saturday closest to the end of January. The current fiscal year endedFebruary 2, 2002 (fiscal 2001) contained 52 weeks. Consistent with the National Retail Federation fiscal calendar, the fis-cal year ended February 3, 2001 (fiscal 2000) contained 53 weeks. The fiscal year ended January 29, 2000 (fiscal 1999)consisted of 52 weeks.
Principles of Consolidation The consolidated financial statements include the accounts of Cost Plus, Inc. and its sub-sidiaries. Intercompany balances and transactions are eliminated in consolidation.
Accounting Estimates The preparation of financial statements in conformity with accounting principles generally acceptedin the United States of America requires management to make estimates and assumptions that affect the reportedamounts of assets and liabilities, including disclosures of contingent assets and liabilities, as of the date of the financialstatements, as well as the reported amounts of revenues and expenses during the reporting period. Actual results coulddiffer from those estimates.
Estimated Fair Value of Financial Instruments The carrying value of cash and cash equivalents, accounts receivable andaccounts payable approximates their estimated fair value.
Stock-Based Compensation The Company accounts for stock-based awards to employees using the intrinsic valuemethod prescribed by Accounting Principles Board (APB) Opinion No. 25, “Accounting for Stock Issued to Employees.” Thedisclosure requirements of Statement of Financial Accounting Standard (SFAS) No. 123, “Accounting for Stock-BasedCompensation,” are set forth in footnote 7 to the consolidated financial statements.
Cash Equivalents The Company considers all highly liquid investments with original maturities of three months or less ascash equivalents.
Inventories Inventories are stated at lower of cost or market under the retail inventory method (“RIM”), in which the val-uation of inventories at cost and the resulting gross margins are calculated by applying a calculated cost-to-retail ratioto the retail value of inventories. Cost includes certain buying and distribution costs related to the procurement, pro-cessing and transportation of merchandise. Management believes that the Company’s RIM provides an inventory valu-ation which reasonably approximates cost and results in carrying inventory at the lower of cost or market.*
Notes to Consolidated Financial Statements

32 CPWM CPWM 33
Property and Equipment Furniture, fixtures and equipment are stated at cost and are depreciated using the straight-linemethod over the following estimated useful lives:
Store fixtures and equipment 3-10 yearsLeasehold improvements Lesser of life of the asset or life of leaseComputer equipment and software 3-5 years
Capital Leases Noncancelable leases which meet the criteria of capital leases are capitalized as assets in property andequipment and amortized on a straight-line basis over their related lease terms.
Other Assets Other assets include lease rights and interests, deferred taxes and other intangibles. Lease rights and inter-ests are amortized on a straight-line basis over their related lease terms.
Goodwill Goodwill is amortized on a straight-line basis over 40 years. Accumulated amortization as of February 2,2002 and February 3, 2001 was $2.4 million and $2.2 million, respectively.
Impairment of Long-Lived and Intangible Assets The Company’s management believes that the carrying value of long-lived assets is appropriate and no adjustments to the carrying value of such assets is necessary.*
Self-Insurance The Company is self insured for workers’ compensation, general liability costs and certain health insur-ance plans with per occurrence and aggregate limits on losses. The self-insurance liability recorded in the financial state-ments is based on claims filed and an estimate of claims incurred but not yet reported.
Deferred Rent Certain of the Company’s operating leases contain predetermined fixed escalations of minimum rentalsduring the initial term. For these leases, the Company recognizes the related rental expense on a straight-line basis overthe life of the lease and records the difference between amounts charged to operations and amounts paid as deferredrent. As part of its lease agreements, the Company may receive certain lease incentives, primarily constructionallowances. These allowances are also deferred and are amortized on a straight-line basis over the life of the lease as areduction of rent expense. The cumulative net excess of recorded rent expense over lease payments made in the amountof $8.6 million and $7.6 million is reflected in other liabilities in the balance sheets as of February 2, 2002 and February3, 2001, respectively.
Revenue Recognition Revenue is recognized at the point of sale, net of estimated sales returns.
Advertising Expense Advertising costs, which include newspaper, television, radio and other media advertising, areexpensed as incurred. For the fiscal years 2001, 2000 and 1999, advertising costs were $30.6 million, $27.2 million and$21.7 million, respectively.
Store Preopening Expenses Store preopening expenses include grand opening advertising, labor, travel and hiringexpenses and are expensed as incurred.
Concentration of Credit Risk Financial instruments, which potentially subject the Company to concentration of credit risk,consist principally of cash and cash equivalents. The Company places its cash with high quality financial institutions. Attimes, such balances may be in excess of FDIC insurance limits.
Income Taxes Income taxes are accounted for using an asset and liability approach that requires recognition of deferredtax assets and liabilities for the expected future tax consequences of events that have been recognized in the Company’sconsolidated financial statements or tax returns.
Comprehensive Income The Company’s comprehensive income and net income are the same for all periods presented.
Net Income per Share SFAS No. 128 “Earnings Per Share,” requires earnings per share (EPS) to be computed and reportedas both basic EPS and diluted EPS. Basic EPS is computed by dividing net income by the weighted average number of com-mon shares outstanding for the period. Diluted EPS is computed by dividing net income by the weighted average number ofcommon shares and dilutive common stock equivalents (stock awards and stock options) outstanding during the period.Dilutive EPS reflects the potential dilution that could occur if options to issue common stock were exercised into commonstock. The following is a reconciliation of the weighted average number of shares used in the Company’s basic and dilutedper share computations.
Fiscal Year Ended
February 2, February 3, January 29,
(In thousands) 2002 2001 2000
Basic shares 21,355 20,813 20,321Effect of dilutive stock options 401 755 868Diluted shares 21,756 21,568 21,189
Certain options to purchase common stock were outstanding but were not included in the computation of diluted earn-ings per share because the effect would be anti-dilutive. For the fiscal years ended February 2, 2002, February 3, 2001and January 29, 2000, these options totaled 288,374; 241,049 and 46,036, respectively.
Impact of New Accounting Standards In June 1998, the FASB issued SFAS No. 133, “Accounting for DerivativeInstruments and Hedging Activities,” which was subsequently amended by SFAS Nos. 137 and 138 in June 2000. Theadoption of these standards did not have an impact on the financial position or results of operations of the Companybecause the Company does not have derivative instruments which require such valuation.
In June 2001, the FASB issued SFAS No. 142, “Goodwill and Other Intangible Assets.” The standard provides thatintangible assets with finite useful lives be amortized and that goodwill and intangible assets with indefinite lives not beamortized, but rather be tested at least annually for impairment. The Company will adopt the standard in fiscal 2002.Beginning in fiscal 2002, the Company will stop the amortization of goodwill with a net carrying value of $4.2 million fora net annual reduction in amortization of $162,000. The Company has evaluated such goodwill under the specified tran-sitional impairment test and does not believe such evaluation will result in an impairment loss.* The net carrying value ofother intangible assets included in other assets was $731,000. Amortization expense related to these assets in fiscal2001 totaled $132,000.
In June 2001, the FASB issued SFAS No. 143, “Accounting for Asset Retirement Obligations.” The Company does notbelieve the adoption of this statement in fiscal 2002 will have an impact on its consolidated financial statements.*
In August 2001, the FASB issued SFAS No. 144, “Accounting for the Impairment of Long-Lived Assets,” which addressesaccounting for and reporting of the impairment or disposal of long-lived assets that will be effective for fiscal year 2002.The Company has determined that the adoption of SFAS No. 144 will have no impact on its financial position or resultsof operations.*

34 CPWM CPWM 35
Note 2. Property and Equipment
Property and equipment consist of the following:
February 2, February 3,
(In thousands) 2002 2001
Land and land improvements $ 530 $ 530Building and leasehold improvements 61,221 52,872Furniture, fixtures and equipment 74,645 60,281Facilities under capital leases 45,296 27,449
Total 181,692 141,132Less accumulated depreciation and amortization (70,770) (62,438)Property and equipment, net $110,922 $ 78,694
Note 3. Other Assets
Other assets consist of the following:
February 2, February 3,
(In thousands) 2002 2001
Deferred income taxes $ 4,500 $ 4,454Lease rights and interests 3,146 3,146Other intangibles 1,400 1,220Other 4,027 4,521
Total 13,073 13,341Less accumulated amortization (3,786) (3,261)Other assets, net $ 9,287 $ 10,080
Note 4. Leases
The Company leases certain properties consisting of retail stores, warehouses, the corporate office and equipment.Store leases typically contain initial terms and provisions for two to three renewal options of five to ten years each, withrenewal periods from 2002 to 2040 at the then-current market rates. The retail store, warehouse and corporate officeleases generally provide that the Company assumes the maintenance and all or a portion of the property tax obligationson the leased property.
The minimum rental payments required under capital leases (with interest rates ranging from 8.1% to 12.7%) and non-cancelable operating leases with an initial lease term in excess of one year at February 2, 2002, are as follows:
(In thousands) Capital Leases Operating Leases Total
Fiscal year:2002 $ 4,038 $ 42,283 $ 46,3212003 4,038 41,138 45,1762004 4,038 39,347 43,3852005 3,999 36,898 40,8972006 3,989 35,909 39,898
Thereafter through the year 2040 55,966 155,518 211,484Minimum lease commitments 76,068 $351,093 $427,161Less amount representing interest (41,962)Present value of capital lease obligations 34,106Less current portion (890)Long-term portion $ 33,216
Accumulated depreciation related to capital leases was $12.1 million and $13.9 million at February 2, 2002 andFebruary 3, 2001, respectively. Depreciation expense related to capital leases is classified as occupancy cost. For fiscalyears 2001, 2000 and 1999 such depreciation expense was $964,000, $1.2 million and $1.2 million, respectively.Interest expense related to capital leases was $1.7 million, $1.8 million and $1.9 million for fiscal years 2001, 2000 and1999, respectively.
Minimum and contingent rental expense, which is based upon certain factors such as sales volume and property taxes,under operating and capital leases and sublease rental income are as follows:
Fiscal Year Ended
February 2, February 3, January 29,
(In thousands) 2002 2001 2000
Operating leases:Minimum rental expense $36,671 $28,488 $22,732Contingent rental expense 751 981 937Less sublease rental income (1,137) (1,070) (1,281)
Total $ 36,285 $28,399 $22,388Capital leases — contingent rental expense $ 1,119 $ 1,047 $ 1,072
Total minimum rental income to be received from noncancelable sublease agreements through 2011 is approximately$3.6 million as of February 2, 2002.

36 CPWM CPWM 37
Note 5. Revolving Line of Credit
The Company has an unsecured revolving line of credit agreement with a bank. The agreement allows for cash borrow-ings and letters of credit up to $25.0 million from January 1, 2002 through the expiration date of June 1, 2002. Interestis paid monthly based on the Company’s election of the bank’s reference rate minus 0.75% (4.00% at February 2, 2002)or IBOR/LIBOR plus 0.9%. The Company is subject to certain financial covenants customary with such agreements. AtFebruary 2, 2002, the Company had no outstanding borrowings under the line of credit and $8.2 million outstandingunder letters of credit. Interest expense under borrowing arrangements was $172,000, $167,000 and $132,000 for fis-cal years 2001, 2000 and 1999, respectively.
The Company has received two proposals for an unsecured credit facility to replace the agreement expiring June 1,2002. The terms of each of the proposals provide up to a maximum of $75 million in available credit. The Company antici-pates it will be subject to certain financial covenants customary with such agreements.
Note 6. Income Taxes
The provision for income taxes consists of the following:
Fiscal Year Ended
February 2, February 3, January 29,
(In thousands) 2002 2001 2000
Current:Federal $10,788 $13,442 $12,408State 1,894 2,517 2,603
Total current 12,682 15,959 15,011Deferred:
Federal 422 (1,788) (2,074)State (188) (315) (351)
Total deferred 234 (2,103) (2,425)Provision for income taxes $ 12,916 $13,856 $12,586
The differences between the U.S. federal statutory tax rate and the Company’s effective tax rate are as follows:
Fiscal Year Ended
February 2, February 3, January 29,
2002 2001 2000
U.S. federal statutory tax rate 35.0% 35.0% 35.0%State income taxes (net of U.S. federal
income tax benefit) 3.3 4.0 4.4Non-deductible expenses 0.2 0.3 0.3Other 0.5 (0.3) (0.7)Effective income tax rate 39.0% 39.0% 39.0%
Significant components of the Company’s deferred tax assets and liabilities are as follows:
February 2, February 3,
(In thousands) 2002 2001
Current deferred tax asset (liability):Deductible reserves and other $ (39) $ 241
Long-term deferred tax asset (liability):Deferred rent 3,154 2,963Capital leases 12 (860)Lease rights (484) (549)Depreciation 922 1,827Deferred compensation 546 414Other 350 659
Total 4,500 4,454Net deferred tax assets $ 4,461 $ 4,695
Note 7. Equity and Stock Compensation Plans
Shareholder Rights Plan Each outstanding share of common stock has a Preferred Share Purchase Right (expiring on June30, 2008) which is exercisable only upon the occurrence of certain change in control events.
Options The Company currently has options outstanding under two employee stock option plans: the 1994 Stock OptionPlan (1994 Plan) and the 1995 Stock Option Plan (1995 Plan). The 1994 Plan permitted the granting of options to employ-ees to purchase up to 1,940,976 shares of common stock at prices ranging from 85% to 100% of fair market value as ofthe date of grant. Options are exercisable over ten years and became fully vested upon the Company’s initial public offer-ing in April 1996. Upon approval of the 1995 Plan, the 1994 Plan was terminated except for options then outstanding.
The 1995 Plan permits the granting of options to employees and directors to purchase, at fair market value as of thedate of grant, up to 4,718,006 shares of common stock, less the aggregate number of shares relating to options grantedand outstanding under the 1994 Plan (821,120 at February 2, 2002). Options are exercisable over ten years and vest asdetermined by the Board of Directors, generally over three or four years. A 350,000 increase in the number of shares ofcommon stock reserved for issuance was approved by the Board of Directors in February 2001 and by shareholders inJune 2001.
On March 13, 1996, the Board of Directors approved the 1996 Director Stock Option Plan (Director Option Plan) whichwas last amended by the shareholders in June 2000. The Director Option Plan permits the granting of options to non-employee directors to purchase up to 253,675 shares of common stock at fair market value as of the date of grant. Optionsare exercisable over ten years and vest as determined by the Board of Directors, generally over four years.

38 CPWM CPWM 39
Additional Stock Plan Information The Company continues to account for its stock-based awards using the intrinsic valuemethod in accordance with APB Opinion No. 25, “Accounting for Stock Issued to Employees” and its related interpretations.Consequently, no compensation expense has been recognized in the financial statements for employee stock arrangements.
SFAS No. 123, “Accounting for Stock-Based Compensation,” establishes a fair value method of accounting for stockoptions and other equity instruments. SFAS No. 123 requires the disclosure of pro forma net income and earnings per shareas if the Company had adopted the fair value method. For determining pro forma earnings per share, the fair value of thestock options and employees’ purchase rights were estimated using the Black-Scholes option pricing model with the follow-ing assumptions:
Fiscal Year Ended
February 2, February 3, January 29,
Stock Options 2002 2001 2000
Expected life after vesting (in years) 1.8 1.8 1.8Expected volatility 62.5% 65.0% 63.0%Risk free interest rates 4.4% 6.4% 5.4%Weighted average fair value per share granted $ 12.10 $ 11.22 $ 12.35Expected dividends — — —
The Company’s calculations are based on a multiple option approach and forfeitures are recognized as they occur. Hadcompensation cost for these stock option and stock purchase plans been determined based on the fair value at the grantdates for awards under those plans consistent with the methods of SFAS No. 123, the Company’s net income and earn-ings per share would have been reduced to the pro forma amounts indicated below:
Fiscal Year Ended
February 2, February 3, January 29,
(In thousands, except per share data) 2002 2001 2000
Net income:As reported $20,202 $21,672 $19,685Pro forma 16,382 17,981 17,724
Basic net income per share:As reported $ 0.95 $ 1.04 $ 0.97Pro forma 0.77 0.86 0.87
Diluted net income per share:As reported $ 0.93 $ 1.00 $ 0.93Pro forma 0.75 0.83 0.84
A summary of activity under the previous option Plans is set forth below:WeightedAverage
Shares Exercise Price
Outstanding at January 30, 1999 (462,690 exercisable at a weighted average price of $6.89) 1,853,621 $ 9.36
Granted 644,509 22.27Exercised (576,035) 8.69Canceled and expired (202,918) 14.96
Outstanding at January 29, 2000 (366,508 exercisable at a weighted average price of $8.02) 1,719,177 13.80
Granted 623,137 19.72Exercised (467,685) 10.97Canceled and expired (143,106) 19.51
Outstanding at February 3, 2001 (659,880 exercisable at a weighted average price of $13.89) 1,731,523 16.21
Granted 1,000,532 22.60Exercised (527,889) 11.43Canceled and expired (234,063) 20.56
Outstanding at February 2, 2002 1,970,103 $ 20.23
The following table summarizes information about the weighted average remaining contractual life (in years) and theweighted average exercise prices for stock options both outstanding and exercisable as of February 2, 2002:
Options Outstanding Options ExercisableNumber Remaining Number
Exercise Price Range of Shares Life (Yrs.) Exercise Price of Shares Exercise Price
$ 2.56—$ 2.64 21,871 3.2 $ 2.60 21,871 $ 2.605.03— 7.00 88,629 4.3 5.79 88,629 5.798.00— 10.72 116,839 5.4 10.16 116,839 10.1613.11— 19.19 542,983 7.6 16.09 188,442 15.38
20.00— 27.17 981,682 9.1 22.71 131,111 23.7631.13— 33.81 218,099 7.4 32.44 155,395 32.56
1,970,103 8.0 $ 20.23 702,287 $ 18.27
Employee Stock Purchase Plan On March 13, 1996, the Board of Directors approved the 1996 Employee StockPurchase Plan (Purchase Plan). A total of 675,000 shares have been authorized for issuance under the Purchase Plan, ofwhich 565,319 remain available for issue as of February 2, 2002. Employees who work at least 20 hours per week andmore than five calendar months per calendar year and have been so employed for at least one year are eligible to havea specified percentage (not to exceed 10%) of each salary payment withheld to purchase common stock at 90% of itsfair market value as of the last day of the purchase period. During fiscal 2001, 2000 and 1999, employees purchasedapproximately 16,417; 15,768 and 9,332 shares, respectively, of the Company’s common stock under the Purchase Planat weighted average per-share prices of $21.65, $24.08 and $26.70, respectively.

Board of Directors and ShareholdersCost Plus, Inc.Oakland, California
We have audited the accompanying consolidated balance sheets of Cost Plus, Inc. and subsidiaries (the “Company”) asof February 2, 2002 and February 3, 2001, and the related consolidated statements of operations, shareholders’ equityand cash flows for each of the three fiscal years in the period ended February 2, 2002. These financial statements arethe responsibility of the Company’s management. Our responsibility is to express an opinion on these financial state-ments based on our audits.
We conducted our audits in accordance with auditing standards generally accepted in the United States of America.Those standards require that we plan and perform the audit to obtain reasonable assurance about whether the financialstatements are free of material misstatement. An audit includes examining, on a test basis, evidence supporting the amountsand disclosures in the financial statements. An audit also includes assessing the accounting principles used and significantestimates made by management, as well as evaluating the overall financial statement presentation. We believe that ouraudits provide a reasonable basis for our opinion.
In our opinion, such consolidated financial statements present fairly, in all material respects, the financial position of CostPlus, Inc. and subsidiaries as of February 2, 2002 and February 3, 2001 and the results of their operations and their cashflows for each of the three fiscal years in the period ended February 2, 2002 in conformity with accounting principles gener-ally accepted in the United States of America.
San Francisco, CaliforniaMarch 15, 2002
40 CPWM CPWM 41
Note 8. Employee Benefit Plans
The Company has a 401(k) plan for employees who meet certain service and age requirements. Participants may con-tribute up to 25% of their salaries to a maximum of $11,000 per year or participants age 50 or older may contribute upto 100% of their salaries to a maximum of $12,000 per year. The Company matches 50% of the employee’s contribu-tion, up to a maximum of 4% of base salary. The Company contributed approximately $442,000 in fiscal 2001,$328,000 in fiscal 2000 and $105,000 in fiscal 1999.
In addition, a non-qualified deferred compensation plan is available to certain employees whose benefits are limitedunder Section 401(k) of the Internal Revenue Service Code. Compensation deferrals approximated $685,000 for fiscal2001 and $514,000 for fiscal 2000.
Note 9. Commitments and Contingencies
The Company estimates that fiscal 2002 capital expenditures will approximate $26.5 million.* In addition, the Companyhas arranged for approximately $4.5 million of equipment purchases for a new distribution center to be financed undera capital lease arrangement.*
The Company is involved in litigation, claims and assessments incidental to its business, the disposition of which is notexpected to have a material effect on the Company’s financial position or results of operations.* It is possible, however, thatfuture results of operations for any particular quarterly or annual period could be materially affected by changes in theCompany’s assumptions related to these proceedings.* The Company accrues its best estimate of the probable cost for theresolution of claims. When appropriate, such estimates are developed in consultation with outside counsel handling thesematters and are based upon a combination of litigation and settlement strategies. To the extent additional information aris-es or the Company’s strategies change, it is possible that the Company’s best estimate of its probable liability in these mat-ters may change.*
Independent Auditors’ Report

Directors
Murray H. DasheChairman, Chief Executive Officer and President, Cost Plus, Inc.
Joseph H. Coulombe1
Independent Management Consultant
Barry J. Feld2
President, Chief Executive Officer, PCA International, Inc.
Professional Photography Service Firm
Danny W. Gurr1
President, The Quarto Group, Inc.
Illustrated Book Publisher
Kim D. Robbins2
Director of Product Development, Jack Nadel, Inc.
Direct Response Marketing Agent
Fredric M. Roberts2
President, F. M. Roberts and Company, Inc.
Investment Banking Firm
Thomas D. Willardson1
Independent Financial Consultant
1 Member of the Audit Committee of the Board of Directors.2 Member of the Compensation Committee of the Board of Directors.
Corporate Data
Corporate HeadquartersCost Plus, Inc.200 4th StreetOakland, CA 94607www.costplusworldmarket.com
Annual Report (Form 10-K)A copy of the Company’s fiscal 2001 Annual Report onForm 10-K as filed with the Securities and ExchangeCommission is available to shareholders by contacting theInvestor Relations Department at the address above or bycalling (510) 893-7300, ext. 3003.
Transfer Agent and RegistrarBank Bostonc/o EquiServe, LPBoston, MA(781) 575-3120
Independent AuditorsDeloitte & Touche LLPSan Francisco, CA
Corporate CounselWilson Sonsini Goodrich & RosatiPalo Alto, CA
Senior Officers
Murray H. DasheChairman of the Board, Chief Executive Officer and President
Gary D. WeatherfordExecutive Vice President, Operations
Michael J. AllenSenior Vice President, Store Operations
Joan S. FujiiSenior Vice President, Human Resources
Stephen L. HigginsSenior Vice President, Merchandising
John J. LuttrellSenior Vice President and Chief Financial Officer
Judith A. SoaresSenior Vice President, Cost Plus Management Services, Inc.
Officers
Jane L. BaughmanVice President, Financial Planning, Treasurer and Corporate Secretary
Gail H. FullerVice President, Divisional Merchandise Manager, Trend Director
Lisa J. GriffinVice President, Planning and Allocation
Patricia A. JuckettVice President, Marketing and Advertising
Cliff A. MarchVice President, Information Services
Clay E. SellandVice President, Controller
CPWM 4342 CPWM42 CPWM
Our new distribution center in Windsor, Virginia.
Directors, Officers and Corporate Data
stra
tegi
c de
sign
com
mun
icat
ions
: Tur
ner&
Ass
ocia
tes,
San
Fran
cisc
o /
phot
ogra
phy:
Ang
ie W
yant
/ w
ritin
g: T
erry
Lond
on /
prin
ting:
Wat
erm
ark
Pres
s, Sa
n Fr
anci
sco
ArizonaChandlerMesaPeoriaPhoenix (2)Scottsdale (2)Tucson (2)
CaliforniaBakersfieldBreaCitrus HeightsCity of IndustryColmaConcordEscondidoFremontFresnoGlendaleLa JollaLa MesaLakewoodLos Angeles (2)MarinMission ViejoModestoMountain ViewNorthridgeOaklandOceansideOntarioOxnardPalm DesertPasadenaPleasantonRosevilleSacramentoSan DiegoSan DimasSan FranciscoSan Jose (2)San Luis Obispo
San MateoSanta AnaSanta BarbaraSanta CruzSanta RosaSherman OaksStocktonTemeculaThousand OaksTorranceValenciaVallejoWalnut CreekWoodland Hills
ColoradoAuroraDenver (2)Thornton
GeorgiaAtlanta (4)
IdahoBoise
IllinoisAuroraChicago (2)EvanstonGurneeKildeerNorthbrookOak BrookOrland ParkSchaumburgSkokieSt. Charles
IndianaCarmel
MichiganAnn ArborAuburn HillsKentwoodLansingPortageRochester HillsShelby TownshipTroyWestland
MissouriBrentwoodChesterfieldSunset Hills
NebraskaOmaha
NevadaLas Vegas (2)Reno
New MexicoAlbuquerqueSanta Fe
North CarolinaCaryCharlotte (3)DurhamGreensboroWinston-Salem
OhioAkronAvonCincinnati (4)Columbus (3)Mayfield HeightsMentorNorth CantonNorth Olmsted
OregonClackamasEugeneGreshamPortlandTigard
TexasAustin (4)DallasFort WorthGrapevineHouston (5)Plano (2)San Antonio (3)
VirginiaArlingtonFairfaxFalls ChurchKingstowneSterling
WashingtonBellevueLynnwoodSeattleSpokaneTacomaTukwilaWoodinville
WisconsinMadison
*As of April 2, 2002
Cost Plus World Market Across the CountryOne Hundred Fifty-three Stores Nationwide*

Cost Plus World Market200 4th Street Oakland, California 94607www.costplusworldmarket.com