Cost Per Visit...Cost Per Visit Measuring Health Center Performance July 2018 7501 Wisconsin Avenue...
22
Cost Per Visit Measuring Health Center Performance July 2018 7501 Wisconsin Avenue Suite 1100W Bethesda, MD 20814 Phone 301.347.0400 www.nachc.com
Transcript of Cost Per Visit...Cost Per Visit Measuring Health Center Performance July 2018 7501 Wisconsin Avenue...
Cost Per VisitMeasuring Health
Center Performance
July 2018
7501 Wisconsin AvenueSuite 1100W Bethesda, MD 20814Phone 301.347.0400www.nachc.com
AcknowledgementsThis project was supported by the Health Resources and Services Administration (HRSA) of the U.S. Department of Health and Human Services (HHS) under cooperative agreement number U30CS16089, Technical Assistance to Community and Migrant Health Centers and Homeless for $6,375,000.00 with 0 percent of the total NCA project financed with non-federal sources. This information or content and conclusions are those of the author and should not be construed as the official position or policy of, nor should any endorsements be inferred by HRSA, HHS, or the U.S. Government.
Capital Link
Capital Link is a non-profit organization that has worked with hundreds of Health Centers and primary care associations for 20 years to plan capital projects, finance growth, and identify ways to improve performance. We provide innovative consulting services and extensive technical assistance with the goal of supporting and expanding community-based health care. Additionally, Capital Link works in partnership with primary care associations, the National Association of Community Health Centers, and other entities interested in improving access to capital for Health Centers. For more information, please visit www.caplink.org. National Association of Community Health Centers (NACHC)
In 2016, federally-funded Health Centers served nearly 25.9 million patients through over 10,000 sites located throughout all 50 states and U.S. territories.1 Because Health Centers serve patients regardless of their abilities to pay, they depend on public financial support and need a unified voice and common source for research, information, training, and advocacy. To address these needs, NACHC organized in 1971. NACHC works with Health Centers and state-based primary care organizations to serve Health Centers in a variety of ways:
• Provide research-based advocacy for Health Centers and their clients.• Educate the public about the mission and value of Health Centers.• Train and provide technical assistance to Health Center staff and boards.• Develop alliances with private partners and key stakeholders to foster the delivery of primary
health care services to communities in need.
As a founding partner of Capital Link, NACHC appoints some of Capital Link’s board members. The two organizations work closely together on issues related to Health Center capital development and economic impact. For more information, please visit www.nachc.com.
The initial version of this publication was authored by Eric S. Holzberg, Healthcare Services Group, American Express Tax and Business Services, Inc.; and Michael Holton, Assistant Director for Financial Management Assistance, NACHC.
1 Health Resources and Services Administration, Uniform Data System (UDS), 2016.
Cost Per Visit – Measuring Health Center Performance 3
IntroductionThis publication serves as an update to the original Issue Brief entitled Cost Per Visit—Measuring Health Center Performance, published in December 2003, which provided useful methodologies to help health centers calculate the component costs of care with a focus on cost per visit. Fast-forward 14 years and the discussion now is about not just tracking costs of care but also reducing costs through population health management, global payment methodologies, and tying reimbursements to outcomes. Throughout this evolution, one mantra has not changed: “you can’t control what you can’t measure.” It is more important than ever for health centers to understand their costs so they can accurately articulate their cost effectiveness and utilize this information to negotiate adequate reimbursement rates. In the not-too-distant future, misunderstanding the true cost of care could mean the difference between a health center thriving in a new payment environment and ending in financial failure.
Understanding costs (regardless of the reimbursement environment) requires a certain skill set and a methodical approach to allocating costs appropriately over a range of denominators (whether it’s visits, total patients, or risk-stratified groups of patients). This Issue Brief reviews in detail the process and methodology for allocating costs across visits, which is consistent with the current dominant health center reimbursement systems. A clear understanding of this basic methodology also provides a strong foundation for understanding costs in an evolving reimbursement environment.
The methodology for calculating costs as described in this document applies across all service lines—medical, dental, mental health (including substance abuse), and vision services—and it is important to include all relevant costs within each line.
All expenses at the organization can be classified into one of the following categories:
• Provider cost per visit• Direct support cost per visit (e.g., medical, dental, behavioral health, etc.)• Direct enabling cost per visit• Overhead cost per visit• Ancillary and other cost per visit
This Issue Brief examines the different categories of costs and explains factors impacting them. By distinguishing among components of costs per visit, organizations can begin to build a more nuanced understanding of their cost per patient and determine what operational factors most directly influence those costs.
It is more important than ever for health centers to understand their costs so they can accurately articulate
their cost effectiveness and utilize this information to negotiate adequate reimbursement rates.
Cost Per Visit – Measuring Health Center Performance 4
Components of Cost Per VisitProvider Cost Per Visit
Provider costs are direct costs incurred by billable providers delivering services. Provider cost does not include items such as subscriptions, continuing medical education, or other non-personnel services. It is very important to understand costs across all relevant service lines including medical, dental, behavioral health, and vision services. To better understand the challenges of accurately calculating cost per visit and eventually converting those figures into cost per visit or per patient, this Issue Brief will mainly describe costs for two service lines—medical and dental—but the same methodology can be applied across all service lines.
EXAMPLE 1: Eastside Family Health Center has eight full-time physicians who are paid combined total salaries of $1,400,000. The fringe benefit rate is twenty percent (20%) of total salaries, which is $280,000 additional cost. The total provider cost including fringe benefits is $1,680,000 ($1,400,000 plus $280,000). The eight full-time medical providers generate 25,000 billable visits over the period under analysis. Therefore, the provider cost per medical visit at Eastside Family Health Center is $67.20 ($1,680,000 divided by 25,000 visits).
EXAMPLE 2: Eastside Family Health Center has two full-time dentists who are paid combined total salaries of $260,000 and 1.5 full time dental hygienists who are paid combined salaries of 97,500. The fringe benefit rate is twenty percent (20%) of total salaries, which is $71,500 additional cost. The total provider cost including fringe benefits is $429,000 ($260,000 plus $97,500 plus $71,500). The 3.5 full-time providers generate 7,500 billable visits over the period under analysis. Therefore, the dental provider cost per visit at Eastside Family Health Center is $57.20 ($429,000 divided by 7,500 visits).
Although this publication will not go into depth on the calculation of the cost per patient, it is important to keep in mind that as long as medical and dental services are paid for under different insurance plans, patients utilizing both services at a health center can be considered by each service line as a unique patient. Should the health care reimbursement environment move toward a managed care payment model to cover all of the healthcare needs of a unique patient, then the allocation of some overhead and support costs (discussed below) could become more complicated.
Direct Support Cost Per Visit
Direct support costs are costs of staff or items that are directly involved in the delivery of healthcare services to patients. These include:
• Nurses (RNs and LPNs), medical receptionists, medical assistants, and clinical managed care support• Direct dental support (includes dental assistants and dental receptionists) • Mental health support (includes mental health receptionists)• Supplies
Cost Per Visit – Measuring Health Center Performance 5
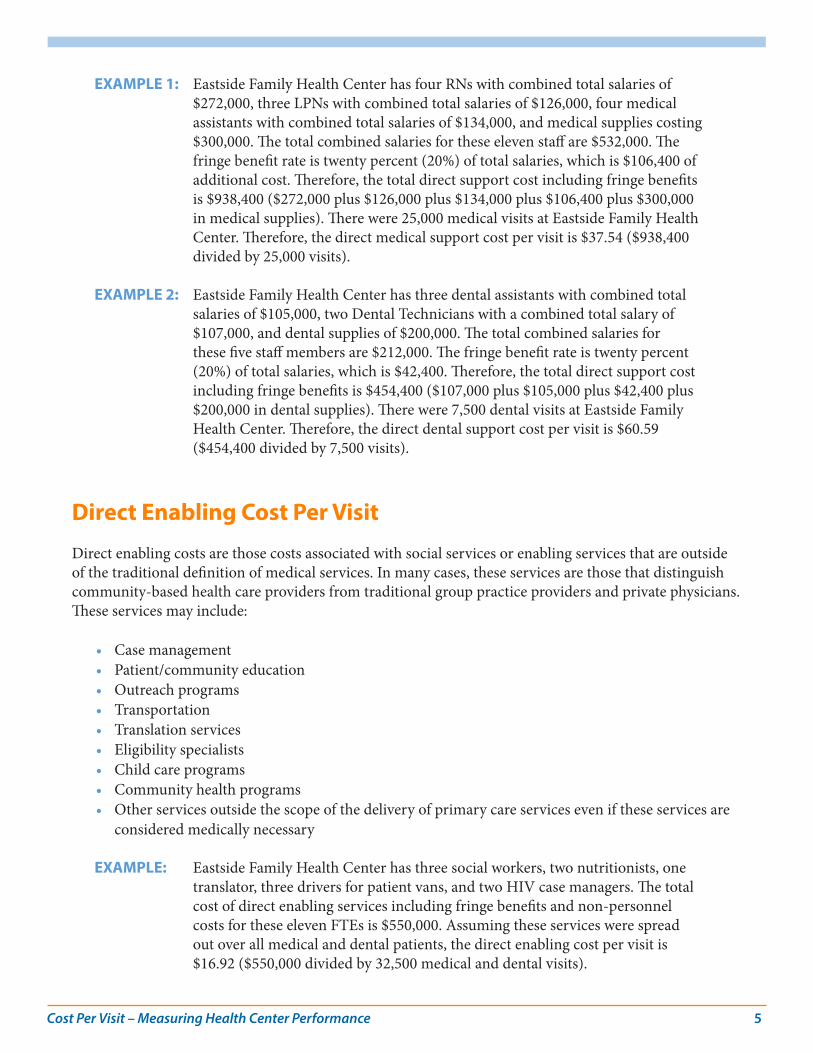
EXAMPLE 1: Eastside Family Health Center has four RNs with combined total salaries of $272,000, three LPNs with combined total salaries of $126,000, four medical assistants with combined total salaries of $134,000, and medical supplies costing $300,000. The total combined salaries for these eleven staff are $532,000. The fringe benefit rate is twenty percent (20%) of total salaries, which is $106,400 of additional cost. Therefore, the total direct support cost including fringe benefits is $938,400 ($272,000 plus $126,000 plus $134,000 plus $106,400 plus $300,000 in medical supplies). There were 25,000 medical visits at Eastside Family Health Center. Therefore, the direct medical support cost per visit is $37.54 ($938,400 divided by 25,000 visits).
EXAMPLE 2: Eastside Family Health Center has three dental assistants with combined total salaries of $105,000, two Dental Technicians with a combined total salary of $107,000, and dental supplies of $200,000. The total combined salaries for these five staff members are $212,000. The fringe benefit rate is twenty percent (20%) of total salaries, which is $42,400. Therefore, the total direct support cost including fringe benefits is $454,400 ($107,000 plus $105,000 plus $42,400 plus $200,000 in dental supplies). There were 7,500 dental visits at Eastside Family Health Center. Therefore, the direct dental support cost per visit is $60.59 ($454,400 divided by 7,500 visits).
Direct Enabling Cost Per Visit
Direct enabling costs are those costs associated with social services or enabling services that are outside of the traditional definition of medical services. In many cases, these services are those that distinguish community-based health care providers from traditional group practice providers and private physicians. These services may include:
• Case management• Patient/community education• Outreach programs• Transportation• Translation services• Eligibility specialists• Child care programs• Community health programs• Other services outside the scope of the delivery of primary care services even if these services are
considered medically necessary
EXAMPLE: Eastside Family Health Center has three social workers, two nutritionists, one translator, three drivers for patient vans, and two HIV case managers. The total cost of direct enabling services including fringe benefits and non-personnel costs for these eleven FTEs is $550,000. Assuming these services were spread out over all medical and dental patients, the direct enabling cost per visit is $16.92 ($550,000 divided by 32,500 medical and dental visits).
Cost Per Visit – Measuring Health Center Performance 6
Overhead Cost Per Visit
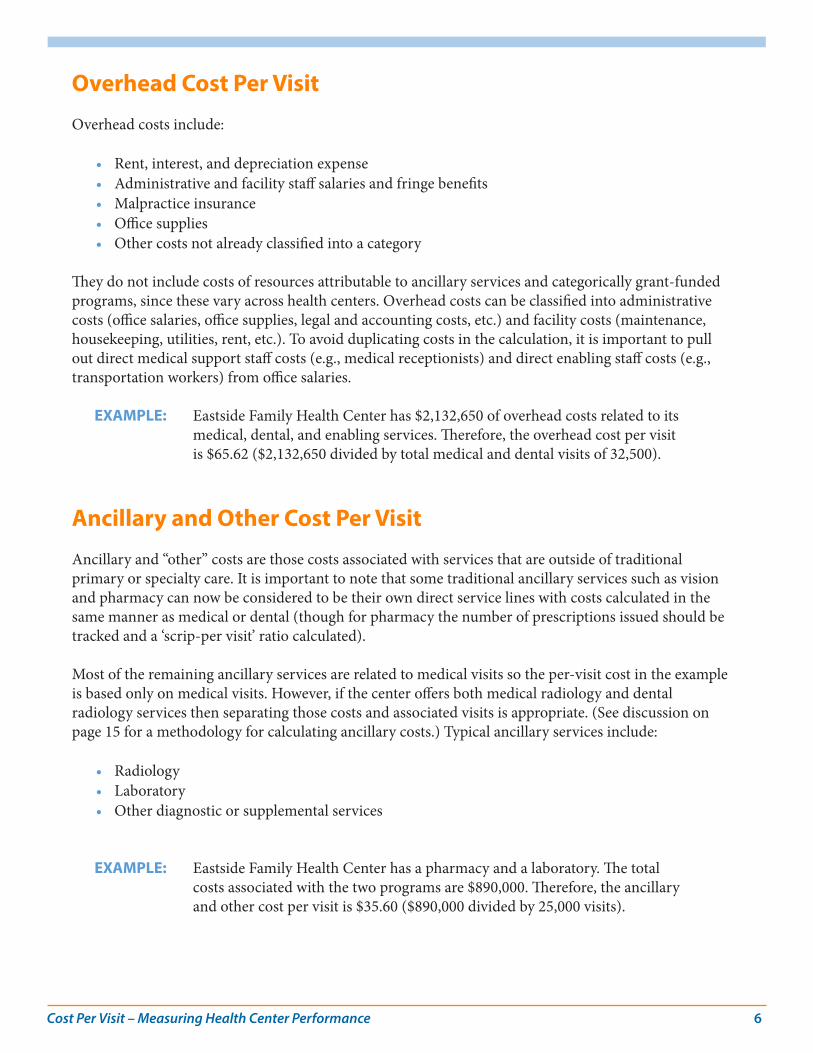
Overhead costs include:
• Rent, interest, and depreciation expense• Administrative and facility staff salaries and fringe benefits• Malpractice insurance• Office supplies• Other costs not already classified into a category
They do not include costs of resources attributable to ancillary services and categorically grant-funded programs, since these vary across health centers. Overhead costs can be classified into administrative costs (office salaries, office supplies, legal and accounting costs, etc.) and facility costs (maintenance, housekeeping, utilities, rent, etc.). To avoid duplicating costs in the calculation, it is important to pull out direct medical support staff costs (e.g., medical receptionists) and direct enabling staff costs (e.g., transportation workers) from office salaries.
EXAMPLE: Eastside Family Health Center has $2,132,650 of overhead costs related to its medical, dental, and enabling services. Therefore, the overhead cost per visit is $65.62 ($2,132,650 divided by total medical and dental visits of 32,500).
Ancillary and Other Cost Per Visit
Ancillary and “other” costs are those costs associated with services that are outside of traditional primary or specialty care. It is important to note that some traditional ancillary services such as vision and pharmacy can now be considered to be their own direct service lines with costs calculated in the same manner as medical or dental (though for pharmacy the number of prescriptions issued should be tracked and a ‘scrip-per visit’ ratio calculated).
Most of the remaining ancillary services are related to medical visits so the per-visit cost in the example is based only on medical visits. However, if the center offers both medical radiology and dental radiology services then separating those costs and associated visits is appropriate. (See discussion on page 15 for a methodology for calculating ancillary costs.) Typical ancillary services include:
• Radiology• Laboratory• Other diagnostic or supplemental services
EXAMPLE: Eastside Family Health Center has a pharmacy and a laboratory. The total costs associated with the two programs are $890,000. Therefore, the ancillary and other cost per visit is $35.60 ($890,000 divided by 25,000 visits).
Cost Per Visit – Measuring Health Center Performance 7
Summary of Components of Cost Per Visit
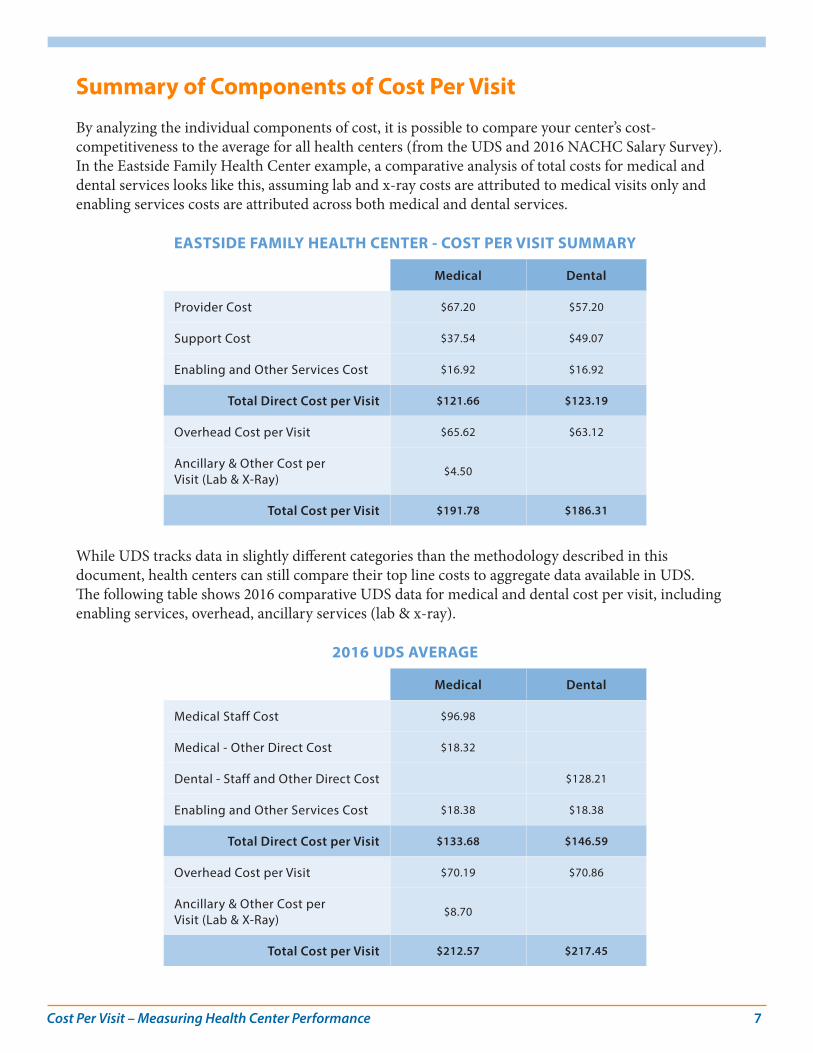
By analyzing the individual components of cost, it is possible to compare your center’s cost-competitiveness to the average for all health centers (from the UDS and 2016 NACHC Salary Survey). In the Eastside Family Health Center example, a comparative analysis of total costs for medical and dental services looks like this, assuming lab and x-ray costs are attributed to medical visits only and enabling services costs are attributed across both medical and dental services.
EASTSIDE FAMILY HEALTH CENTER - COST PER VISIT SUMMARY
Medical Dental
Provider Cost $67.20 $57.20
Support Cost $37.54 $49.07
Enabling and Other Services Cost $16.92 $16.92
Total Direct Cost per Visit $121.66 $123.19
Overhead Cost per Visit $65.62 $63.12
Ancillary & Other Cost per Visit (Lab & X-Ray)
$4.50
Total Cost per Visit $191.78 $186.31
While UDS tracks data in slightly different categories than the methodology described in this document, health centers can still compare their top line costs to aggregate data available in UDS. The following table shows 2016 comparative UDS data for medical and dental cost per visit, including enabling services, overhead, ancillary services (lab & x-ray).
2016 UDS AVERAGE
Medical Dental
Medical Staff Cost $96.98
Medical - Other Direct Cost $18.32
Dental - Staff and Other Direct Cost $128.21
Enabling and Other Services Cost $18.38 $18.38
Total Direct Cost per Visit $133.68 $146.59
Overhead Cost per Visit $70.19 $70.86
Ancillary & Other Cost per Visit (Lab & X-Ray)
$8.70
Total Cost per Visit $212.57 $217.45
Cost Per Visit – Measuring Health Center Performance 8
As a companion piece to this document, Capital Link has prepared Cost of Care Trends for Community Health Centers, which provides median national cost trends for all services tracked by UDS from 2012-2016, to provide general comparative data for health center benchmarking.
Provider Cost Per VisitFour key factors that impact provider cost per visit are:
• Compensation• Productivity• Non-Clinical Activities• Provider Staffing Mix
Provider Compensation & Productivity
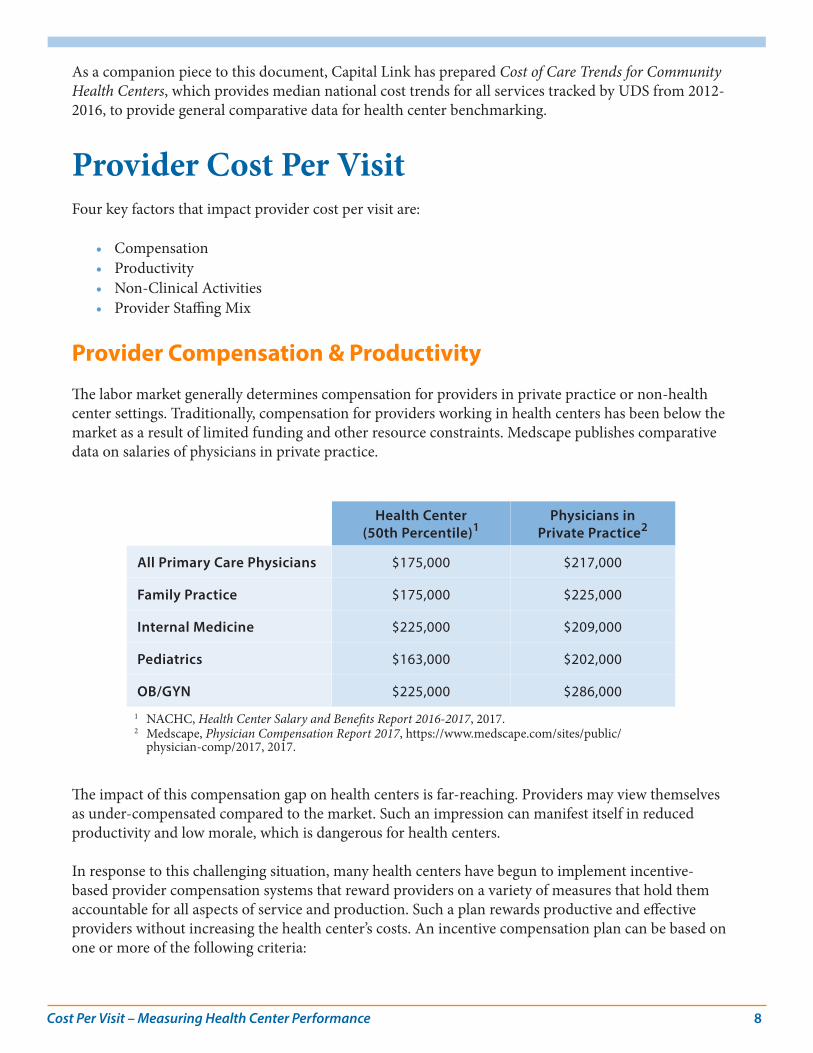
The labor market generally determines compensation for providers in private practice or non-health center settings. Traditionally, compensation for providers working in health centers has been below the market as a result of limited funding and other resource constraints. Medscape publishes comparative data on salaries of physicians in private practice.
Health Center (50th Percentile)1
Physicians in Private Practice2
All Primary Care Physicians $175,000 $217,000
Family Practice $175,000 $225,000
Internal Medicine $225,000 $209,000
Pediatrics $163,000 $202,000
OB/GYN $225,000 $286,000
1 NACHC, Health Center Salary and Benefits Report 2016-2017, 2017.2 Medscape, Physician Compensation Report 2017, https://www.medscape.com/sites/public/
physician-comp/2017, 2017.
The impact of this compensation gap on health centers is far-reaching. Providers may view themselves as under-compensated compared to the market. Such an impression can manifest itself in reduced productivity and low morale, which is dangerous for health centers.
In response to this challenging situation, many health centers have begun to implement incentive-based provider compensation systems that reward providers on a variety of measures that hold them accountable for all aspects of service and production. Such a plan rewards productive and effective providers without increasing the health center’s costs. An incentive compensation plan can be based on one or more of the following criteria:
Cost Per Visit – Measuring Health Center Performance 9
• Productivity• Patients/members satisfaction• Quality• Effectiveness at managing utilization• Peer review• Compliance with the health center’s policies
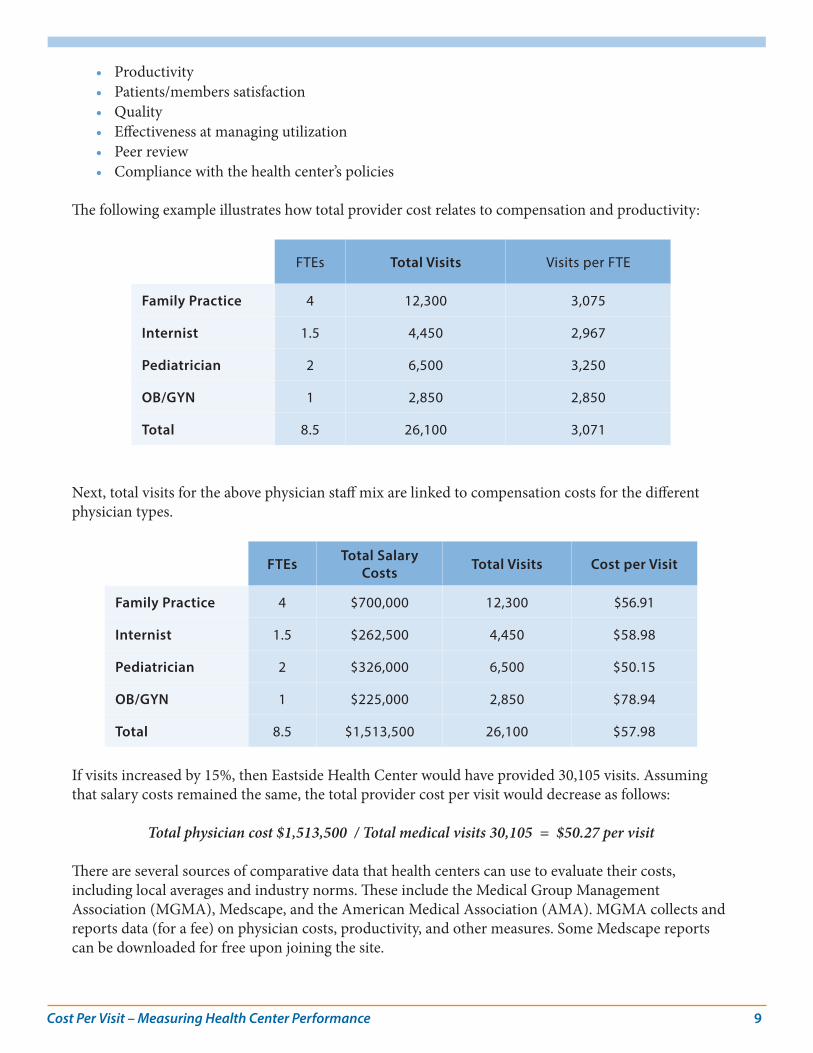
The following example illustrates how total provider cost relates to compensation and productivity:
FTEs Total Visits Visits per FTE
Family Practice 4 12,300 3,075
Internist 1.5 4,450 2,967
Pediatrician 2 6,500 3,250
OB/GYN 1 2,850 2,850
Total 8.5 26,100 3,071
Next, total visits for the above physician staff mix are linked to compensation costs for the different physician types.
FTEs Total Salary Costs Total Visits Cost per Visit
Family Practice 4 $700,000 12,300 $56.91
Internist 1.5 $262,500 4,450 $58.98
Pediatrician 2 $326,000 6,500 $50.15
OB/GYN 1 $225,000 2,850 $78.94
Total 8.5 $1,513,500 26,100 $57.98
If visits increased by 15%, then Eastside Health Center would have provided 30,105 visits. Assuming that salary costs remained the same, the total provider cost per visit would decrease as follows:
Total physician cost $1,513,500 / Total medical visits 30,105 = $50.27 per visit There are several sources of comparative data that health centers can use to evaluate their costs, including local averages and industry norms. These include the Medical Group Management Association (MGMA), Medscape, and the American Medical Association (AMA). MGMA collects and reports data (for a fee) on physician costs, productivity, and other measures. Some Medscape reports can be downloaded for free upon joining the site.
Cost Per Visit – Measuring Health Center Performance 10
Summary
• An increase of 15% in provider productivity results in a decrease of $7.78 per visit. Clearly, productivity is one of the main drivers of provider cost per visit. The more visits a health center performs, the greater the portion of costs allocated. In a fee-for-service environment, each visit serves to increase the health center’s contribution margin. Under a managed care, per-member-per-month (PMPM) reimbursement system, greater productivity has a less direct effect on contribution margins.
• As the health care industry slowly transforms to a managed care or pay-for-performance reimbursement structure, health centers will need to refine how they track provider productivity as the incentives will change. Improved productivity in the future will potentially allow for increased panel sizes, which in turn will lead to higher revenue. The growth of team medicine will also mean that providers are not the only FTEs to be tracked and tied to productivity targets and, potentially, incentives.
Provider Productivity & Relative Value Units
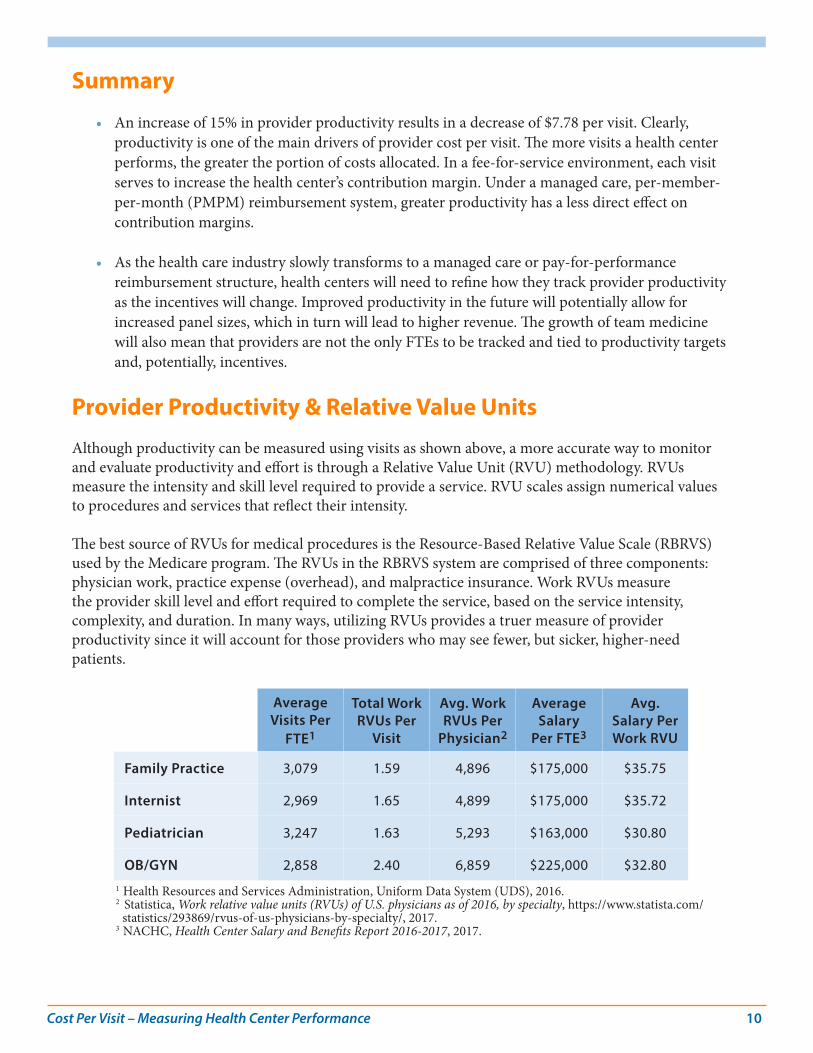
Although productivity can be measured using visits as shown above, a more accurate way to monitor and evaluate productivity and effort is through a Relative Value Unit (RVU) methodology. RVUs measure the intensity and skill level required to provide a service. RVU scales assign numerical values to procedures and services that reflect their intensity.
The best source of RVUs for medical procedures is the Resource-Based Relative Value Scale (RBRVS) used by the Medicare program. The RVUs in the RBRVS system are comprised of three components: physician work, practice expense (overhead), and malpractice insurance. Work RVUs measure the provider skill level and effort required to complete the service, based on the service intensity, complexity, and duration. In many ways, utilizing RVUs provides a truer measure of provider productivity since it will account for those providers who may see fewer, but sicker, higher-need patients.
Average Visits Per
FTE1
Total Work RVUs Per
Visit
Avg. Work RVUs Per
Physician2
Average Salary
Per FTE3
Avg. Salary Per Work RVU
Family Practice 3,079 1.59 4,896 $175,000 $35.75
Internist 2,969 1.65 4,899 $175,000 $35.72
Pediatrician 3,247 1.63 5,293 $163,000 $30.80
OB/GYN 2,858 2.40 6,859 $225,000 $32.801 Health Resources and Services Administration, Uniform Data System (UDS), 2016. 2 Statistica, Work relative value units (RVUs) of U.S. physicians as of 2016, by specialty, https://www.statista.com/
statistics/293869/rvus-of-us-physicians-by-specialty/, 2017.3 NACHC, Health Center Salary and Benefits Report 2016-2017, 2017.
Cost Per Visit – Measuring Health Center Performance 11
Total work RVUs per visit is greatest for OB/GYNs at 2.4, which is reasonable considering the high intensity of many of the procedures they perform, such as deliveries. In contrast, the family practice physician provided 1.594 Work RVUs of service per visit.
Summary
• Average work RVUs per physician is used to evaluate individual physicians. For example, if Dr. Ruiz provided 4,976 Work RVUs of service in 3,500 Visits (1.42 RVU/visit), while Dr. Jones provided 5,200 Work RVUs of service in 3,900 Visits (1.33 RVUs per visit), then one could argue that Dr. Ruiz was more productive than Dr. Jones even though Dr. Jones produced more RVUs and documented more visits.
• Average salary per work RVU measures the cost to the health center for one unit of service. In the example above, OB/GYNs have the highest salary with $225,000. However, this OB/GYN also provides more units of service per visit. In essence, the measure indicates how much the health center gets for its dollar. Why is this important? Some payers reimburse health centers based on the intensity of the service provided. Thus, the lower the salary cost per Work RVU the higher the return on the health center dollar.
...nearly everyone at a health center has an impact upon the number of patients treated in a day.
Whose Responsibility Is Productivity?
Productivity is an organizational issue. At many organizations, senior management monitors productivity on a regular basis. Frequently this information is tracked and reported by the medical director. All staff—from senior management to receptionist and from nurses to specialty physicians—are responsible for organizational productivity.
If patients are not being moved efficiently through the health center from the front desk to the exam rooms, then they will have longer wait times and providers will not have patients to see. If providers do not have staggered hours, then exam room utilization may become clogged at peak times, while early and late in the day there is excess capacity. If medical records are not pulled the day before for the next-day patients, then charts may not be ready when the providers enter the exam rooms to treat patients. These examples illustrate how nearly everyone at a health center has an impact upon the number of patients treated in a day.
Cost Per Visit – Measuring Health Center Performance 12
Providers & Non-Billable ActivitiesWhen analyzing provider cost per visit, it is necessary to also take into account the non-billable factors related to provider performance.
• Standard workweek: The number of hours in the standard workweek needs to be taken into account. Whether providers are expected to work 36 or 40 hours will impact the number of scheduled clinic sessions.
• Number of clinic sessions: As with standard hours, it is necessary to take into account the number of sessions in a week that both full- and part-time providers are expected to engage with patients face-to-face. An organization that only requires eight, four-hour clinic sessions per week is probably not going to generate as many billable hours (or encounters) as one that requires nine or 10 sessions.
• Inpatient and on-call visits: Time when primary care physicians visit patients in the hospital or when they answer off-hour patient telephone calls should be factored into measurement of their total effort. If inpatient and on-call time reduce the hours spent in the health center, the volume of clinic encounters may be adversely impacted.
• Clinical teams: Effective teams require time for collaborative work (i.e., team huddles, case reviews, and inter-visit patient follow-up) and quality monitoring (i.e., peer review, performance improvement initiatives, clinical research, student mentoring, and clinical competency development). Although alternative payment methodologies show promise for reimbursement of this time, these activities are generally not definable as billable encounters.
• Travel time: How is travel time between sites or to the hospital taken into account in evaluating a provider’s expected billable encounters? For example, a provider that needs to travel to an alternate site mid-day will decrease the time available for delivery of billable services.
• Encounter and other forms: How much time do providers spend filling out forms or entering data into the EHR system? Can the process be streamlined with improved templates, process flows, and/or the use of scribes? Can automation enhance and reduce administrative effort?
• Continuing medical education (CME): How much time is devoted to CME? Is that time well utilized to optimize the efficiency and effectiveness of patient services?
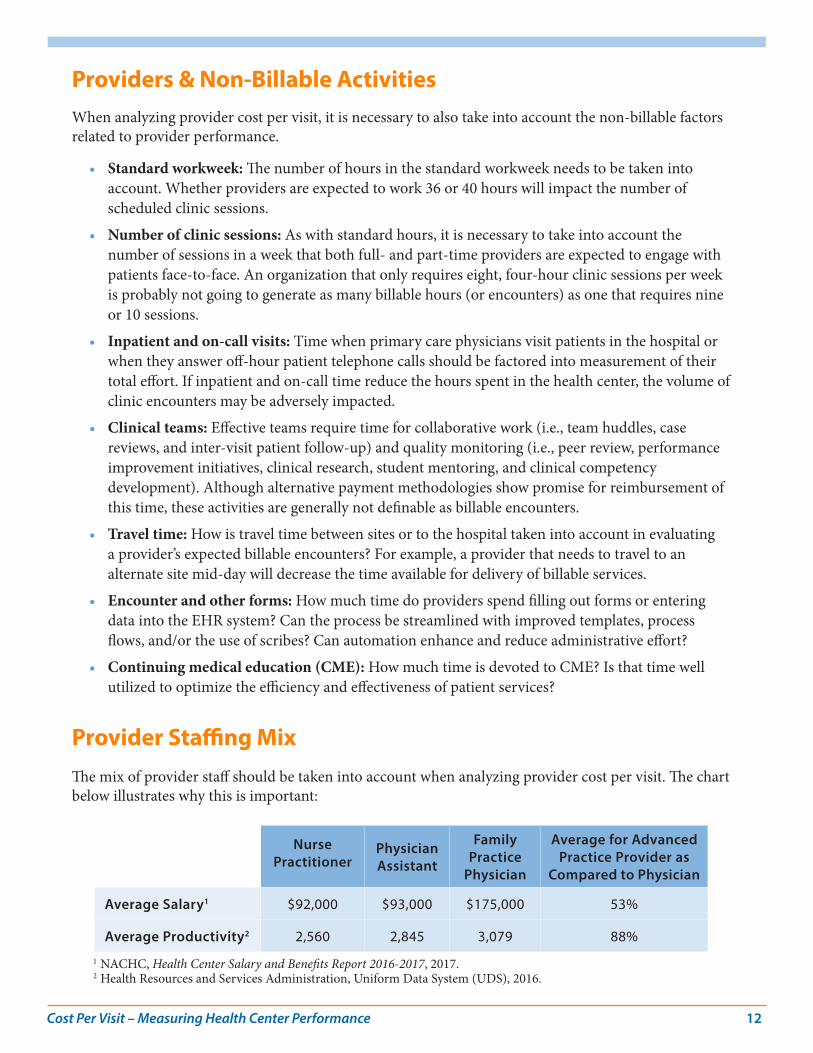
Provider Staffing MixThe mix of provider staff should be taken into account when analyzing provider cost per visit. The chart below illustrates why this is important:
Nurse Practitioner
Physician Assistant
Family Practice
Physician
Average for Advanced Practice Provider as
Compared to Physician
Average Salary1 $92,000 $93,000 $175,000 53%
Average Productivity2 2,560 2,845 3,079 88%
1 NACHC, Health Center Salary and Benefits Report 2016-2017, 2017.2 Health Resources and Services Administration, Uniform Data System (UDS), 2016.
Cost Per Visit – Measuring Health Center Performance 13
In general, the average Advanced Practice Provider (APP), which includes nurse practitioners and physician assistants in this example, earns approximately 53% of the average physician yet provides a higher relative proportion of patient visits (88%). While APP’s cannot provide the full range of services for which a physician is trained to perform, APPs are an effective resource for increasing visits in a cost-effective manner.
Direct Support Staff Cost Per VisitDirect medical support staff are FTEs directly involved in supporting the clinical services provided to patients at the health center. They include:
• Medical support supervisors• Nurses, including registered nurses (RNs) and licensed practical nurses (LPNs)• Medical attendants, phlebotomists, and dental assistants• Medical, dental, and behavioral health receptionists• Nurses’ aides and patient care coordinators
Note that this is not an exhaustive list—some health centers may employ other support staff positions depending upon the major service lines offered. Below is a description of the major factors that impact the direct support staff cost per visit.
Productivity: Support staff are an integral component of health center provider productivity. As described above, support staff are generally a cost-effective approach to increasing productivity. By empowering support staff to perform lower level procedures such as weighing patients, taking blood pressure readings and providing patient education, physician and APP time is freed up to perform more complex services. Not only does this division of labor benefit the patient population, but also the health center by increasing revenues.
Staffing Mix: The optimal medical support staffing mix should be driven by both function and cost. Each support staff has unique training and job skills. For example, a Registered Nurse can perform at a higher level than a Licensed Practical Nurse, although RNs earn higher average salaries. Following Medicare reimbursement policy, RNs are allowed to perform, and bill for, a basic office visit for an established (returning) patient (represented by CPT code 99211). Having an RN perform this procedure in place of a physician is a cost-effective approach to serving patients. RNs nationally earn on average $68,0001 compared to the $175,000 earned by the average health center family practice physician. By contrast, the office visits performed by LPNs are not reimbursable.
Ratio of Support Staff to Providers: How many support staff a health center employs impacts the direct support cost per visit. The average health center has:2
• 1.89 full time equivalent (FTE) medical support staff (nurses, other medical personnel) per medical provider FTE (including physicians, nurse practitioners, physician assistants and certified nurse midwives)
• 1.41 FTE dental support staff (dental assistants, aides, techs) per dental provider FTE
1 Medscape, RN/LPN Salary Report for non-hospital-based medical office/ urgent care clinic, http://www.medscape.com/features/slideshow/nurse-salary-report-2016#page=8, 2016.
2 Health Resources and Services Administration, Uniform Data System (UDS), 2016.
Cost Per Visit – Measuring Health Center Performance 14
• .32 FTE mental health support staff (other mental health staff) per mental health provider FTE
For some perspective on the relationship between productivity and support staff ratios, based on 2016 UDS data, the average medical support staff ratio was 2.28 for health centers at or above the 75th percentile for medical provider productivity. For the health centers at or below the 25th percentile of medical provider productivity (less productive), the average medical support staff ratio was 1.58.
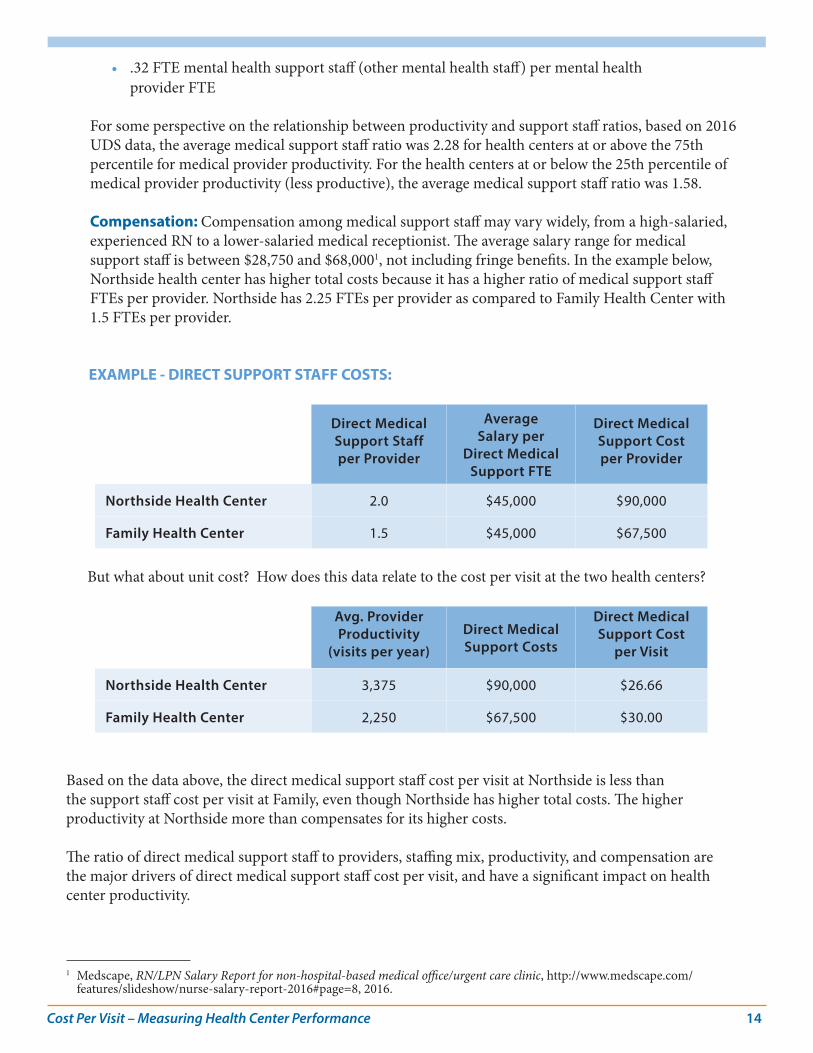
Compensation: Compensation among medical support staff may vary widely, from a high-salaried, experienced RN to a lower-salaried medical receptionist. The average salary range for medical support staff is between $28,750 and $68,0001, not including fringe benefits. In the example below, Northside health center has higher total costs because it has a higher ratio of medical support staff FTEs per provider. Northside has 2.25 FTEs per provider as compared to Family Health Center with 1.5 FTEs per provider.
EXAMPLE - DIRECT SUPPORT STAFF COSTS:
Direct Medical Support Staff per Provider
Average Salary per
Direct Medical Support FTE
Direct Medical Support Cost per Provider
Northside Health Center 2.0 $45,000 $90,000
Family Health Center 1.5 $45,000 $67,500
But what about unit cost? How does this data relate to the cost per visit at the two health centers?
Avg. Provider Productivity
(visits per year)Direct Medical Support Costs
Direct Medical Support Cost
per Visit
Northside Health Center 3,375 $90,000 $26.66
Family Health Center 2,250 $67,500 $30.00
Based on the data above, the direct medical support staff cost per visit at Northside is less than the support staff cost per visit at Family, even though Northside has higher total costs. The higher productivity at Northside more than compensates for its higher costs.
The ratio of direct medical support staff to providers, staffing mix, productivity, and compensation are the major drivers of direct medical support staff cost per visit, and have a significant impact on health center productivity.
1 Medscape, RN/LPN Salary Report for non-hospital-based medical office/urgent care clinic, http://www.medscape.com/features/slideshow/nurse-salary-report-2016#page=8, 2016.
Cost Per Visit – Measuring Health Center Performance 15
A key consideration for health centers in a competitive, cost-driven, managed care environment
is the identification of cost-effective ancillary services that can be provided on-site.
Ancillary Care Cost Per VisitAncillary services may include laboratory, radiology, vision care, pharmacy services, or any other supplementary healthcare services that could be performed on- or off-site. The major factors driving the costs of providing ancillary services are the range of services provided and the utilization of those services, as described below.
Range of Services Provided
Ancillary costs depend upon the services the health center chooses to provide to patients. Due to the wide variation throughout the country, there is no “standard” set of ancillary services offered at health centers.
On-Site vs. Off-Site: A key consideration for health centers in a competitive, cost-driven, managed care environment is the identification of cost-effective ancillary services that can be provided on-site. Those ancillary services that are not cost-effective can be outsourced to local providers, as long as the services provided are of high quality and the health center arranges for services to non-insured health center patients. Payment for outsourced ancillary services varies among geographic regions and across settings (such as rural vs. urban, hospital-based vs. freestanding).
Availability of Services: Beyond cost, another consideration is the availability of services. Health centers in rural areas are more likely to provide ancillary services on-site because of the limited availability of off-site providers. Because health centers are mission-driven institutions, ensuring patient access to off-site ancillary providers is a key consideration.
Fixed and Variable Costs: In determining the mix of ancillary services, health centers also need to consider the fixed and variable costs of offering individual services. These costs may include equipment purchase costs and depreciation, the cost of space, utility costs, and overhead expense allocations.
Utilization of Services
The greater the use of ancillary services by patients, the greater the distribution of costs among patient visits and procedures provided. Utilization has a significant impact on the cost-effectiveness of ancillary services and the decision to provide services on-site or to contract out an ancillary service to local providers.
Cost Per Visit – Measuring Health Center Performance 16
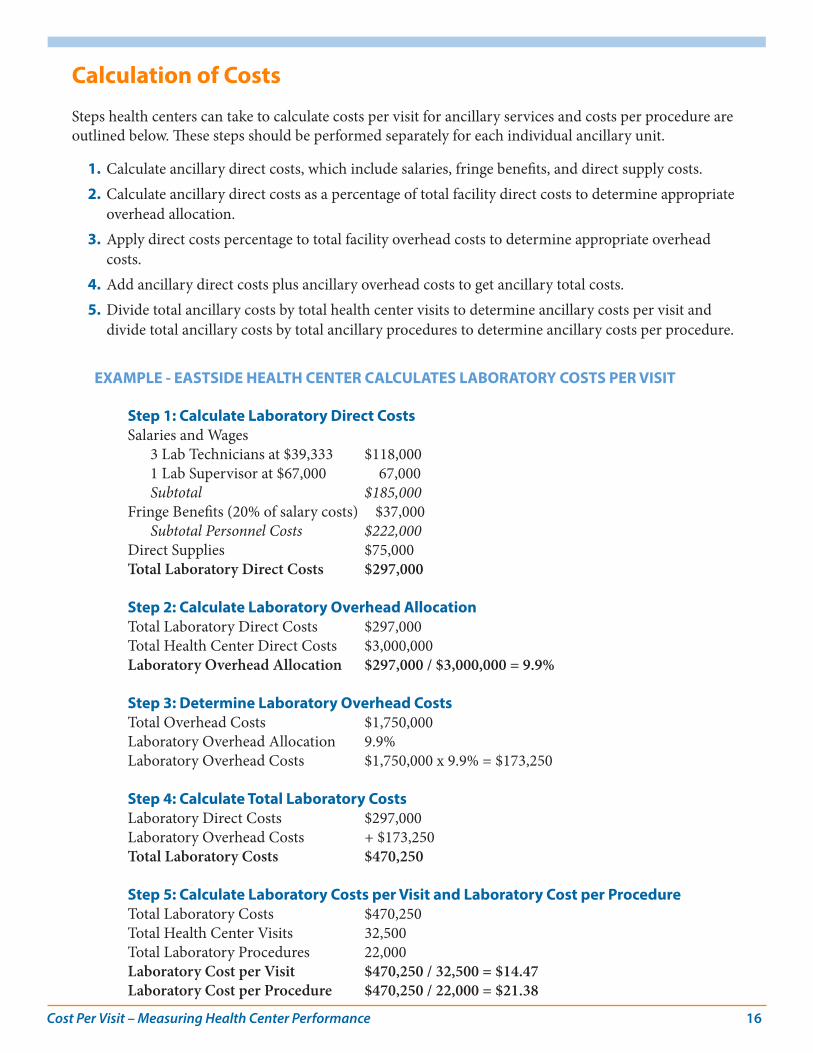
Calculation of Costs
Steps health centers can take to calculate costs per visit for ancillary services and costs per procedure are outlined below. These steps should be performed separately for each individual ancillary unit.
1. Calculate ancillary direct costs, which include salaries, fringe benefits, and direct supply costs.2. Calculate ancillary direct costs as a percentage of total facility direct costs to determine appropriate
overhead allocation.3. Apply direct costs percentage to total facility overhead costs to determine appropriate overhead
costs.4. Add ancillary direct costs plus ancillary overhead costs to get ancillary total costs.5. Divide total ancillary costs by total health center visits to determine ancillary costs per visit and
divide total ancillary costs by total ancillary procedures to determine ancillary costs per procedure.
EXAMPLE - EASTSIDE HEALTH CENTER CALCULATES LABORATORY COSTS PER VISIT
Step 1: Calculate Laboratory Direct Costs Salaries and Wages 3 Lab Technicians at $39,333 $118,000 1 Lab Supervisor at $67,000 67,000 Subtotal $185,000Fringe Benefits (20% of salary costs) $37,000 Subtotal Personnel Costs $222,000Direct Supplies $75,000Total Laboratory Direct Costs $297,000
Step 2: Calculate Laboratory Overhead AllocationTotal Laboratory Direct Costs $297,000 Total Health Center Direct Costs $3,000,000Laboratory Overhead Allocation $297,000 / $3,000,000 = 9.9%
Step 3: Determine Laboratory Overhead CostsTotal Overhead Costs $1,750,000Laboratory Overhead Allocation 9.9%Laboratory Overhead Costs $1,750,000 x 9.9% = $173,250
Step 4: Calculate Total Laboratory CostsLaboratory Direct Costs $297,000Laboratory Overhead Costs + $173,250Total Laboratory Costs $470,250
Step 5: Calculate Laboratory Costs per Visit and Laboratory Cost per ProcedureTotal Laboratory Costs $470,250Total Health Center Visits 32,500Total Laboratory Procedures 22,000Laboratory Cost per Visit $470,250 / 32,500 = $14.47Laboratory Cost per Procedure $470,250 / 22,000 = $21.38
Cost Per Visit – Measuring Health Center Performance 17
Quality Considerations
With this information, Eastside can compare the costs of providing services on-site ($21.38 per procedure) to outsourcing laboratory procedures locally. However, Eastside cannot make the decision to contract with an off-site provider based on cost alone. To ensure that quality is not compromised for price, we recommend selecting a high-quality provider whose references have been thoroughly checked.
Clearly the significant opportunities for cost reduction are with personnel.
Overhead Cost Per VisitOverhead expenses include administrative expenses (i.e., management salaries and office supplies) as well as facility expenses (i.e., rent, housekeeping and maintenance, equipment rental, and repairs).
The major factors impacting overhead cost per visit include the following:
• Productivity• Staffing• Administrative Staff Compensation• Facility Overhead• Administrative Overhead
Approximately 70%-75% of health center costs are personnel-related expenses. Of the remaining 25-30% of costs, approximately 5-10% are facility costs and another 2-5% are other fixed costs, which are difficult to reduce. In fact, only 15-20% of non-personnel costs are variable and can be impacted by cost reduction strategies. Such expenses as telephone, training, and travel do not represent major cost-reduction opportunities for health centers. Clearly the significant opportunities for cost reduction are with personnel.
Visit Volume, Productivity, & Overhead Cost Per Visit
As with most measures associated with cost per visit, productivity has a significant impact on overhead cost per visit. Overhead costs can be categorized as either fixed overhead or variable overhead.
Fixed overhead does not vary with changes in visit volume and/or staffing, and can include:
• Rental expense• Depreciation expense• Facility insurance• Dues and subscriptions
Cost Per Visit – Measuring Health Center Performance 18
Variable overhead may include the following:
• Office supplies• Board expenses• Travel• Telephone expense
These expenses may vary based on the square footage of a facility (e.g., utilities), the number of staff (i.e., telephone expense), or the number of FTEs (e.g., office supplies). These expenses increase or decrease based on a variety of factors, so that the total level of these expenses is a less significant indicator than the unit cost (e.g., per square foot, per visit). Evaluating services on a unit basis will permit health centers of different sizes and service mixes to compare data with national averages and norms.
As visit volume and productivity increase, the overhead cost per visit should decrease, since the fixed expenses are being allocated over more visits.
Staffing represents a real opportunity for cost savings in administrative and facility overhead.
Staffing
Staffing represents a real opportunity for cost savings in administrative and facility overhead. The ratio of administrative to facility staff mix is critical to the operations of a health center, but there is no single optimal staffing mix. It is important for management to be willing to challenge the administrative and facility staffing mix and make changes if necessary.
• Consider the differences in total costs between contracting out for certain facility services (e.g., housekeeping) and directly employing these positions when evaluating staff levels.
• Take into account the number of administrative supervisory staff and the ratio of supervisors to staff.
• Categorize office salaries into functional job categories for evaluation, rather than evaluating the total expense alone and use discretion in developing appropriate categories for unique situations. The categories below are only one example of functional categorization. Functional categories may include the following:
- Executive Management: CEO and COO- Finance: CFO, accountants, bookkeepers- Administrative Support: Receptionists, phone operators- MIS and Billing: Billing clerks, systems analysts- Other Administrative: Marketing, planning staff, medical records keeper, etc.
• Compare average salaries at a health center with local and regional norms.
• Calculate the percentage of the total budget devoted to administration and to administrative salaries in particular.
Cost Per Visit – Measuring Health Center Performance 19
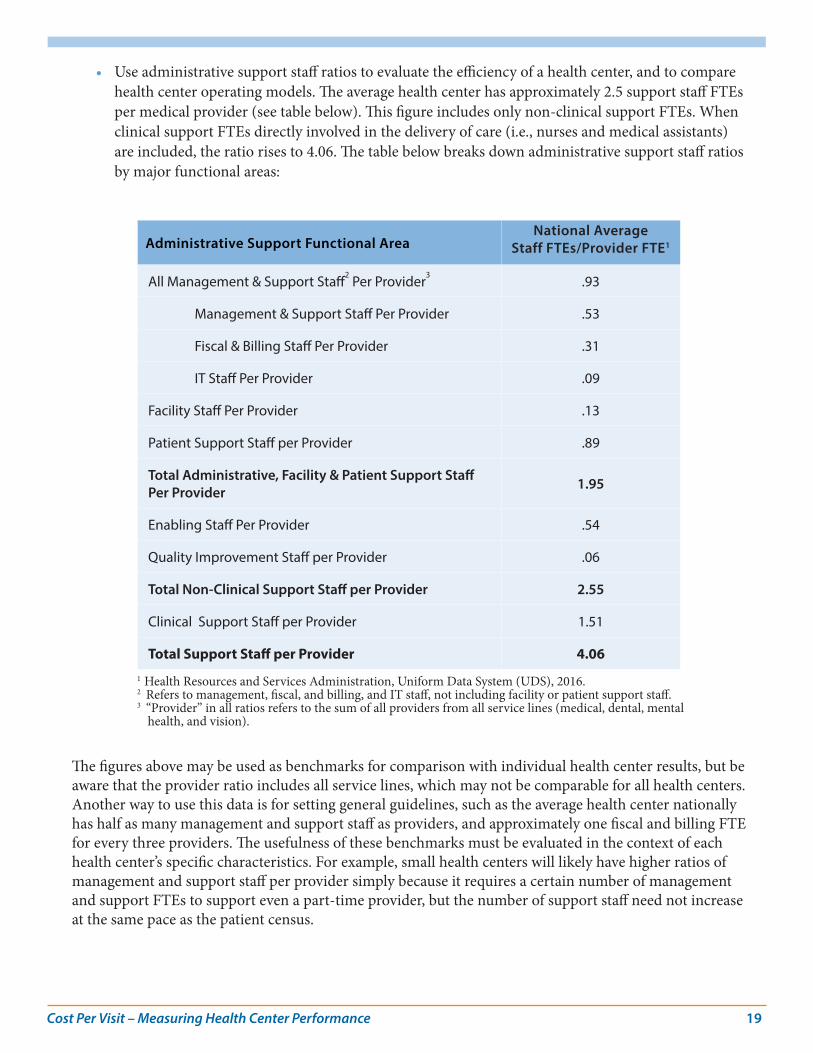
• Use administrative support staff ratios to evaluate the efficiency of a health center, and to compare health center operating models. The average health center has approximately 2.5 support staff FTEs per medical provider (see table below). This figure includes only non-clinical support FTEs. When clinical support FTEs directly involved in the delivery of care (i.e., nurses and medical assistants) are included, the ratio rises to 4.06. The table below breaks down administrative support staff ratios by major functional areas:
Administrative Support Functional AreaNational Average
Staff FTEs/Provider FTE1
All Management & Support Staff2 Per Provider
3.93
Management & Support Staff Per Provider .53
Fiscal & Billing Staff Per Provider .31
IT Staff Per Provider .09
Facility Staff Per Provider .13
Patient Support Staff per Provider .89
Total Administrative, Facility & Patient Support Staff Per Provider 1.95
Enabling Staff Per Provider .54
Quality Improvement Staff per Provider .06
Total Non-Clinical Support Staff per Provider 2.55
Clinical Support Staff per Provider 1.51
Total Support Staff per Provider 4.061 Health Resources and Services Administration, Uniform Data System (UDS), 2016. 2 Refers to management, fiscal, and billing, and IT staff, not including facility or patient support staff.3 “Provider” in all ratios refers to the sum of all providers from all service lines (medical, dental, mental
health, and vision).
The figures above may be used as benchmarks for comparison with individual health center results, but be aware that the provider ratio includes all service lines, which may not be comparable for all health centers. Another way to use this data is for setting general guidelines, such as the average health center nationally has half as many management and support staff as providers, and approximately one fiscal and billing FTE for every three providers. The usefulness of these benchmarks must be evaluated in the context of each health center’s specific characteristics. For example, small health centers will likely have higher ratios of management and support staff per provider simply because it requires a certain number of management and support FTEs to support even a part-time provider, but the number of support staff need not increase at the same pace as the patient census.
Cost Per Visit – Measuring Health Center Performance 20
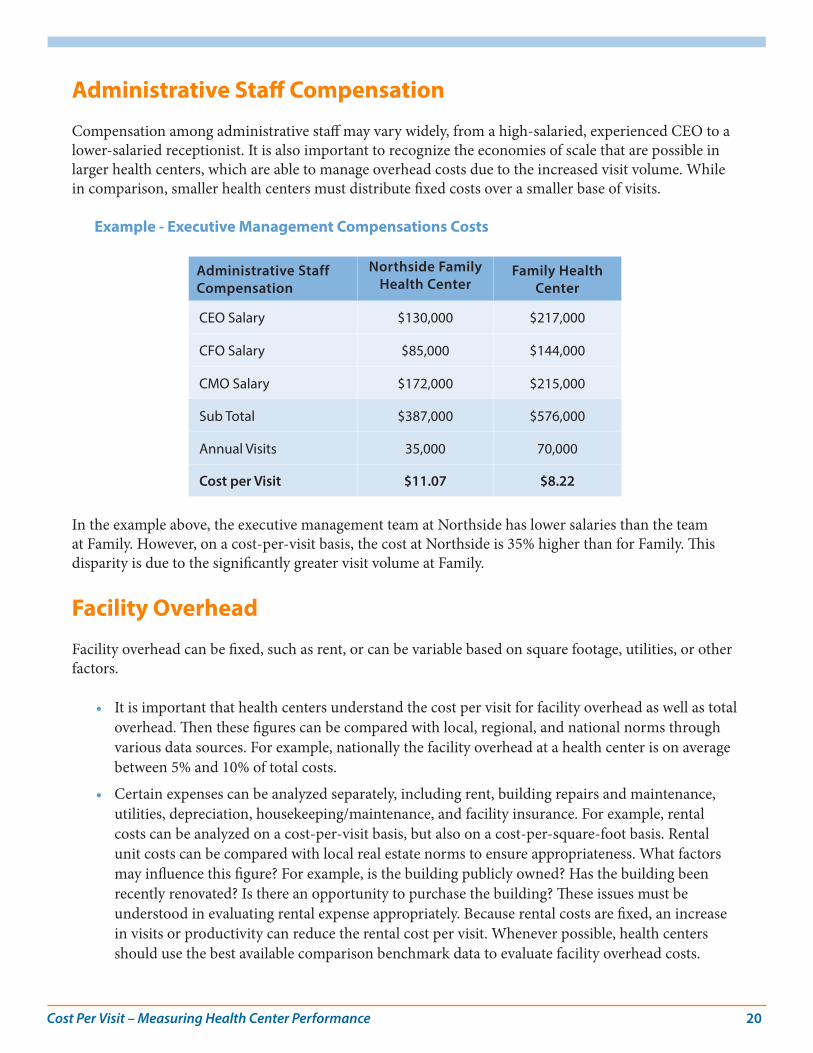
Administrative Staff Compensation
Compensation among administrative staff may vary widely, from a high-salaried, experienced CEO to a lower-salaried receptionist. It is also important to recognize the economies of scale that are possible in larger health centers, which are able to manage overhead costs due to the increased visit volume. While in comparison, smaller health centers must distribute fixed costs over a smaller base of visits.
Example - Executive Management Compensations Costs
Administrative Staff Compensation
Northside Family Health Center
Family Health Center
CEO Salary $130,000 $217,000
CFO Salary $85,000 $144,000
CMO Salary $172,000 $215,000
Sub Total $387,000 $576,000
Annual Visits 35,000 70,000
Cost per Visit $11.07 $8.22
In the example above, the executive management team at Northside has lower salaries than the team at Family. However, on a cost-per-visit basis, the cost at Northside is 35% higher than for Family. This disparity is due to the significantly greater visit volume at Family.
Facility Overhead
Facility overhead can be fixed, such as rent, or can be variable based on square footage, utilities, or other factors.
• It is important that health centers understand the cost per visit for facility overhead as well as total overhead. Then these figures can be compared with local, regional, and national norms through various data sources. For example, nationally the facility overhead at a health center is on average between 5% and 10% of total costs.
• Certain expenses can be analyzed separately, including rent, building repairs and maintenance, utilities, depreciation, housekeeping/maintenance, and facility insurance. For example, rental costs can be analyzed on a cost-per-visit basis, but also on a cost-per-square-foot basis. Rental unit costs can be compared with local real estate norms to ensure appropriateness. What factors may influence this figure? For example, is the building publicly owned? Has the building been recently renovated? Is there an opportunity to purchase the building? These issues must be understood in evaluating rental expense appropriately. Because rental costs are fixed, an increase in visits or productivity can reduce the rental cost per visit. Whenever possible, health centers should use the best available comparison benchmark data to evaluate facility overhead costs.
Cost Per Visit – Measuring Health Center Performance 21
Administrative Overhead
Administrative overhead can also be fixed or variable.
• Health centers should regularly compare administrative expenses with benchmarks to ensure the appropriateness of these expenses. On average, the percentage of total costs at a health center that are accounted for by administrative overhead is between 25% and 40%.
• Administrative expenses that can be analyzed separately include office supplies, telephone expenses, marketing, and professional services. These expenses can be analyzed on a cost-per-visit basis as well as a cost-per-FTE basis to assess reasonableness.
• Health centers should ensure that administrative expenses do not grow at an unsustainable rate over time, and that each line item in the administrative budget be closely scrutinized. Federally-funded health centers are generally required to ensure maximum feasible competition as part of their procurement practices. As a result, health centers should conduct RFPs and extended bidding processes for certain types of supplies, equipment, and other professional services to reduce expenses and increase quality.
• Outsourcing of certain administrative services continues to be one option for health centers to consider in the management of overhead expenses. Some health centers have service contracts for management information services (MIS), billing, and other functions.
• Another option that health centers across the country have been pursuing is the sharing of administrative services among multiple health centers. There are many groups of health centers that have come together to share services, including MIS, revenue cycle management, marketing, and other functions. The goal of these arrangements is not only to reduce these expenses wherever possible through group purchasing and other activities, but also to increase the quality of the services provided. Sharing technology expertise may not generate cost savings immediately, but should improve the quality of data and management reports available, and in the long-run, may reduce costs.
Conclusion: Looking Toward the Future Developing the capacity to accurately track, allocate, and compare costs across service lines is an essential tool in the successful management of a health center. Organizations can then determine what is driving their costs and compare these costs with other service providers at local, state, and national levels. Whether working in a fee-for-service or managed care reimbursement environment, management needs to understand how much it costs to provide various services. However, as health centers have evolved to provide a broader range of services beyond just medical, the accurate calculation and allocation of costs has become more complex.
Additionally, while the advent of team-based care may help to improve productivity and provide better patient outcomes, it introduces additional operational complexity that can complicate the calculation of cost. The future structure of global or value-based payments may also demand a deeper understanding of a center’s cost per patient, stratified by patient complexity or risk, rather than only cost per visit. The
Cost Per Visit – Measuring Health Center Performance 22
effort to integrate care to better serve patients with complex, co-morbid conditions will also require more sophisticated ways of calculating costs, including factoring in cross-disciplinary providers (medical and behavioral health for example).
While most health centers are still operating in a fee-for-service environment, some health centers are rapidly moving toward a future in which understanding, calculating, and tracking the cost of care for patients allocated to various risk groups will be critical for negotiating accurate PMPM reimbursement rates. At this writing, several states have set ambitious schedules for the transition to a value-based reimbursement system (Oregon, Massachusetts, and New York, for example) and it seems likely that eventually all FQHCs will be faced with negotiating value-based reimbursement arrangements. In the meantime, all health centers would be well-served by developing a clear understanding of their current cost structures utilizing the methodology set forth in this document. Regardless of the structure of future payment methodologies, health centers will still need to identify direct provider, direct support, and enabling costs and appropriately spread overhead and ancillary costs to determine fair and adequate payment levels.
Even if patient revenue in the future is predominantly based on a negotiated PMPM payment, productivity will remain an important element of health center financial success. Individual provider productivity as a metric may be replaced by a measure of care team productivity, paired with added measures of success based on quality metrics and positive health outcomes for patients. In this context, the concept of a “visit” may not be the main focus of care—with the team’s effort increasingly placed on providing care through “alternative touches,” or through the use of new technologies to monitor patient progress. Nevertheless, the need to identify the costs of providing services in new ways will continue; developing this critical skill set and adopting the approach described in this document will provide a strong foundation to support current and future financial and clinical operations at health centers.