Cost of Service Study Report - Modesto Irrigation District
94
Cost of Service Study Report November 19, 2018 DRAFT
Transcript of Cost of Service Study Report - Modesto Irrigation District

Cost of Service Study Report November 19, 2018
DRAFT

TABLE OF CONTENTS
EXECUTIVE SUMMARY ............................................................................................................. 1
A. Background .......................................................................................................................... 1 B. Cost of Service and Rate Design Process Overview ........................................................... 2 C. Revenue Requirements ........................................................................................................ 4 D. Cost of Service Results Compared to Current Revenue by Customer Class ....................... 4
I. INTRODUCTION ................................................................................................................... 1 A. Background .......................................................................................................................... 1
1. Generation and Power Supply ......................................................................................... 2 2. Transmission and Distribution ......................................................................................... 4
B. Cost of Service and Rate Design Process Overview ........................................................... 4 II. REVENUE REQUIREMENTS ............................................................................................... 6
A. Projected Energy Requirements .......................................................................................... 7 B. Operations and Maintenance Expenses ............................................................................... 7
1. Power Production ............................................................................................................ 8 2. Transmission .................................................................................................................. 10 3. Distribution .................................................................................................................... 11 4. Customer Accounts ........................................................................................................ 12 5. Administrative & General ............................................................................................. 12
C. Debt Service ...................................................................................................................... 13 D. Non-Rate Revenue ............................................................................................................. 13 E. Total Revenue Requirements ............................................................................................. 14
III. RATE REVENUE ............................................................................................................. 14 IV. COST OF SERVICE RESULTS ....................................................................................... 15
A. Functionalization of Revenue Requirement ...................................................................... 15 1. Production Function ...................................................................................................... 16 2. Transmission Function .................................................................................................. 16 3. Distribution Function ..................................................................................................... 16 4. Customer Service Function ........................................................................................... 16
B. Classification of Revenue Requirement ............................................................................ 17 V. ALLOCATION OF REVENUE REQUIREMENT .............................................................. 18
A. Class Allocation Factors .................................................................................................... 18 1. Demand Allocations ...................................................................................................... 18 2. Energy Allocations ........................................................................................................ 19
DRAFT

November 19, 2018 MRW & Associates, LLC ii
3. Customer Allocations .................................................................................................... 20 4. Direct Assignment Allocations ...................................................................................... 21
B. Cost of Service Results ...................................................................................................... 21 C. Cost of Service Results Compared to Current Revenue .................................................... 22 D. Grandfathering Under Proposition 26 ............................................................................... 23
VI. CONCLUSIONS ............................................................................................................... 23
LIST OF TABLES
Table 1: MID Revenue Requirements for Electric Compared to Rate Revenues ($) ...................... 4 Table 2: Cost of Service Compared to Rate Revenue by Customer Class ($) ................................ 5 Table 3: Comparison of Under- or Over-Collection of Costs Under Current Rates Compared to Rates and Costs in 2010 (%) ............................................................................................................ 6 Table 4: MID's Power Supply Resources as of December 31, 2017 ............................................... 3 Table 5: Electric's Transmission and Distribution Facilities ........................................................... 4 Table 6: Estimated Energy Requirements for MID ......................................................................... 7 Table 7: Total O&M for Electric Department for Test Year ($) ..................................................... 8 Table 8: O&M Expenses for Power Production ($) ........................................................................ 9 Table 9: MID's Purchased Power Costs ........................................................................................ 10 Table 10: Transmission O&M Expenditures ($) ........................................................................... 11 Table 11: Distribution O&M Expenses ($) ................................................................................... 12 Table 12: Customer Accounts O&M Expenditures ($) ................................................................. 12 Table 13: Administrative & General Expenditures ($) ................................................................. 13 Table 14: MID's Non-Rate Revenue for Electric ($) ..................................................................... 14 Table 15: MID’s Revenue Requirements for Electric ................................................................... 14 Table 16: Rate Revenue by Customer Class ($) ............................................................................ 15 Table 17: Functionalized Test Year Revenue Requirements ($) ................................................... 16 Table 18: Classification of MID's Electric Costs .......................................................................... 18 Table 19: Demand Allocation Factors ........................................................................................... 19 Table 20: Energy Allocation Factors ............................................................................................. 20 Table 21: Number of Customers by Schedule ............................................................................... 21 Table 22: Unbundled Revenue Requirements by Class ($) ........................................................... 21 Table 23: Cost of Service Compared to Rates ($) ......................................................................... 22 Table 24: Comparison of Under- or Over-Collection of Costs Under Current Rates Compared to Rates and Costs in 2010 (%) .......................................................................................................... 23
LIST OF FIGURES
Figure 1: Typical Cost of Service Process ....................................................................................... 3 Figure 2: Typical Cost of Service Process ....................................................................................... 6
DRAFT

November 19, 2018 MRW & Associates, LLC ES-1
EXECUTIVE SUMMARY
In December 2017, Bartle Wells Associates (Bartle Wells) was retained by the Modesto Irrigation District (MID) to perform an Electric Cost of Service (COS) and Revenue Allocation Study (Study) as part of a broader study of the cost of service for all of MID’s lines of business. Bartle Wells retained MRW & Associates, LLC (MRW) to assist with the Study. This report describes the analysis performed for the Electric line of service (Electric) and makes projections of the cost of service relative to the rate revenue recovered under current rates from the customers of Electric.1
The report consists of six sections. Following this Executive Summary, Section 1 provides the introduction for the Study. Section 2 discusses the development of the revenue requirement for the Test Year.2 Section 3 presents the rate revenue by customer class under present rates. Sections 4 and 5 discuss the estimated revenue requirement at various levels of aggregation (e.g., Electric, function, customer class). Section 6 presents conclusions.
A. Background
MID is a California irrigation district organized in 1887 under the provisions of the Irrigation District Law. MID has the powers under the Irrigation District Law to, among other things, provide irrigation and electric service. Under Irrigation District Law, MID has the powers of eminent domain, to contract, to construct works, to fix rates and charges for commodities or services furnished, to lease its properties and to incur indebtedness.
MID is governed by a Board of Directors, the five members of which are elected from separate electoral divisions within its irrigation district boundaries for staggered four year terms. MID’s operations are carried out under the direction of the General Manager who is in charge of MID’s operations in accordance with the Board of Director’s directives and policies.
MID is located in the San Joaquin Valley in Central California, approximately 90 miles east of San Francisco, California. MID began providing electric service in 1923, and since 1940 has provided all electric service within its original 160 square mile service area, which includes the major portion of Stanislaus County. Beginning in 1996, MID has also provided electric service on a competitive basis in portions of the service area of Pacific Gas & Electric Company (PG&E). California Assembly Bill 2638 (AB 2638), effective on January 1, 2001, added the 7.5 square mile Mountain House Community Services District in western San Joaquin County to MID’s exclusive electric service area and also designated a 400 square mile area in Southern San Joaquin County, Northern Stanislaus County and western Tuolumne County as MID’s non-exclusive electric service area. Pursuant to AB 2638, other than as set forth therein, MID is further prohibited from providing electric transmission or distribution service to retail customers in the service territory of PG&E. For the year ended December 31, 2017, MID served over
1 MID’s Fiscal Year (FY) runs from January 1 through December 31. All data contained in this report represents the MID FY unless otherwise stated. 2 The Test Year for the Study is 2018.
DRAFT

November 19, 2018 MRW & Associates, LLC ES-2
122,734 customers, had total retail sales of approximately 2.562 billion kWh and a peak demand of 697 MW.
To provide electric service within its service area, MID owns and operates an electric system that includes generation, transmission and distribution facilities. MID also purchases and sells power and transmission service and participates in pooling and other utility arrangements.
MID also supplies water for irrigation use in a portion of Stanislaus County and owns and operates a water treatment plant which supplies treated domestic water on a wholesale basis to the City of Modesto. MID’s irrigation system, as well as revenues from the sale of treated water, is operated and accounted for separately from Electric. Electric has no claim on the revenues of the irrigation or treated water systems.
MID’s last Electric Utility Rate Study was prepared in 2014. The MID Board approved a restructuring of electric rates in 2016 based in part on that study.
B. Cost of Service and Rate Design Process Overview
The COS and rate design process includes five steps as follows:
1. Determination of the Revenue Requirement – This first step examines the utility’s financial needs and determines the amount of revenue that must be generated from rates or non-rate revenue sources. The revenue requirement is determined on a “cash basis.” A “cash basis” analysis examines the cash obligations of the utility such as operations and maintenance (O&M) expenses, the Electric Utility’s allocated portion of MID’s administrative and general (A&G) expenses, debt service, and cash funded capital projects, and transfers to or from MID’s reserves.3
Discretionary Revenue is assigned at the discretion of the MID Board. Any Discretionary Revenue assigned to a customer class would have the effect of reducing that class’s revenue requirement and, as a result, that class’s Cost of Service.
In preparing our analysis of the electric revenues from present rates and the development of the revenue requirement, the Project Team relied upon MID’s historical audited data, the 2018 Budget, records of operation, customer billing data, and other detailed information and data compiled and provided by the MID’s management and staff.
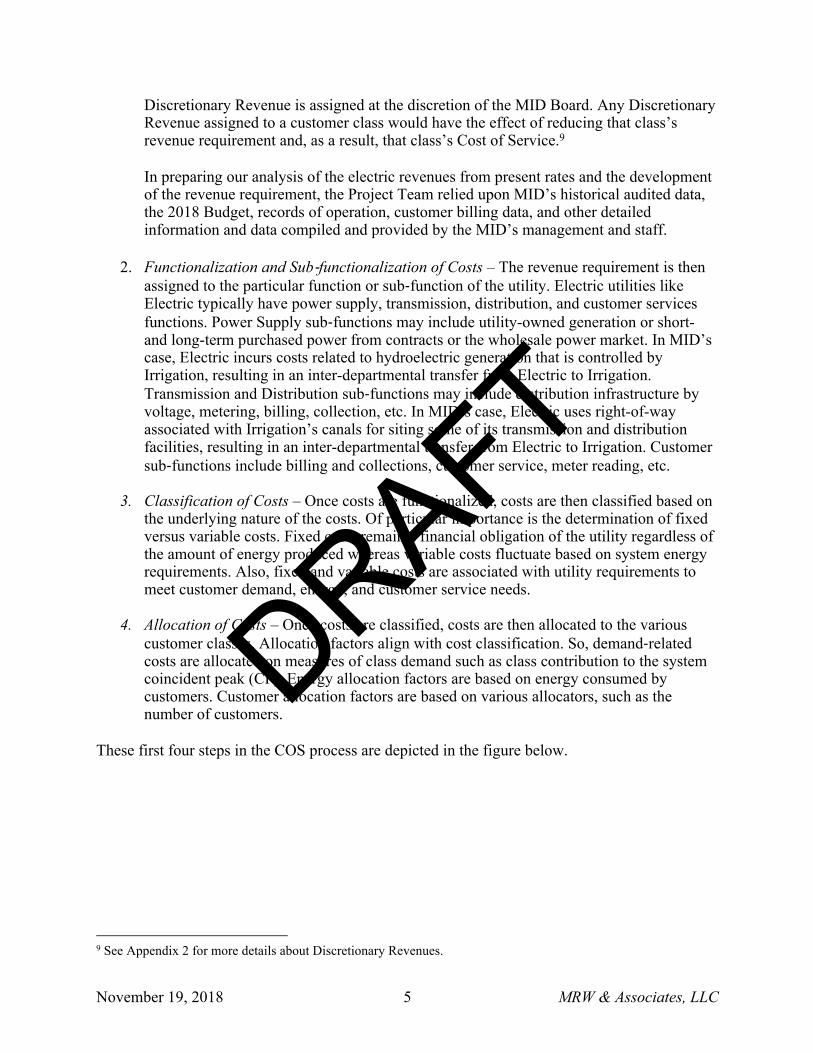
2. Functionalization and Sub-functionalization of Costs – The revenue requirement is then assigned to the particular function or sub-function of the utility. Electric utilities like Electric typically have power supply, transmission, distribution, and customer services functions. Power Supply sub-functions may include utility-owned generation or short- and long-term purchased power from contracts or the wholesale power market. In MID’s case, Electric incurs costs related to hydroelectric generation that is controlled by Irrigation, resulting in an inter-departmental transfer from Electric to Irrigation. Transmission and Distribution sub-functions may include distribution infrastructure by voltage, metering, billing, collection, etc. In MID’s case, Electric uses right-of-way
3 At the present time, MID has a single set of reserves that are used for both Electric and Irrigation.
DRAFT

November 19, 2018 MRW & Associates, LLC ES-3
associated with Irrigation’s canals for siting some of its transmission and distribution facilities, resulting in an inter-departmental transfer from Electric to Irrigation. Customer sub-functions include billing and collections, customer service, meter reading, etc.
3. Classification of Costs – Once costs are functionalized, costs are then classified based on the underlying nature of the costs. Of particular importance is the determination of fixed versus variable costs. Fixed costs remain a financial obligation of the utility regardless of the amount of energy produced whereas variable costs fluctuate based on system energy requirements. Also, fixed and variable costs are associated with utility requirements to meet customer demand, energy, and customer service needs.
4. Allocation of Costs – Once costs are classified, costs are then allocated to the various customer classes. Allocation factors align with cost classification. So, demand-related costs are allocated on measures of class demand such as class contribution to the system coincident peak (CP). Energy allocation factors are based on energy consumed by customers. Customer allocation factors are based on various allocators, such as the number of customers.
These first four steps in the COS process are depicted in the figure below.
Figure 1: Typical Cost of Service Process
5. Rate Design – The fifth, and final, step is rate design, which translates COS results into rates for each customer class. The rate design establishes tariffs for each group of customers in order to fully recover all revenue requirements allocated to each customer group. Tariffs may include per-customer charges, demand charges, energy charges, or other charges. For this report, the Project Team did not propose revisions to MID’s rate design.
DRAFT

November 19, 2018 MRW & Associates, LLC ES-4
C. Revenue Requirements
The Project Team developed the Test Year Revenue Requirement for Electric based on the 2018 Budget with adjustments for unusual or one-time expenses or revenues. For this analysis, the Project Team used MID’s COSA model after carefully reviewing the structure and assumptions in the model. The Project Team discussed any adjustments to expenses, revenues, model structure or assumptions with MID staff.
After developing the costs of service for MID, the Project Team compared the expected rate revenue at present rates and non-rate revenues for the Test Year against the cost of service in the Test Year. MID staff provided rate revenue for the Test Year.
Based on the costs and revenues for the Test Year, the Project Team compared costs and revenues to determine any under- or over-recovery of costs based on present rates.
Table 1: MID Revenue Requirements for Electric Compared to Rate Revenues ($)
Line Category Amount 1 O&M 290,106,182 2 Capital Expenses(1) 6,465,234 3 Debt Service & Debt Service Coverage(2) 94,613,189 4 Subtotal 391,184,604 5 Less Non-Rate Revenue -11,743,023 7 Less Discretionary Revenue -9,030,000 8 Revenue Requirement 370,411,582 9 Test Year Projected Rate Revenues 356,802,380 10 Over (Under) Recovery of Costs (13,609,202) 11 Over (Under) Recovery of Costs (3.8%)
Please note the total amounts shown in the table may not sum due to rounding. Also note that this table does not include any transfers either to or from MID reserves.
Notes:
(1) Capital Expenses represent certain capital expenditures that are assumed to be paid out of current revenues. Other capital expenditures are assumed to be financed and are reflected in the Debt Service and Debt Service Coverage line item.
(2) Debt Service & Debt Service Coverage reflect the annual total principal and interest paid on existing and new debt as well as an allowance for debt service coverage.
As is seen from this table, MID’s current rates under-recover MID’s costs for Electric by $13,609,202 or 3.8%. Note that this table does not include any transfers either to or from MID reserves.
D. Cost of Service Results Compared to Current Revenue by Customer Class
The Project Team developed customer class-specific estimates of cost of service for the Test Year. To do this, the Project Team functionalized the revenue requirement into four functions (i.e., Production, Transmission, Distribution, and Customer Service), classified costs into three categories (i.e., Energy, Demand, and Customer), and then allocated those costs to each of
DRAFT

November 19, 2018 MRW & Associates, LLC ES-5
MID’s customer classes.4 These customer class-specific costs were then compared to rate revenue for each class. The following table presents these results.
Table 2: Cost of Service Compared to Rate Revenue by Customer Class ($)
Line Customer Class
Schedule Cost of Service
[a]
Test Year Rate
Revenues [b]
Difference ($)
[c] = [a]-[b]
Difference (%)
[d]=[c]/[b]
1 Residential Residential 164,434,962 155,733,609 8,701,353 5.6% 2 Small
Commercial GS-1 22,164,937 22,958,570 (793,634) -3.5%
3 M/L Commercial
GS-2 73,878,168 76,301,128 (2,422,960) -3.2%
4 GS-TOU 4,501,940 4,867,789 (365,850) -7.5% 5 Industrial GS-3 60,917,991 56,993,098 3,924,893 6.9% 6 IC-25 27,875,594 23,387,304 4,488,289 19.2% 7 Agricultural P-3 12,448,157 12,445,627 2,530 0.02% 8 P-4 2,194,078 2,131,909 62,169 2.9% 9 Street Lights SL-1 1,292,278 1,281,709 10,569 0.8% 10 SL-2 703,478 701,636 1,842 0.3% 11 Total 370,411,582 356,802,380 13,609,202 3.8%
Table 2 shows that all customer classes except for tariffs serving Small and Medium/Large Commercial customers are paying less than their costs of service (i.e., Test Year rate revenues are less than Cost of Service).
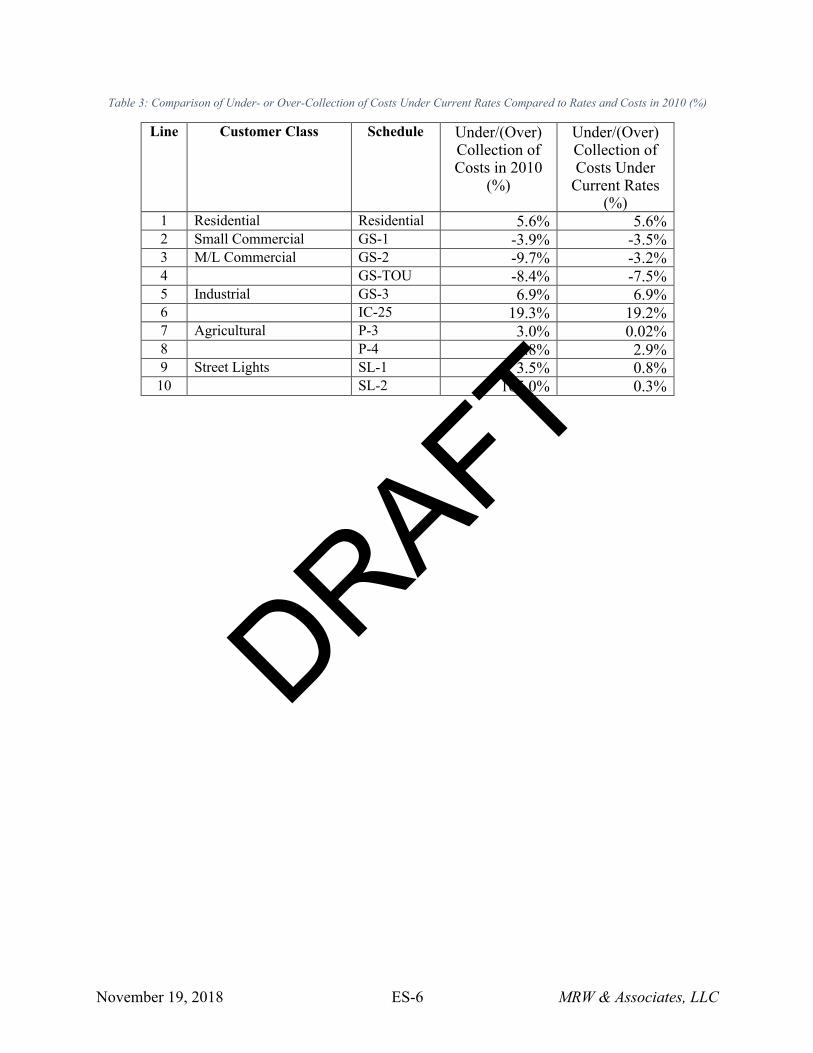
The levels of under- or over-collection for each customer class on a percentage basis are, on an absolute value basis, less than was found in late 2010, meaning that the current MID rates are “closer” to cost of service than what was found in 2010. The following table presents the level of under- or over-collection in late 2010 and under MID’s current rates.
As shown in Table 3 below, MID historically has over-recovered costs from rates paid by commercial customers taking service under Schedules GS-1, GS-2, and GS-TOU, and its policy to do so is pre-Proposition 26 legislation that is grandfathered by the measure. Commercial customers will continue to pay above their cost of service, as permitted by pre-Proposition 26 legislative choices which survive it. Moreover, because the proposed percentage of revenue allocation for those customers will decrease the extent to which commercial customers pay more than the cost of service (i.e., bringing them closer to service cost), they do not violate Proposition 26.
Based on this, the Project Team believes that the rates currently in effect at MID are reasonable.
4 For this study, “customer class” is the same as rate schedule.
DRAFT
November 19, 2018 MRW & Associates, LLC ES-6
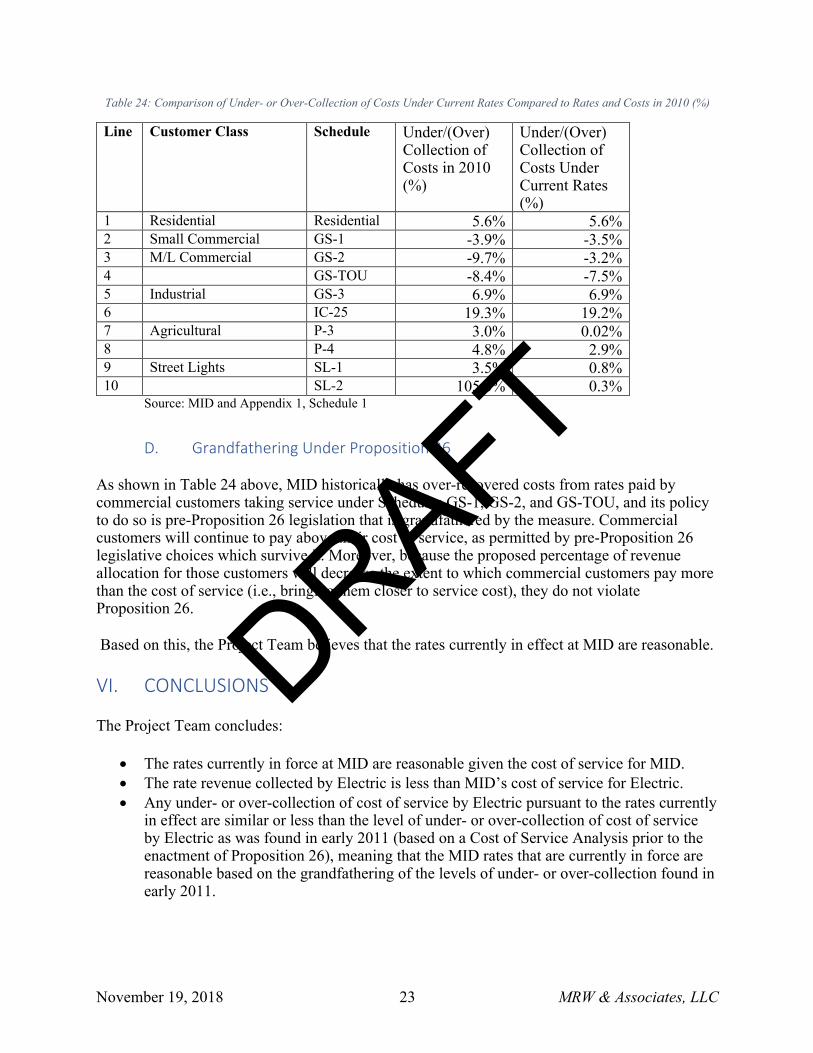
Table 3: Comparison of Under- or Over-Collection of Costs Under Current Rates Compared to Rates and Costs in 2010 (%)
Line Customer Class Schedule Under/(Over) Collection of Costs in 2010
(%)
Under/(Over) Collection of Costs Under
Current Rates (%)
1 Residential Residential 5.6% 5.6% 2 Small Commercial GS-1 -3.9% -3.5% 3 M/L Commercial GS-2 -9.7% -3.2% 4 GS-TOU -8.4% -7.5% 5 Industrial GS-3 6.9% 6.9% 6 IC-25 19.3% 19.2% 7 Agricultural P-3 3.0% 0.02% 8 P-4 4.8% 2.9% 9 Street Lights SL-1 3.5% 0.8% 10 SL-2 105.0% 0.3%
DRAFT

November 19, 2018 MRW & Associates, LLC 1
I. INTRODUCTION
In December 2017, Bartle Wells Associates (Bartle Wells) was retained by the Modesto Irrigation District (MID) to perform an Electric Cost of Service (COS) and Revenue Allocation Study (Study) as part of a broader study of the cost of service for all of MID’s lines of business. Bartle Wells retained MRW & Associates, LLC (MRW) to assist with the Study.
This report describes the analysis performed for the Electric line of service (Electric) and makes projections of the cost of service relative to the rate revenue recovered under current rates from the customers of Electric.5 The report consists of six sections and an Executive Summary. Following the Executive Summary, this section provides the introduction for the Study. Section 2 discusses the development of the revenue requirement for the Test Year.6 Section 3 presents the rate revenue by customer class under present rates. Sections 4 and 5 discuss the estimated revenue requirement at various levels of aggregation (e.g., Electric, function, customer class). Section 6 presents conclusions. Appendices are attached containing schedules and other information supporting the information contained in this report.
Regular reviews of the performance of a utility’s rates are an integral part of the management of any utility and failure to monitor the rates can result in the need for significant rate actions. The Project Team recommends that, going forward, MID continue to regularly monitor and review the performance of its adopted rates and perform rate adjustments in a timely manner to preserve the financial integrity of the Electric Utility.
The analysis performed by the Project Team was designed to consider the foreseeable, known, and measurable adjustments during the Study Period. The goal was to provide MID management with information related to the degree to which costs at different levels of aggregation are being fully recovered by current rates. As with any forecast, assumptions were made and MID should note that the actual expenses and revenues may differ from the projected expenses and revenues outlined in this report due to unforeseen changes such as system growth, inflation, etc.
A. Background
MID is a California irrigation district organized in 1887 under the provisions of the Irrigation District Law. MID has the powers under the Irrigation District Law to, among other things, provide irrigation and electric service. Under Irrigation District Law, MID has the powers of eminent domain, to contract, to construct works, to fix rates and charges for commodities or services furnished, to lease its properties and to incur indebtedness.
MID is governed by a Board of Directors, the five members of which are elected from separate electoral divisions within its irrigation district boundaries for staggered four year terms. MID’s operations are carried out under the direction of the General Manager who is in charge of MID’s operations in accordance with the Board of Director’s directives and policies.
5 MID’s Fiscal Year (FY) runs from January 1 through December 31. All data contained in this report represents the MID FY unless otherwise stated. 6 The Test Year for the Study is 2018.
DRAFT

November 19, 2018 MRW & Associates, LLC 2
MID is located in the San Joaquin Valley in Central California, approximately 90 miles east of San Francisco, California. MID began providing electric service in 1923, and since 1940 has provided all electric service within its original 160 square mile service area, which includes the major portion of Stanislaus County. Beginning in 1996, MID has also provided electric service on a competitive basis in portions of the service area of Pacific Gas & Electric Company (PG&E). California Assembly Bill 2638 (AB 2638), effective on January 1, 2001, added the 7.5 square mile Mountain House Community Services District in western San Joaquin County to MID’s exclusive electric service area and also designated a 400 square mile area in Southern San Joaquin County, Northern Stanislaus County and western Tuolumne County as MID’s non-exclusive electric service area. Pursuant to AB 2638, other than as set forth therein, MID is further prohibited from providing electric transmission or distribution service to retail customers in the service territory of PG&E. For the year ended December 31, 2017, MID served over 122,734 customers, had total retail sales of approximately 2.562 billion kWh and a peak demand of 697 MW.
To provide electric service within its service area, MID owns and operates an electric system that includes generation, transmission and distribution facilities. MID also purchases and sells power and transmission service and participates in pooling and other utility arrangements.
MID also supplies water for irrigation use in a portion of Stanislaus County and owns and operates a water treatment plant which supplies treated domestic water on a wholesale basis to the City of Modesto. MID’s irrigation system, as well as revenues from the sale of treated water, is operated and accounted for separately from Electric. Electric has no claim on the revenues of the irrigation or treated water systems.
MID’s last Electric Utility Rate Study was prepared in 2014. The MID Board approved a restructuring of electric rates in 2016 based in part on that study.
1. Generation and Power Supply
Electric provides power to its customers through a combination of MID-owned generation, purchase power contracts, and market purchases. The following table summarizes all of MID’s power supply resources as of the end of 2017.
DRAFT

November 19, 2018 MRW & Associates, LLC 3
Table 4: MID's Power Supply Resources as of December 31, 2017
Historical - Year Ending
December 31, 2017
Source Capacity
Available (MW) Actual Energy
(GWh) Percent of
Total Energy Generating Facilities:
Don Pedro/Stone Drop (Hydro) ................................... 62.3 277.5 10.7% Woodland 1 (Combustion Turbine) .............................. 49.0 152.9 5.9 Woodland 2 (Combustion and Steam Turbines) .......... 83.0 200.4 7.7 Woodland 3 (Reciprocating Engine) ........................... 49.0 65.3 2.5 Ripon Generation Station ............................................. 96.0 89.3 3.4 McClure (Combustion Turbine, 2 units) ...................... 122.0 4.7 0.2
Total(1) ......................................................................... 461.3 790.1 30.3% Purchased Power:
M-S-R PPA San Juan(2) ................................................ 75.0 502.2 19.3% Lodi Energy Center(3) ................................................... 30.0 77.8 3.0 Renewables ...................................................................
Wind(4) ..................................................................... 206.2 427.6 16.4 New Hogan(5) .......................................................... 2.1 11.9 0.5 Methane Digester .................................................... 0.8 0.9 0.0 McHenry Solar Project ........................................... 25.0 62.4 2.4
City and County of San Francisco (Hetch Hetchy)(6) ...................................................... 25.0 106.9 4.1
Western Area Power Administration (WAPA)(6) ......... 6.0 37.2 1.4 Other Purchases(7) ......................................................... 206.5 588.0 22.6 Total(1) ......................................................................... 576.6 1,814.8 69.7%
Total Energy Resources (Generation + Load Reduction + Purchases)(9) ...................................... 1,037.9 2,605.0 100.00% Load: District System Requirement for Retail ............................ 696.5 2,583.3 99.2% Wholesale Power Sales:(8)
Other Sales .................................................................. 0.0 21.7 0.8% Total Capacity and Energy Sold at Wholesale ........ 0.0 21.7 0.8%
Total (Retail + Wholesale)(1)(9) .......................................... 1,037.9 2,605.0 100.0% ____________________________ (1) Totals may not add due to rounding. (2) M-S-R PPA ceased to have an ownership interest in the San Juan Unit No. 4 effective December 31, 2017. (3) MID’s share of the output of the Lodi Energy Center is sold into the CAISO energy markets. Replacement energy is purchased
for delivery to MID as needed. (4) Capacity shown is total contract capacity. Represents energy sold to MID at the project bus from the High Winds Project (50
MW), located in Solano County, California, and the Big Horn Project (25 MW) located in Klickitat County, Washington and also includes delivery of the output of the 98.7 MW from the Star Point Wind Project, located in Sherman County, Oregon and 32.5 MW of the Big Horn II Project. Actual capacity delivery at the project will be less than the total contract capacity.
(5) Delivery of output for MID’s benefit from the New Hogan Project commenced on June 1, 2010 and is scheduled similarly to the wind projects that are located within the CAISO. Although the plant has two generators with 3.0 MW of capacity, only 2.1 MW is shown because both units cannot operate at the same time (2.1 MW is the capacity of the larger unit).
(6) WAPA and Hetch Hetchy Class 1 capacity are daily firm only. (7) Other Purchases include firm and non-firm short-term resources from various sources such as SMUD, BPA, PowerEx, and
CAISO, among others. Also include reserves consistent with prudent utility practices. Direct load control (10 MW) and interruptible retail contracts (16.4 MW) count towards planning reserves.
(8) Wholesale sales from the MID system are made on a short-term basis. This does not include sales made from Lodi Energy Center, San Juan, High Winds, Shiloh or New Hogan as output from those resources is sold directly to the CAISO energy markets.
(9) Total capacity available includes planning reserves to meet MID load. It is important to note that not all contracts are available year-round. Source: MID
DRAFT

November 19, 2018 MRW & Associates, LLC 4
MID must comply with California’s Renewable Portfolio Standard (RPS) for load-serving entities. As of the beginning of September 2018, MID is required to serve 50% of its load using qualifying renewable resources by 2030.
2. Transmission and Distribution
The following table summarizes the extent of Electric’s transmission and distribution facilities.
Table 5: Electric's Transmission and Distribution Facilities
Distribution Voltage (kV) Underground Overhead Total 4 kV 0.26 0.04 0.30 6.9 kV 436.96 - 436.96 12 kV 228.78 984.54 1,213.32 17 kV 65.81 29.94 95.75 21 kV 27.44 1.83 29.27 Total Distribution 759.25 1,016.35 1,775.60 Transmission Voltage (kV) Underground Overhead Total 69 kV - 203.90 203.90 115 kV - 37.60 37.60 230 kV - 142.50 142.50 Total Transmission - 384.00 384.00
Source: MID
Electric’s transmission system consists of approximately 384 miles of facilities that are 69 kilovolts (kVs) or above. Electric’s distribution system has both overhead and underground facilities totaling 1,775.60 miles.
At the present time, MID’s electric operations are a part of the overall operations of MID (i.e., the operations are not a separate business unit).7
B. Cost of Service and Rate Design Process Overview
The COS and rate design process includes five steps as follows:
1. Determination of the Revenue Requirement – This first step examines the utility’s financial needs and determines the amount of revenue that must be generated from rates or non-rate revenue sources. The revenue requirement is determined on a “cash basis.” A “cash basis” analysis examines the cash obligations of the utility such as operations and maintenance (O&M) expenses, the Electric Utility’s allocated portion of MID’s administrative and general (A&G) expenses, debt service, and cash funded capital projects, and transfers to or from MID’s reserves.8
7 For simplicity, this report will refer to MID’s electric operations as “Electric” even though it is not a separate business unit. 8 At the present time, MID has a single set of reserves that are used for both Electric and Irrigation.
DRAFT
November 19, 2018 MRW & Associates, LLC 5
Discretionary Revenue is assigned at the discretion of the MID Board. Any Discretionary Revenue assigned to a customer class would have the effect of reducing that class’s revenue requirement and, as a result, that class’s Cost of Service.9
In preparing our analysis of the electric revenues from present rates and the development of the revenue requirement, the Project Team relied upon MID’s historical audited data, the 2018 Budget, records of operation, customer billing data, and other detailed information and data compiled and provided by the MID’s management and staff.
2. Functionalization and Sub-functionalization of Costs – The revenue requirement is then assigned to the particular function or sub-function of the utility. Electric utilities like Electric typically have power supply, transmission, distribution, and customer services functions. Power Supply sub-functions may include utility-owned generation or short- and long-term purchased power from contracts or the wholesale power market. In MID’s case, Electric incurs costs related to hydroelectric generation that is controlled by Irrigation, resulting in an inter-departmental transfer from Electric to Irrigation. Transmission and Distribution sub-functions may include distribution infrastructure by voltage, metering, billing, collection, etc. In MID’s case, Electric uses right-of-way associated with Irrigation’s canals for siting some of its transmission and distribution facilities, resulting in an inter-departmental transfer from Electric to Irrigation. Customer sub-functions include billing and collections, customer service, meter reading, etc.
3. Classification of Costs – Once costs are functionalized, costs are then classified based on the underlying nature of the costs. Of particular importance is the determination of fixed versus variable costs. Fixed costs remain a financial obligation of the utility regardless of the amount of energy produced whereas variable costs fluctuate based on system energy requirements. Also, fixed and variable costs are associated with utility requirements to meet customer demand, energy, and customer service needs.
4. Allocation of Costs – Once costs are classified, costs are then allocated to the various customer classes. Allocation factors align with cost classification. So, demand-related costs are allocated on measures of class demand such as class contribution to the system coincident peak (CP). Energy allocation factors are based on energy consumed by customers. Customer allocation factors are based on various allocators, such as the number of customers.
These first four steps in the COS process are depicted in the figure below.
9 See Appendix 2 for more details about Discretionary Revenues.
DRAFT

November 19, 2018 MRW & Associates, LLC 6
Figure 2: Typical Cost of Service Process
5. Rate Design – The fifth, and final, step is rate design, which translates COS results into rates for each customer class. The rate design establishes tariffs for each group of customers in order to fully recover all revenue requirement allocated to each customer group. Tariffs may include per-customer charges, demand charges, energy charges, or other charges. For this report, the Project Team did not propose revisions to MID’s rate design.
II. REVENUE REQUIREMENTS
Developing the Test Year Revenue Requirement is the first step in the COS and rate design process, as shown in Figure 2. The Test Year Revenue Requirement for Electric was based on the 2018 Budget with adjustments for unusual or one-time expenses or revenues.
There are two primary revenue requirement methodologies employed in the utility industry; the cash basis and the utility basis. The primary differences between the cash basis and the utility basis involve the treatment of depreciation, return on invested capital, and debt service. The cash basis, which is the most common method used by municipalities and irrigation districts, includes debt service, but excludes depreciation and return on invested capital in the revenue requirement determination. The cash basis focuses on meeting the cash demands of the utility. The utility basis, which is most commonly used by private or for-profit utilities, includes depreciation and return on invested capital, but excludes debt service from the revenue requirement determination.
In this COS analysis, the Project Team utilized the cash basis, as it follows the traditional cash-oriented budgeting practices frequently used by government entities. In addition, the cash basis generally is easier to explain to customers since the cash basis attempts to match revenue and expenditures.
DRAFT

November 19, 2018 MRW & Associates, LLC 7
A. Projected Energy Requirements
The electric consumption by Electric’s customers is a key driver in projections of expenses and revenues. The forecast of sales and electric load associated with customer demands was developed by MID. The following table presents assumed electric sales for the Test Year by customer class.10
Table 6: Estimated Energy Requirements for MID
Res. GS-1 GS-2 GS-TOU
GS-3 IC-25 P-3 P-4 SL-1 SL-2 Total
(MWh) Sales 868,272 140,003 5,501 31,965 281,783 287,442 85,619 20,805 9,548 2,419 2,514,597 Losses 34,636 5,523 98 571 5,215 5,128 3,608 93 1,150 94 87,199 Total 902,908 145,526 5,599 32,536 286,998 292,570 89,227 20,898 10,698 2,513 2,601,796 (MW) Peak 359 39 111 4.5 97 36 16 2.00 0 0 664 Losses 18 2 6 0.1 3 1 1 0.01 0 0 31 Total 377 41 117 4.6 100 37 17 2.01 0 0 695
Source: MID. Note: Totals may not add due to rounding.
Total sales for the Test Year are 2,514,597 MWh. Energy supplied (which includes losses) is 2,601,796 MWh in the Test Year. Peak demand at the customer level is 664 MW in the Test Year.
B. Operations and Maintenance Expenses
The first step in developing the revenue requirement forecast for the Test Year was the development of Test Year O&M expenses. O&M expenses for the Test Year are based on MID’s 2018 budget with adjustments as necessary.
O&M expenses consist of costs from five broad categories:
• Power Production • Transmission • Distribution • Customer Accounts • Administrative and General (A&G)
The following table summarizes the O&M costs for the Test Year.
10 Details regarding sales by customer class and rate schedule are found in Appendix 1.
DRAFT

November 19, 2018 MRW & Associates, LLC 8
Table 7: Total O&M for Electric Department for Test Year ($)
Power Production
Transmission Distribution Customer Accounts
A & G Total
205,892,704 8,781,221 15,829,819 13,702,338 45,900,100 290,106,182 Source: Appendix 1, Schedule 3
The following sections provide details for each of these five categories of costs.
1. Power Production
MID’s power production O&M expenses reflect the costs to operate and maintain MID’s generating fleet, purchase fuel for its gas-fired generation, purchase power pursuant to short- and long-term power purchase agreements (PPAs), operate and dispatch MID’s portfolio of power supply assets to meet MID’s customer loads, and to compensate Irrigation for the net value of the energy and capacity that Electric receives from MID’s hydroelectric generating facilities. Table 8 below presents the Power Production O&M expenses for the Test Year.
MID’s largest O&M expenses for Power Production are purchased power and fuel. Each of these categories are discussed in more detail below. Most of the O&M expenses in Table 8 are self-explanatory. However, the category “Hydro Water Charge” deserves additional discussion. The Don Pedro dam has a hydroelectric generating facility. Don Pedro generates electricity that is used by Electric to serve its customers. As a result, Electric is able to avoid either purchasing or generating the quantity of electricity and capacity provided by Don Pedro. Thus, Electric avoids the costs of purchasing both energy and capacity that it receives from Irrigation. At the same time, the responsibility for building, operating, and maintaining Don Pedro has historically been split between the Electric and Irrigation business lines. Electric is responsible for the relicensing of the hydroelectric facility at Don Pedro with the Federal Energy Regulatory Commission (FERC).
The net cost that Electric avoids associated with Don Pedro is the difference between (1) the value of energy and capacity related to the hydroelectric generation provided to Electric from Don Pedro and (2) the costs that Electric bears related to the ownership of the hydroelectric generation at Don Pedro.11
11 For additional details regarding the development of Electric’s net cost associated with Don Pedro, see Appendix 2.
DRAFT

November 19, 2018 MRW & Associates, LLC 9
Table 8: O&M Expenses for Power Production ($)
FERC Account
Description O&M Costs ($)
Hydraulic Power Generation
535 Oper. Supervision and Engineering 69,000 537 Hydraulic Expenses 11,500 538 Electric Expenses 69,000 539 Misc. Hydro Power Generation Exp. 253,971 Subtotal – Operations 403,471 542 Maint. Supervision and Engineering 23,884 543 Maint. Of Res., Dams, and Waterways 368,000 544 Maintenance of Electric Plant 441,631 545 Maint. Of Misc. Hydro Power Plant 34,993 Subtotal – Maintenance 868,508 Total Hydro Power Expense 1,271,978 Other Power Generation
546 Oper. Supervision and Engineering 8,629,732 547 Fuel 22,827,247 548 Generation Expenses 4,073,574 Subtotal – Operations 35,530,553 551 Maint. Supervision and Engineering 180,646 553 Maintenance of Generating Units 2,376,735 554 Maint. Of Misc. Other Power Gener. P.t 2,107,671 Subtotal – Maintenance 4,665,052 Total Other Power Production Expenses 40,195,604 555 Purchased Power 150,436,193 556 System Control and Load Dispatching 7,657,363 557 Hydro Water Charge 6,331,565 Total Other Power Supply Expense 164,425,121 Total Production Expense 205,892,704
Source: Appendix 1, Schedule 3 a) Purchased Power Expenses
Purchased Power expenses are the largest portion of the Power Production O&M expenses, which are the largest of MID’s O&M expenses for Electric. These costs are associated with take or pay contracts, purchased power agreements, and spot market purchases to balance MID’s needs to meet load. Overall, MID’s purchased power expenses for the Test Year are about $150.4 million.
Table 9 below summarizes forecast expenses for Electric’s purchased power for the Test Year.
DRAFT

November 19, 2018 MRW & Associates, LLC 10
Table 9: MID's Purchased Power Costs
Counterparty/Type Cost (MM$) Renewables Wind 55.2 Solar 10.3 Biomass 1.4 Small Hydro 0.2 Subtotal Renewables 67.1 Purchased Power Long Term 5.9 Short Term 43.3 Subtotal Purchased Power 49.2 Lodi Energy Center (Fuel + O&M) 2.9 M-S-R 17.9 TANC 11.6 Misc. Regulatory and Grid Charges 1.9 Total 150.4
Source: MID Note: Components may not sum to total due to rounding b) Fuel Expenses
Fuel expenses are the second-largest portion of MID’s Power Production O&M expenses, which are the largest of MID’s O&M expenses for Electric. These costs are associated with fuel acquired by MID to operate its own power plants and fuel that is delivered to power plants with which MID has tolling agreements. All of MID’s fuel expenses for power production are related to purchases of natural gas. MID’s fuel expenses for the Test Year are $22.8 million.
2. Transmission
MID’s transmission O&M expenses reflect the costs to operate and maintain MID’s high voltage transmission system (i.e., 69 kV to 230 kV) in order to ensure safe and reliable service to MID’s retail customers. The following table presents the Transmission O&M expenses for the Test Year.
DRAFT
November 19, 2018 MRW & Associates, LLC 11
Table 10: Transmission O&M Expenditures ($)
FERC Account
Description O&M Costs ($)
Operation 560 Operation Supervision and Engineering 3,319,470
562 Station Expenses 2,556,679 567 Rents 414,699
Subtotal - Operations 6,290,847 Maintenance
571 Maintenance of Overhead Lines 2,490,374 Subtotal – Maintenance 2,490,374
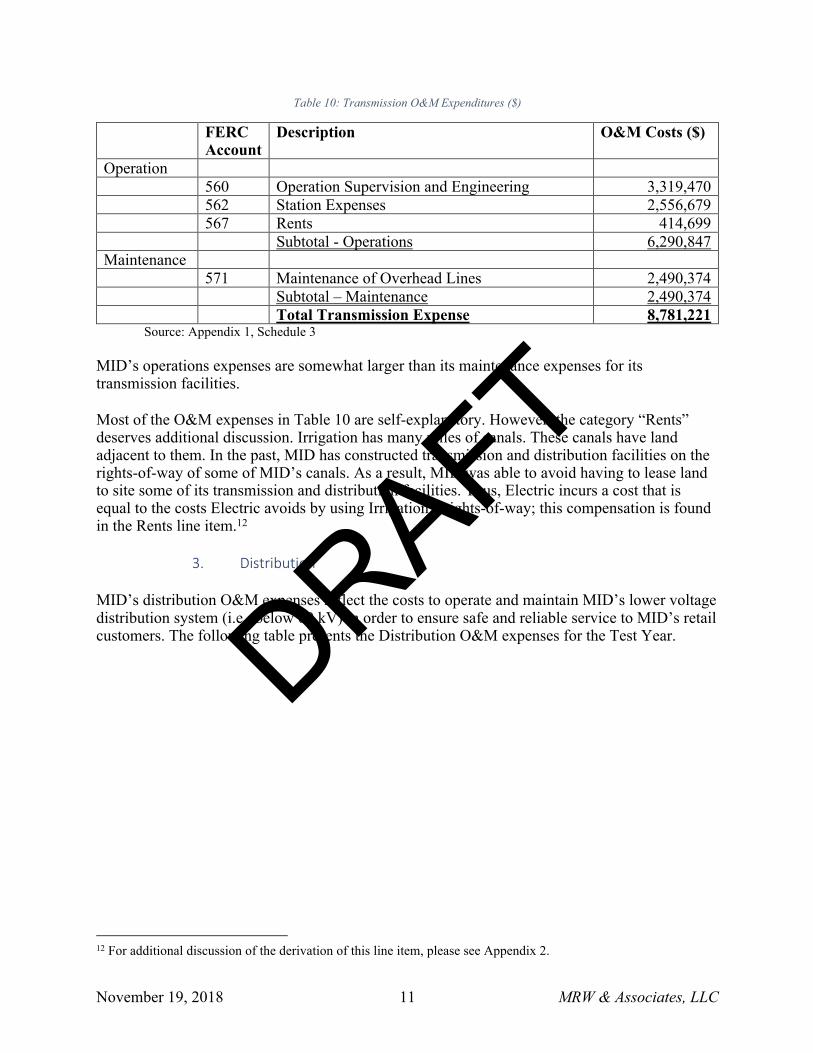
Total Transmission Expense 8,781,221 Source: Appendix 1, Schedule 3 MID’s operations expenses are somewhat larger than its maintenance expenses for its transmission facilities.
Most of the O&M expenses in Table 10 are self-explanatory. However, the category “Rents” deserves additional discussion. Irrigation has many miles of canals. These canals have land adjacent to them. In the past, MID has constructed transmission and distribution facilities on the rights-of-way of some of MID’s canals. As a result, MID was able to avoid having to lease land to site some of its transmission and distribution facilities. Thus, Electric incurs a cost that is equal to the costs Electric avoids by using Irrigation’s rights-of-way; this compensation is found in the Rents line item.12
3. Distribution
MID’s distribution O&M expenses reflect the costs to operate and maintain MID’s lower voltage distribution system (i.e., below 69 kV) in order to ensure safe and reliable service to MID’s retail customers. The following table presents the Distribution O&M expenses for the Test Year.
12 For additional discussion of the derivation of this line item, please see Appendix 2.
DRAFT

November 19, 2018 MRW & Associates, LLC 12
Table 11: Distribution O&M Expenses ($)
FERC Account
Description O&M Costs ($)
Operation 582 Station Expenses 3,411,888
588 Miscellaneous Distribution Expenses 26,500 Subtotal – Operations 3,438,388 Maintenance 590 Maint. Supervision and Engineering 1,263,073
593 Maintenance of Overhead Lines 5,722,318 594 Maintenance of Underground Lines 1,748,178 595 Maintenance of Line Transformers 327,717 596 Maint. Of Street Lighting Equipment 93,411 597 Maintenance of Meters 3,236,735
Subtotal – Maintenance 12,391,431 Total Distribution Expense 15,829,819
Source: Appendix 1, Schedule 3 MID’s maintenance expenses are larger than its operations expenses for its distribution facilities
4. Customer Accounts
MID’s Customer Accounts O&M expenses reflect the costs to provide retail services to MID’s customers. These include revenue-cycle services (e.g., meter reading, billing) as well as customer assistance. The following table presents the Customer Accounts O&M expenses for the Test Year.
Table 12: Customer Accounts O&M Expenditures ($)
FERC Account
Description O&M Costs ($)
Operation 901 Supervision 719,427 903 Customer Records and Collection 6,424,729 904 Uncollectable Accounts 2,300,000 908 Customer Assistance 4,258,182 Total Customer Accts. Expense 13,702,338
Source: Appendix 1, Schedule 3 MID’s Customer Records and Collections are nearly half of MID’s total Customer Accounts O&M expenses.
5. Administrative & General
MID’s A&G expenses reflect the costs to operate the MID enterprise in its entirety. These consist of two sets of costs: (1) certain costs that are directly assigned to Electric and (2) an
DRAFT

November 19, 2018 MRW & Associates, LLC 13
allocated portion of the A&G costs that are not directly assigned to either Electric or Irrigation.13 The following table presents the O&M expenses related to A&G for the Test Year.
Table 13: Administrative & General Expenditures ($)
FERC Account
Description O&M Costs ($)
920 Administrative and General 41,001,233 921 Public Benefits 4,298,867 927 Franchise Requirements 600,000 Total A&G Expense 45,900,100
Source: Appendix 1, Schedule 3 Note: In Appendix 2, A&G Expenses in Table 5 only include FERC Account 920. FERC Account 921 and
927 are included in the “O&M” line item in Table 5 in Appendix 2. In addition to A&G expenses, Electric receives revenue that reimburses A&G expenses that MID bills to others (i.e., the City of Modesto). This revenue is included as a part of the non-rate revenue received by the Electric Department. This is discussed further below.
C. Debt Service
Debt service represents existing and projected debt service for Electric. The existing debt service within the Test Year Revenue Requirement includes the amortization schedules for MID debt as provided by MID. MID’s debt service costs include a 10% adder to ensure debt service coverage is consistent with bond covenants. Finally, MID plans to accelerate payment of outstanding debt. MID has taken this step for the past several years. The accelerated repayment costs included in the COSA are $24.5 million for 2018.
D. Non-Rate Revenue Electric receives non-rate revenue from various sources. The sources of non-rate revenue include customer service fees and certain interest income.14 In addition, as previously discussed, Electric receives revenue that reimburses A&G expenses that MID bills to others. The following table summarizes the major categories of non-rate revenue. The revenue reimbursing the A&G expenses that MID bills to others is included under the category “Other Operating Income”.
13 For additional information regarding the allocation of A&G expenses that are not directly assigned to the Electric Department, see Appendix 2. 14 See Appendix 2 for further discussion of allocation of interest income to Electric.
DRAFT

November 19, 2018 MRW & Associates, LLC 14
Table 14: MID's Non-Rate Revenue for Electric ($)
Category Amount Other Operating Revenues Customer Service Fee Revenue 1,400,000 Total Other Operating Revenues 1,400,000 Other Income Other Operating Income 7,920,489 Interest Income 2,422,534 Total Other Income 10,343,023 Total Non-Rate Revenue 11,743,023
Source: Appendix 1, Schedule 2
E. Total Revenue Requirements Based on the various categories of expenses and non-rate revenue discussed above, the following summarizes the revenue requirements for MID’s Electric Department for the Test Year.
Table 15: MID’s Revenue Requirements for Electric
Line Category Amount 1 O&M 290,106,182 2 Capital Expenses15 6,465,234 3 Debt Service & Debt Service Coverage16 94,613,189 4 Subtotal 391,184,604 5 Less Non-Rate Revenue -11,743,023 7 Less Discretionary Revenue17 -9,030,000 8 Revenue Requirement 370,411,582
Source: Appendix 1, Schedule 1 Note that this table does not include any transfers either to or from MID reserves.
III. RATE REVENUE
MID last established its retail electric rates in 2016.18 Based on those rates and MID’s billing determinants, estimates of total rate revenue as well as rate revenue by customer class were developed. The following table summarizes the forecasted rate revenue for the Test Year.
15 This line item is the capital expenditures that MID expenses and pays out of current revenues. Source: MID. 16 This line item equals the sum of Debt Service (principal plus interest), an allocation for defeasance of debt ($24.5 million), plus an allocation for meeting debt service coverage requirements. See Appendix 1 for more details about this line item. 17 Discretionary Revenues is derived from wholesale revenues and certain interest on reserves. The MID Board has discretion to allocate these revenues on the basis of Board policy. 18 The rate adjustment in 2016 only changed rates for residential customers and the rate change was revenue neutral to that class.
DRAFT

November 19, 2018 MRW & Associates, LLC 15
Table 16: Rate Revenue by Customer Class ($)
Line Customer Class Schedule Rate Revenue ($) 1 Residential Residential 155,733,609 2 Small Commercial GS-1 22,958,570 3 Medium/Large Commercial GS-2 76,301,128 4 GS-TOU 4,867,789 5 Industrial GS-3 56,993,098 6 IC-25 23,387,304 7 Agricultural P-3 12,445,627 8 P-4 2,131,909 9 Street Lighting SL-1 1,281,709 10 SL-2 701,636 11 Total 356,802,380
Source: Appendix 1, Schedule 1 Residential is MID’s single largest customer class, with revenues of almost $156 million. GS-2 is MID’s largest commercial customer class, with revenues of about $76.3 million.
IV. COST OF SERVICE RESULTS
Developing the Test Year Revenue Requirement is the first step in the Cost of Service Study, as shown in Figure 2. After determining the system revenue requirement, a COS for each customer class is developed to determine the specific costs to serve each class. Rate revenues for each Customer class revenues are compared to class revenue requirements to evaluate the current rate’s abilities to fully recover costs. MRW reviewed MID’s approach for determination of the cost to serve each customer class based on the revenue requirement developed in Section 3.
Once completed, the COS results indicate the degree to which existing rates recover the costs to serve customers.
A. Functionalization of Revenue Requirement
The second step in the COS and rate design process, as shown in Figure 2, is to functionalize the revenue requirement. Electric’s costs were unbundled into four functions: production, transmission, distribution, and customer service. The assignment of costs by function falls into two general categories: 1) direct assignments and 2) derived allocations. Direct assignments are costs that are readily associated with a specific utility function and are directly assigned to that function. For example, the purchase power contracts are an expense solely related to power supply, so it is directly assigned to that function.
Derived allocators are allocation factors that are based on the sum, average, or weighted effect of different underlying factors. Derived allocators can be complex and should reflect the logical answer to the following question – what underlying activities drive the cost of this item? Each of the four utility functions is described below.
DRAFT

November 19, 2018 MRW & Associates, LLC 16
1. Production Function
The power supply function consists of costs associated with power generation, the cost of purchased power, and procuring and administering power supply contracts.
2. Transmission Function
The transmission function consists of costs associated with operating and maintaining the transmission portion of the high-voltage electric grid and making capital investments, as necessary. The transmission facilities transmit electricity from the generation stations to the distribution system.
3. Distribution Function
The distribution function consists of costs associated with operating and maintaining the distribution portion of the electric grid and making capital investments, as necessary. The distribution facilities deliver power to the retail customers after it has been transmitted from the generation stations via the transmission grid. This includes low voltage distribution lines, distribution poles, underground lines, customer service connections, meters, and lighting-related assets.
4. Customer Service Function
The customer service function consists of costs associated with operating and maintaining the customer related facilities to meet customer support needs. This includes, but is not limited to, customer service, billing and collection, and meter reading.
The revenue requirement determined for the Test Year was unbundled into the four functional areas of the system: production, transmission, distribution, and customer. The results of the functional unbundling are summarized in the following table. These are also illustrated further in Appendix 2.
Table 17: Functionalized Test Year Revenue Requirements ($)
Line Function Amount ($) 1 Production 288,735,307 2 Transmission 15,266,846 3 Distribution 51,599,002 4 Customer Service 14,810,426 5 Total 370,411,582
Source: Appendix 1, Schedule “COSA Model Functional and Classification”
The production function represents approximately 78% of the Test Year Revenue Requirement. The distribution function is the second largest cost center representing approximately 14% of the
DRAFT

November 19, 2018 MRW & Associates, LLC 17
Test Year Revenue Requirement. The transmission function and the customer service function each represent 4% of the Test Year Revenue Requirement.19
B. Classification of Revenue Requirement
The third step in the COS and rate design process, as shown in Figure 2, is to classify the functionalized revenue requirement. System costs can be classified into four generally-accepted rate-making cost classifications: (1) demand or fixed costs; (2) energy or variable costs; (3) customer-related costs; and (4) directly assignable costs. In order to provide a reasonable basis for the assignment of total revenue requirements (costs) to each customer class, costs for each function have been analyzed and classified into four categories as described below.
1. Demand Costs – Capacity (fixed- or demand-related) costs are those costs incurred to maintain a utility system to allow it to meet the total combined demands of its customers. Capacity costs include demand-related purchased power costs, the fixed portion of O&M expenses, debt service, capital expenditures, and other costs that are generally fixed and do not vary materially with the quantity of energy used or that cannot be designated specifically as a customer or variable cost.
2. Energy Costs – Energy, or variable costs, are costs that vary directly with energy usage, including such items as fuel, energy-related purchased power, and a portion of O&M expenses.
3. Customer Costs – Customer costs are those costs directly related to the number and type of customers, such as customer accounting, customer service, billing, and meter related expenses.
4. Direct Assignment Costs – Direct assignment costs are those costs that are readily identifiable and applicable to a particular customer or customer class (e.g., Lighting).20 The Project Team included Discretionary Revenues in the Direct Assignment category.
Once the costs within each function are assigned to each service category, the demand, energy, customer, and direct assignment component of each service is calculated.
19 For this study, the Project Team assigned Discretionary Revenue to the Customer Service function. 20 MID’s direct assignment costs are included in Customer Costs for the purposes of classification under service category.
DRAFT
November 19, 2018 MRW & Associates, LLC 18
Table 18: Classification of MID's Electric Costs
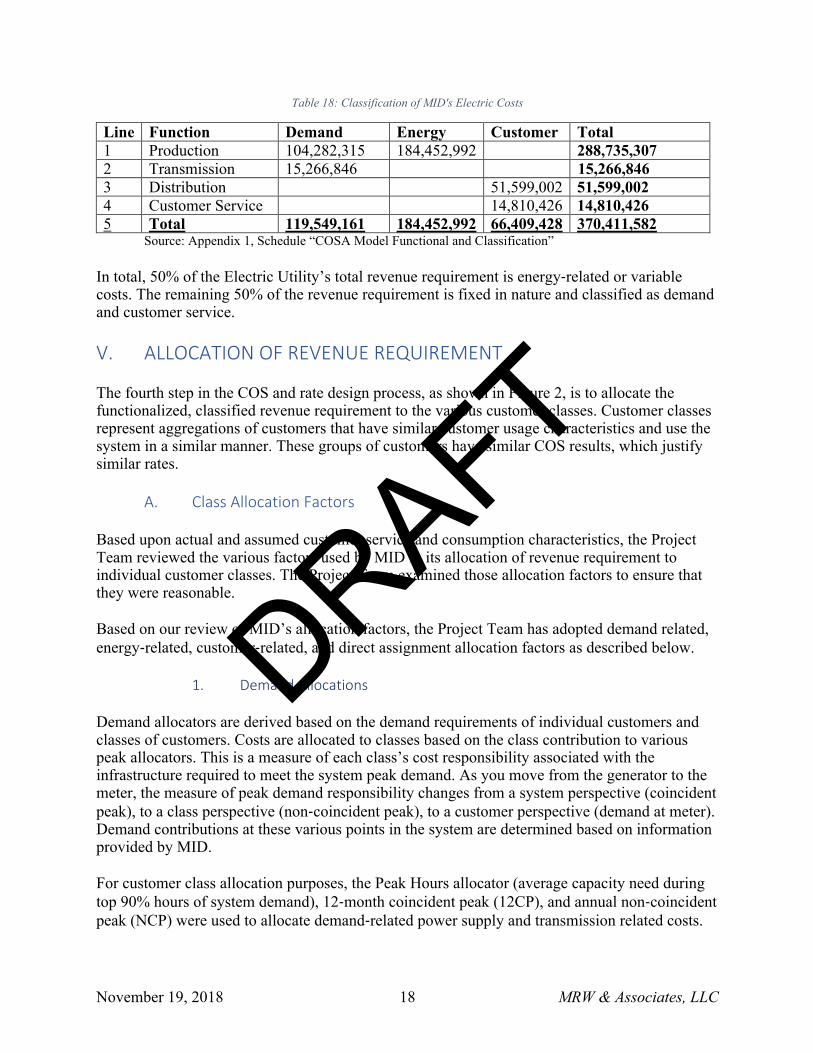
Line Function Demand Energy Customer Total 1 Production 104,282,315 184,452,992 288,735,307 2 Transmission 15,266,846 15,266,846 3 Distribution 51,599,002 51,599,002 4 Customer Service 14,810,426 14,810,426 5 Total 119,549,161 184,452,992 66,409,428 370,411,582
Source: Appendix 1, Schedule “COSA Model Functional and Classification”
In total, 50% of the Electric Utility’s total revenue requirement is energy-related or variable costs. The remaining 50% of the revenue requirement is fixed in nature and classified as demand and customer service.
V. ALLOCATION OF REVENUE REQUIREMENT
The fourth step in the COS and rate design process, as shown in Figure 2, is to allocate the functionalized, classified revenue requirement to the various customer classes. Customer classes represent aggregations of customers that have similar customer usage characteristics and use the system in a similar manner. These groups of customers have similar COS results, which justify similar rates.
A. Class Allocation Factors
Based upon actual and assumed customer service and consumption characteristics, the Project Team reviewed the various factors used by MID in its allocation of revenue requirement to individual customer classes. The Project Team examined those allocation factors to ensure that they were reasonable.
Based on our review of MID’s allocation factors, the Project Team has adopted demand related, energy-related, customer-related, and direct assignment allocation factors as described below.
1. Demand Allocations
Demand allocators are derived based on the demand requirements of individual customers and classes of customers. Costs are allocated to classes based on the class contribution to various peak allocators. This is a measure of each class’s cost responsibility associated with the infrastructure required to meet the system peak demand. As you move from the generator to the meter, the measure of peak demand responsibility changes from a system perspective (coincident peak), to a class perspective (non-coincident peak), to a customer perspective (demand at meter). Demand contributions at these various points in the system are determined based on information provided by MID.
For customer class allocation purposes, the Peak Hours allocator (average capacity need during top 90% hours of system demand), 12-month coincident peak (12CP), and annual non-coincident peak (NCP) were used to allocate demand-related power supply and transmission related costs.
DRAFT

November 19, 2018 MRW & Associates, LLC 19
The 12CP allocator was used to allocate winter and year-round baseload-related power supply costs. The Peak Hours allocator was used to allocate the peaking related power supply costs during summer months. Transmission costs for Electric were also allocated using the Peak Hours method for summer, which recognizes that the transmission system is constructed to deliver power at the times of the maximum system peak.
Similarly, distribution infrastructure is designed to meet the maximum demands of the localized system or customers, so the NCP allocation factor was used for distribution costs at different voltage levels. An NCP allocator is typically used to allocate distribution costs, as these facilities are sized to meet localized peak demands rather than the system peak demand. The NCP method was used to allocate the distribution system demand-related costs associated with substations, poles, conductors, and distribution transformers.
To account for variability in demands and loads between years, the load data for the last 5 years was used to determine the demand allocators.
The following table presents the various demand allocators utilized in the Study. These represent the percentage of demand costs that are allocated to each rate schedule based on their load characteristics. The data behind these factors are illustrated further in Appendix 1.
Table 19: Demand Allocation Factors
Customer Class
Schedule Peak Hours
12CP NCP Sub-transmission
NCP Primary
NCP Secondary
Residential Residential 51.9% 45.4% 49.4% 49.4% 59.3% Small Commercial
GS-1 5.6% 5.5% 5.7% 5.7% 6.8%
Med/Large Commercial
GS-2 17.9% 19.9% 18.0% 18.0% 21.3%
GS-TOU 1.0% 1.2% 0.9% 0.9% 0.2% Industrial GS-3 14.1% 16.4% 14.2% 14.2% 7.8% IC-25 5.8% 8.0% 8.0% 8.0% 0.0% Agricultural P-3 3.2% 2.7% 3.3% 3.3% 4.0% P-4 0.5% 0.6% 0.0% 0.0% 0.0% Street Lights SL-1 0.1% 0.2% 0.4% 0.4% 0.5% SL-2 0.0% 0.1% 0.1% 0.1% 0.1%
Source: Derived from Appendix 1, Schedule “COSA Model Allocation Factors”
2. Energy Allocations
Energy allocation factors are the basis for allocating costs or expenses classified as variable or energy related and are assumed to vary directly with kWh sales. Energy-related costs classified as variable were energy costs from fuel, purchased power, and costs related to system control and load dispatching. The energy necessary to supply each customer class21 is used to allocate these types of costs to individual customer classes. The following table lists the energy allocation
21 This accounts for energy losses that occur on the transmission and distribution system when delivering energy to customers.
DRAFT

November 19, 2018 MRW & Associates, LLC 20
factor utilized in the Study. The energy at input is the actual energy that has to be generated to account for the losses that will result over the transmission and distribution system. The load data behind these factors are illustrated further in Appendix 1.
Table 20: Energy Allocation Factors
Customer Class
Schedule Summer Energy at Input
Winter Energy at Input
Annual Energy at Input
Residential Residential 34.5% 34.9% 34.7% Small Commercial
GS-1 5.3% 5.8% 5.6%
Med/Large Commercial
GS-2 20.6% 23.3% 22%
GS-TOU 1.4% 1.6% 1.5% Industrial GS-3 22.1% 18.6% 20.3% IC-25 10.6% 11.8% 11.2% Agricultural P-3 4.1% 2.8% 3.4% P-4 0.9% 0.7% 0.8% Street Lights SL-1 0.4% 0.5% 0.4% SL-2 0.1% 0.1% 0.1%
Source: Derived from Appendix 1, Schedule “COSA Model Allocation Factors”
3. Customer Allocations
Customer costs are defined as those costs related to the number of customers and the type of service required. Included in the customer-related costs are the costs associated with meter reading, customer service, sales, billing, collection, and other customer-related activities. The customer allocation factors were largely based on the number of customers in each class.
In allocating certain customer-related costs to the various customer classifications, weighted customer allocation factors were utilized. Weighting reflects that servicing certain types of customers requires more effort and expenses than other types of customers. Weighting factors were adopted from information provided by MID staff. Weighting factors reflect the relationships between the customer classes and the types of equipment or services needed to serve the class and the relative costs of those items. For example, large customers may have more than one meter per customer while residential customers usually have one meter per customer. Thus, the weighting factor for meters is 1 for residential customers, while it is a higher number for commercial customers. The number of customer accounts in each class are shown in the table below. Further details can be found in Appendix 1.
DRAFT

November 19, 2018 MRW & Associates, LLC 21
Table 21: Number of Customers by Schedule
Customer Class Schedule Customers Residential Residential 95,835 Small Commercial GS-1 10,388 Med/Large Commercial GS-2 2,251 GS-TOU 19 Industrial GS-3 43 IC-25 1 Agricultural P-3 1,725 P-4 1 Street Lights SL-1 200 SL-2 3,746
Source: Appendix 1, Schedule “COSA Model Allocation Factors”
4. Direct Assignment Allocations
Certain costs are not allocated to customer classes using the revenue allocators. Instead, those costs are directly assigned to the customer class that is responsible for them. An example of a directly-assigned cost would be O&M costs related to maintenance of streetlight equipment. MID’s direct assignment allocations are included in the Customer Cost classification.
As discussed elsewhere, the Project Team assigned Discretionary Revenues (e.g., wholesale revenues, certain interest income) to specific customer classes.
B. Cost of Service Results
The unbundled COS results by customer class is shown in the following table.
Table 22: Unbundled Revenue Requirements by Class ($)
Function-alized by Class
Res GS-1 GS-2 GS-TOU
GS-3 IC-25 P-3 P-4 SL-1 SL-2 Total
Production 114,666,239 16,214,469 60,758,333 3,908,541 52,625,628 27,859,168 9,440,513 2,103,818 934,532 224,069 288,735,307
Transmission 7,412,081 865,284 2,973,998 169,527 2,223,746 1,048,978 450,005 90,064 26,339 6,823 15,266,846
Distribution 26,206,599 3,021,295 9,513,115 415,331 6,855,472 3,550,086 1,766,612 221,823 48,670 51,599,002
Customer 16,150,043 2,063,889 632,722 8,541 (786,854) (4,582,638) 791,027 196 109,584 423,917 14,810,426
Total COS 164,434,962 22,164,937 73,878,168 4,501,940 60,917,991 27,875,594 12,069,345 2,411,569 1,185,176 701,850 370,411,582
Classified by Class
Energy 63,998,526 10,302,344 40,448,819 2,751,314 37,458,545 20,707,922 6,363,502 1,489,017 755,351 177,653 184,452,992 Demand 58,079,794 6,777,409 23,283,512 1,326,754 17,390,829 8,200,223 3,527,016 704,865 205,520 53,238 119,549,161 Customer 42,356,642 5,085,184 10,145,837 423,871 6,068,618 (1,032,552) 2,557,639 196 331,407 472,587 66,409,428 Total COS 164,434,962 22,164,937 73,878,168 4,501,940 60,917,991 27,875,594 12,448,157 2,194,078 1,292,278 703,478 370,411,582
Source: Appendix 1, Schedule “COSA Model Functional and Classification”
As can be seen from the above table, the residential rate class is MID’s biggest rate class, followed by GS-2, which is a medium/large commercial class, and GS-3 which is an industrial class. MID’s production function is by far the costliest function, while costs are slightly more evenly distributed when classified between demand, energy and customer costs, as the distribution costs are included in the Customer costs classification.
DRAFT

November 19, 2018 MRW & Associates, LLC 22
C. Cost of Service Results Compared to Current Revenue
Estimated operating costs were developed by the Project Team to compare the revenue generated under current rates to the current operating costs of Electric. The following table summarizes the variance between the Test Year Revenue Requirement and the annual revenue generated from current rates, by customer class. The result of comparing the projected revenues to the customer class revenue requirements indicate the degree to which existing rates recover revenues from each customer class on a COS basis.
Table 23: Cost of Service Compared to Rates ($)
Line Customer Class
Schedule Cost of Service
[a]
Test Year Rate
Revenues [b]
Difference ($)
[c] = [a]-[b]
Difference (%)
[d]=[c]/[b]
1 Residential Residential 164,434,962 155,733,609 8,701,353 5.6% 2 Small
Commercial GS-1 22,164,937 22,958,570 (793,634) -3.5%
3 M/L Commercial
GS-2 73,878,168 76,301,128 (2,422,960) -3.2%
4 GS-TOU 4,501,940 4,867,789 (365,850) -7.5% 5 Industrial GS-3 60,917,991 56,993,098 3,924,893 6.9% 6 IC-25 27,875,594 23,387,304 4,488,289 19.2% 7 Agricultural P-3 12,448,157 12,445,627 2,530 0.02% 8 P-4 2,194,078 2,131,909 62,169 2.9% 9 Street Lights SL-1 1,292,278 1,281,709 10,569 0.8% 10 SL-2 703,478 701,636 1,842 0.3% 11 Total 370,411,582 356,802,380 13,609,202 3.8%
Source: Appendix 1, Schedule 1
As shown in Table 23, overall COS analysis forecasts that current costs are $370,411,582 and the current rate revenue is $356,802,380.
Table 23 shows that all customer classes except for tariffs serving Small and Medium/Large Commercial customers are paying less than their costs of service (i.e., Test Year rate revenues are less than Cost of Service). For example, Residential’s Cost of Service is $164,434,962 but its Rate Revenues under current rates are only $155,733,609, meaning that Residential’s Cost of Service is 5.6% greater than its rate revenue. The levels of under- or over-collection for each customer class on a percentage basis are, on an absolute value basis, less than was found in late 2010, meaning that the current MID rates are “closer” to cost of service than what was found in 2010. The following table presents the level of under- or over-collection in late 2010 and under MID’s current rates.
DRAFT
November 19, 2018 MRW & Associates, LLC 23
Table 24: Comparison of Under- or Over-Collection of Costs Under Current Rates Compared to Rates and Costs in 2010 (%)
Line Customer Class Schedule Under/(Over) Collection of Costs in 2010 (%)
Under/(Over) Collection of Costs Under Current Rates (%)
1 Residential Residential 5.6% 5.6% 2 Small Commercial GS-1 -3.9% -3.5% 3 M/L Commercial GS-2 -9.7% -3.2% 4 GS-TOU -8.4% -7.5% 5 Industrial GS-3 6.9% 6.9% 6 IC-25 19.3% 19.2% 7 Agricultural P-3 3.0% 0.02% 8 P-4 4.8% 2.9% 9 Street Lights SL-1 3.5% 0.8% 10 SL-2 105.0% 0.3%
Source: MID and Appendix 1, Schedule 1
D. Grandfathering Under Proposition 26 As shown in Table 24 above, MID historically has over-recovered costs from rates paid by commercial customers taking service under Schedules GS-1, GS-2, and GS-TOU, and its policy to do so is pre-Proposition 26 legislation that is grandfathered by the measure. Commercial customers will continue to pay above their cost of service, as permitted by pre-Proposition 26 legislative choices which survive it. Moreover, because the proposed percentage of revenue allocation for those customers will decrease the extent to which commercial customers pay more than the cost of service (i.e., bringing them closer to service cost), they do not violate Proposition 26.
Based on this, the Project Team believes that the rates currently in effect at MID are reasonable.
VI. CONCLUSIONS
The Project Team concludes:
• The rates currently in force at MID are reasonable given the cost of service for MID. • The rate revenue collected by Electric is less than MID’s cost of service for Electric. • Any under- or over-collection of cost of service by Electric pursuant to the rates currently
in effect are similar or less than the level of under- or over-collection of cost of service by Electric as was found in early 2011 (based on a Cost of Service Analysis prior to the enactment of Proposition 26), meaning that the MID rates that are currently in force are reasonable based on the grandfathering of the levels of under- or over-collection found in early 2011.
DRAFT

November 19, 2018 MRW & Associates, LLC
APPENDIX 1
SUPPORTING TABLES
DRAFT

2018 DRAFT COSA 2018-11-06 clean.xlsx11/6/18 5:14 PM Page 1 of 1
MIDCOST OF SERVICE STUDY
2018 TEST YEAR Allocation Factor
FERC Alloc Allocation SystemAccountCost Element Factor Basis Total Residential GS-1 GS-2 GS-TOU GS-3 IC-25 SL-1 SL-2 P-3 P-4
Schedule 1: Summary of Results
A. REVENUE REQUIREMENT CALCULATION (CASH BASIS)
Operating Expenses:1 Operation & Maintenance Expenses 91 Schedule 3 290,106,182 121,597,891 16,709,984 57,911,467 3,709,300 50,237,912 26,869,993 1,018,300 626,431 9,487,562 1,937,342
2 Public Purpose/DSM Programs 3 Annual Energy Sales - - - - - - - - - - -
34 Total Operating Expenses - 290,106,182 121,597,891 16,709,984 57,911,467 3,709,300 50,237,912 26,869,993 1,018,300 626,431 9,487,562 1,937,342
56 Operating Margin:7 Capital Improvements 52 Rate Base 6,465,234 3,405,258 391,673 1,138,010 56,478 820,136 399,420 19,522 5,490 210,953 18,293
8 Principal Portion of Debt Service 52 Rate Base 57,895,000 30,493,472 3,507,357 10,190,676 505,755 7,344,168 3,576,733 174,815 49,161 1,889,049 163,814
9 Debt Service 52 Rate Base 29,480,626 15,527,535 1,785,976 5,189,179 257,535 3,739,713 1,821,303 89,017 25,033 961,920 83,416
10 Debt Service Coverage 52 Rate Base 7,237,563 3,812,046 438,461 1,273,956 63,225 918,108 447,134 21,854 6,146 236,154 20,479
11 Total Operating Margin - 101,078,422 53,238,312 6,123,466 17,791,821 882,993 12,822,125 6,244,589 305,208 85,829 3,298,076 286,002
1213 Total Required Revenues - 391,184,604 174,836,203 22,833,450 75,703,288 4,592,293 63,060,037 33,114,582 1,323,509 712,261 12,785,638 2,223,344
1415 Less: Other Operating Revenues 90 Schedule 2 (1,400,000) (1,353,539) (41,919) (4,542) - - - - - - -
16 Less: Other Income 90 Schedule 2 (19,373,023) (9,047,701) (626,594) (1,820,579) (90,354) (2,142,046) (5,238,988) (31,231) (8,783) (337,481) (29,266)
1920 Required Revenues From Sales - 370,411,582 164,434,962 22,164,937 73,878,168 4,501,940 60,917,991 27,875,594 1,292,278 703,478 12,448,157 2,194,078
2122 Revenues at Existing Rates 90 Schedule 2 356,802,380 155,733,609 22,958,570 76,301,128 4,867,789 56,993,098 23,387,304 1,281,709 701,636 12,445,627 2,131,909
2324 Increase (Decrease) Required - $ - 13,609,202 8,701,353 (793,634) (2,422,960) (365,850) 3,924,893 4,488,289 10,569 1,842 2,530 62,169
25 - % 3.8% 5.6% -3.5% -3.2% -7.5% 6.9% 19.2% 0.8% 0.3% 0.0% 2.9%
2627 B. BILLING UNITS2829 Energy (MWh): energy sales
30 Annual 2,590,737 899,077 144,915 569,212 38,701 524,697 291,344 10,655 2,503 88,828 20,805
3334 Demand (kW): billing demands
35 Annual - - 1,100,000 - - - - - - -
36 Summer - - 522,935 - - - - - - -
37 Winter - - 577,065 - - - - - - -
3839 Customers (#) average # customers 114,210 95,835 10,388 2,251 19 43 1 200 3,746 1,725 1
41 C. UNIT COSTS4243 Customer Cost: Customer Cost ($) 66,409,428$ 42,356,642$ 5,085,184$ 10,145,837$ 423,871$ 6,068,618$ (1,032,552)$ 331,407$ 472,587$ 2,557,639$ 196$
4445 Unit Cost $/customer/month $48.46 $36.83 $40.79 $375.60 $1,859.08 $11,760.89 ($86,046.01) $137.89 $10.51 $123.56 $16.31
4647 Energy Cost: Energy Cost ($) 184,452,992$ 63,998,526$ 10,302,344$ 40,448,819$ 2,751,314$ 37,458,545$ 20,707,922$ 755,351$ 177,653$ 6,363,502$ 1,489,017$
4849 Unit Cost cents/kWh 7.12 7.12 7.11 7.11 7.11 7.14 7.11 7.09 7.10 7.16 7.16
5253 Demand Cost: Demand Cost ($) 119,549,161$ 58,079,794$ 6,777,409$ 23,283,512$ 1,326,754$ 17,390,829$ 8,200,223$ 205,520$ 53,238$ 3,527,016$ 704,865$ 5455 Unit Cost $/kW/month $21.17
5859 Unit Cost cents/kWh 4.61 6.46 4.68 4.09 3.43 3.31 2.81 1.93 2.13 3.97 3.39
6263 Total (Customer/Energy/Demand): Total Cost ($) 370,411,582$ 164,434,962$ 22,164,937$ 73,878,168$ 4,501,940$ 60,917,991$ 27,875,594$ 1,292,278$ 703,478$ 12,448,157$ 2,194,078$
6465 Unit Cost cents/kWh 14.30 18.29 15.30 12.98 11.63 11.61 9.57 12.13 28.11 14.01 10.55
DRAFT
William A. Monsen
SCHEDULE 1
William A. Monsen

2018 DRAFT COSA 2018-11-06 clean.xlsx11/6/18 5:16 PM Page 1 of 1
MIDCOST OF SERVICE STUDY
2018 TEST YEAR Allocation Factor
FERC Alloc Allocation SystemAccountCost Element Factor Basis Total Residential GS-1 GS-2 GS-TOU GS-3 IC-25 SL-1 SL-2 P-3 P-4
68 Schedule 2: Operating Revenues69707172 Residential Sales 155,733,609 155,733,609
7374 Commercial and Industrial Sales:
75 GS-1 22,958,570 22,958,570
76 GS-2 < 500 kW 76,301,128 76,301,128
77 GS-2 > 500 kW -
79 GS-TOU 4,867,789 4,867,789
80 GS-3 56,993,098 56,993,098
82 IC-10 23,387,304 23,387,304
8687 Street Lighting Sales:
88 SL-1 1,281,709 1,281,709
89 SL-2 701,636 701,636
9091 Municipal and Pumping (P-3) Sales 12,445,627 12,445,627
92 P-4 Sales 2,131,909 2,131,909
93 Total Electric Sales Revenues 356,802,380 155,733,609 22,958,570 76,301,128 4,867,789 56,993,098 23,387,304 1,281,709 701,636 12,445,627 2,131,909
949596 Customer Service Fee Revenue 37 Uncollectible Accounts 1,400,000 1,353,539 41,919 4,542 - - - - - - -
97 Miscellaneous Service Revenues -
98 Sales of Water and Water Power -
99 Rent from Electric Property -
100 Other Electric Revenues -
101102 Total Other Operating Revenues - 1,400,000 1,353,539 41,919 4,542 - - - - - - -
103104 Other Operating Income 52 Rate Base 7,920,489 4,171,745 479,834 1,394,164 69,191 1,004,740 489,325 23,916 6,726 258,437 22,411
105 Revenues from Nonutility Operations - - - - - - - - - - - -
106 Expenses of Nonutility Operations - - - - - - - - - - - -
107 Interest Income 52 Rate Base 2,422,534 1,275,956 146,760 426,414 21,163 307,306 149,663 7,315 2,057 79,045 6,855
108 Sales of Economy Energy 44 Discretionary Revs 9,030,000 3,600,000 - - - 830,000 4,600,000 - - - -
109110 Total Other Income - 19,373,023 9,047,701 626,594 1,820,579 90,354 2,142,046 5,238,988 31,231 8,783 337,481 29,266
111112 TOTAL REVENUES AND INCOME - 377,575,403 166,134,850 23,627,084 78,126,248 4,958,143 59,135,144 28,626,292 1,312,940 710,419 12,783,108 2,161,175 DRAFT
William A. Monsen
SCHEDULE 2

2018 DRAFT COSA 2018-11-06 clean.xlsx11/6/18 5:17 PM Page 1 of 4
MIDCOST OF SERVICE STUDY
2018 TEST YEAR Allocation Factor
FERC Alloc Allocation SystemAccountCost Element Factor Basis Total Residential GS-1 GS-2 GS-TOU GS-3 IC-25 SL-1 SL-2 P-3 P-4
113 Schedule 3: O&M Expenses114115 POWER PRODUCTION EXPENSES:116117 Hydraulic Power Generation:118119 Oper. Supervision and Engineering120 Summer 11 Peak Hours - Peak Prod 27,600 14,695 1,621 5,215 281 3,262 1,427 23 6 921 149 121 Winter 12 12 CP - Baseload Prod 41,400 18,805 2,290 8,226 485 6,789 3,314 96 25 1,113 258 122 Hydraulic Expenses123 Summer 11 Peak Hours - Peak Prod 4,600 2,449 270 869 47 544 238 4 1 153 25 124 Winter 12 12 CP - Baseload Prod 6,900 3,134 382 1,371 81 1,131 552 16 4 186 43 125 Electric Expenses126 Summer 11 Peak Hours - Peak Prod 27,600 14,695 1,621 5,215 281 3,262 1,427 23 6 921 149 127 Winter 12 12 CP - Baseload Prod 41,400 18,805 2,290 8,226 485 6,789 3,314 96 25 1,113 258 128 Misc. Hydro Power Generation Exp.129 Summer 11 Peak Hours - Peak Prod 101,588 54,088 5,966 19,196 1,035 12,006 5,252 85 22 3,389 550 130 Winter 12 12 CP - Baseload Prod 152,382 69,215 8,428 30,278 1,786 24,987 12,198 354 92 4,097 948 131 132 Subtotal - Operation - 403,471 195,886 22,868 78,597 4,480 58,769 27,722 696 180 11,893 2,380 133134 Maint. Supervision and Engineering135 Summer 11 Peak Hours - Peak Prod 9,554 5,087 561 1,805 97 1,129 494 8 2 319 52 136 Winter 12 12 CP - Baseload Prod 14,330 6,509 793 2,847 168 2,350 1,147 33 9 385 89 137 Maint. Of Res., Dams, and Waterways138 Summer 11 Peak Hours - Peak Prod 147,200 78,373 8,645 27,814 1,499 17,396 7,610 123 32 4,911 797 139 Winter 12 12 CP - Baseload Prod 220,800 100,291 12,213 43,873 2,587 36,206 17,675 512 133 5,936 1,374 140 Maintenance of Electric Plant141 Summer 11 Peak Hours - Peak Prod 176,652 94,055 10,374 33,379 1,799 20,877 9,132 147 38 5,894 957 142 Winter 12 12 CP - Baseload Prod 264,978 120,358 14,656 52,651 3,105 43,450 21,212 615 159 7,124 1,649 143 Maint. of Misc. Hydro Power Plant144 Summer 11 Peak Hours - Peak Prod 13,997 7,453 822 2,645 143 1,654 724 12 3 467 76 145 Winter 12 12 CP - Baseload Prod 20,996 9,537 1,161 4,172 246 3,443 1,681 49 13 564 131 146 147 Subtotal - Maintenance - 868,508 421,662 49,225 169,186 9,644 126,505 59,675 1,498 388 25,600 5,124 148149 Total Hydro Power Expense - 1,271,978 617,548 72,092 247,783 14,124 185,274 87,397 2,194 568 37,493 7,504 150151 Other Power Generation:152153 Oper. Supervision and Engineering 60 Other Power Operation 8,629,732 3,184,622 483,525 1,859,456 123,568 1,671,745 908,616 32,073 7,592 291,826 66,708 154 Fuel155 Summer 5 Summer Energy at Input 11,217,366 3,865,727 596,219 2,305,335 159,107 2,480,827 1,189,589 39,490 9,739 465,287 106,045 156 Winter 6 Winter Energy at Input 11,609,881 4,054,611 678,887 2,701,100 181,419 2,154,078 1,373,435 54,016 12,251 321,917 78,167 157 Generation Expenses158 Summer 11 Peak Hours - Peak Prod 2,001,764 1,065,795 117,557 378,244 20,387 236,573 103,485 1,666 432 66,786 10,840 159 Winter 12 12 CP - Baseload Prod 2,071,810 941,053 114,594 411,665 24,276 339,727 165,851 4,808 1,245 55,699 12,891 162163 Subtotal - Operation - 35,530,553 13,111,808 1,990,782 7,655,800 508,758 6,882,950 3,740,976 132,053 31,259 1,201,515 274,651 164165 Maint. Supervision and Engineering 61 Other Power Maint. 180,646 87,704 10,239 35,190 2,006 26,313 12,412 312 81 5,325 1,066 169 Maintenance of Generating Units170 Summer 11 Peak Hours - Peak Prod 950,694 506,176 55,831 179,639 9,682 112,355 49,148 791 205 31,718 5,148 171 Winter 12 12 CP - Baseload Prod 1,426,041 647,733 78,876 283,352 16,709 233,836 114,157 3,309 857 38,338 8,873 172 Maint. of Misc. Other Power Gener. Plt173 Summer 11 Peak Hours - Peak Prod 843,068 448,873 49,510 159,302 8,586 99,636 43,584 702 182 28,128 4,566 174 Winter 12 12 CP - Baseload Prod 1,264,602 574,405 69,947 251,274 14,818 207,364 101,233 2,934 760 33,998 7,868 175176 Subtotal - Maintenance - 4,665,052 2,264,891 264,403 908,757 51,802 679,504 320,534 8,048 2,085 137,507 27,521 177
DRAFT
William A. Monsen
SCHEDULE 3

2018 DRAFT COSA 2018-11-06 clean.xlsx11/6/18 5:17 PM Page 2 of 4
MIDCOST OF SERVICE STUDY
2018 TEST YEAR Allocation Factor
FERC Alloc Allocation SystemAccountCost Element Factor Basis Total Residential GS-1 GS-2 GS-TOU GS-3 IC-25 SL-1 SL-2 P-3 P-4
178 Total Other Power Production Expense - 40,195,604 15,376,699 2,255,184 8,564,557 560,560 7,562,455 4,061,510 140,101 33,344 1,339,022 302,172 179180 Other Power Supply Expenses:181182 Purchased Power:183 Demand184 Summer 11 Peak Hours - Peak Prod 21,952,316 11,688,022 1,289,182 4,148,003 223,576 2,594,379 1,134,865 18,273 4,734 732,402 118,882 185 Winter 12 12 CP - Baseload Prod 32,928,474 14,956,701 1,821,316 6,542,833 385,836 5,399,474 2,635,969 76,410 19,793 885,263 204,879 186 Energy187 Summer 5 Summer Energy at Input 47,891,203 16,504,261 2,545,484 9,842,352 679,289 10,591,596 5,078,809 168,598 41,580 1,986,487 452,748 188 Winter 6 Winter Energy at Input 47,664,199 16,646,145 2,787,161 11,089,328 744,814 8,843,537 5,638,619 221,762 50,297 1,321,625 320,912 189 Total - 150,436,193 59,795,128 8,443,143 31,622,516 2,033,515 27,428,985 14,488,262 485,042 116,403 4,925,777 1,097,421 190191 System Control and Load Dispatching192 Summer 5 Summer Energy at Input 3,611,801 1,244,698 191,972 742,279 51,230 798,784 383,028 12,715 3,136 149,814 34,145 193 Winter 6 Winter Energy at Input 4,045,562 1,412,864 236,564 941,221 63,217 750,607 478,585 18,822 4,269 112,175 27,238 194195 Hydro Water Charge:196 Capacity - Summer 11 Peak Hours - Peak Prod 509,627 271,339 29,929 96,297 5,190 60,229 26,346 424 110 17,003 2,760 197 Capacity - Winter 12 12 CP - Baseload Prod 764,440 347,222 42,282 151,893 8,957 125,350 61,194 1,774 460 20,552 4,756 198 Energy - Summer 5 Summer Energy at Input 2,485,267 856,472 132,095 510,759 35,251 549,641 263,560 8,749 2,158 103,087 23,495 199 Energy - Winter 6 Winter Energy at Input 2,572,231 898,321 150,411 598,443 40,194 477,248 304,292 11,968 2,714 71,322 17,318 200201 Total Other Power Supply Expense - 164,425,121 64,826,045 9,226,396 34,663,408 2,237,555 30,190,843 16,005,267 539,495 129,249 5,399,730 1,207,133 202203 TOTAL PRODUCTION EXPENSE - 205,892,704 80,820,291 11,553,673 43,475,748 2,812,240 37,938,572 20,154,174 681,791 163,162 6,776,245 1,516,808 204205 TRANSMISSION EXPENSES:206207 Operation:208209 Operation Supervision and Engineering 46 Transmission Plant 3,319,470 1,611,608 188,139 646,636 36,860 483,509 228,079 5,727 1,484 97,845 19,583 210 Load Dispatching - - - - - - - - - - - - 211 Station Expenses 46 Transmission Plant 2,556,679 1,241,272 144,906 498,044 28,390 372,402 175,668 4,411 1,143 75,361 15,083 212 Overhead Line Expenses 46 Transmission Plant - - - - - - - - - - - 213 Underground Line Expenses - - - - - - - - - - - - 214 Transmission of Electricity by Others - - - - - - - - - - - - 215 Miscellaneous Transmission Expenses 46 Transmission Plant - - - - - - - - - - - 216 Rents 46 Transmission Plant 414,699 201,337 23,504 80,784 4,605 60,404 28,494 715 185 12,224 2,446 217218 Subtotal - 6,290,847 3,054,218 356,549 1,225,464 69,855 916,315 432,241 10,853 2,811 185,429 37,112 219220 Maintenance:221222 Maint. Supervision and Engineering - - - - - - - - - - - - 223 Maintenance of Structures 46 Transmission Plant - - - - - - - - - - - 224 Maintenance of Station Equipment 46 Transmission Plant - - - - - - - - - - - 225 Maintenance of Overhead Lines 46 Transmission Plant 2,490,374 1,209,081 141,148 485,127 27,654 362,744 171,112 4,297 1,113 73,406 14,692 226 Maintenance of Underground Lines - - - - - - - - - - - - 227 Maint. of Misc. Transmission Plant - - - - - - - - - - - - 228229 Subtotal - 2,490,374 1,209,081 141,148 485,127 27,654 362,744 171,112 4,297 1,113 73,406 14,692 230231 TOTAL TRANSMISSION EXPENSE - 8,781,221 4,263,299 497,696 1,710,591 97,509 1,279,059 603,354 15,150 3,924 258,835 51,803 232233 DISTRIBUTION EXPENSES:234235 Operation:236237 Operation Supervision and Engineering 64 Distribution Operation - - - - - - - - - - -
DRAFT
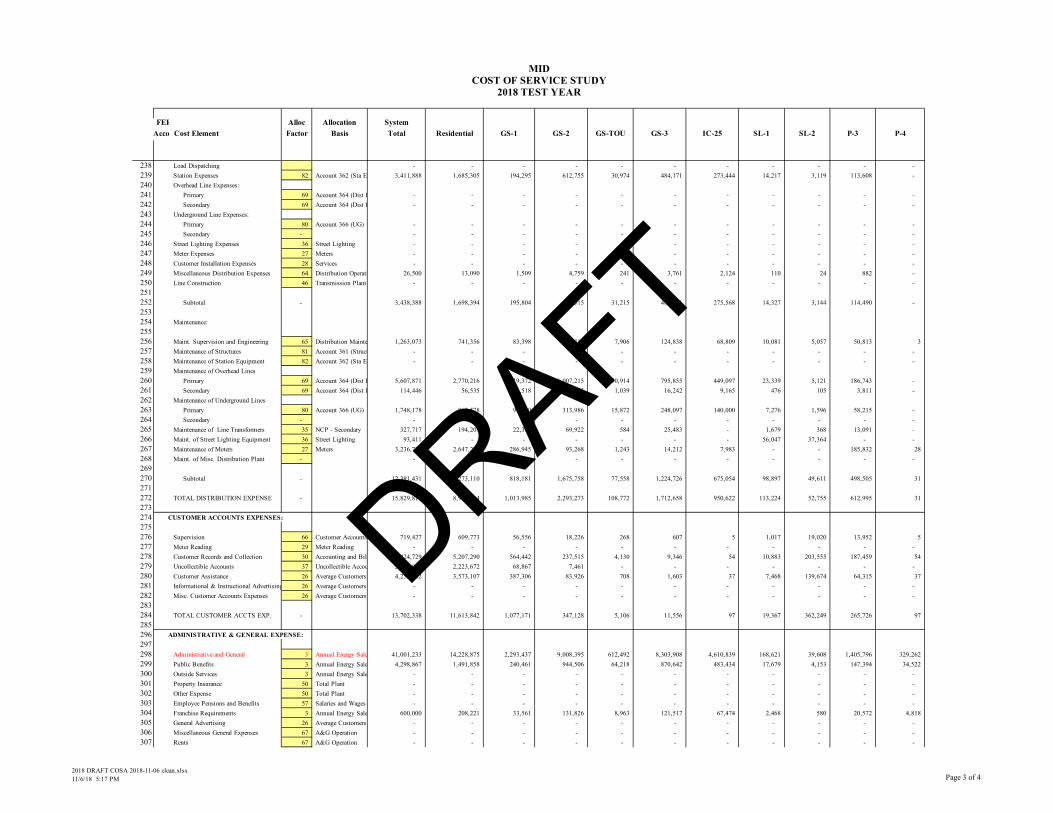
2018 DRAFT COSA 2018-11-06 clean.xlsx11/6/18 5:17 PM Page 3 of 4
MIDCOST OF SERVICE STUDY
2018 TEST YEAR Allocation Factor
FERC Alloc Allocation SystemAccountCost Element Factor Basis Total Residential GS-1 GS-2 GS-TOU GS-3 IC-25 SL-1 SL-2 P-3 P-4
238 Load Dispatching - - - - - - - - - - - 239 Station Expenses 82 Account 362 (Sta Equip) 3,411,888 1,685,305 194,295 612,755 30,974 484,171 273,444 14,217 3,119 113,608 - 240 Overhead Line Expenses:241 Primary 69 Account 364 (Dist Poles) - - - - - - - - - - - 242 Secondary 69 Account 364 (Dist Poles) - - - - - - - - - - - 243 Underground Line Expenses:244 Primary 80 Account 366 (UG) - - - - - - - - - - - 245 Secondary - - - - - - - - - - - - 246 Street Lighting Expenses 36 Street Lighting - - - - - - - - - - - 247 Meter Expenses 27 Meters - - - - - - - - - - - 248 Customer Installation Expenses 28 Services - - - - - - - - - - - 249 Miscellaneous Distribution Expenses 64 Distribution Operation 26,500 13,090 1,509 4,759 241 3,761 2,124 110 24 882 - 250 Line Construction 46 Transmission Plant - - - - - - - - - - - 251252 Subtotal - 3,438,388 1,698,394 195,804 617,515 31,215 487,931 275,568 14,327 3,144 114,490 - 253254 Maintenance:255256 Maint. Supervision and Engineering 65 Distribution Maintenance 1,263,073 741,356 83,398 170,812 7,906 124,838 68,809 10,081 5,057 50,813 3 257 Maintenance of Structures 81 Account 361 (Structures) - - - - - - - - - - - 258 Maintenance of Station Equipment 82 Account 362 (Sta Equip) - - - - - - - - - - - 259 Maintenance of Overhead Lines260 Primary 69 Account 364 (Dist Poles) 5,607,871 2,770,216 319,372 1,007,215 50,914 795,855 449,097 23,339 5,121 186,743 - 261 Secondary 69 Account 364 (Dist Poles) 114,446 56,535 6,518 20,555 1,039 16,242 9,165 476 105 3,811 - 262 Maintenance of Underground Lines263 Primary 80 Account 366 (UG) 1,748,178 863,578 99,560 313,986 15,872 248,097 140,000 7,276 1,596 58,215 - 264 Secondary - - - - - - - - - - - - 265 Maintenance of Line Transformers 35 NCP - Secondary 327,717 194,201 22,389 69,922 584 25,483 - 1,679 368 13,091 - 266 Maint. of Street Lighting Equipment 36 Street Lighting 93,411 - - - - - - 56,047 37,364 - - 267 Maintenance of Meters 27 Meters 3,236,735 2,647,224 286,945 93,268 1,243 14,212 7,983 - - 185,832 28 268 Maint. of Misc. Distribution Plant - - - - - - - - - - - - 269270 Subtotal - 12,391,431 7,273,110 818,181 1,675,758 77,558 1,224,726 675,054 98,897 49,611 498,505 31 271272 TOTAL DISTRIBUTION EXPENSE - 15,829,819 8,971,504 1,013,985 2,293,273 108,772 1,712,658 950,622 113,224 52,755 612,995 31 273274 CUSTOMER ACCOUNTS EXPENSES:275276 Supervision 66 Customer Accounts 719,427 609,773 56,556 18,226 268 607 5 1,017 19,020 13,952 5 277 Meter Reading 29 Meter Reading - - - - - - - - - - - 278 Customer Records and Collection 30 Accounting and Billing 6,424,729 5,207,290 564,442 237,515 4,130 9,346 54 10,883 203,555 187,459 54 279 Uncollectible Accounts 37 Uncollectible Accounts 2,300,000 2,223,672 68,867 7,461 - - - - - - - 280 Customer Assistance 26 Average Customers 4,258,182 3,573,107 387,306 83,926 708 1,603 37 7,468 139,674 64,315 37 281 Informational & Instructional Advertising 26 Average Customers - - - - - - - - - - - 282 Misc. Customer Accounts Expenses 26 Average Customers - - - - - - - - - - - 283284 TOTAL CUSTOMER ACCTS EXP. - 13,702,338 11,613,842 1,077,171 347,128 5,106 11,556 97 19,367 362,249 265,726 97 285296 ADMINISTRATIVE & GENERAL EXPENSE:297298 Administrative and General 3 Annual Energy Sales 41,001,233 14,228,875 2,293,437 9,008,395 612,492 8,303,908 4,610,839 168,621 39,608 1,405,796 329,262 299 Public Benefits 3 Annual Energy Sales 4,298,867 1,491,858 240,461 944,506 64,218 870,642 483,434 17,679 4,153 147,394 34,522 300 Outside Services 3 Annual Energy Sales - - - - - - - - - - - 301 Property Insurance 50 Total Plant - - - - - - - - - - - 302 Other Expense 50 Total Plant - - - - - - - - - - - 303 Employee Pensions and Benefits 57 Salaries and Wages - - - - - - - - - - - 304 Franchise Requirements 3 Annual Energy Sales 600,000 208,221 33,561 131,826 8,963 121,517 67,474 2,468 580 20,572 4,818 305 General Advertising 26 Average Customers - - - - - - - - - - - 306 Miscellaneous General Expenses 67 A&G Operation - - - - - - - - - - - 307 Rents 67 A&G Operation - - - - - - - - - - -
DRAFT
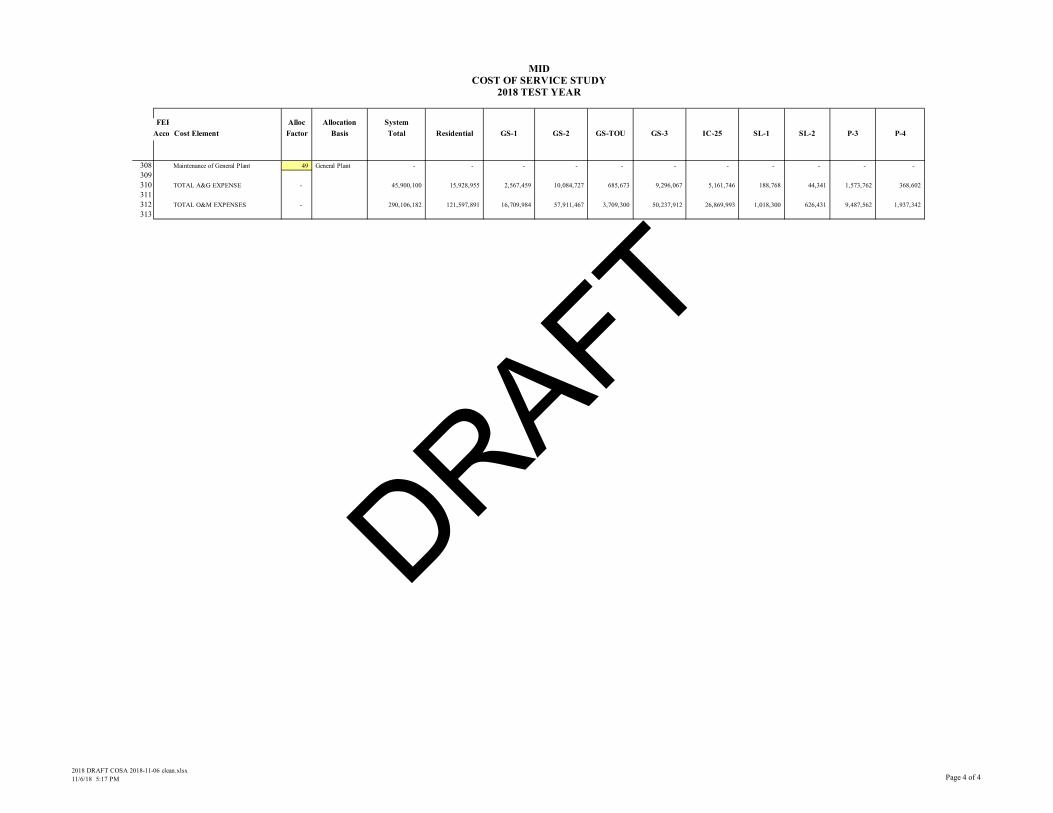
2018 DRAFT COSA 2018-11-06 clean.xlsx11/6/18 5:17 PM Page 4 of 4
MIDCOST OF SERVICE STUDY
2018 TEST YEAR Allocation Factor
FERC Alloc Allocation SystemAccountCost Element Factor Basis Total Residential GS-1 GS-2 GS-TOU GS-3 IC-25 SL-1 SL-2 P-3 P-4
308 Maintenance of General Plant 49 General Plant - - - - - - - - - - - 309310 TOTAL A&G EXPENSE - 45,900,100 15,928,955 2,567,459 10,084,727 685,673 9,296,067 5,161,746 188,768 44,341 1,573,762 368,602 311312 TOTAL O&M EXPENSES - 290,106,182 121,597,891 16,709,984 57,911,467 3,709,300 50,237,912 26,869,993 1,018,300 626,431 9,487,562 1,937,342 313
DRAFT

2018 DRAFT COSA 2018-11-06 clean.xlsx11/6/18 5:17 PM Page 1 of 2
MIDCOST OF SERVICE STUDY
2018 TEST YEAR Allocation Factor
FERC Alloc Allocation SystemAccountCost Element Factor Basis Total Residential GS-1 GS-2 GS-TOU GS-3 IC-25 SL-1 SL-2 P-3 P-4
314 Schedule 4: Electric Plant in Service315316 INTANGIBLE PLANT:317318 Organization - - - - - - - - - - - - 319 Franchises and Consents 79 PTD Plant 17,253 8,953 1,032 3,085 155 2,230 1,083 77 31 555 53 320 Miscellaneous Intangible Plant 79 PTD Plant 50,598,090 26,257,592 3,025,712 9,047,046 454,061 6,540,534 3,175,975 224,426 90,926 1,626,927 154,891 321322 TOTAL INTANGIBLE PLANT - 50,615,343 26,266,545 3,026,744 9,050,131 454,216 6,542,764 3,177,057 224,503 90,957 1,627,482 154,944 323324 PRODUCTION PLANT:325326 Hydraulic Production Plant327328 Land and Land Rights329 Summer 11 Peak Hours - Peak Prod 2,598,043 1,383,270 152,574 490,914 26,460 307,043 134,311 2,163 560 86,679 14,070 330 Winter 12 12 CP - Baseload Prod 3,897,065 1,770,116 215,552 774,340 45,663 639,024 311,965 9,043 2,343 104,770 24,247 331 Structures and Improvements332 Summer 11 Peak Hours - Peak Prod 3,173,586 1,689,705 186,373 599,665 32,322 375,062 164,064 2,642 684 105,881 17,186 333 Winter 12 12 CP - Baseload Prod 4,760,379 2,162,249 263,303 945,879 55,779 780,587 381,075 11,046 2,861 127,980 29,619 334 Reservoirs, Dams, and Waterways335 Summer 11 Peak Hours - Peak Prod 9,001,823 4,792,820 528,645 1,700,941 91,680 1,063,858 465,365 7,493 1,941 300,331 48,749 336 Winter 12 12 CP - Baseload Prod 13,502,735 6,133,183 746,854 2,682,971 158,217 2,214,122 1,080,912 31,333 8,116 363,013 84,013 337 Wtr Wheels, Turbines, & Generators338 Summer 11 Peak Hours - Peak Prod 3,977,067 2,117,500 233,559 751,487 40,505 470,019 205,602 3,311 858 132,688 21,538 339 Winter 12 12 CP - Baseload Prod 5,965,600 2,709,682 329,965 1,185,355 69,901 978,214 477,554 13,843 3,586 160,382 37,118 340 Misc. Power Plant Equipment341 Summer 11 Peak Hours - Peak Prod 407,980 217,220 23,959 77,090 4,155 48,216 21,091 340 88 13,612 2,209 342 Winter 12 12 CP - Baseload Prod 611,969 277,967 33,849 121,597 7,171 100,348 48,989 1,420 368 16,452 3,808 343 Roads, Railroads, and Bridges344 Summer 11 Peak Hours - Peak Prod 352,227 187,535 20,685 66,555 3,587 41,627 18,209 293 76 11,751 1,907 345 Winter 12 12 CP - Baseload Prod 528,340 239,981 29,223 104,980 6,191 86,635 42,294 1,226 318 14,204 3,287 346347 Total Hydraulic Plant - 48,776,812 23,681,230 2,764,541 9,501,775 541,632 7,104,756 3,351,432 84,152 21,799 1,437,745 287,751 348349 Other Production Plant350351 Land and Land Rights - - - - - - - - - - - - 352 Structures and Improvements353 Summer 11 Peak Hours - Peak Prod 13,724,125 7,307,104 805,969 2,593,244 139,775 1,621,951 709,493 11,424 2,959 457,882 74,322 354 Winter 12 12 CP - Baseload Prod 20,586,187 9,350,614 1,138,648 4,090,441 241,217 3,375,637 1,647,952 47,770 12,374 553,448 128,086 355 Fuel Holders, Prod., and Accessories356 Summer 11 Peak Hours - Peak Prod 2,394,326 1,274,806 140,610 452,420 24,385 282,967 123,779 1,993 516 79,883 12,966 357 Winter 12 12 CP - Baseload Prod 3,591,490 1,631,319 198,650 713,623 42,083 588,917 287,504 8,334 2,159 96,555 22,346 358 Prime Movers359 Summer 11 Peak Hours - Peak Prod 39,432,884 20,995,160 2,315,754 7,451,046 401,608 4,660,275 2,038,554 32,824 8,503 1,315,612 213,547 360 Winter 12 12 CP - Baseload Prod 59,149,326 26,866,679 3,271,625 11,752,873 693,077 9,699,060 4,734,984 137,254 35,555 1,590,196 368,024 361 Generators362 Summer 11 Peak Hours - Peak Prod 39,748,995 21,163,466 2,334,318 7,510,777 404,828 4,697,634 2,054,896 33,087 8,571 1,326,159 215,259 363 Winter 12 12 CP - Baseload Prod 59,623,492 27,082,054 3,297,851 11,847,089 698,633 9,776,812 4,772,942 138,355 35,840 1,602,943 370,974 364 Accessory Electric Equipment365 Summer 11 Peak Hours - Peak Prod 11,402,781 6,071,157 669,645 2,154,614 116,133 1,347,609 589,487 9,492 2,459 380,435 61,751 366 Winter 12 12 CP - Baseload Prod 17,104,172 7,769,020 946,054 3,398,571 200,416 2,804,671 1,369,212 39,690 10,281 459,836 106,421 367 Misc. Power Plant Equipment368 Summer 11 Peak Hours - Peak Prod 16,580,953 8,828,159 973,741 3,133,056 168,871 1,959,578 857,182 13,802 3,575 553,196 89,793 369 Winter 12 12 CP - Baseload Prod 24,871,430 11,297,047 1,375,671 4,941,912 291,429 4,078,313 1,990,992 57,713 14,950 668,654 154,749 370371 Total Other Production Plant - 308,210,161 149,636,586 17,468,536 60,039,666 3,422,454 44,893,424 21,176,977 531,739 137,742 9,084,799 1,818,239 372373 TOTAL PRODUCTION PLANT - 356,986,973 173,317,816 20,233,076 69,541,441 3,964,085 51,998,180 24,528,409 615,891 159,541 10,522,543 2,105,990
DRAFT
William A. Monsen
SCHEDULE 4

2018 DRAFT COSA 2018-11-06 clean.xlsx11/6/18 5:17 PM Page 2 of 2
MIDCOST OF SERVICE STUDY
2018 TEST YEAR Allocation Factor
FERC Alloc Allocation SystemAccountCost Element Factor Basis Total Residential GS-1 GS-2 GS-TOU GS-3 IC-25 SL-1 SL-2 P-3 P-4
374375 TRANSMISSION PLANT:376377 350-359MID Transmission378 Summer 17 Pk Needs - Trans Capacity 40,059,146 21,328,599 2,352,532 7,569,382 407,987 4,734,288 2,070,930 33,346 8,638 1,336,506 216,938 379 Winter 18 Trans Capacity for Year Around Needs60,088,719 27,293,368 3,323,584 11,939,528 704,084 9,853,098 4,810,184 139,434 36,119 1,615,451 373,869 380381 TOTAL TRANSMISSION PLANT - 100,147,864 48,621,968 5,676,116 19,508,910 1,112,071 14,587,386 6,881,113 172,780 44,757 2,951,957 590,807 382383 DISTRIBUTION PLANT:384385 Land and Land Rights 81 Account 361 (Structures) 21,785,444 10,760,936 1,240,602 3,912,539 197,776 3,091,506 1,745,985 90,777 19,917 725,405 - 386 Structures and Improvements387 Subtransmission 33 NCP - Subtransmission 3,736,947 1,846,320 212,858 671,299 33,934 530,429 298,733 15,509 3,403 124,462 - 388 Primary 34 NCP - Primary 3,057,502 1,509,803 174,061 548,945 27,749 433,751 245,805 12,802 2,809 101,777 - 389 Station Equipment390 Subtransmission 33 NCP - Subtransmission 44,477,035 21,974,853 2,533,428 7,989,777 403,877 6,313,149 3,555,517 184,589 40,500 1,481,346 - 391 Primary 34 NCP - Primary 36,390,301 17,969,629 2,071,675 6,533,528 330,265 5,162,489 2,925,561 152,374 33,432 1,211,350 - 392 Poles, Towers, and Fixtures393 Subtransmission 39 NCP - Subtransmission OH35,428,756 17,504,353 2,018,034 6,364,360 321,713 5,028,820 2,832,193 147,037 32,261 1,179,985 - 394 Primary 40 NCP - Primary OH16,292,056 8,045,061 927,496 2,925,082 147,860 2,311,263 1,309,783 68,218 14,968 542,325 - 395 Overhead Conductors and Devices396 Subtransmission 39 NCP - Subtransmission OH14,595,059 7,211,009 831,340 2,621,831 132,531 2,071,648 1,166,736 60,573 13,290 486,101 - 397 Primary 40 NCP - Primary OH6,711,596 3,314,204 382,087 1,205,002 60,912 952,137 539,572 28,103 6,166 223,414 - 398 Underground Conduit399 Subtransmission 41 NCP - Subtransmission UG36,282,432 17,926,130 2,066,660 6,517,713 329,465 5,149,992 2,900,436 150,580 33,038 1,208,417 - 400 Primary 42 NCP - Primary UG16,684,622 8,238,911 949,844 2,995,563 151,423 2,366,954 1,341,343 69,862 15,328 555,393 - 401 Underground Conductors and Devices402 Subtransmission 41 NCP - Subtransmission UG42,569,533 21,032,410 2,424,776 7,647,116 386,556 6,042,395 3,403,030 176,673 38,763 1,417,815 - 403 Primary 42 NCP - Primary UG19,575,771 9,666,568 1,114,435 3,514,641 177,662 2,777,105 1,573,774 81,968 17,984 651,633 - 404 Line Transformers 35 NCP - Secondary 63,901,476 37,867,137 4,365,611 13,633,996 113,928 4,968,993 - 327,331 71,819 2,552,660 - 405 Services 28 Services 31,211,508 26,785,122 2,903,364 629,137 5,310 6,009 - - - 882,287 279 406 Meters 27 Meters 24,066,773 19,683,462 2,133,582 693,496 9,243 105,673 59,357 - - 1,381,755 205 407 Installations on Customer Premises 28 Services 4,639,662 3,981,670 431,592 93,523 789 893 - - - 131,154 42 408 Leased Property on Customer Premises 36 Street Lighting 2,588,592 - - - - - - 1,553,155 1,035,437 - - 409 Street Lighting Equipment 36 Street Lighting - - - - - - - - - - - 410411 TOTAL DISTRIBUTION PLANT - 423,995,064 235,317,578 26,781,443 68,497,547 2,830,993 47,313,206 23,897,824 3,119,551 1,379,117 14,857,277 526 412413 GENERAL PLANT:414415 Land and Land Rights 79 PTD Plant - - - - - - - - - - - 416 Structures and Improvements 79 PTD Plant 827,015 429,175 49,455 147,872 7,422 106,904 51,911 3,668 1,486 26,592 2,532 417 Office Furniture and Equipment 57 Salaries and Wages 296,292 162,774 18,600 48,477 2,453 34,773 16,809 1,135 1,471 8,892 909 418 Transportation Equipment 58 PTD Salaries & Wages - - - - - - - - - - - 419 Stores Equipment 59 Materials & Supplies - - - - - - - - - - - 420 Tools, Shop, and Garage Equipment 58 PTD Salaries & Wages 789,134 403,589 46,636 143,934 7,459 104,912 50,586 3,020 1,179 24,899 2,919 421 Laboratory Equipment 79 PTD Plant 744,014 386,102 44,491 133,031 6,677 96,175 46,701 3,300 1,337 23,923 2,278 422 Power Operated Equipment 58 PTD Salaries & Wages - - - - - - - - - - - 423 Communication Equipment 58 PTD Salaries & Wages 2,774,597 1,419,022 163,973 506,073 26,226 368,873 177,860 10,618 4,145 87,545 10,262 424 Miscellaneous Equipment 70 Accounts 391-397 43,564,592 22,439,628 2,589,820 7,868,017 405,130 5,722,137 2,762,560 171,004 76,945 1,374,479 154,871 426427 TOTAL GENERAL PLANT - 48,995,643 25,240,290 2,912,975 8,847,404 455,367 6,433,774 3,106,426 192,744 86,562 1,546,330 173,770 428429 TOTAL PLANT IN SERVICE - 980,740,888 508,764,197 58,630,354 175,445,433 8,816,731 126,875,311 61,590,830 4,325,469 1,760,935 31,505,589 3,026,038 430
DRAFT

2018 DRAFT COSA 2018-11-06 clean.xlsx11/6/18 5:18 PM Page 1 of 2
MIDCOST OF SERVICE STUDY
2018 TEST YEAR Allocation Factor
FERC Alloc Allocation SystemAccountCost Element Factor Basis Total Residential GS-1 GS-2 GS-TOU GS-3 IC-25 SL-1 SL-2 P-3 P-4
431 Schedule 5: Accumulated Depreciation432433 INTANGIBLE PLANT:434435 Organization - - - - - - - - - - - - 436 Franchises and Consents 79 PTD Plant 8,103 4,205 485 1,449 73 1,047 509 36 15 261 25 437 Miscellaneous Intangible Plant 79 PTD Plant 9,804,880 5,088,187 586,321 1,753,133 87,988 1,267,422 615,439 43,489 17,620 315,265 30,015 438439 TOTAL INTANGIBLE PLANT - 9,812,983 5,092,392 586,806 1,754,582 88,060 1,268,470 615,948 43,525 17,634 315,526 30,040 440441 PRODUCTION PLANT:442443 Hydraulic Production Plant444445 Structures and Improvements446 Summer 11 Peak Hours - Peak Prod 1,634,740 870,381 96,003 308,893 16,649 193,198 84,511 1,361 352 54,540 8,853 447 Winter 12 12 CP - Baseload Prod 2,452,110 1,113,792 135,629 487,230 28,732 402,087 196,295 5,690 1,474 65,924 15,257 448 Reservoirs, Dams, and Waterways449 Summer 11 Peak Hours - Peak Prod 3,961,593 2,109,262 232,650 748,563 40,347 468,191 204,802 3,298 854 132,172 21,454 450 Winter 12 12 CP - Baseload Prod 5,942,389 2,699,139 328,681 1,180,743 69,629 974,408 475,696 13,789 3,572 159,758 36,973 451 Wtr Wheels, Turbines, & Generators452 Summer 11 Peak Hours - Peak Prod 3,678,715 1,958,650 216,038 695,112 37,466 434,760 190,178 3,062 793 122,734 19,922 453 Winter 12 12 CP - Baseload Prod 5,518,072 2,506,407 305,212 1,096,432 64,657 904,830 441,729 12,805 3,317 148,350 34,333 454 Misc. Power Plant Equipment455 Summer 11 Peak Hours - Peak Prod 221,681 118,029 13,019 41,888 2,258 26,199 11,460 185 48 7,396 1,201 456 Winter 12 12 CP - Baseload Prod 332,521 151,037 18,392 66,071 3,896 54,525 26,619 772 200 8,940 2,069 457 Roads, Railroads, and Bridges458 Summer 11 Peak Hours - Peak Prod 260,633 138,768 15,306 49,248 2,654 30,802 13,474 217 56 8,696 1,411 459 Winter 12 12 CP - Baseload Prod 390,949 177,576 21,624 77,681 4,581 64,106 31,296 907 235 10,510 2,432 460461 Total Hydraulic Plant - 24,393,404 11,843,042 1,382,554 4,751,861 270,871 3,553,106 1,676,059 42,085 10,902 719,020 143,905 462463 Other Production Plant464465 Structures and Improvements466 Summer 11 Peak Hours - Peak Prod 2,196,220 1,169,328 128,976 414,987 22,368 259,555 113,538 1,828 474 73,273 11,894 467 Winter 12 12 CP - Baseload Prod 3,294,330 1,496,343 182,214 654,578 38,601 540,190 263,716 7,644 1,980 88,566 20,497 468 Fuel Holders, Prod., and Accessories469 Summer 11 Peak Hours - Peak Prod 1,251,149 666,146 73,476 236,411 12,742 147,864 64,680 1,041 270 41,742 6,776 470 Winter 12 12 CP - Baseload Prod 1,876,724 852,441 103,804 372,902 21,990 307,737 150,234 4,355 1,128 50,455 11,677 471 Prime Movers472 Summer 11 Peak Hours - Peak Prod 18,106,834 9,640,580 1,063,350 3,421,379 184,411 2,139,910 936,065 15,072 3,904 604,104 98,057 473 Winter 12 12 CP - Baseload Prod 27,160,251 12,336,671 1,502,268 5,396,697 318,248 4,453,625 2,174,215 63,025 16,326 730,188 168,990 474 Generators475 Summer 11 Peak Hours - Peak Prod 33,810,005 18,001,384 1,985,542 6,388,574 344,342 3,995,749 1,747,869 28,144 7,290 1,128,014 183,097 476 Winter 12 12 CP - Baseload Prod 50,715,008 23,035,662 2,805,112 10,076,988 594,248 8,316,036 4,059,805 117,683 30,485 1,363,444 315,546 477 Accessory Electric Equipment478 Summer 11 Peak Hours - Peak Prod 6,013,181 3,201,584 353,133 1,136,222 61,242 710,653 310,862 5,005 1,297 200,620 32,564 479 Winter 12 12 CP - Baseload Prod 9,019,772 4,096,941 498,895 1,792,214 105,688 1,479,025 722,045 20,930 5,422 242,491 56,121 480 Misc. Power Plant Equipment481 Summer 11 Peak Hours - Peak Prod 8,253,384 4,394,330 484,692 1,559,519 84,057 975,405 426,674 6,870 1,780 275,360 44,696 482 Winter 12 12 CP - Baseload Prod 12,380,076 5,623,251 684,758 2,459,900 145,062 2,030,033 991,042 28,728 7,442 332,831 77,028 483484 Total Other Production Plant - 174,076,935 84,514,664 9,866,220 33,910,371 1,933,000 25,355,782 11,960,745 300,326 77,797 5,131,089 1,026,940 485486 TOTAL PRODUCTION PLANT - 198,470,339 96,357,706 11,248,773 38,662,232 2,203,871 28,908,888 13,636,805 342,410 88,699 5,850,109 1,170,845 487488 TRANSMISSION PLANT:489490 352 - 359MID Transmission
DRAFT
William A. Monsen
SCHEDULE 5

2018 DRAFT COSA 2018-11-06 clean.xlsx11/6/18 5:18 PM Page 2 of 2
MIDCOST OF SERVICE STUDY
2018 TEST YEAR Allocation Factor
FERC Alloc Allocation SystemAccountCost Element Factor Basis Total Residential GS-1 GS-2 GS-TOU GS-3 IC-25 SL-1 SL-2 P-3 P-4
491 Summer 17 Pk Needs - Trans Capacity 32,726,717 17,424,611 1,921,924 6,183,882 333,309 3,867,724 1,691,867 27,242 7,057 1,091,872 177,230 492 Winter 18 Trans Capacity for Year Around Needs49,090,076 22,297,588 2,715,235 9,754,116 575,208 8,049,586 3,929,727 113,912 29,508 1,319,759 305,436 493494 TOTAL TRANSMISSION PLANT - 81,816,793 39,722,200 4,637,159 15,937,998 908,517 11,917,310 5,621,594 141,154 36,565 2,411,631 482,666 495496 DISTRIBUTION PLANT:497498 Structures and Improvements499 Subtransmission 33 NCP - Subtransmission 2,359,351 1,165,689 134,389 423,830 21,424 334,890 188,608 9,792 2,148 78,580 - 500 Primary 34 NCP - Primary 1,930,378 953,226 109,895 346,581 17,519 273,852 155,191 8,083 1,773 64,258 - 501 Station Equipment502 Subtransmission 33 NCP - Subtransmission 29,613,152 14,631,026 1,686,776 5,319,655 268,904 4,203,343 2,367,290 122,901 26,965 986,291 - 503 Primary 34 NCP - Primary 24,228,942 11,964,317 1,379,337 4,350,073 219,893 3,437,225 1,947,861 101,452 22,259 806,526 - 504 Poles, Towers, and Fixtures505 Subtransmission 33 NCP - Subtransmission 25,640,841 12,668,419 1,460,511 4,606,076 232,833 3,639,506 2,049,742 106,415 23,348 853,990 - 506 Primary 34 NCP - Primary 11,791,044 5,822,449 671,256 2,116,968 107,011 1,672,730 947,929 49,372 10,833 392,497 - 507 Overhead Conductors and Devices508 Subtransmission 33 NCP - Subtransmission 3,111,145 1,537,130 177,212 558,881 28,251 441,601 248,707 12,912 2,833 103,619 - 509 Primary 34 NCP - Primary 1,430,673 706,470 81,447 256,864 12,984 202,962 115,017 5,991 1,314 47,624 - 510 Underground Conduit511 Subtransmission 33 NCP - Subtransmission 16,095,645 7,952,406 916,814 2,891,394 146,158 2,284,644 1,286,694 66,800 14,657 536,079 - 512 Primary 34 NCP - Primary 7,401,647 3,654,953 421,371 1,328,894 67,175 1,050,030 595,048 30,992 6,800 246,384 - 513 Underground Conductors and Devices514 Subtransmission 33 NCP - Subtransmission 29,876,418 14,761,099 1,701,771 5,366,947 271,295 4,240,711 2,388,336 123,994 27,205 995,060 - 515 Primary 34 NCP - Primary 13,738,791 6,784,252 782,140 2,466,668 124,688 1,949,046 1,104,516 57,527 12,622 457,333 - 516 Line Transformers 35 NCP - Secondary 36,267,442 21,491,588 2,477,713 7,738,009 64,660 2,820,165 - 185,778 40,761 1,448,768 - 517 Services 28 Services 15,279,904 13,112,923 1,421,370 308,000 2,600 2,942 - - - 431,932 137 518 Meters 27 Meters 9,873,980 8,075,620 875,354 284,524 3,792 43,355 24,353 - - 566,899 84 519 Installations on Customer Premises 28 Services 2,870,923 2,463,771 267,060 57,870 488 553 - - - 81,155 26 520 Leased Property on Customer Premises 36 Street Lighting 2,588,592 - - - - - - 1,553,155 1,035,437 - - 521 Street Lighting Equipment 36 Street Lighting - - - - - - - - - - - 522523 TOTAL DISTRIBUTION PLANT - 234,098,867 127,745,337 14,564,417 38,421,232 1,589,675 26,597,554 13,419,290 2,435,162 1,228,957 8,096,996 247 524525 GENERAL PLANT:526527 Structures and Improvements 79 PTD Plant 348,961 181,091 20,868 62,395 3,132 45,108 21,904 1,548 627 11,220 1,068 528 Office Furniture and Equipment 57 Salaries and Wages 39,525 21,714 2,481 6,467 327 4,639 2,242 151 196 1,186 121 529 Transportation Equipment 58 PTD Salaries & Wages - - - - - - - - - - - 530 Stores Equipment 59 Materials & Supplies - - - - - - - - - - - 531 Tools, Shop, and Garage Equipment 58 PTD Salaries & Wages 789,134 403,589 46,636 143,934 7,459 104,912 50,586 3,020 1,179 24,899 2,919 532 Laboratory Equipment 79 PTD Plant 469,216 243,497 28,059 83,897 4,211 60,653 29,452 2,081 843 15,087 1,436 533 Power Operated Equipment 58 PTD Salaries & Wages - - - - - - - - - - - 534 Communication Equipment 58 PTD Salaries & Wages 984,537 503,525 58,184 179,575 9,306 130,891 63,112 3,768 1,471 31,065 3,641 535 Miscellaneous Equipment 70 Accounts 391-397 14,930,092 7,690,321 887,562 2,696,461 138,843 1,961,043 946,761 58,605 26,370 471,050 53,076 536 Other Tangible Property - - - - - - - - - - - - 537538 TOTAL GENERAL PLANT - 17,561,465 9,043,738 1,043,789 3,172,728 163,277 2,307,246 1,114,057 69,173 30,686 554,508 62,262 539540 TOTAL ACCUM. DEPRECIATION - 541,760,448 277,961,373 32,080,944 97,948,773 4,953,402 70,999,468 34,407,694 3,031,425 1,402,540 17,228,769 1,746,060
DRAFT
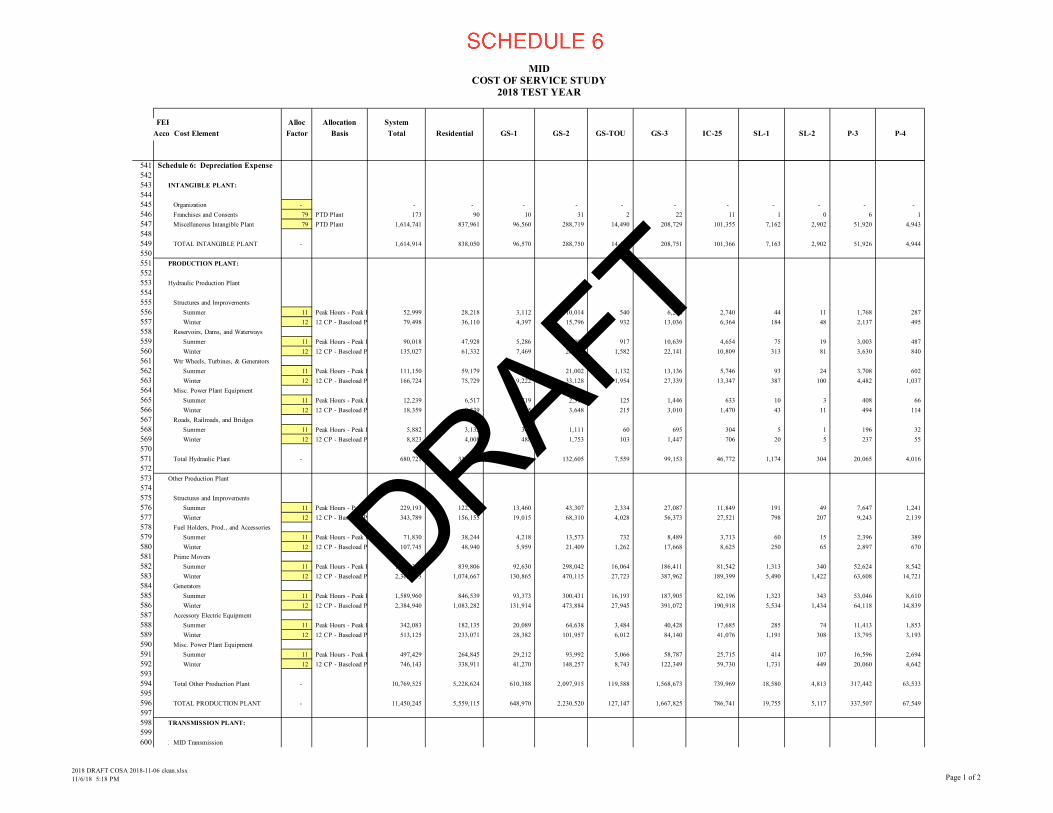
2018 DRAFT COSA 2018-11-06 clean.xlsx11/6/18 5:18 PM Page 1 of 2
MIDCOST OF SERVICE STUDY
2018 TEST YEAR Allocation Factor
FERC Alloc Allocation SystemAccountCost Element Factor Basis Total Residential GS-1 GS-2 GS-TOU GS-3 IC-25 SL-1 SL-2 P-3 P-4
541 Schedule 6: Depreciation Expense542543 INTANGIBLE PLANT:544545 Organization - - - - - - - - - - - - 546 Franchises and Consents 79 PTD Plant 173 90 10 31 2 22 11 1 0 6 1 547 Miscellaneous Intangible Plant 79 PTD Plant 1,614,741 837,961 96,560 288,719 14,490 208,729 101,355 7,162 2,902 51,920 4,943 548549 TOTAL INTANGIBLE PLANT - 1,614,914 838,050 96,570 288,750 14,492 208,751 101,366 7,163 2,902 51,926 4,944 550551 PRODUCTION PLANT:552553 Hydraulic Production Plant554555 Structures and Improvements556 Summer 11 Peak Hours - Peak Prod 52,999 28,218 3,112 10,014 540 6,264 2,740 44 11 1,768 287 557 Winter 12 12 CP - Baseload Prod 79,498 36,110 4,397 15,796 932 13,036 6,364 184 48 2,137 495 558 Reservoirs, Dams, and Waterways559 Summer 11 Peak Hours - Peak Prod 90,018 47,928 5,286 17,009 917 10,639 4,654 75 19 3,003 487 560 Winter 12 12 CP - Baseload Prod 135,027 61,332 7,469 26,830 1,582 22,141 10,809 313 81 3,630 840 561 Wtr Wheels, Turbines, & Generators562 Summer 11 Peak Hours - Peak Prod 111,150 59,179 6,527 21,002 1,132 13,136 5,746 93 24 3,708 602 563 Winter 12 12 CP - Baseload Prod 166,724 75,729 9,222 33,128 1,954 27,339 13,347 387 100 4,482 1,037 564 Misc. Power Plant Equipment565 Summer 11 Peak Hours - Peak Prod 12,239 6,517 719 2,313 125 1,446 633 10 3 408 66 566 Winter 12 12 CP - Baseload Prod 18,359 8,339 1,015 3,648 215 3,010 1,470 43 11 494 114 567 Roads, Railroads, and Bridges568 Summer 11 Peak Hours - Peak Prod 5,882 3,132 345 1,111 60 695 304 5 1 196 32 569 Winter 12 12 CP - Baseload Prod 8,823 4,008 488 1,753 103 1,447 706 20 5 237 55 570571 Total Hydraulic Plant - 680,721 330,491 38,581 132,605 7,559 99,153 46,772 1,174 304 20,065 4,016 572573 Other Production Plant574575 Structures and Improvements576 Summer 11 Peak Hours - Peak Prod 229,193 122,029 13,460 43,307 2,334 27,087 11,849 191 49 7,647 1,241 577 Winter 12 12 CP - Baseload Prod 343,789 156,155 19,015 68,310 4,028 56,373 27,521 798 207 9,243 2,139 578 Fuel Holders, Prod., and Accessories579 Summer 11 Peak Hours - Peak Prod 71,830 38,244 4,218 13,573 732 8,489 3,713 60 15 2,396 389 580 Winter 12 12 CP - Baseload Prod 107,745 48,940 5,959 21,409 1,262 17,668 8,625 250 65 2,897 670 581 Prime Movers582 Summer 11 Peak Hours - Peak Prod 1,577,315 839,806 92,630 298,042 16,064 186,411 81,542 1,313 340 52,624 8,542 583 Winter 12 12 CP - Baseload Prod 2,365,973 1,074,667 130,865 470,115 27,723 387,962 189,399 5,490 1,422 63,608 14,721 584 Generators585 Summer 11 Peak Hours - Peak Prod 1,589,960 846,539 93,373 300,431 16,193 187,905 82,196 1,323 343 53,046 8,610 586 Winter 12 12 CP - Baseload Prod 2,384,940 1,083,282 131,914 473,884 27,945 391,072 190,918 5,534 1,434 64,118 14,839 587 Accessory Electric Equipment588 Summer 11 Peak Hours - Peak Prod 342,083 182,135 20,089 64,638 3,484 40,428 17,685 285 74 11,413 1,853 589 Winter 12 12 CP - Baseload Prod 513,125 233,071 28,382 101,957 6,012 84,140 41,076 1,191 308 13,795 3,193 590 Misc. Power Plant Equipment591 Summer 11 Peak Hours - Peak Prod 497,429 264,845 29,212 93,992 5,066 58,787 25,715 414 107 16,596 2,694 592 Winter 12 12 CP - Baseload Prod 746,143 338,911 41,270 148,257 8,743 122,349 59,730 1,731 449 20,060 4,642 593594 Total Other Production Plant - 10,769,525 5,228,624 610,388 2,097,915 119,588 1,568,673 739,969 18,580 4,813 317,442 63,533 595596 TOTAL PRODUCTION PLANT - 11,450,245 5,559,115 648,970 2,230,520 127,147 1,667,825 786,741 19,755 5,117 337,507 67,549 597598 TRANSMISSION PLANT:599600 352 - 359MID Transmission
DRAFT
William A. Monsen
SCHEDULE 6

2018 DRAFT COSA 2018-11-06 clean.xlsx11/6/18 5:18 PM Page 2 of 2
MIDCOST OF SERVICE STUDY
2018 TEST YEAR Allocation Factor
FERC Alloc Allocation SystemAccountCost Element Factor Basis Total Residential GS-1 GS-2 GS-TOU GS-3 IC-25 SL-1 SL-2 P-3 P-4
601 Summer 17 Pk Needs - Trans Capacity 737,030 392,415 43,283 139,266 7,506 87,104 38,102 614 159 24,590 3,991 602 Winter 18 Trans Capacity for Year Around Needs1,105,546 502,159 61,149 219,670 12,954 181,283 88,500 2,565 665 29,722 6,879 603604 TOTAL TRANSMISSION PLANT - 1,842,576 894,574 104,432 358,936 20,460 268,387 126,603 3,179 823 54,312 10,870 605606 DISTRIBUTION PLANT:607608 Structures and Improvements609 Subtransmission 33 93,426 46,159 5,322 16,783 848 13,261 7,469 388 85 3,112 - 610 Primary 34 76,439 37,746 4,352 13,724 694 10,844 6,145 320 70 2,544 - 611 Station Equipment612 Subtransmission 33 1,472,638 727,589 83,882 264,542 13,372 209,029 117,723 6,112 1,341 49,047 - 613 Primary 34 1,204,885 594,976 68,593 216,326 10,935 170,930 96,866 5,045 1,107 40,108 - 614 Poles, Towers, and Fixtures615 Subtransmission 33 NCP - Subtransmission 1,062,863 525,131 60,541 190,931 9,651 150,865 84,966 4,411 968 35,400 - 616 Primary 34 NCP - Primary 488,762 241,352 27,825 87,752 4,436 69,338 39,293 2,047 449 16,270 - 617 Overhead Conductors and Devices618 Subtransmission 33 NCP - Subtransmission 437,852 216,330 24,940 78,655 3,976 62,149 35,002 1,817 399 14,583 - 619 Primary 34 NCP - Primary 201,348 99,426 11,463 36,150 1,827 28,564 16,187 843 185 6,702 - 620 Underground Conduit621 Subtransmission 33 NCP - Subtransmission 1,452,006 717,396 82,707 260,836 13,185 206,100 116,074 6,026 1,322 48,360 - 622 Primary 34 NCP - Primary 667,711 329,717 38,012 119,881 6,060 94,724 53,680 2,796 613 22,227 - 623 Underground Conductors and Devices624 Subtransmission 33 NCP - Subtransmission 1,564,910 773,178 89,138 281,118 14,210 222,126 125,100 6,495 1,425 52,121 - 625 Primary 34 NCP - Primary 719,630 355,355 40,968 129,203 6,531 102,090 57,854 3,013 661 23,955 - 626 Line Transformers 35 NCP - Secondary 1,917,044 1,136,014 130,968 409,020 3,418 149,070 - 9,820 2,155 76,580 - 627 Services 28 Services 789,364 677,417 73,428 15,911 134 152 - - - 22,314 7 628 Meters 27 Meters 1,180,872 965,798 104,687 34,027 453 5,185 2,912 - - 67,798 10 629 Installations on Customer Premises 28 Services 139,190 119,450 12,948 2,806 24 27 - - - 3,935 1 630 Leased Property on Customer Premises 36 Street Lighting 21,296 - - - - - - 12,777 8,518 - - 631 Street Lighting Equipment 36 Street Lighting - - - - - - - - - - - 632633 TOTAL DISTRIBUTION PLANT - 13,490,236 7,563,035 859,774 2,157,664 89,756 1,494,455 759,271 61,910 19,298 485,055 18 634635 GENERAL PLANT:636637 Structures and Improvements 79 PTD Plant 24,810 12,875 1,484 4,436 223 3,207 1,557 110 45 798 76 638 Office Furniture and Equipment 57 Salaries and Wages 19,763 10,857 1,241 3,233 164 2,319 1,121 76 98 593 61 639 Transportation Equipment 58 PTD Salaries & Wages - - - - - - - - - - - 640 Stores Equipment 59 Materials & Supplies - - - - - - - - - - - 641 Tools, Shop, and Garage Equipment 58 PTD Salaries & Wages 123,463 63,143 7,296 22,519 1,167 16,414 7,914 472 184 3,896 457 642 Laboratory Equipment 79 PTD Plant 37,201 19,305 2,225 6,652 334 4,809 2,335 165 67 1,196 114 643 Power Operated Equipment 58 PTD Salaries & Wages - - - - - - - - - - - 644 Communication Equipment 58 PTD Salaries & Wages 110,984 56,761 6,559 20,243 1,049 14,755 7,114 425 166 3,502 410 645 Miscellaneous Equipment 70 Accounts 391-397 2,861,037 1,473,688 170,082 516,720 26,606 375,793 181,427 11,230 5,053 90,267 10,171 646 Other Tangible Property - - - - - - - - - - - - 647648 TOTAL GENERAL PLANT - 3,177,258 1,636,629 188,887 573,803 29,542 417,297 201,469 12,478 5,613 100,251 11,289 649650 TOTAL DEPRECIATION EXPENSE - 31,575,228 16,491,403 1,898,633 5,609,673 281,397 4,056,714 1,975,450 104,484 33,754 1,029,051 94,669
DRAFT

2018 DRAFT COSA 2018-11-06 clean.xlsx11/6/18 5:19 PM Page 1 of 1
MIDCOST OF SERVICE STUDY
2018 TEST YEAR Allocation Factor
FERC Alloc Allocation SystemAccountCost Element Factor Basis Total Residential GS-1 GS-2 GS-TOU GS-3 IC-25 SL-1 SL-2 P-3 P-4
652 Schedule 7: Rate Base653654 NET PLANT IN SERVICE:
655656 Intangible Plant 92 Schedule 4 50,615,343 26,266,545 3,026,744 9,050,131 454,216 6,542,764 3,177,057 224,503 90,957 1,627,482 154,944
657 Production Plant 92 Schedule 4 356,986,973 173,317,816 20,233,076 69,541,441 3,964,085 51,998,180 24,528,409 615,891 159,541 10,522,543 2,105,990
658 Transmission Plant 92 Schedule 4 100,147,864 48,621,968 5,676,116 19,508,910 1,112,071 14,587,386 6,881,113 172,780 44,757 2,951,957 590,807
659 Distribution Plant 92 Schedule 4 423,995,064 235,317,578 26,781,443 68,497,547 2,830,993 47,313,206 23,897,824 3,119,551 1,379,117 14,857,277 526
660 General Plant 92 Schedule 4 48,995,643 25,240,290 2,912,975 8,847,404 455,367 6,433,774 3,106,426 192,744 86,562 1,546,330 173,770
661662 Total Plant - 980,740,888 508,764,197 58,630,354 175,445,433 8,816,731 126,875,311 61,590,830 4,325,469 1,760,935 31,505,589 3,026,038
663664 Accum. Provision for Depreciation 93 Schedule 5 (541,760,448) (277,961,373) (32,080,944) (97,948,773) (4,953,402) (70,999,468) (34,407,694) (3,031,425) (1,402,540) (17,228,769) (1,746,060)
665666 NET PLANT INVESTMENT - 438,980,440 230,802,824 26,549,410 77,496,660 3,863,329 55,875,842 27,183,136 1,294,044 358,395 14,276,821 1,279,978
667668 ADD:669 Materials and Supplies Inventories 95 Schedule 8 7,031,590 3,613,599 423,275 1,238,282 61,621 930,371 455,455 36,691 15,078 238,013 19,206
670 Construction Work in Progress 95 Schedule 8 11,528,975 5,958,560 687,155 2,073,018 105,068 1,502,358 727,952 49,020 19,827 368,537 37,480
671 Working Capital Allowance (1/8) 56 O&M - Fuel&Purch Pwr
672 Purchased Power Allowance (1/12) - - - - - - - - - - - -
673674 DEDUCT:675 Customer Advances 95 Schedule 8 23,425,601 11,725,080 1,360,549 4,394,978 237,707 3,239,626 1,547,048 68,934 24,676 718,672 108,331
676677 RATE BASE - 434,115,404 228,649,902 26,299,292 76,412,982 3,792,311 55,068,945 26,819,496 1,310,821 368,623 14,164,699 1,228,333
678679680681682683
DRAFT
William A. Monsen
SCHEDULE 7

2018 DRAFT COSA 2018-11-06 clean.xlsx11/6/18 5:19 PM Page 1 of 1
MIDCOST OF SERVICE STUDY
2018 TEST YEAR Allocation Factor
FERC Alloc Allocation SystemAccountCost Element Factor Basis Total Residential GS-1 GS-2 GS-TOU GS-3 IC-25 SL-1 SL-2 P-3 P-4
684 Schedule 8: Miscellaneous685686 Customer Advances - Production 77 Total Production Plant 18,362,086 8,914,826 1,040,714 3,576,954 203,898 2,674,594 1,261,650 31,679 8,206 541,241 108,324 687 Customer Advances - Distribution 47 Distribution Plant 5,063,515 2,810,255 319,834 818,025 33,809 565,033 285,397 37,255 16,470 177,431 6 688689 Construction Work in Progress:690 Production 77 Total Production Plant 5,648,250 2,742,236 320,128 1,100,285 62,720 822,716 388,089 9,745 2,524 166,488 33,321 691 Transmission 46 Transmission Plant 256,856 124,704 14,558 50,036 2,852 37,413 17,648 443 115 7,571 1,515 692 Distribution 47 Distribution Plant 4,880,254 2,708,545 308,259 788,418 32,585 544,583 275,068 35,907 15,874 171,010 6 693 General 49 General Plant 743,615 383,076 44,211 134,279 6,911 97,646 47,147 2,925 1,314 23,469 2,637 694695 Total - 11,528,975 5,958,560 687,155 2,073,018 105,068 1,502,358 727,952 49,020 19,827 368,537 37,480 696697 Materials and Supplies Inventories:698 Fuel 5 Summer Energy at Input 633,669 218,375 33,680 130,228 8,988 140,142 67,200 2,231 550 26,284 5,991 699 Other Production 77 Total Production Plant 1,279,585 621,241 72,523 249,265 14,209 186,382 87,920 2,208 572 37,717 7,549 700 Transmission 46 Transmission Plant 959,690 465,931 54,393 186,949 10,657 139,787 65,940 1,656 429 28,288 5,662 701 Distribution 47 Distribution Plant 4,158,646 2,308,052 262,679 671,840 27,767 464,059 234,396 30,597 13,527 145,724 5 702 General - - - - - - - - - - - - 703704 Total - 7,031,590 3,613,599 423,275 1,238,282 61,621 930,371 455,455 36,691 15,078 238,013 19,206 705706 Salaries and Wages:707 Production 77 Total Production Plant 11,569,653 5,617,087 655,737 2,253,781 128,473 1,685,218 794,945 19,961 5,171 341,027 68,253 709 Transmission 46 Transmission Plant 5,051,298 2,452,414 286,294 983,998 56,091 735,764 347,072 8,715 2,257 148,892 29,799 710 Transmission -- Maintenance 46 Transmission Plant 2,076,524 1,008,156 117,692 404,509 23,058 302,463 142,677 3,583 928 61,208 12,250 711 Distribution 47 Distribution Plant 2,597,793 1,441,777 164,088 419,680 17,345 289,885 146,421 19,113 8,450 91,030 3 712 Distribution -- Maintenance 47 Distribution Plant 8,531,187 4,734,815 538,868 1,378,236 56,962 951,987 480,847 62,768 27,749 298,943 11 713 Customer Accounting 26 Average Customers 6,114,670 5,130,916 556,164 120,516 1,017 2,302 54 10,723 200,570 92,355 54 714 Administrative and General 79 PTD Plant 21,041,341 10,919,284 1,258,250 3,762,236 188,822 2,719,897 1,320,737 93,328 37,812 676,562 64,412 716717 Total - 56,982,467 31,304,450 3,577,094 9,322,958 471,769 6,687,518 3,232,753 218,191 282,937 1,710,015 174,782 718
DRAFT
William A. Monsen
SCHEDULE 8

11/6/18 2018 DRAFT COSA 2018-11-06 clean.xlsxPage 1
COST ALLOCATION FACTORS
SystemNo. Factor Total Residential GS-1 GS-2 GS-TOU GS-3 IC-25 SL-1 SL-2 P-3 P-4
ENERGY (MWh): 1 Summer Energy Sales S P S 1,235,679 425,840 65,678 253,950 17,527 273,282 131,042 4,350 1,073 51,255 11,682 2 Winter Energy Sales S P W 1,355,057 473,237 79,237 315,261 21,175 251,415 160,302 6,305 1,430 37,573 9,123 3 Annual Energy Sales S P A 2,590,737 899,077 144,915 569,212 38,701 524,697 291,344 10,655 2,503 88,828 20,805 45 Summer Energy at Input I P S 1,242,388 428,152 66,035 255,329 17,622 274,766 131,754 4,374 1,079 51,533 11,745 6 Winter Energy at Input I P W 1,359,407 474,757 79,491 316,273 21,242 252,222 160,816 6,325 1,434 37,693 9,153 7 Annual Energy at Input I P A 2,601,796 902,908 145,526 571,602 38,865 526,988 292,570 10,698 2,513 89,227 20,898 89
10
DEMAND (MW):
11 Peak Hours - Peak Prod P P 592.6 315.5 34.8 112.0 6.0 70.0 30.6 0.5 0.1 19.8 3.2 12 12 CP - Baseload Prod P A 425.1 193.1 23.5 84.5 5.0 69.7 34.0 1.0 0.3 11.4 2.6 13 NCP - Subtransmission T D A 718.2 354.8 40.9 129.0 6.5 101.9 57.4 3.0 0.7 23.9 - 14 NCP - Primary P D A 706.2 348.7 40.2 126.8 6.4 100.2 56.8 3.0 0.6 23.5 - 15 NCP - Secondary S D A 572.6 339.3 39.1 122.2 1.0 44.5 - 2.9 0.6 22.9 - 1617 Pk Needs - Trans Capacity T P 592.6 315.5 34.8 112.0 6.0 70.0 30.6 0.5 0.1 19.8 3.2 18 Trans Capacity for Year Around Needs T A 425.1 193.1 23.5 84.5 5.0 69.7 34.0 1.0 0.3 11.4 2.6 192021 DA- NCP - NO IC-25 P D A 0.0 0.0 0.0 0.0 0.0 0.0 0.0 0.0 0.0 0.0 0.0 22 DA- NCP - ALL IC-25 P D A 0.0 0.0 0.0 0.0 0.0 0.0 0.0 0.0 0.0 0.0 0.0 232425
CUSTOMER:
26 Average Customers 114,210 95,835 10,388 2,251 19 43 1 200 3,746 1,725 1 27 Meters 117,177 95,835 10,388 3,377 45 515 289 - - 6,728 1 28 Services 111,672 95,835 10,388 2,251 19 22 - - - 3,157 1 29 Meter Reading 114,713 95,835 10,388 4,403 105 515 17 - - 3,450 - 30 Accounting and Billing 118,241 95,835 10,388 4,371 76 172 1 200 3,746 3,450 1 31 Average No. of Meters 110,394 95,835 10,388 2,251 30 147 17 - - 1,725 1 3233 NCP - Subtransmission T D A 718 355 41 129 7 102 57 3 1 24 - 34 NCP - Primary P D A 706 349 40 127 6 100 57 3 1 24 - 35 NCP - Secondary S D A 573 339 39 122 1 45 - 3 1 23 -
Seas
onFu
nctio
nV
olta
ge
DRAFT
William A. Monsen
SCHEDULE “COSA MODEL ALLOCATION FACTORS”

11/6/18 2018 DRAFT COSA 2018-11-06 clean.xlsxPage 2
COST ALLOCATION FACTORS
SystemNo. Factor Total Residential GS-1 GS-2 GS-TOU GS-3 IC-25 SL-1 SL-2 P-3 P-4Se
ason
Func
tion
Vol
tage
DIRECTASSIGNMENTS:
36 Street Lighting 100 - - - - - - 60 40 - - 37 Uncollectible Accounts 69,387 67,085 2,078 225 - - - - - - - 3839 NCP - Subtransmission OH 718 355 41 129 7 102 57 3 1 24 - 40 NCP - Primary OH 706 349 40 127 6 100 57 3 1 24 - 41 NCP - Subtransmission UG 718 355 41 129 7 102 57 3 1 24 - 42 NCP - Primary UG 706 349 40 127 6 100 57 3 1 24 - 4344 Discretionary Revs 9,030,000 3,600,000 - - - 830,000 4,600,000 - - - - 45 Sales Revenues 356,802,380 155,733,609 22,958,570 76,301,128 4,867,789 56,993,098 23,387,304 1,281,709 701,636 12,445,627 2,131,909
COMPOSITEFACTORS:
46 Transmission Plant 100,147,864 48,621,968 5,676,116 19,508,910 1,112,071 14,587,386 6,881,113 172,780 44,757 2,951,957 590,807 47 Distribution Plant 423,995,064 235,317,578 26,781,443 68,497,547 2,830,993 47,313,206 23,897,824 3,119,551 1,379,117 14,857,277 526 48 T&D Plant 524,142,928 283,939,546 32,457,559 88,006,457 3,943,063 61,900,592 30,778,937 3,292,331 1,423,874 17,809,234 591,333 49 General Plant 48,995,643 25,240,290 2,912,975 8,847,404 455,367 6,433,774 3,106,426 192,744 86,562 1,546,330 173,770 50 Total Plant 980,740,888 508,764,197 58,630,354 175,445,433 8,816,731 126,875,311 61,590,830 4,325,469 1,760,935 31,505,589 3,026,038 51 Net Plant 438,980,440 230,802,824 26,549,410 77,496,660 3,863,329 55,875,842 27,183,136 1,294,044 358,395 14,276,821 1,279,978 52 Rate Base 434,115,404 228,649,902 26,299,292 76,412,982 3,792,311 55,068,945 26,819,496 1,310,821 368,623 14,164,699 1,228,333 5354 Power Production Exp 205,892,704 80,820,291 11,553,673 43,475,748 2,812,240 37,938,572 20,154,174 681,791 163,162 6,776,245 1,516,808 55 Purchased Power 150,436,193 59,795,128 8,443,143 31,622,516 2,033,515 27,428,985 14,488,262 485,042 116,403 4,925,777 1,097,421 56 O&M - Fuel&Purch Pwr 116,842,742 53,882,424 6,991,736 21,282,516 1,335,258 18,174,021 9,818,706 439,752 488,038 3,774,582 655,709 57 Salaries and Wages 56,982,467 31,304,450 3,577,094 9,322,958 471,769 6,687,518 3,232,753 218,191 282,937 1,710,015 174,782 58 PTD Salaries & Wages 29,826,455 15,254,250 1,762,680 5,440,205 281,930 3,965,318 1,911,963 114,139 44,555 941,099 110,317 59 Materials & Supplies 7,031,590 3,613,599 423,275 1,238,282 61,621 930,371 455,455 36,691 15,078 238,013 19,206 60 Other Power Operation 26,900,821 9,927,186 1,507,257 5,796,344 385,190 5,211,206 2,832,361 99,980 23,667 909,689 207,943 61 Other Power Maint. 4,484,405 2,177,187 254,164 873,567 49,796 653,192 308,121 7,737 2,004 132,182 26,455 62 Transmission Expense 8,781,221 4,263,299 497,696 1,710,591 97,509 1,279,059 603,354 15,150 3,924 258,835 51,803 63 Distribution Expense 15,829,819 8,971,504 1,013,985 2,293,273 108,772 1,712,658 950,622 113,224 52,755 612,995 31 64 Distribution Operation 3,411,888 1,685,305 194,295 612,755 30,974 484,171 273,444 14,217 3,119 113,608 - 65 Distribution Maintenance 11,128,359 6,531,753 734,783 1,504,946 69,652 1,099,889 606,245 88,816 44,554 447,692 28 66 Customer Accounts 12,982,911 11,004,070 1,020,615 328,903 4,838 10,949 92 18,350 343,230 251,774 92 67 A&G Operation 45,900,100 15,928,955 2,567,459 10,084,727 685,673 9,296,067 5,161,746 188,768 44,341 1,573,762 368,602 68 Admin & General Exp 45,900,100 15,928,955 2,567,459 10,084,727 685,673 9,296,067 5,161,746 188,768 44,341 1,573,762 368,602 69 Account 364 (Dist Poles) 51,720,812 25,549,414 2,945,530 9,289,441 469,574 7,340,083 4,141,976 215,255 47,229 1,722,310 - 70 Accounts 391-397 4,604,036 2,371,487 273,700 831,516 42,815 604,733 291,956 18,072 8,132 145,259 16,367 7172 Revenue Requirements 389,784,604 173,482,664 22,791,531 75,698,746 4,592,293 63,060,037 33,114,582 1,323,509 712,261 12,785,638 2,223,344 73 Total Revenue 377,575,403 166,134,850 23,627,084 78,126,248 4,958,143 59,135,144 28,626,292 1,312,940 710,419 12,783,108 2,161,175 74
DRAFT
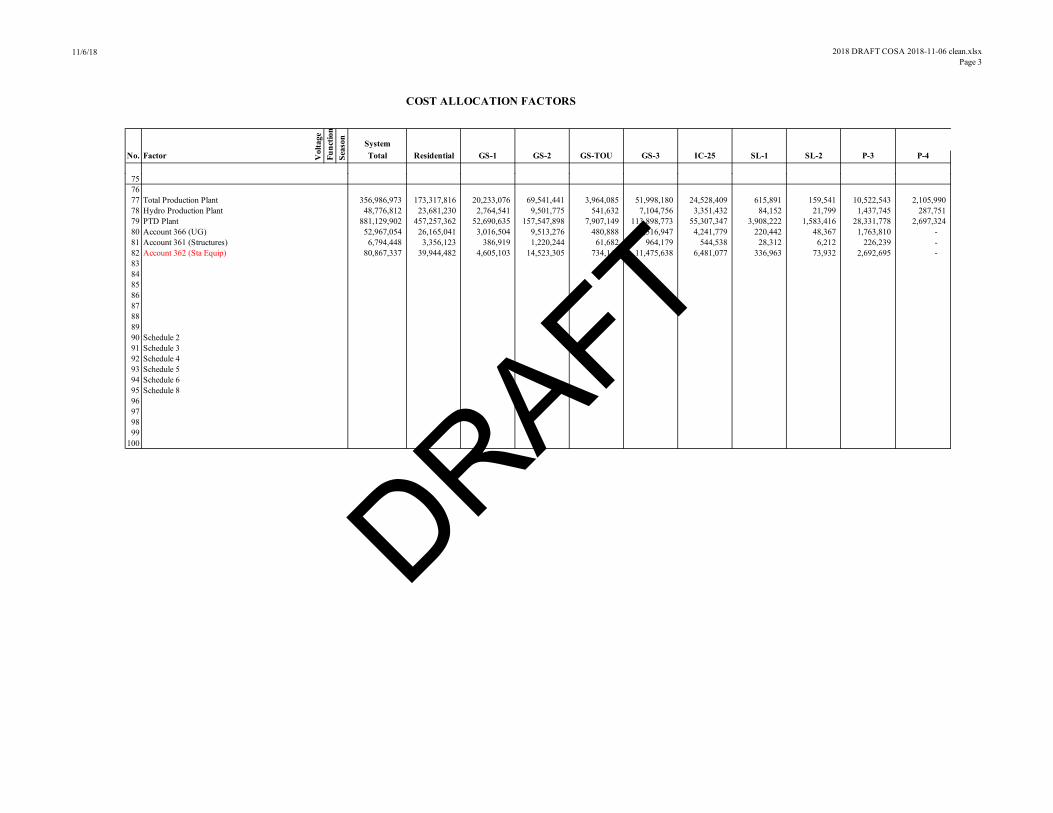
11/6/18 2018 DRAFT COSA 2018-11-06 clean.xlsxPage 3
COST ALLOCATION FACTORS
SystemNo. Factor Total Residential GS-1 GS-2 GS-TOU GS-3 IC-25 SL-1 SL-2 P-3 P-4Se
ason
Func
tion
Vol
tage
757677 Total Production Plant 356,986,973 173,317,816 20,233,076 69,541,441 3,964,085 51,998,180 24,528,409 615,891 159,541 10,522,543 2,105,990 78 Hydro Production Plant 48,776,812 23,681,230 2,764,541 9,501,775 541,632 7,104,756 3,351,432 84,152 21,799 1,437,745 287,751 79 PTD Plant 881,129,902 457,257,362 52,690,635 157,547,898 7,907,149 113,898,773 55,307,347 3,908,222 1,583,416 28,331,778 2,697,324 80 Account 366 (UG) 52,967,054 26,165,041 3,016,504 9,513,276 480,888 7,516,947 4,241,779 220,442 48,367 1,763,810 - 81 Account 361 (Structures) 6,794,448 3,356,123 386,919 1,220,244 61,682 964,179 544,538 28,312 6,212 226,239 - 82 Account 362 (Sta Equip) 80,867,337 39,944,482 4,605,103 14,523,305 734,141 11,475,638 6,481,077 336,963 73,932 2,692,695 - 8384858687888990 Schedule 291 Schedule 392 Schedule 493 Schedule 594 Schedule 695 Schedule 896979899
100
DRAFT
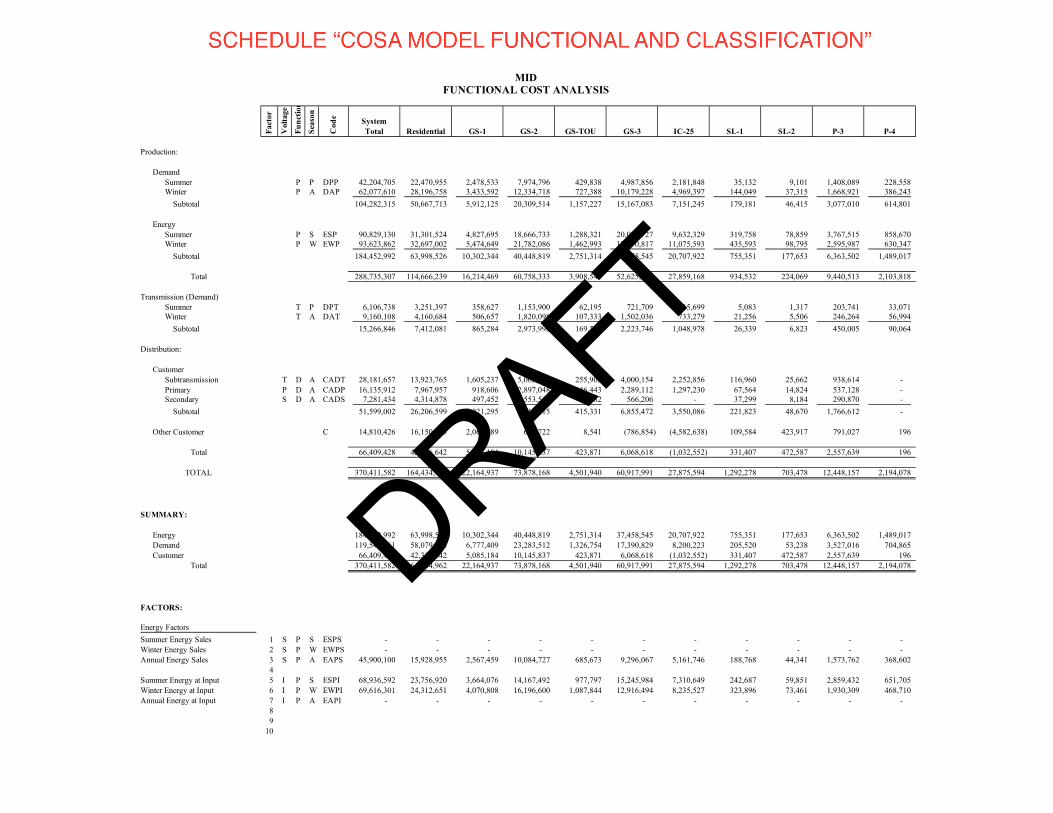
SystemTotal Residential GS-1 GS-2 GS-TOU GS-3 IC-25 SL-1 SL-2 P-3 P-4
Production:
Demand
Summer P P DPP 42,204,705 22,470,955 2,478,533 7,974,796 429,838 4,987,856 2,181,848 35,132 9,101 1,408,089 228,558 Winter P A DAP 62,077,610 28,196,758 3,433,592 12,334,718 727,388 10,179,228 4,969,397 144,049 37,315 1,668,921 386,243
Subtotal 104,282,315 50,667,713 5,912,125 20,309,514 1,157,227 15,167,083 7,151,245 179,181 46,415 3,077,010 614,801
Energy
Summer P S ESP 90,829,130 31,301,524 4,827,695 18,666,733 1,288,321 20,087,727 9,632,329 319,758 78,859 3,767,515 858,670 Winter P W EWP 93,623,862 32,697,002 5,474,649 21,782,086 1,462,993 17,370,817 11,075,593 435,593 98,795 2,595,987 630,347
Subtotal 184,452,992 63,998,526 10,302,344 40,448,819 2,751,314 37,458,545 20,707,922 755,351 177,653 6,363,502 1,489,017
Total 288,735,307 114,666,239 16,214,469 60,758,333 3,908,541 52,625,628 27,859,168 934,532 224,069 9,440,513 2,103,818
Transmission (Demand)
Summer T P DPT 6,106,738 3,251,397 358,627 1,153,900 62,195 721,709 315,699 5,083 1,317 203,741 33,071 Winter T A DAT 9,160,108 4,160,684 506,657 1,820,098 107,333 1,502,036 733,279 21,256 5,506 246,264 56,994
Subtotal 15,266,846 7,412,081 865,284 2,973,998 169,527 2,223,746 1,048,978 26,339 6,823 450,005 90,064
Distribution:
Customer
Subtransmission T D A CADT 28,181,657 13,923,765 1,605,237 5,062,503 255,905 4,000,154 2,252,856 116,960 25,662 938,614 -
Primary P D A CADP 16,135,912 7,967,957 918,606 2,897,048 146,443 2,289,112 1,297,230 67,564 14,824 537,128 - Secondary S D A CADS 7,281,434 4,314,878 497,452 1,553,564 12,982 566,206 - 37,299 8,184 290,870 -
Subtotal 51,599,002 26,206,599 3,021,295 9,513,115 415,331 6,855,472 3,550,086 221,823 48,670 1,766,612 -
Other Customer C 14,810,426 16,150,043 2,063,889 632,722 8,541 (786,854) (4,582,638) 109,584 423,917 791,027 196
Total 66,409,428 42,356,642 5,085,184 10,145,837 423,871 6,068,618 (1,032,552) 331,407 472,587 2,557,639 196
TOTAL 370,411,582 164,434,962 22,164,937 73,878,168 4,501,940 60,917,991 27,875,594 1,292,278 703,478 12,448,157 2,194,078
SUMMARY:
Energy 184,452,992 63,998,526 10,302,344 40,448,819 2,751,314 37,458,545 20,707,922 755,351 177,653 6,363,502 1,489,017
Demand 119,549,161 58,079,794 6,777,409 23,283,512 1,326,754 17,390,829 8,200,223 205,520 53,238 3,527,016 704,865
Customer 66,409,428 42,356,642 5,085,184 10,145,837 423,871 6,068,618 (1,032,552) 331,407 472,587 2,557,639 196
Total 370,411,582 164,434,962 22,164,937 73,878,168 4,501,940 60,917,991 27,875,594 1,292,278 703,478 12,448,157 2,194,078
FACTORS:
Energy Factors
Summer Energy Sales 1 S P S ESPS - - - - - - - - - - -
Winter Energy Sales 2 S P W EWPS - - - - - - - - - - -
Annual Energy Sales 3 S P A EAPS 45,900,100 15,928,955 2,567,459 10,084,727 685,673 9,296,067 5,161,746 188,768 44,341 1,573,762 368,602
4
Summer Energy at Input 5 I P S ESPI 68,936,592 23,756,920 3,664,076 14,167,492 977,797 15,245,984 7,310,649 242,687 59,851 2,859,432 651,705
Winter Energy at Input 6 I P W EWPI 69,616,301 24,312,651 4,070,808 16,196,600 1,087,844 12,916,494 8,235,527 323,896 73,461 1,930,309 468,710
Annual Energy at Input 7 I P A EAPI - - - - - - - - - - -
8
9
10
Fac
tor
Cod
e
MIDFUNCTIONAL COST ANALYSIS
Vol
tage
Fu
nct
ion
Sea
son
DRAFT
William A. Monsen
SCHEDULE “COSA MODEL FUNCTIONAL AND CLASSIFICATION”

SystemTotal Residential GS-1 GS-2 GS-TOU GS-3 IC-25 SL-1 SL-2 P-3 P-4F
acto
r
Cod
e
MIDFUNCTIONAL COST ANALYSIS
Vol
tage
Fu
nct
ion
Sea
son
Demand Factors
Peak Hours - Peak Prod 11 P P DPP 42,204,705 22,470,955 2,478,533 7,974,796 429,838 4,987,856 2,181,848 35,132 9,101 1,408,089 228,558
12 CP - Baseload Prod 12 P A DAP 62,077,610 28,196,758 3,433,592 12,334,718 727,388 10,179,228 4,969,397 144,049 37,315 1,668,921 386,243
NCP - Subtransmission 13 T D A DADT - - - - - - - - - - -
NCP - Primary 14 P D A DADP - - - - - - - - - - -
NCP - Secondary 15 S D A DADS - - - - - - - - - - -
16
Pk Needs - Trans Capacity 17 T P DPT 6,106,738 3,251,397 358,627 1,153,900 62,195 721,709 315,699 5,083 1,317 203,741 33,071
Trans Capacity for Year Around Needs18 T A DAT 9,160,108 4,160,684 506,657 1,820,098 107,333 1,502,036 733,279 21,256 5,506 246,264 56,994
19
20
DA- NCP - NO IC-25 21 P D A DADP - - - - - - - - - - -
DA- NCP - ALL IC-25 22 P D A DADP - - - - - - - - - - -
23
24
25
Customer Factors
Average Customers 26 C 4,542,287 3,811,505 413,147 89,526 756 1,710 40 7,966 148,993 68,606 40
Meters 27 C 7,000,175 5,725,224 620,584 201,714 2,688 30,736 17,265 - - 401,904 60
Services 28 C 4,339,547 3,724,117 403,674 87,473 738 835 - - - 122,670 39
Meter Reading 29 C - - - - - - - - - - -
Accounting and Billing 30 C 6,780,745 5,495,844 595,720 250,676 4,358 9,864 57 11,486 214,835 197,847 57
Average No. of Meters 31 C - - - - - - - - - - -
32
NCP - Subtransmission 33 T D A CADT (6,753,546) (3,336,738) (384,684) (1,213,195) (61,326) (958,610) (539,882) (28,029) (6,150) (224,933) -
NCP - Primary 34 P D A CADP 70,819 34,971 4,032 12,715 643 10,047 5,693 297 65 2,357 -
NCP - Secondary 35 S D A CADS 7,281,434 4,314,878 497,452 1,553,564 12,982 566,206 - 37,299 8,184 290,870 -
Direct Assignments
Street Lighting 36 C 150,221 - - - - - - 90,132 60,088 - -
Uncollectible Accounts 37 C 1,027,451 993,354 30,764 3,333 - - - - - - -
38
NCP - Subtransmission OH 39 T D A CADT 15,713,219 7,763,460 895,031 2,822,695 142,685 2,230,362 1,256,123 65,213 14,308 523,342 -
NCP - Primary OH 40 P D A CADP 7,225,787 3,568,113 411,359 1,297,320 65,578 1,025,082 580,910 30,256 6,638 240,530 -
NCP - Subtransmission UG 41 T D A CADT 19,221,983 9,497,042 1,094,891 3,453,003 174,547 2,728,402 1,536,615 79,775 17,503 640,205 -
NCP - Primary UG 42 P D A CADP 8,839,306 4,364,873 503,216 1,587,012 80,222 1,253,983 710,627 37,012 8,121 294,240 -
43
Discretionary Revs 44 C (9,030,000) (3,600,000) - - - (830,000) (4,600,000) - - - -
Sales Revenues 45 C - - - - - - - - - - - DRAFT

November 19, 2018 MRW & Associates, LLC
APPENDIX 2
EXPENSE AND REVENUE ALLOCATION REPORT
DRAFT

DraftExpenseandRevenueAllocationReport
October 10, 2018
DRAFT

This page was intentionally left blank
DRAFT

TABLE OF CONTENTS 1 Introduction ................................................................................................... 1
1.1 MID Overview .................................................................................................................. 1
2 A&G Allocation Methodology ........................................................................ 1 2.1 A&G Allocation Methods ................................................................................................. 2 2.1.1 Strengths and Weaknesses of Different Allocation Methods: ........................................ 2 2.2 A&G Allocation Approach ................................................................................................ 3 2.2.1 Domestic Water ............................................................................................................... 3 2.2.2 Electric and Irrigation ....................................................................................................... 3 2.2.3 Recommended Allocation Factors ................................................................................... 4 2.3 Utility Factors Calculation Methodology ......................................................................... 5 2.3.1 Direct Expenses Factor ..................................................................................................... 5 2.3.2 Direct Revenues Factor .................................................................................................... 5 2.3.3 Number of Employees Factor .......................................................................................... 5 2.3.4 Gross Plant in Service Factor ........................................................................................... 5 2.3.5 Calculation Methodology Applied Using the 2018 Budget.............................................. 6
3 Discretionary Revenue ................................................................................... 6 3.1 Other Revenues ............................................................................................................... 7 3.2 Wholesale Power Revenues ............................................................................................ 7
4 Interfunctional Value ..................................................................................... 7 4.1 Value of Electric Transmission Along Irrigation Canals.................................................... 8 4.2 Value of Hydroelectric Power from Don Pedro ............................................................... 9 4.2.1 Hydropower Valuation Methodology .............................................................................. 9 4.2.2 Implementation ............................................................................................................. 10 4.2.3 Projected Value .............................................................................................................. 11
5 Applying Allocation Methodology ................................................................ 11 5.1.1 Recommended Allocation of Expenses.......................................................................... 11
6 Recommendations Applied to the 2018 Budget ........................................... 12 6.1.1 Domestic Water Results ................................................................................................. 12 6.1.2 Irrigation Results ............................................................................................................ 12 6.1.3 Electric Enterprise .......................................................................................................... 13
7 Reserve Policy Recommendation ................................................................. 13
8 Conclusion ................................................................................................... 13
DRAFT
LIST OF TABLES Table 1: 2016 Actuals Allocation Factors ............................................................. 4 Table 2: 2016 Budget Allocation Factors ............................................................. 5 Table 3: Utility Factor Calculation (2018 Budget) ................................................. 6 Table 4: Right‐of‐Way Width Calculation ............................................................ 8 Table 5: 2018 Right‐of‐Way Value Calculation ..................................................... 9 Table 6: Projected Value of Energy and Capacity from Don Pedro (2018) .......... 11 Table 7: Net Revenues by Service Line .............................................................. 12
APPENDICES APPENDIX A: Tables
DRAFT

1 | P a g e
1 INTRODUCTION The Modesto Irrigation District (MID) has three distinct lines of service; providing electricity to retail customers (Electric), providing water to irrigation customers (Irrigation), and providing treated water to the City of Modesto (Domestic Water). MID hired consultants from Bartle Wells Associates and (MRW and Associates) MRW to (1) recommend a framework for allocating revenues and expenses between its lines of service, (2) apply this framework to MID’s 2018 budget, and (3) identify whether current rates comply with Proposition 26 requirements. Proposition 26 requires that rates collected for one line of service not subsidize another line of service. The consulting team created an allocation framework for MID’s lines of service with three primary objectives:
1. Ensure the revenues and expenses benefitting only one line of service are being directly allocated to that line of service.
2. Identify expense and revenue categories which benefit multiple lines of service and make sure they are being reasonably split between the lines.
3. Identify and quantify the value one line of service may be providing another line of service.
The following report explains the consulting team’s recommendations for a framework to use going forward and presents the results from applying the recommended framework to the 2018 budget.
1.1 MID Overview MID was established as the second irrigation district in California in 1887 to provide irrigation water to the Central Valley In 1923, after completion of the original Don Pedro Dam, MID began generating and selling electricity. In 1994 MID began providing potable water to the City of Modesto. Today MID provides irrigation water to about 3,100 accounts irrigating over 100,000 acres, electric service to about 123,000 accounts located over 560 square miles, and one third of the water supply serving the City of Modesto’s 73,000 accounts. 2 A&G ALLOCATION METHODOLOGY MID incurs expenses and receives revenues for various activities that benefit multiple lines of service. These revenues and expenses are categorized as Administrative and General (A&G). Examples of A&G activities are:
x Legal x Salaries for administrative staff x Regulatory administration
DRAFT

2 | P a g e
x Human resources x Information technology x Billing x Call center and other customer services x Building services
Because A&G cannot be directly assigned to Electric, Irrigation, and Domestic Water it is necessary to allocate A&G to each line of service.
2.1 A&G Allocation Methods There are a number of approaches that can be taken to allocate A&G to different lines of service. Generally accepted approaches include:
x Allocation based on input from functional area: Examples of functional areas are information technology and finance. Under this approach, employees in each functional area providing A&G services to the utility are surveyed and asked to allocate the benefit their area provides to each line of service. A typical approach would be to survey managers of each specific department and have the managers develop allocation factors for different A&G categories under their control. MID currently uses this approach to allocate A&G to Domestic Water.1
x Allocation based on factor(s): Under this approach, A&G costs that cannot be directly assigned to a function are allocated based on factors that are deemed representative of the appropriate split of costs between functions. Examples of such allocators are operating and maintenance (O&M) costs by function, revenue by function, and the size of each line of service (e.g., gross plant, number of employees).
Both approaches have been used by other utilities with multiple lines of service to allocate A&G.
2.1.1 Strengths and Weaknesses of Different Allocation Methods: The following section discusses the strengths and weaknesses for each method for allocating A&G.
x Allocation based on input from functional area: This approach relies on the expertise of a utility’s departmental managers to develop allocation factors by department. This is both a strength and a weakness to the approach. It is a strength because the utility’s managers should have a good understanding of how much time and effort their individual departments spend supporting the work of the utility’s different lines of business. This approach allows for greater detail because there can be specific allocations for each line item of A&G in the budget. However, this approach is based on an individual’s judgement which can be subjective. This potential weakness is mitigated by having additional review of the final allocations.
1 Based on information provided by MID
DRAFT

3 | P a g e
x Allocation based on factor(s): This approach removes potential subjectivity from the allocation of A&G to function as it is completely transparent. A challenge presented by this approach is the factors are one‐size‐fits‐all for each A&G line item in the budget. This can make it difficult to determine the appropriate allocation factor(s). It is important to select one or more factor(s) that are indicative of the size of the utility and the degree to which each function within the utility relies on unassigned A&G.
2.2 A&G Allocation Approach
2.2.1 Domestic Water The consulting team believes it is reasonable to continue to identify Domestic Water A&G expenses based on input from functional area (manager surveys) for the following reasons:
x Domestic Water operations are relatively new and distinct when compared to Irrigation and Electric operations which have been intertwined for almost a century. Domestic Water operations are geographically distinct because they occur at the Modesto Regional Water Treatment Plant. The water treatment plant’s only purpose is to serve Domestic Water.
x Domestic Water A&G is transparent as it is reviewed by the City of Modesto. Domestic Water’s portions of A&G expenses are shown in Table 4 of the Appendix in the column “DW A&G %”. The contractual arrangement with the City of Modesto is structured so that Domestic Water A&G expenses are paid based on the budget and are trued up annually based on actual costs. The consulting team recommends Domestic Water A&G expenses and the corresponding reimbursement from the City be treated as A&G by Electric and Irrigation.
2.2.2 Electric and Irrigation In order to ensure compliance with Proposition 26, the consulting team recommends MID use allocation factor(s) for the assignment of A&G to Electric and Irrigation. The reasons for this are:
x Transparency: The allocation of A&G can be a complex matter in utility ratemaking. In order to ensure that the assignment process is clear and unambiguous, it is necessary to exclude subjective decisions by utility managers from the process. The transparency ensures that the assignment is done based on publicly‐available data.
x Accepted Practice: Allocation of A&G using so‐called “utility factors” has been used by many utilities. It is the accepted approach used at the Federal Energy Regulatory Commission.2 It is
2 “Accounting for Public Utilities,” Hahne and Aliff, Chapter 19.
DRAFT
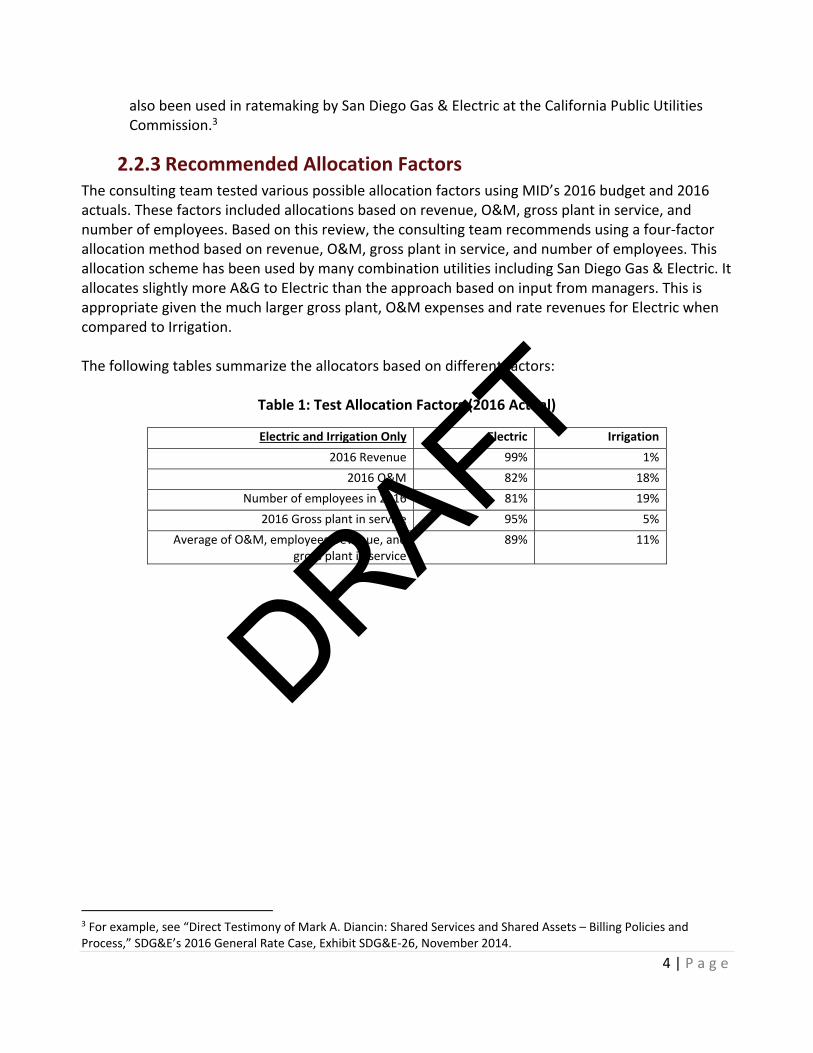
4 | P a g e
also been used in ratemaking by San Diego Gas & Electric at the California Public Utilities Commission.3
2.2.3 Recommended Allocation Factors The consulting team tested various possible allocation factors using MID’s 2016 budget and 2016 actuals. These factors included allocations based on revenue, O&M, gross plant in service, and number of employees. Based on this review, the consulting team recommends using a four‐factor allocation method based on revenue, O&M, gross plant in service, and number of employees. This allocation scheme has been used by many combination utilities including San Diego Gas & Electric. It allocates slightly more A&G to Electric than the approach based on input from managers. This is appropriate given the much larger gross plant, O&M expenses and rate revenues for Electric when compared to Irrigation. The following tables summarize the allocators based on different factors:
Table 1: Test Allocation Factors (2016 Actual)
Electric and Irrigation Only Electric Irrigation 2016 Revenue 99% 1%
2016 O&M 82% 18% Number of employees in 2016 81% 19%
2016 Gross plant in service 95% 5% Average of O&M, employees, revenue, and
gross plant in service 89% 11%
3 For example, see “Direct Testimony of Mark A. Diancin: Shared Services and Shared Assets – Billing Policies and Process,” SDG&E’s 2016 General Rate Case, Exhibit SDG&E‐26, November 2014.
DRAFT

5 | P a g e
Table 2: Test Allocation Factors (2016 Budget)
Electric and Irrigation Only Electric Irrigation 2016 Revenue 99% 1%
2016 O&M 84% 16% Number of employees in 2016 82% 18%
2016 Gross plant in service 95% 5% Average of O&M, employees, revenue, and
gross plant in service 90% 10%
2.3 Utility Factors Calculation Methodology The consulting team recommends using a three‐year average for each factor to make the results more predictable. The recommended methodology for each factor is as follows:
2.3.1 Direct Expenses Factor Each expense line item in the MID financial system was reviewed and categorized as Irrigation, Electric, or A&G. The sum of direct expenses for Electric and Irrigation, less Domestic Water A&G expenses, in each year are included in the direct expenses factor calculation. The consulting team recommends using a three‐year average which includes the budget year for this factor because budgeted expenses are used to calculate user fees and reflect any operational changes planned for the next year. This calculation is shown in detail in Appendix A, Table 1.
2.3.2 Direct Revenues Factor Each revenue line item in the MID financial system was reviewed and categorized as Irrigation, Electric, or A&G. The sum of direct revenues for Electric and Irrigation in each year are included in the direct revenues factor calculation. The consulting team recommends using a three‐year average which includes the budget year for this factor because budgeted expenses are used to calculate user fees and reflect any operational changes planned for the next year. This calculation is shown in detail in Appendix A, Table 2.
2.3.3 Number of Employees Factor MID staff provided the count of employees by line of service in each year. The consulting team recommends using a three‐year average which excludes the budget year for this factor because the actual staffing levels have remained consistent over time. This calculation is shown in detail in Appendix A, Table 3.
2.3.4 Gross Plant in Service Factor MID staff provided the gross plant in service by line of service in each year. The consulting team recommends using a three‐year average which excludes the budget year for this factor because gross plant has remained consistent over time. This calculation is shown in detail in Appendix A, Table 3
DRAFT

6 | P a g e
2.3.5 Calculation Methodology Applied Using the 2018 Budget The following table applies the factor calculation methodology discussed above to the 2018 budget year. The outcomes of the utility factors calculation are an A&G allocation factor of 89.73 percent for Electric and 10.27 percent for Irrigation.
Table 3: Utility Factor Calculation (2018 Budget)
3 DISCRETIONARY REVENUE Some revenues MID receives may reasonably be considered discretionary. The consulting team worked with MID’s attorney to identify these revenues. Total discretionary revenues are shown in Appendix A, Table 6.
Utility Factor Calculation ‐ 2018 Budget 3‐YearFactor Category 2015 2016 2017 2018 Average Factors
Actual Actual Actual Budget Year Range %
Direct Expenses 2016‐2018Electric $57,842,788 $59,173,997 $61,319,652 $69,095,245 $63,196,298 84.56%Irrigation $11,204,076 $10,746,963 $10,936,571 $12,926,059 $11,536,531 15.44%
$69,046,863 $69,920,960 $72,256,223 $82,021,304 $74,732,829
Direct Revenues 2016‐2018Electric $373,318,406 $367,495,543 $375,096,457 $368,300,513 $370,297,504 98.34%Irrigation $6,087,760 $5,602,645 $5,687,851 $7,486,306 $6,258,934 1.66%
$379,406,166 $373,098,188 $380,784,308 $375,786,819 $376,556,438
Number of Employees 2015‐2017Electric 247.0 247.0 252.0 276.7 248.7 81.44%Irrigation 54.0 57.0 59.0 59.0 56.7 18.56%
301.0 304.0 311.0 335.7 305.3
Plant in Service 2015‐2017Electric $928,772,407 $946,144,508 $982,000,000 $952,305,638 94.57%Irrigation $53,633,318 $54,508,543 $55,800,000 $54,647,287 5.43%
$982,405,725 $1,000,653,051 $1,037,800,000 $1,006,952,925
Line of Service Utility FactorElectric 89.73%Irrigation 10.27%
DRAFT

7 | P a g e
3.1 Other Revenues The consulting team concludes that some line items under the category “Other Revenue” in the MID budget may be considered discretionary by MID’s Board of Directors. The noted line items are as follows:
x PRJ ‐ Fiber Optic Revenue o This revenue is rent paid to run fiber optic lines on MID property. The consulting
team concludes that it is reasonable to treat income from rents as discretionary. x PRJ ‐ Interest Income
o The consulting team recommends Interest identified as direct should be allocated directly but all other interest should be treated as discretionary based on California Government Code section 53647, which allows interest revenue to be used for general fund purposes.
x PRJ ‐ Late Penalties o Late penalties are not fees for a service and may be considered discretionary.
x PRJ ‐ Rental of District Property o The consulting team concludes it is reasonable to treat income from rents as
discretionary. x PRJ ‐ Warehouse Sales
o Warehouse sales are essentially windfall revenue, as the items sold are usually completely depreciated and would be disposed of if there was no buyer. It reasonable to consider windfall revenue as discretionary.
The outcome of applying these recommendations to MID’s 2018 budget is $6.5 million of discretionary revenue.
3.2 Wholesale Power Revenues Based on the recent California Supreme Court ruling in Citizens for Fair REU Rates v. City of Redding,4 gross wholesale power revenues may be transferred to a utility’s general fund, to be used for any lawful purpose, such as funding the cost of irrigation service. Thus, wholesale power revenues are also discretionary. The outcome of applying this recommendation to MID’s 2018 budget is an additional $9.5 million of discretionary revenue. 4 INTERFUNCTIONAL VALUE When the assets of one line of service provide value to another line of service it is reasonable for the benefitting line of service to pay for that value. The consulting team reviewed MID’s lines of service and identified two areas where interfunctional value is being provided and developed methodologies to quantify those values. 4 (2018) 6 Cal.5th 1
DRAFT

8 | P a g e
4.1 Value of Electric Transmission Along Irrigation Canals The value of the right‐of‐way along MID canals used by Electric is equal to the necessary land needed for transmission and distribution right‐of‐way multiplied by rental value of land from the Bureau of Land Management (BLM) for the MID service territory ($456.55/acre for BLM rental zone 9).5 MID provided the number of poles on the MID canals (2,540) and the typical span between poles (300 feet). MID also provided the distribution of line miles by voltage as well as the width of right‐of‐way needed by voltage. The following table presents this information, which is used to estimate the average width of right‐of‐way on the MID system: Table 4: Right‐of‐Way Width Calculation
5 https://www.blm.gov/sites/blm.gov/files/2016‐2025_linear_rent_schedule_0.pdf
T&D Line Voltage Level1
T&D Distance (Miles)
Percent of Total T&D Miles
Right‐of‐Way Width (Feet)
12 kV 984.5 78.3% 3017 kV 29.9 2.4% 3021 kV 1.8 0.1% 3069 kV 203.9 16.2% 140115 kV 37.6 3.0% 140
1,257.8Weighted Average Right‐of‐Way Width 51.1
1‐ 230 kV lines are not located on canals
DRAFT

9 | P a g e
Using these inputs, we estimated the rental value of right‐of‐way used on MID’s canals as $414,699. The following table summarizes the calculation: Table 5: 2018 Right‐of‐Way Value Calculation
4.2 Value of Hydroelectric Power from Don Pedro MID owns 31.54% (63 Megawatts) of the Don Pedro hydropower facility (Don Pedro) located on the Tuolumne River. Turlock Irrigation District owns the rest of the Don Pedro hydropower facility. MID uses the power from this facility to serve a portion of MID’s electric load. MID’s ownership of this hydropower facility is the result of Irrigation operations because the dam is historically an Irrigation asset, as is the water contained by the dam, which ultimately produces hydropower. Moreover, if MID had not developed retail electric operations it would have been able to sell its generation capacity and energy on the open market and use this revenue to fund irrigation service. The consulting team believes it is reasonable for Electric to compensate Irrigation for the value of Don Pedro hydroelectric generation capacity and generated power for the following reasons:
x MID’s ownership of hydro generation capacity in Don Pedro only exists due to Irrigation. x MID’s original intent when it began generating hydropower from the Don Pedro Dam was to
reduce the rates paid by Irrigation customers. x MID could have opted to not make the hydro value available to retail electric customers and
sold the capacity and energy on the open market. x Electric benefits from the dedicated, close, green, reliable source of electricity.
4.2.1 Hydropower Valuation Methodology The consulting team recommends using the market value of energy and capacity provided by the Don Pedro hydropower facility to quantify the value of the services provided by the Don Pedro hydropower facility to MID’s Electric rate payers.
Right‐of‐Way Value AmountPoles on canals 2,580Typical Span Between Poles (Linear Feet) 300Right‐of‐Way (Linear Feet) 774,000Right‐of‐Way (Miles) 147Average Width of Right‐of‐Way (Feet) 51Right‐of‐Way (Square Feet) 39,566,912Square Feet per Acre 43,560Right‐of‐Way (Acres) 9082018 BLM Rental Zone 9 Rate per Acre $456.552018 Right‐of‐Way Value $414,699
DRAFT

10 | P a g e
Using the value of energy and capacity is a bottom‐up approach. The unrecovered value of Don Pedro is assessed as the market value of the energy and capacity that Don Pedro provides, less the costs for relicensing of Don Pedro, A&G expenses, Don Pedro capital expenses, and other hydropower expenses that are already paid for by electric customers.
The consulting team recommends using this method for the assessment of the value of services provided by Don Pedro, for the following reasons:
x Easy to Understand: This assessment uses simple inputs of Don Pedro’s energy and capacity production and established market prices for energy and capacity. These inputs can be easily understood and changed.
x Transparency: As the inputs used are publicly available market prices for energy and capacity on the CAISO grid, there is little room for adjustments that could skew results one way or another.
x Clarity: This approach clearly demonstrates the costs of running Don Pedro and the value of
services obtained from Don Pedro so there is no confusion or double counting of costs or the value of services.
4.2.2 Implementation In order to properly implement this valuation methodology, it is important to clearly define the sources for the market prices of energy and capacity and the costs related to Don Pedro that are already paid by Electric customers.
x Market prices of energy and capacity: MRW relied on publicly available sources for the prices of energy and capacity that would be used to value the services provided by Don Pedro. For the price of the energy, MRW used historical prices for the NP15 node from CAISO’s OASIS database and Platt’s Megawatt Daily. For future energy prices MRW used publicly available data from the Nodal Exchange futures reports from August 2018. For capacity, MRW relied on the resource adequacy (RA) reports from the California Public Utilities Commission for current and historic RA prices and assumed that new plants will likely not be needed to be built for capacity purposes and prices will remain relatively stable in coming years.
x Don Pedro costs paid by Electric customers: Any cost related to the Don Pedro Dam included
in Electric’s cost‐of‐service study will be netted out of the Value of Energy & Capacity.
x Projected flows: Several flow scenarios were reviewed, and the consulting team recommends basing the value on average flow projections for 2018.
DRAFT
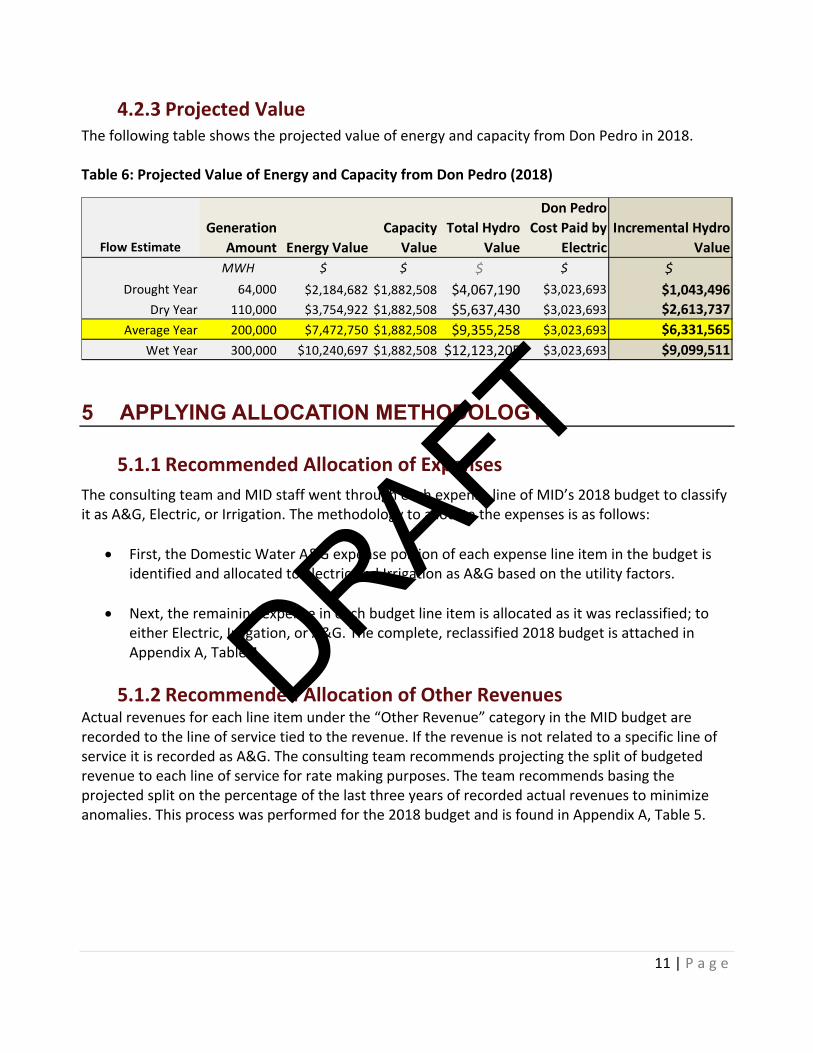
11 | P a g e
4.2.3 Projected Value The following table shows the projected value of energy and capacity from Don Pedro in 2018. Table 6: Projected Value of Energy and Capacity from Don Pedro (2018)
5 APPLYING ALLOCATION METHODOLOGY
5.1.1 Recommended Allocation of Expenses The consulting team and MID staff went through each expense line of MID’s 2018 budget to classify it as A&G, Electric, or Irrigation. The methodology to allocate the expenses is as follows:
x First, the Domestic Water A&G expense portion of each expense line item in the budget is identified and allocated to Electric and Irrigation as A&G based on the utility factors.
x Next, the remaining expense in each budget line item is allocated as it was reclassified; to either Electric, Irrigation, or A&G. The complete, reclassified 2018 budget is attached in Appendix A, Table 4.
5.1.2 Recommended Allocation of Other Revenues
Actual revenues for each line item under the “Other Revenue” category in the MID budget are recorded to the line of service tied to the revenue. If the revenue is not related to a specific line of service it is recorded as A&G. The consulting team recommends projecting the split of budgeted revenue to each line of service for rate making purposes. The team recommends basing the projected split on the percentage of the last three years of recorded actual revenues to minimize anomalies. This process was performed for the 2018 budget and is found in Appendix A, Table 5.
Flow EstimateGeneration
Amount Energy ValueCapacity
ValueTotal Hydro
Value
Don Pedro Cost Paid by
ElectricIncremental Hydro
ValueMWH $ $ $ $ $
Drought Year 64,000 $2,184,682 $1,882,508 $4,067,190 $3,023,693 $1,043,496Dry Year 110,000 $3,754,922 $1,882,508 $5,637,430 $3,023,693 $2,613,737
Average Year 200,000 $7,472,750 $1,882,508 $9,355,258 $3,023,693 $6,331,565Wet Year 300,000 $10,240,697 $1,882,508 $12,123,205 $3,023,693 $9,099,511
DRAFT

12 | P a g e
6 RECOMMENDATIONS APPLIED TO THE 2018 BUDGET The consulting team’s recommended allocation framework was applied to MID’s 2018 budget. The net revenues were calculated to test whether each line of service could operate without needing additional rate revenue. If the sum of negative net revenues for each line of service are less than MID’s total available discretionary revenue, no line of service will need a rate increase in order to fund the cost of service. The following table exhibits the result of this exercise. Table 7: Net Revenues by Service Line
6.1.1 Domestic Water Results The net revenue of Domestic Water is zero. This is expected because the City of Modesto is contractually obligated to reimburse MID for all expenses.
6.1.2 Irrigation Results After applying the allocation framework Irrigation requires $6.5 million of the identified $16.0 million of discretionary revenues to have zero net revenue. Irrigation could select to finance the 2018 capital projects. Assuming a thirty‐year term with a 4.5% interest rate, projected annual debt service payments for the budgeted capital in 2018 would be
Projected Net Revenue
Electric Fund
Irrigation Fund
Domestic Water
Discretionary Fund
2018 Budget $ Millions $ Millions $ Millions $ Millions
Source of FundsRate Revenue $356.8 $4.1Other RevenueDirect1 $7.1 $10.2 $19.3A&G $4.6 $0.5 $3.3Discretionary $9.0 $6.5 $16.0
Total Source of Funds $377.5 $21.3 $22.6 $16.0
Use of FundsO&M1 $249.1 $12.9 $8.7A&G $41.0 $4.7 $3.3Capital $6.5 $3.7 $10.6Debt Service $94.6Discretionary Transfer $15.5
Total Use of Funds $391.2 $21.3 $22.6 $15.5
Net (Rev ‐ Exp) ‐$13.7 $0.0 $0.0 $0.51‐ Includes Canal Right of Way and Don Pedro Hydro Electric ValueDRAFT

13 | P a g e
$0.2 million. This option would allow the MID Board to use $3.5 million of the discretionary revenues for other purposes while maintaining zero net revenue for Irrigation.
6.1.3 Electric Enterprise Electric is projected to have net revenues of ‐$13.7 million. The negative net revenue is due to MID’s planned defeasance of outstanding debt. 7 RESERVE POLICY RECOMMENDATION The consulting team recommends that MID begin to track a separate reserve balance for each line of service and a balance for discretionary funds. This will ensure that rate revenue from one line of service does not benefit another line of service. Based on the recent California Supreme Court ruling in the Citizens for Fair REU Rates v. City of Redding the consulting team recommends MID track surpluses from the sale of wholesale power in the discretionary reserve balance. 8 CONCLUSION The consulting team made recommendations which provide MID a reasonable framework to fairly apportion revenues and expenses to each line of service. The recommendations are as follows:
x Use the identified direct Electric and Irrigation revenue and expense categories x Use a three‐year average of actual “other revenue” to allocate budgeted “other revenue” x Continue allocating Domestic Water A&G using the manager survey method x Use the Utility Factor method to allocate A&G between Electric and Irrigation x Have Electric and Irrigation treat Domestic Water A&G expenses and revenues as A&G x Electric should transfer an amount to Irrigation based on the recommended Don Pedro
hydro value methodology x Electric should transfer an amount to Irrigation for the value of transmission right‐of‐way on
irrigation canals based on BLM rates. These recommendations allow each line of service to reasonably account for all revenues and expenses when setting rates for that service. The consulting team applied the recommended framework to MID’s 2018 budget and found that there are sufficient discretionary revenues to allow each line of service to be in compliance with Proposition 26 without raising Electric or Irrigation rates.
DRAFT

14 | P a g e
APPENDIX A
DRAFT

MID Allocation ReportTable 1Expenses for Utility Factors
Expenses Less A&G1
MID Expenses for Utility Factors 2015 2016 2017 2018
Actual Actual Actual Budget
PRJ ‐ Board of Directors PRJ ‐ Board Secretary Office PRJ ‐ Legal Counsel PRJ ‐ Legal Claims PRJ ‐ MID Water Rights PRJ ‐ SED Litigation OM ‐ BOARD OF DIRECTORS DIVISION PRJ ‐ General Manager PRJ ‐ Regulatory Administration PRJ ‐ District Seminar & Meetings PRJ ‐ Public Affairs PRJ ‐ Project Management PRJ ‐ Public Inform‐Canal Safety PRJ ‐ Public Inform‐Elect Safety PRJ ‐ Community Service PRJ ‐ Safety/Environmental Compliance Admin PRJ ‐ Safety PRJ ‐ Environmental OM ‐ GENERAL MANAGER DIVISION PRJ ‐ Human Resources PRJ ‐ Training PRJ ‐ Recruitments PRJ ‐ Employee Programs PRJ ‐ Retirement Administration OM ‐ HUMAN RESOURCES DIVISION PRJ ‐ IT Administration
Line of Service Allocation
DRAFT

MID Allocation ReportTable 1Expenses for Utility Factors
Expenses Less A&G1
MID Expenses for Utility Factors 2015 2016 2017 2018
Actual Actual Actual Budget
Line of Service Allocation
PRJ ‐ IT Systems Support PRJ ‐ IT Applications Business Support PRJ ‐ IT Applications Operations Support PRJ ‐ Technical Operations PRJ ‐ Network/Desktop Support PRJ ‐ IT Security OM ‐ INFORMATION TECHNOLOGY DIVISION PRJ ‐ Finance Admin PRJ ‐ Employee Cost Savings Prog PRJ ‐ Treasurer PRJ ‐ Financing Related Expense PRJ ‐ Retirement Investment Expense PRJ ‐ Pricing/Risk Management PRJ ‐ Budget/Rates Administrator PRJ ‐ Controller PRJ ‐ Accounting PRJ ‐ Customer Services Admin $265,071 $282,212 $264,566 $719,427 Electric PRJ ‐ Billing 1,856,532 2,550,870 2,578,976 2,625,030 Electric PRJ ‐ Call Center 1,537,088 1,359,225 1,615,338 1,940,600 Electric PRJ ‐ Cash Accounting 1,717,015 1,717,291 1,546,855 1,838,038 Electric PRJ ‐ Risk & Property PRJ ‐ Building Services PRJ ‐ Purchasing PRJ ‐ Materials Handling PRJ ‐ Equipment Clearing PRJ ‐ Fleet Maintenance PRJ ‐ Vehicles & Equipment
DRAFT
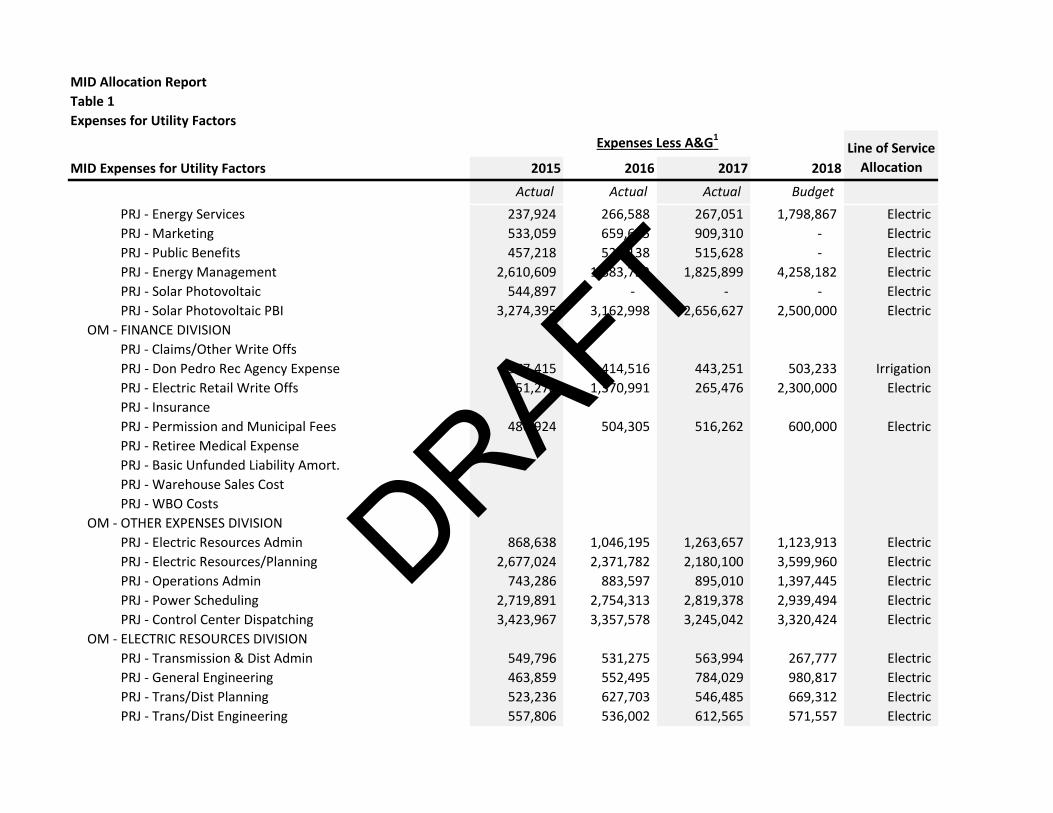
MID Allocation ReportTable 1Expenses for Utility Factors
Expenses Less A&G1
MID Expenses for Utility Factors 2015 2016 2017 2018
Actual Actual Actual Budget
Line of Service Allocation
PRJ ‐ Energy Services 237,924 266,588 267,051 1,798,867 Electric PRJ ‐ Marketing 533,059 659,635 909,310 ‐ Electric PRJ ‐ Public Benefits 457,218 524,138 515,628 ‐ Electric PRJ ‐ Energy Management 2,610,609 1,883,723 1,825,899 4,258,182 Electric PRJ ‐ Solar Photovoltaic 544,897 ‐ ‐ ‐ Electric PRJ ‐ Solar Photovoltaic PBI 3,274,395 3,162,998 2,656,627 2,500,000 Electric OM ‐ FINANCE DIVISION PRJ ‐ Claims/Other Write Offs PRJ ‐ Don Pedro Rec Agency Expense 377,415 414,516 443,251 503,233 Irrigation PRJ ‐ Electric Retail Write Offs 751,278 1,370,991 265,476 2,300,000 Electric PRJ ‐ Insurance PRJ ‐ Permission and Municipal Fees 486,924 504,305 516,262 600,000 Electric PRJ ‐ Retiree Medical Expense PRJ ‐ Basic Unfunded Liability Amort. PRJ ‐ Warehouse Sales Cost PRJ ‐ WBO Costs OM ‐ OTHER E PENSES DIVISION PRJ ‐ Electric Resources Admin 868,638 1,046,195 1,263,657 1,123,913 Electric PRJ ‐ Electric Resources/Planning 2,677,024 2,371,782 2,180,100 3,599,960 Electric PRJ ‐ Operations Admin 743,286 883,597 895,010 1,397,445 Electric PRJ ‐ Power Scheduling 2,719,891 2,754,313 2,819,378 2,939,494 Electric PRJ ‐ Control Center Dispatching 3,423,967 3,357,578 3,245,042 3,320,424 Electric OM ‐ ELECTRIC RESOURCES DIVISION PRJ ‐ Transmission & Dist Admin 549,796 531,275 563,994 267,777 Electric PRJ ‐ General Engineering 463,859 552,495 784,029 980,817 Electric PRJ ‐ Trans/Dist Planning 523,236 627,703 546,485 669,312 Electric PRJ ‐ Trans/Dist Engineering 557,806 536,002 612,565 571,557 Electric
DRAFT

MID Allocation ReportTable 1Expenses for Utility Factors
Expenses Less A&G1
MID Expenses for Utility Factors 2015 2016 2017 2018
Actual Actual Actual Budget
Line of Service Allocation
PRJ ‐ Substation Engineering 430,281 384,742 661,075 598,013 Electric PRJ ‐ Mapping/Records 685,263 464,247 613,271 830,007 Electric PRJ ‐ Trouble General Maintenance 1,617,735 1,650,932 1,881,818 2,121,401 Electric PRJ ‐ Turn‐on/Turn‐off 12,121 15,314 4,511 21,061 Electric PRJ ‐ Street Lighting 99,040 94,344 89,908 93,411 Electric PRJ ‐ Vegetation Management 1,731,542 1,800,491 1,943,198 1,978,416 Electric PRJ ‐ Trouble Administration 448,337 416,814 409,056 452,640 Electric PRJ ‐ Inspections 650,107 526,284 419,935 563,423 Electric PRJ ‐ Line Construction Admin 1,147,854 1,069,350 1,077,958 1,165,551 Electric PRJ ‐ LC Overhead Transmission 71,490 206,829 175,187 176,497 Electric PRJ ‐ LC Overhead Distrib Maint 819,372 1,078,794 1,067,188 1,622,501 Electric PRJ ‐ Line Construction General 674,417 830,846 937,087 1,148,326 Electric PRJ ‐ LC Underground Distribution 880,174 1,075,964 997,421 1,184,756 Electric PRJ ‐ Insulating Equipment 15,886 8,873 19,452 26,500 Electric PRJ ‐ Substation 725,320 732,655 774,587 810,433 Electric PRJ ‐ Transmission Substation 884,737 990,680 1,356,286 1,958,666 Electric PRJ ‐ Distribution Substation 1,597,378 1,990,451 2,220,325 3,411,888 Electric PRJ ‐ Maintenance of Relays 1,082,414 951,996 580,165 1,272,141 Electric PRJ ‐ Meter Transformer 425,067 292,665 294,208 361,796 Electric PRJ ‐ Meter Maintenance 1,406,758 1,552,749 1,466,600 1,602,797 Electric PRJ ‐ Transformer Maintenance 201,927 251,721 231,500 247,193 Electric PRJ ‐ LM Receiver Maintenance 14,816 20,557 22,238 80,524 Electric OM ‐ ELECTRIC TRANSMISSION AND DISTRIBUTION DIVISION PRJ ‐ Water Operations Admin 339,788 492,357 508,946 300,249 Irrigation PRJ ‐ Water Rights 363,430 274,714 264,115 515,026 Irrigation PRJ ‐ Irrigation System Improvements 296,381 487,300 333,909 550,000 Irrigation PRJ ‐ LaGrange Water System 261,323 198,003 160,465 90,000 Irrigation
DRAFT

MID Allocation ReportTable 1Expenses for Utility Factors
Expenses Less A&G1
MID Expenses for Utility Factors 2015 2016 2017 2018
Actual Actual Actual Budget
Line of Service Allocation
PRJ ‐ Civil Engineering 568,705 675,990 728,527 933,770 Irrigation PRJ ‐ Surveying 337,730 345,295 359,332 502,976 Irrigation PRJ ‐ Conservation Improvements 57,561 101,953 172,429 143,824 Irrigation PRJ ‐ Water Measurement 91,851 31,046 30,450 154,497 Irrigation PRJ ‐ Water Data & Analysis 115,455 147,111 123,443 160,225 Irrigation PRJ ‐ Ground Water Management 7,317 13,730 10,893 64,675 Irrigation PRJ ‐ Don Pedro Watershed 171,363 301,875 276,475 296,515 Irrigation PRJ ‐ Irrigation Admin 686,212 398,160 429,962 480,034 Irrigation PRJ ‐ Irrigation Services 1,740,077 1,663,100 1,844,024 1,885,639 Irrigation PRJ ‐ La Grange 53,417 9,282 23,983 40,216 Irrigation PRJ ‐ Upper Main Canal 113,621 136,548 121,890 146,955 Irrigation PRJ ‐ Modesto Reservoir 99,946 111,066 109,592 124,964 Irrigation PRJ ‐ Pumps 1,746,490 947,881 470,914 781,832 Irrigation PRJ ‐ Laterals and Ditches 1,723,004 2,127,523 2,606,855 2,542,798 Irrigation PRJ ‐ Gunite 897,949 595,176 480,479 973,531 Irrigation PRJ ‐ Irrigation Pipelines 116,621 101,587 130,737 162,095 Irrigation PRJ ‐ Structures 158,029 139,669 47,246 205,431 Irrigation PRJ ‐ Weed & Moss Control 739,369 847,876 1,057,717 1,121,285 Irrigation PRJ ‐ Landscaping 141,022 185,207 200,937 246,291 Irrigation OM ‐ WATER OPERATIONS DIVISION PRJ ‐ Domestic Water Admin PRJ ‐ Domestic Water A&G PRJ ‐ Domestic Water Operations PRJ ‐ Domestic Water Laboratory PRJ ‐ Domestic Water Maintenance OM ‐ DOMESTIC WATER DIVISIONDistrict OM
DRAFT

MID Allocation ReportTable 1Expenses for Utility Factors
Expenses Less A&G1
MID Expenses for Utility Factors 2015 2016 2017 2018
Actual Actual Actual Budget
Line of Service Allocation
PS ‐ Purchase Power PRJ ‐ Generation Admin 591,776 522,817 522,028 563,898 Electric PRJ ‐ Don Pedro Generation O&M 905,337 1,021,590 1,246,412 1,150,000 Electric PRJ ‐ New Hogan O&M 60,684 74,080 96,118 88,393 Electric PRJ ‐ Stone Drop O&M 24,248 27,239 12,858 33,585 Electric PRJ ‐ McClure O&M 741,922 770,524 578,126 1,120,818 Electric PRJ ‐ Woodland Operations 7,188,979 6,448,031 3,744,285 4,516,162 Electric PRJ ‐ Woodland Maintenance 4,346,406 4,987,257 10,196,166 4,484,405 Electric PRJ ‐ Ripon O&M $1,561,887 $1,972,243 $1,808,439 $1,959,200 Electric PS ‐ Generation O&M PS ‐ Generation FuelDistrict Power Supply1‐ A&G includes Domestic Water A&G
DRAFT

MID Allocation ReportTable 2Revenues for Utility Factors
MID Revenues for Utility Factors 2015 2016 2017 2018 Line of Service Actual Actual Actual Budget
PRJ ‐ Electric Wholesale Rev $16,018,000 $7,103,000 $8,254,015 $9,538,133 PRJ ‐ El Transmission Rev Retail 2,330,256 1,100,873 2,500,132 ‐ Electric PRJ ‐ Electric Operating Revenue 328,589,228 329,420,338 336,425,260 330,762,941 Electric PRJ ‐ Environmental Energy Adjustment 17,038,459 20,364,576 18,935,184 18,998,567 Electric PRJ ‐ Greenhouse Gases Adjustment PRJ ‐ Capital Infrastructure Adjustment 6,969,393 7,030,642 7,107,664 7,040,872 Electric Electric Revenue PRJ ‐ Raw Water Revenue 4,527,774 3,574,421 3,769,469 4,082,743 Irrigation PRJ ‐ FERC Instream Flow Revenue 1,334,891 1,477,205 1,532,879 1,620,812 Irrigation PRJ ‐ Domestic Water Revenue PRJ ‐ Storm Water Revenue 1,441,051 Irrigation Water Revenue PRJ ‐ Customer Services Fees Rev 1,853,645 1,916,462 1,239,042 1,400,000 Electric PRJ ‐ Don Pedro Rec Agency Revenue 225,094 551,019 385,503 341,700 Irrigation PRJ ‐ DW Admin Fees Revenue PRJ ‐ Facilities Charge 519,425 559,653 635,161 560,000 Electric PRJ ‐ Fiber Optic Revenue PRJ ‐ Gain or Loss on Sale of Assets PRJ ‐ Interest Income PRJ ‐ Late Penalties PRJ ‐ Misc. Cost Recovery PRJ ‐ Misc. Operating Income PRJ ‐ Other Entities Admin Fees Revenue PRJ ‐ Rental of District Property PRJ ‐ Retirement Fund Revenue PRJ ‐ Revenue‐Aid to Construction PRJ ‐ Warehouse Sales PRJ ‐ WBO Income Rev ‐ Other Revenues
DRAFT

MID Allocation ReportTable 3Utility Factors Calculation
Utility Factor Calculation ‐ 2018 Budget 3‐YearFactor Category 2015 2016 2017 2018 Average Factors
Actual Actual Actual Budget Year Range %
Direct Expenses 2016‐2018Electric $57,842,788 $59,173,997 $61,319,652 $69,095,245 $63,196,298 84.56%Irrigation $11,204,076 $10,746,963 $10,936,571 $12,926,059 $11,536,531 15.44%
$69,046,863 $69,920,960 $72,256,223 $82,021,304 $74,732,829
Direct Revenues 2016‐2018Electric $373,318,406 $367,495,543 $375,096,457 $368,300,513 $370,297,504 98.34%Irrigation $6,087,760 $5,602,645 $5,687,851 $7,486,306 $6,258,934 1.66%
$379,406,166 $373,098,188 $380,784,308 $375,786,819 $376,556,438
Number of Employees 2015‐2017Electric 247.0 247.0 252.0 276.7 248.7 81.44%Irrigation 54.0 57.0 59.0 59.0 56.7 18.56%
301.0 304.0 311.0 335.7 305.3
Plant in Service 2015‐2017Electric $928,772,407 $946,144,508 $982,000,000 $952,305,638 94.57%Irrigation $53,633,318 $54,508,543 $55,800,000 $54,647,287 5.43%
$982,405,725 $1,000,653,051 $1,037,800,000 $1,006,952,925
Line of Service Utility FactorElectric 89.73%Irrigation 10.27%
DRAFT
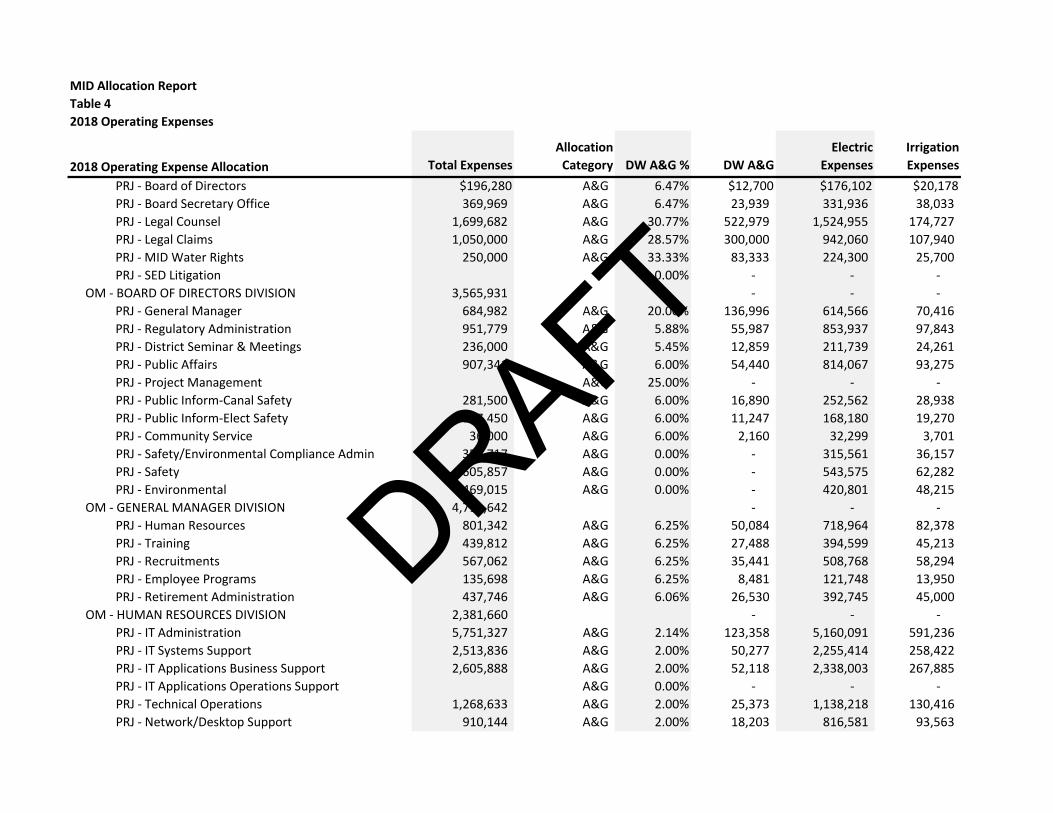
MID Allocation ReportTable 42018 Operating Expenses
2018 Operating Expense Allocation Total Expenses Allocation Category DW A&G % DW A&G
Electric Expenses
Irrigation Expenses
PRJ ‐ Board of Directors $196,280 A&G 6.47% $12,700 $176,102 $20,178 PRJ ‐ Board Secretary Office 369,969 A&G 6.47% 23,939 331,936 38,033 PRJ ‐ Legal Counsel 1,699,682 A&G 30.77% 522,979 1,524,955 174,727 PRJ ‐ Legal Claims 1,050,000 A&G 28.57% 300,000 942,060 107,940 PRJ ‐ MID Water Rights 250,000 A&G 33.33% 83,333 224,300 25,700 PRJ ‐ SED Litigation 0.00% ‐ ‐ ‐ OM ‐ BOARD OF DIRECTORS DIVISION 3,565,931 ‐ ‐ ‐ PRJ ‐ General Manager 684,982 A&G 20.00% 136,996 614,566 70,416 PRJ ‐ Regulatory Administration 951,779 A&G 5.88% 55,987 853,937 97,843 PRJ ‐ District Seminar & Meetings 236,000 A&G 5.45% 12,859 211,739 24,261 PRJ ‐ Public Affairs 907,341 A&G 6.00% 54,440 814,067 93,275 PRJ ‐ Project Management A&G 25.00% ‐ ‐ ‐ PRJ ‐ Public Inform‐Canal Safety 281,500 A&G 6.00% 16,890 252,562 28,938 PRJ ‐ Public Inform‐Elect Safety 187,450 A&G 6.00% 11,247 168,180 19,270 PRJ ‐ Community Service 36,000 A&G 6.00% 2,160 32,299 3,701 PRJ ‐ Safety/Environmental Compliance Admin 351,717 A&G 0.00% ‐ 315,561 36,157 PRJ ‐ Safety 605,857 A&G 0.00% ‐ 543,575 62,282 PRJ ‐ Environmental 469,015 A&G 0.00% ‐ 420,801 48,215 OM ‐ GENERAL MANAGER DIVISION 4,711,642 ‐ ‐ ‐ PRJ ‐ Human Resources 801,342 A&G 6.25% 50,084 718,964 82,378 PRJ ‐ Training 439,812 A&G 6.25% 27,488 394,599 45,213 PRJ ‐ Recruitments 567,062 A&G 6.25% 35,441 508,768 58,294 PRJ ‐ Employee Programs 135,698 A&G 6.25% 8,481 121,748 13,950 PRJ ‐ Retirement Administration 437,746 A&G 6.06% 26,530 392,745 45,000 OM ‐ HUMAN RESOURCES DIVISION 2,381,660 ‐ ‐ ‐ PRJ ‐ IT Administration 5,751,327 A&G 2.14% 123,358 5,160,091 591,236 PRJ ‐ IT Systems Support 2,513,836 A&G 2.00% 50,277 2,255,414 258,422 PRJ ‐ IT Applications Business Support 2,605,888 A&G 2.00% 52,118 2,338,003 267,885 PRJ ‐ IT Applications Operations Support A&G 0.00% ‐ ‐ ‐ PRJ ‐ Technical Operations 1,268,633 A&G 2.00% 25,373 1,138,218 130,416 PRJ ‐ Network/Desktop Support 910,144 A&G 2.00% 18,203 816,581 93,563
DRAFT

MID Allocation ReportTable 42018 Operating Expenses
2018 Operating Expense Allocation Total Expenses Allocation Category DW A&G % DW A&G
Electric Expenses
Irrigation Expenses
PRJ ‐ IT Security A&G 0.00% ‐ ‐ ‐ OM ‐ INFORMATION TECHNOLOGY DIVISION 13,049,829 ‐ ‐ ‐ PRJ ‐ Finance Admin 283,580 A&G 5.45% 15,451 254,428 29,152 PRJ ‐ Employee Cost Savings Prog ‐ ‐ ‐ PRJ ‐ Treasurer 380,060 A&G 5.45% 20,708 340,990 39,070 PRJ ‐ Financing Related Expense 126,000 A&G 0.00% ‐ 113,047 12,953 PRJ ‐ Retirement Investment Expense 1,002,500 A&G 6.50% 65,163 899,443 103,057 PRJ ‐ Pricing/Risk Management 616,845 A&G 8.00% 49,348 553,433 63,412 PRJ ‐ Budget/Rates Administrator A&G ‐ ‐ ‐ PRJ ‐ Controller 649,871 A&G 5.45% 35,410 583,064 66,807 PRJ ‐ Accounting 1,075,932 A&G 5.45% 58,624 965,326 110,606 PRJ ‐ Customer Services Admin 719,427 Electric 0.00% ‐ 719,427 ‐ PRJ ‐ Billing 2,625,030 Electric 0.00% ‐ 2,625,030 ‐ PRJ ‐ Call Center 1,940,600 Electric 0.00% ‐ 1,940,600 ‐ PRJ ‐ Cash Accounting 1,838,038 Electric 0.00% ‐ 1,838,038 ‐ PRJ ‐ Risk & Property 1,146,916 A&G 5.45% 62,492 1,029,013 117,903 PRJ ‐ Building Services 1,995,522 A&G 5.30% 105,696 1,790,382 205,140 PRJ ‐ Purchasing 671,152 A&G 2.41% 16,172 602,158 68,994 PRJ ‐ Materials Handling 804,714 A&G 0.00% ‐ 721,990 82,725 PRJ ‐ Equipment Clearing (3,013,357) A&G 0.00% ‐ (2,703,584) (309,773) PRJ ‐ Fleet Maintenance 636,579 A&G 1.43% 9,112 571,138 65,440 PRJ ‐ Vehicles & Equipment 2,376,778 A&G 0.00% ‐ 2,132,445 244,333 PRJ ‐ Energy Services 1,798,867 Electric 0.00% ‐ 1,798,867 ‐ PRJ ‐ Marketing Electric 0.00% ‐ ‐ ‐ PRJ ‐ Public Benefits Electric 0.00% ‐ ‐ ‐ PRJ ‐ Energy Management 4,258,182 Electric 0.00% ‐ 4,258,182 ‐ PRJ ‐ Solar Photovoltaic Electric ‐ ‐ ‐ PRJ ‐ Solar Photovoltaic PBI 2,500,000 Electric 0.00% ‐ 2,500,000 ‐ OM ‐ FINANCE DIVISION 24,433,236 ‐ ‐ ‐ PRJ ‐ Claims/Other Write Offs 251,100 A&G 0.00% ‐ 225,287 25,813 PRJ ‐ Don Pedro Rec Agency Expense 503,233 Irrigation 0.00% ‐ ‐ 503,233
DRAFT
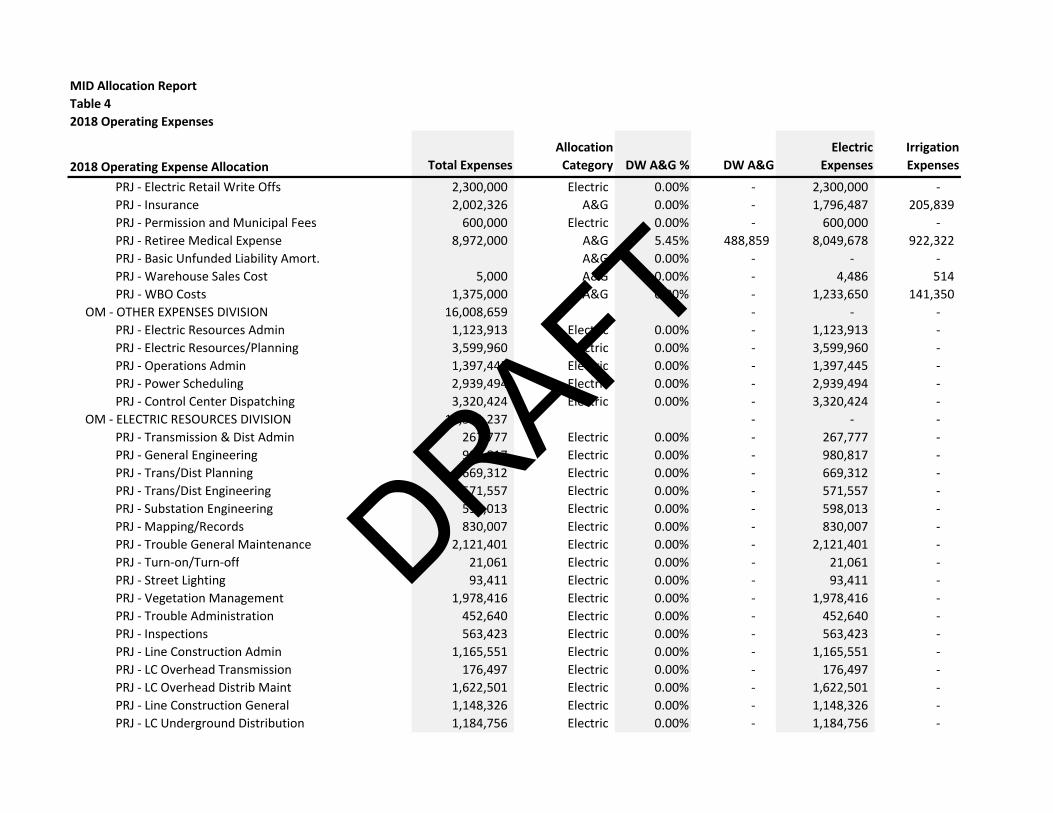
MID Allocation ReportTable 42018 Operating Expenses
2018 Operating Expense Allocation Total Expenses Allocation Category DW A&G % DW A&G
Electric Expenses
Irrigation Expenses
PRJ ‐ Electric Retail Write Offs 2,300,000 Electric 0.00% ‐ 2,300,000 ‐ PRJ ‐ Insurance 2,002,326 A&G 0.00% ‐ 1,796,487 205,839 PRJ ‐ Permission and Municipal Fees 600,000 Electric 0.00% ‐ 600,000 ‐ PRJ ‐ Retiree Medical Expense 8,972,000 A&G 5.45% 488,859 8,049,678 922,322 PRJ ‐ Basic Unfunded Liability Amort. A&G 0.00% ‐ ‐ ‐ PRJ ‐ Warehouse Sales Cost 5,000 A&G 0.00% ‐ 4,486 514 PRJ ‐ WBO Costs 1,375,000 A&G 0.00% ‐ 1,233,650 141,350 OM ‐ OTHER E PENSES DIVISION 16,008,659 ‐ ‐ ‐ PRJ ‐ Electric Resources Admin 1,123,913 Electric 0.00% ‐ 1,123,913 ‐ PRJ ‐ Electric Resources/Planning 3,599,960 Electric 0.00% ‐ 3,599,960 ‐ PRJ ‐ Operations Admin 1,397,445 Electric 0.00% ‐ 1,397,445 ‐ PRJ ‐ Power Scheduling 2,939,494 Electric 0.00% ‐ 2,939,494 ‐ PRJ ‐ Control Center Dispatching 3,320,424 Electric 0.00% ‐ 3,320,424 ‐ OM ‐ ELECTRIC RESOURCES DIVISION 12,381,237 ‐ ‐ ‐ PRJ ‐ Transmission & Dist Admin 267,777 Electric 0.00% ‐ 267,777 ‐ PRJ ‐ General Engineering 980,817 Electric 0.00% ‐ 980,817 ‐ PRJ ‐ Trans/Dist Planning 669,312 Electric 0.00% ‐ 669,312 ‐ PRJ ‐ Trans/Dist Engineering 571,557 Electric 0.00% ‐ 571,557 ‐ PRJ ‐ Substation Engineering 598,013 Electric 0.00% ‐ 598,013 ‐ PRJ ‐ Mapping/Records 830,007 Electric 0.00% ‐ 830,007 ‐ PRJ ‐ Trouble General Maintenance 2,121,401 Electric 0.00% ‐ 2,121,401 ‐ PRJ ‐ Turn‐on/Turn‐off 21,061 Electric 0.00% ‐ 21,061 ‐ PRJ ‐ Street Lighting 93,411 Electric 0.00% ‐ 93,411 ‐ PRJ ‐ Vegetation Management 1,978,416 Electric 0.00% ‐ 1,978,416 ‐ PRJ ‐ Trouble Administration 452,640 Electric 0.00% ‐ 452,640 ‐ PRJ ‐ Inspections 563,423 Electric 0.00% ‐ 563,423 ‐ PRJ ‐ Line Construction Admin 1,165,551 Electric 0.00% ‐ 1,165,551 ‐ PRJ ‐ LC Overhead Transmission 176,497 Electric 0.00% ‐ 176,497 ‐ PRJ ‐ LC Overhead Distrib Maint 1,622,501 Electric 0.00% ‐ 1,622,501 ‐ PRJ ‐ Line Construction General 1,148,326 Electric 0.00% ‐ 1,148,326 ‐ PRJ ‐ LC Underground Distribution 1,184,756 Electric 0.00% ‐ 1,184,756 ‐
DRAFT
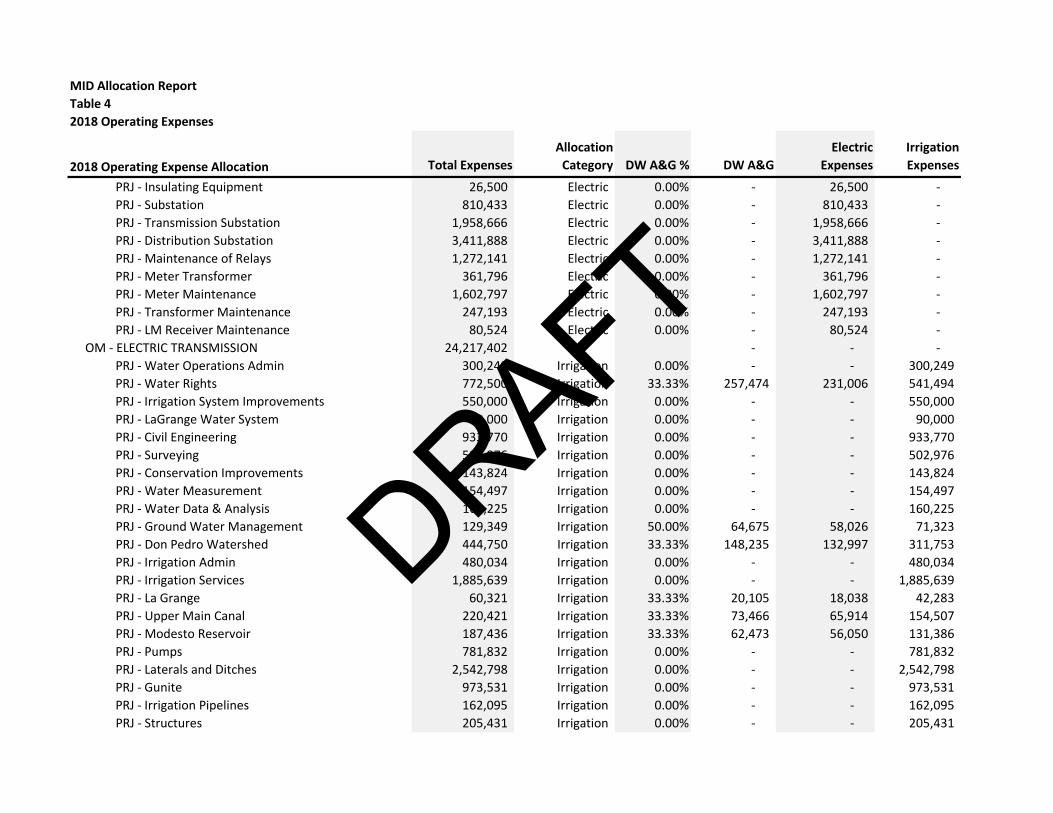
MID Allocation ReportTable 42018 Operating Expenses
2018 Operating Expense Allocation Total Expenses Allocation Category DW A&G % DW A&G
Electric Expenses
Irrigation Expenses
PRJ ‐ Insulating Equipment 26,500 Electric 0.00% ‐ 26,500 ‐ PRJ ‐ Substation 810,433 Electric 0.00% ‐ 810,433 ‐ PRJ ‐ Transmission Substation 1,958,666 Electric 0.00% ‐ 1,958,666 ‐ PRJ ‐ Distribution Substation 3,411,888 Electric 0.00% ‐ 3,411,888 ‐ PRJ ‐ Maintenance of Relays 1,272,141 Electric 0.00% ‐ 1,272,141 ‐ PRJ ‐ Meter Transformer 361,796 Electric 0.00% ‐ 361,796 ‐ PRJ ‐ Meter Maintenance 1,602,797 Electric 0.00% ‐ 1,602,797 ‐ PRJ ‐ Transformer Maintenance 247,193 Electric 0.00% ‐ 247,193 ‐ PRJ ‐ LM Receiver Maintenance 80,524 Electric 0.00% ‐ 80,524 ‐ OM ‐ ELECTRIC TRANSMISSION 24,217,402 ‐ ‐ ‐ PRJ ‐ Water Operations Admin 300,249 Irrigation 0.00% ‐ ‐ 300,249 PRJ ‐ Water Rights 772,500 Irrigation 33.33% 257,474 231,006 541,494 PRJ ‐ Irrigation System Improvements 550,000 Irrigation 0.00% ‐ ‐ 550,000 PRJ ‐ LaGrange Water System 90,000 Irrigation 0.00% ‐ ‐ 90,000 PRJ ‐ Civil Engineering 933,770 Irrigation 0.00% ‐ ‐ 933,770 PRJ ‐ Surveying 502,976 Irrigation 0.00% ‐ ‐ 502,976 PRJ ‐ Conservation Improvements 143,824 Irrigation 0.00% ‐ ‐ 143,824 PRJ ‐ Water Measurement 154,497 Irrigation 0.00% ‐ ‐ 154,497 PRJ ‐ Water Data & Analysis 160,225 Irrigation 0.00% ‐ ‐ 160,225 PRJ ‐ Ground Water Management 129,349 Irrigation 50.00% 64,675 58,026 71,323 PRJ ‐ Don Pedro Watershed 444,750 Irrigation 33.33% 148,235 132,997 311,753 PRJ ‐ Irrigation Admin 480,034 Irrigation 0.00% ‐ ‐ 480,034 PRJ ‐ Irrigation Services 1,885,639 Irrigation 0.00% ‐ ‐ 1,885,639 PRJ ‐ La Grange 60,321 Irrigation 33.33% 20,105 18,038 42,283 PRJ ‐ Upper Main Canal 220,421 Irrigation 33.33% 73,466 65,914 154,507 PRJ ‐ Modesto Reservoir 187,436 Irrigation 33.33% 62,473 56,050 131,386 PRJ ‐ Pumps 781,832 Irrigation 0.00% ‐ ‐ 781,832 PRJ ‐ Laterals and Ditches 2,542,798 Irrigation 0.00% ‐ ‐ 2,542,798 PRJ ‐ Gunite 973,531 Irrigation 0.00% ‐ ‐ 973,531 PRJ ‐ Irrigation Pipelines 162,095 Irrigation 0.00% ‐ ‐ 162,095 PRJ ‐ Structures 205,431 Irrigation 0.00% ‐ ‐ 205,431
DRAFT

MID Allocation ReportTable 42018 Operating Expenses
2018 Operating Expense Allocation Total Expenses Allocation Category DW A&G % DW A&G
Electric Expenses
Irrigation Expenses
PRJ ‐ Weed & Moss Control 1,121,285 Irrigation 0.00% ‐ ‐ 1,121,285 PRJ ‐ Landscaping 246,291 Irrigation 0.00% ‐ ‐ 246,291 OM ‐ WATER OPERATIONS DIVISION 13,049,254 ‐ ‐ ‐ District OM 113,798,849 0.00% ‐ ‐ ‐ PS ‐ Purchase Power 150,436,193 Electric ‐ 150,436,193 ‐ PRJ ‐ Generation Admin 563,898 Electric 0.00% ‐ 563,898 ‐ PRJ ‐ Don Pedro Generation O&M 1,150,000 Electric 0.00% ‐ 1,150,000 ‐ PRJ ‐ New Hogan O&M 88,393 Electric 0.00% ‐ 88,393 ‐ PRJ ‐ Stone Drop O&M 33,585 Electric 0.00% ‐ 33,585 ‐ PRJ ‐ McClure O&M 1,120,818 Electric 0.00% ‐ 1,120,818 ‐ PRJ ‐ Woodland Operations 4,516,162 Electric 0.00% ‐ 4,516,162 ‐ PRJ ‐ Woodland Maintenance 4,484,405 Electric 0.00% ‐ 4,484,405 ‐ PRJ ‐ Ripon O&M 1,959,200 Electric 0.00% ‐ 1,959,200 ‐ PS ‐ Generation Fuel 22,827,247 Electric ‐ 22,827,247 ‐ District Power Supply $187,179,902 0.00% ‐ ‐ ‐ Total Expense $300,978,752 $3,204,348 $283,355,349 $17,623,403
DRAFT

MID Allocation ReportTable 5Three Year Total Actual Other Revenue (2015‐2017)
Actual Revenue by Line of Service2 Percentage of Revenue by FunctionSum of 2015 ‐ 2017 Actual Other Revenue1 Grand Total Discretionary3 Irrigation All as A&G Electric Discretionary Irrigation All as A&G Electric3 920 ‐ Customer Services Fees Rev $5,009,148 $0 $0 $0 $5,009,148 0.0% 0.0% 0.0% 100.0%3 921 ‐ Don Pedro Rec Agency Revenue 1,161,617 ‐ 1,161,617 ‐ ‐ 0.0% 100.0% 0.0% 0.0%3 922 ‐ DW Admin Fees Revenue 6,375,084 ‐ ‐ 6,375,084 ‐ 0.0% 0.0% 100.0% 0.0%3 923 ‐ Facilities Charge 1,714,238 ‐ ‐ ‐ 1,714,238 0.0% 0.0% 0.0% 100.0%3 924 ‐ Fiber Optic Revenue 518,400 518,400 ‐ ‐ ‐ 100.0% 0.0% 0.0% 0.0%3 926 ‐ Gain or Loss on Sale of Assets 268,662 ‐ 229,645 118,152 (79,135) 0.0% 85.5% 44.0% ‐29.5%3 927 ‐ Interest Income 14,154,629 7,156,076 5,643 6,992,910 50.6% 0.0% 0.0% 49.4%3 928 ‐ Late Penalties 6,082,911 6,082,911 ‐ ‐ ‐ 100.0% 0.0% 0.0% 0.0%3 929 ‐ Misc. Cost Recovery 108,053 ‐ ‐ 108,053 ‐ 0.0% 0.0% 100.0% 0.0%3 930 ‐ Misc. Operating Income 3,961,957 ‐ 8,150 862,944 3,090,864 0.0% 0.2% 21.8% 78.0%3 931 ‐ Other Entities Admin Fees Revenue 2,321,926 ‐ ‐ 2,321,926 ‐ 0.0% 0.0% 100.0% 0.0%3 932 ‐ Rental of District Property 2,778,465 2,778,465 ‐ ‐ ‐ 100.0% 0.0% 0.0% 0.0%3 933 ‐ Retirement Fund Revenue 2,621,105 ‐ ‐ 2,621,105 ‐ 0.0% 0.0% 100.0% 0.0%3 934 ‐ Revenue‐Aid to Construction 9,233,482 ‐ ‐ ‐ 9,233,482 0.0% 0.0% 0.0% 100.0%3 935 ‐ Warehouse Sales 374,454 374,454 ‐ ‐ ‐ 100.0% 0.0% 0.0% 0.0%3 936 ‐ WBO Income $8,918,655 $0 $135,138 $63,081 $8,720,437 0.0% 1.5% 0.7% 97.8%1‐ Other revenue is a budget category designated by MID 2‐ MID records actual Other Revenues by line of service3‐ Other revenue designated digressionary are based on consulting team recommendations not the MID accounting system
DRAFT
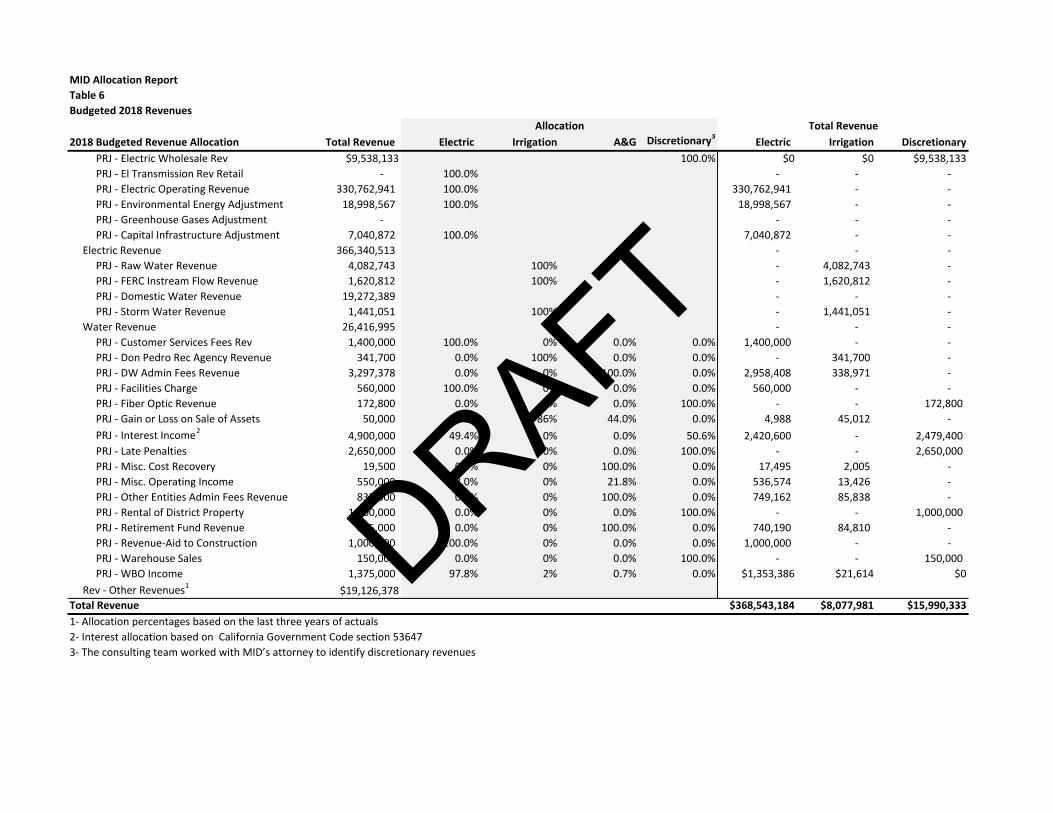
MID Allocation ReportTable 6Budgeted 2018 Revenues
Total Revenue2018 Budgeted Revenue Allocation Total Revenue Electric Irrigation A&G Discretionary3 Electric Irrigation Discretionary PRJ ‐ Electric Wholesale Rev $9,538,133 100.0% $0 $0 $9,538,133 PRJ ‐ El Transmission Rev Retail ‐ 100.0% ‐ ‐ ‐ PRJ ‐ Electric Operating Revenue 330,762,941 100.0% 330,762,941 ‐ ‐ PRJ ‐ Environmental Energy Adjustment 18,998,567 100.0% 18,998,567 ‐ ‐ PRJ ‐ Greenhouse Gases Adjustment ‐ ‐ ‐ ‐ PRJ ‐ Capital Infrastructure Adjustment 7,040,872 100.0% 7,040,872 ‐ ‐ Electric Revenue 366,340,513 ‐ ‐ ‐ PRJ ‐ Raw Water Revenue 4,082,743 100% ‐ 4,082,743 ‐ PRJ ‐ FERC Instream Flow Revenue 1,620,812 100% ‐ 1,620,812 ‐ PRJ ‐ Domestic Water Revenue 19,272,389 ‐ ‐ ‐ PRJ ‐ Storm Water Revenue 1,441,051 100% ‐ 1,441,051 ‐ Water Revenue 26,416,995 ‐ ‐ ‐ PRJ ‐ Customer Services Fees Rev 1,400,000 100.0% 0% 0.0% 0.0% 1,400,000 ‐ ‐ PRJ ‐ Don Pedro Rec Agency Revenue 341,700 0.0% 100% 0.0% 0.0% ‐ 341,700 ‐ PRJ ‐ DW Admin Fees Revenue 3,297,378 0.0% 0% 100.0% 0.0% 2,958,408 338,971 ‐ PRJ ‐ Facilities Charge 560,000 100.0% 0% 0.0% 0.0% 560,000 ‐ ‐ PRJ ‐ Fiber Optic Revenue 172,800 0.0% 0% 0.0% 100.0% ‐ ‐ 172,800 PRJ ‐ Gain or Loss on Sale of Assets 50,000 ‐29.5% 86% 44.0% 0.0% 4,988 45,012 ‐ PRJ ‐ Interest Income2 4,900,000 49.4% 0% 0.0% 50.6% 2,420,600 ‐ 2,479,400 PRJ ‐ Late Penalties 2,650,000 0.0% 0% 0.0% 100.0% ‐ ‐ 2,650,000 PRJ ‐ Misc. Cost Recovery 19,500 0.0% 0% 100.0% 0.0% 17,495 2,005 ‐ PRJ ‐ Misc. Operating Income 550,000 78.0% 0% 21.8% 0.0% 536,574 13,426 ‐ PRJ ‐ Other Entities Admin Fees Revenue 835,000 0.0% 0% 100.0% 0.0% 749,162 85,838 ‐ PRJ ‐ Rental of District Property 1,000,000 0.0% 0% 0.0% 100.0% ‐ ‐ 1,000,000 PRJ ‐ Retirement Fund Revenue 825,000 0.0% 0% 100.0% 0.0% 740,190 84,810 ‐ PRJ ‐ Revenue‐Aid to Construction 1,000,000 100.0% 0% 0.0% 0.0% 1,000,000 ‐ ‐ PRJ ‐ Warehouse Sales 150,000 0.0% 0% 0.0% 100.0% ‐ ‐ 150,000 PRJ ‐ WBO Income 1,375,000 97.8% 2% 0.7% 0.0% $1,353,386 $21,614 $0 Rev ‐ Other Revenues1 $19,126,378Total Revenue $368,543,184 $8,077,981 $15,990,3331‐ Allocation percentages based on the last three years of actuals2‐ Interest allocation based on California Government Code section 536473‐ The consulting team worked with MID’s attorney to identify discretionary revenues
Allocation
DRAFT

MID Allocation ReportTable 72018 Net Revenues
Projected Net Revenue
Electric Fund
Irrigation Fund
Domestic Water
Discretionary Fund
2018 Budget $ Millions $ Millions $ Millions $ Millions
Source of FundsRate Revenue $356.8 $4.1Other RevenueDirect1 $7.1 $10.2 $19.3A&G $4.6 $0.5 $3.3Discretionary $9.0 $6.5 $16.0
Total Source of Funds $377.5 $21.3 $22.6 $16.0
Use of FundsO&M1 $249.1 $12.9 $8.7A&G $41.0 $4.7 $3.3Capital $6.5 $3.7 $10.6Debt Service $94.6Discretionary Transfer $15.5
Total Use of Funds $391.2 $21.3 $22.6 $15.5
Net (Rev ‐ Exp) ‐$13.7 $0.0 $0.0 $0.51‐ Includes Canal Right of Way and Don Pedro Hydro Electric ValueDRAFT

MID Allocation ReportTable 8Don Pedro Energy Value
Year
CAISO NP15
Energy Prices
Inflation Index
CAISO NP15 in 2018$ Drought Dry Average Wet Drought Dry Average Wet
2009 $33.21 1.00 $38.49 64,000 110,000 200,000 300,000 $2,463,388 $4,233,947 $7,698,086 $11,547,1292010 $35.79 1.01 $41.01 64,000 110,000 200,000 300,000 $2,624,605 $4,511,040 $8,201,892 $12,302,8372011 $29.97 1.03 $33.62 64,000 110,000 200,000 300,000 $2,151,534 $3,697,949 $6,723,543 $10,085,3152012 $28.32 1.05 $31.21 64,000 110,000 200,000 300,000 $1,997,672 $3,433,499 $6,242,725 $9,364,0882013 $40.60 1.07 $44.09 64,000 110,000 200,000 300,000 $2,821,657 $4,849,722 $8,817,677 $13,226,5152014 $46.70 1.09 $49.80 64,000 110,000 200,000 300,000 $3,187,113 $5,477,850 $9,959,727 $14,939,5902015 $32.45 1.10 $34.19 64,000 110,000 200,000 300,000 $2,188,427 $3,761,359 $6,838,835 $10,258,2532016 $28.80 1.11 $29.96 64,000 110,000 200,000 300,000 $1,917,548 $3,295,785 $5,992,337 $8,988,5062017 $33.07 1.13 $33.80 64,000 110,000 200,000 300,000 $2,163,443 $3,718,417 $6,760,758 $10,141,1372018 $37.36 1.16 $37.36 64,000 110,000 200,000 300,000 $2,391,280 $4,110,013 $7,472,750 $11,209,125
Don Pedro Generation (MWh) Don Pedro Energy Value ($)Energy Price
DRAFT

MID Allocation ReportTable 9Don Pedro Capacity Value
Year
Don Pedro Capacity
(MW)Inflation
Index
Historic RA prices ($ kW‐
Month)
LOW CASE Capacity Prices
($ kW‐Year) (Nominal $)
LOW CASE Capacity
Prices in 2018 $
LOW CASE Don Pedro Capacity
Value ($)
HIGH CASE Capacity Prices
($ kW‐Year) (Nominal $)
HIGH CASE Capacity Prices
($ kW‐Year) (2018 $)
HIGH CASE Don Pedro Capacity
Value ($)
2009 62 1.00 1.97 $23.64 27.40 $1,698,766 $73.65 $85.36 $5,292,2292010 62 1.01 1.97 $23.64 27.09 $1,679,340 $74.50 $85.36 $5,292,2292011 62 1.03 2.00 $24.00 26.92 $1,669,310 $76.09 $85.36 $5,292,2292012 62 1.05 2.74 $32.88 36.23 $2,246,520 $77.46 $85.36 $5,292,2292013 62 1.07 2.66 $31.92 34.66 $2,148,937 $78.61 $85.36 $5,292,2292014 62 1.09 2.66 $31.92 34.04 $2,110,290 $80.05 $85.36 $5,292,2292015 62 1.10 2.45 $29.40 30.98 $1,920,634 $81.01 $85.36 $5,292,2292016 62 1.11 2.32 $27.84 28.96 $1,795,539 $82.06 $85.36 $5,292,2292017 62 1.13 2.20 $26.40 26.99 $1,673,235 $83.50 $85.36 $5,292,2292018 62 1.16 30.36 $1,882,508 $85.36 $85.36 $5,292,229
Low Case: Cost of capacity from an existing plant
High Case: Cost of capacity from a new POU‐built plant
DRAFT

MID Allocation ReportTable 10Don Pedro Cost Paid by Electric
Year Don Pedro A&G1Don Pedro
Generation2 Capital3
DP FERC Relicensing
Actual4 Total2009 $253,493 $1,504,828 $6,996 $0 $1,765,3172010 $6,470 $1,318,862 $12,179 $37,245 $1,374,7572011 $805 $1,182,151 $22,921 $142,784 $1,348,6622012 $5,558 $1,212,171 $31,837 $256,502 $1,506,0692013 $10,892 $1,367,233 $63,586 $375,660 $1,817,3712014 $7,041 $1,242,443 $153,744 $496,140 $1,899,3692015 $1,092 $1,044,636 $293,004 $589,311 $1,928,0432016 $0 $1,168,096 $419,437 $729,901 $2,317,4352017 $23,578 $1,150,000 $592,666 $835,553 $2,601,7972018 $224,325 $1,150,000 $714,650 $934,718 $3,023,693
1‐ Consists of Electric portion PRJ ‐ MID Water Rights in 2018 dollars2‐ Consists of Electric portion PRJ ‐ Don Pedro Generation O&M in 2018 dollars
4‐ Assumes FERC relicensing costs have been financed at 4.5% for 30 years
3‐ Assumes Don Pedro capital expenses since the FERC relicensing process have been financed at 4.5% for 30 years DRAFT

MID Allocation ReportTable 11Incremental Don Pedro Hydro Value
Flow EstimateGeneration
Amount Energy ValueCapacity
ValueTotal Hydro
Value
Don Pedro Cost Paid by
ElectricIncremental Hydro
ValueMWH $ $ $ $ $
Drought Year 64,000 $2,184,682 $1,882,508 $4,067,190 $3,023,693 $1,043,496Dry Year 110,000 $3,754,922 $1,882,508 $5,637,430 $3,023,693 $2,613,737
Average Year 200,000 $7,472,750 $1,882,508 $9,355,258 $3,023,693 $6,331,565Wet Year 300,000 $10,240,697 $1,882,508 $12,123,205 $3,023,693 $9,099,511
DRAFT

MID Allocation ReportTable 12Canal Right‐of‐Way Value
T&D Line Voltage Level1
T&D Distance (Miles)
Percent of Total T&D Miles
Right‐of‐Way Width (Feet)
12 kV 984.5 78.3% 3017 kV 29.9 2.4% 3021 kV 1.8 0.1% 3069 kV 203.9 16.2% 140115 kV 37.6 3.0% 140
1,257.8Weighted Average Right‐of‐Way Width 51.1
1‐ 230 kV lines are not located on canals
DRAFT

MID Allocation ReportTable 13Canal Right‐of‐Way Value
Right‐of‐Way Value AmountPoles on canals 2,580Typical Span Between Poles (Linear Feet) 300Right‐of‐Way (Linear Feet) 774,000Right‐of‐Way (Miles) 147Average Width of Right‐of‐Way (Feet) 51Right‐of‐Way (Square Feet) 39,566,912Square Feet per Acre 43,560Right‐of‐Way (Acres) 9082018 BLM Rental Zone 9 Rate per Acre $456.552018 Right‐of‐Way Value $414,699
DRAFT
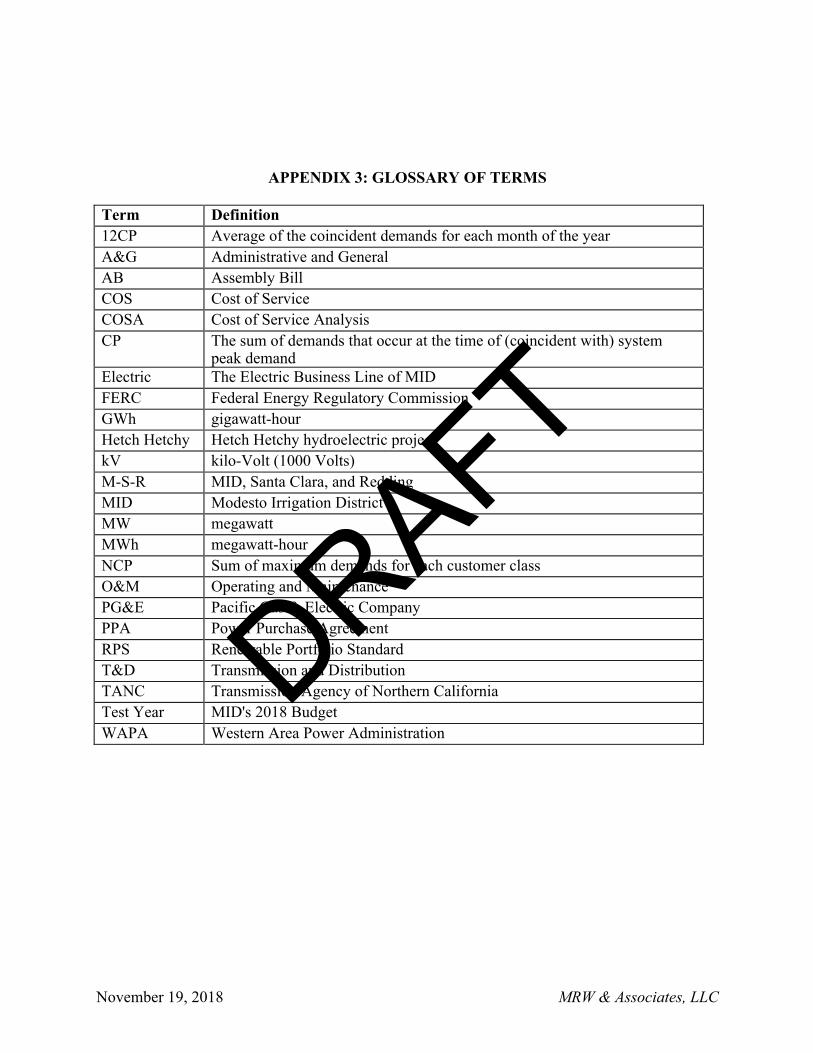
November 19, 2018 MRW & Associates, LLC
APPENDIX 3: GLOSSARY OF TERMS
Term Definition 12CP Average of the coincident demands for each month of the year A&G Administrative and General AB Assembly Bill COS Cost of Service COSA Cost of Service Analysis CP The sum of demands that occur at the time of (coincident with) system
peak demand Electric The Electric Business Line of MID FERC Federal Energy Regulatory Commission GWh gigawatt-hour Hetch Hetchy Hetch Hetchy hydroelectric project kV kilo-Volt (1000 Volts) M-S-R MID, Santa Clara, and Redding MID Modesto Irrigation District MW megawatt MWh megawatt-hour NCP Sum of maximum demands for each customer class O&M Operating and Maintenance PG&E Pacific Gas & Electric Company PPA Power Purchase Agreement RPS Renewable Portfolio Standard T&D Transmission and Distribution TANC Transmission Agency of Northern California Test Year MID's 2018 Budget WAPA Western Area Power Administration
DRAFT