Cost of capital - India Survey 2017 - EY - United...
16
Cost of capital - India survey 2017
Transcript of Cost of capital - India Survey 2017 - EY - United...

Cost of capital - India survey2017
2 | India cost of capital survey
3India cost of capital survey |
ContentsFindings
1. Cost of equity in India 06
2. Basis of estimating cost of equity 08
3. Otherdiscountedcashflow(DCF)parameters 10
4. Cost of capital in an international context 12
5. Start-ups 13
About the survey 14
4 | India cost of capital survey
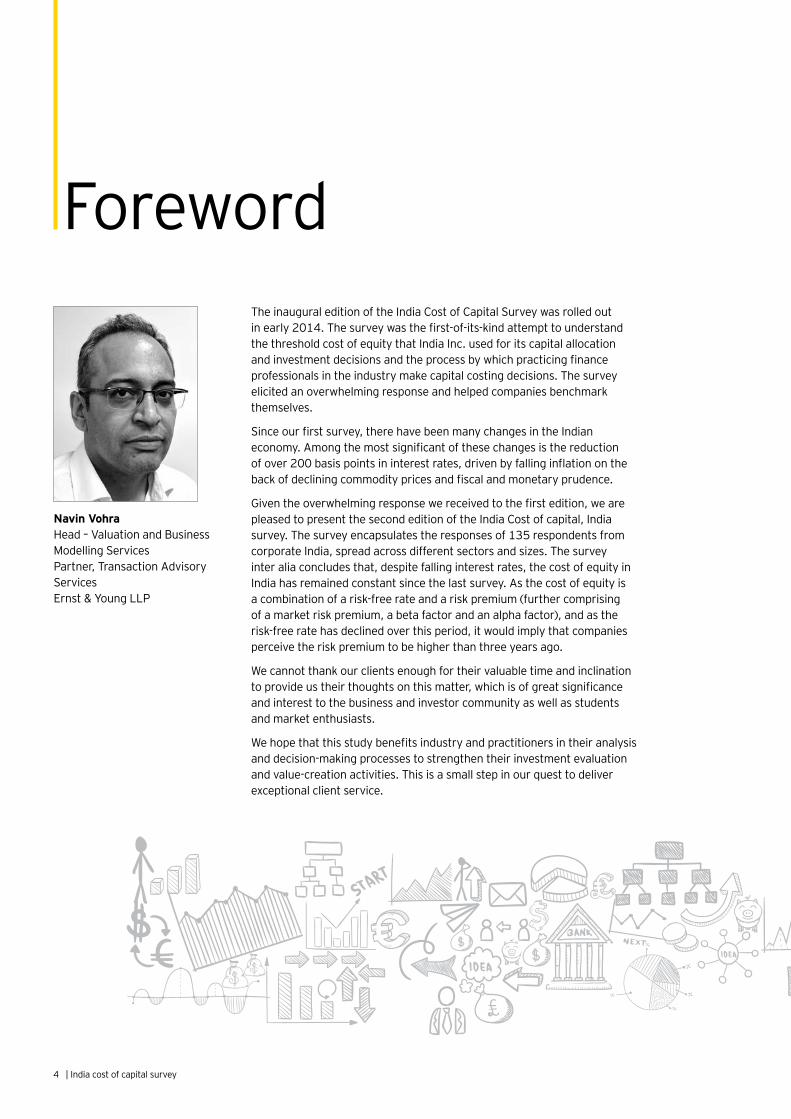
TheinauguraleditionoftheIndiaCostofCapitalSurveywasrolledoutinearly2014.Thesurveywasthefirst-of-its-kindattempttounderstandthe threshold cost of equity that India Inc. used for its capital allocation andinvestmentdecisionsandtheprocessbywhichpracticingfinanceprofessionalsintheindustrymakecapitalcostingdecisions.Thesurveyelicitedanoverwhelmingresponseandhelpedcompaniesbenchmarkthemselves.
Sinceourfirstsurvey,therehavebeenmanychangesintheIndianeconomy.Amongthemostsignificantofthesechangesisthereductionofover200basispointsininterestrates,drivenbyfallinginflationonthebackofdecliningcommoditypricesandfiscalandmonetaryprudence.
Giventheoverwhelmingresponsewereceivedtothefirstedition,wearepleasedtopresentthesecondeditionoftheIndiaCostofcapital,Indiasurvey. The survey encapsulates the responses of 135 respondents from corporateIndia,spreadacrossdifferentsectorsandsizes.Thesurveyinteraliaconcludesthat,despitefallinginterestrates,thecostofequityinIndia has remained constant since the last survey. As the cost of equity is acombinationofarisk-freerateandariskpremium(furthercomprisingofamarketriskpremium,abetafactorandanalphafactor),andastherisk-freeratehasdeclinedoverthisperiod,itwouldimplythatcompaniesperceivetheriskpremiumtobehigherthanthreeyearsago.
Wecannotthankourclientsenoughfortheirvaluabletimeandinclinationtoprovideustheirthoughtsonthismatter,whichisofgreatsignificanceandinteresttothebusinessandinvestorcommunityaswellasstudentsandmarketenthusiasts.
Wehopethatthisstudybenefitsindustryandpractitionersintheiranalysisanddecision-makingprocessestostrengthentheirinvestmentevaluationand value-creation activities. This is a small step in our quest to deliver exceptional client service.
Foreword
Navin VohraHead – Valuation and Business Modelling ServicesPartner,TransactionAdvisoryServicesErnst & Young LLP
5India cost of capital survey |
TheIndiaCostofcapital,Indiasurvey,2017,aimstounderstandthecostofcapitalthatcompaniesuseforcapitalallocationandstrategicdecision-making.Italsoattemptstofindouthowviewshavechangesoverthelastthreeyearsandwhatcompaniesaredoingdifferentlytosharpentheirestimationofcostofcapitalandinvestmentevaluationprocessesvis-à-visourfindingsinthe 2014 edition of the survey.
Thisstudyisbasedontheviewsof135respondents,comprisedprimarilyoffinanceprofessionalsfromamixofIndianandmultinationalaswellaslistedandunlistedcompanies,collectedduringtheperiodofNovember2016andFebruary2017.
Some of the key findings of the survey are enlisted below:
• India’s average cost of equity is around 15%. This has remainedconstantsinceourlastcostofcapitalsurvey,overaperiodinwhichtheinterestrateshavedeclinedby200basis points.
• Realestateandengineering,procurementandconstruction(EPC)commandthehighestcostofequity,whereasFMCGandcapitalgoodsareatthelowest.
• TheresultsconfirmthattheDiscountedCashFlow(DCF)methodologyisoneofthekeyapproachesforvaluationanalysisusedbycorporates,usuallyincombinationwithothermethodssuchaspeercompanymultiplesortransaction multiples.
• ItwasobservedthatmostcompaniesthatusetheDCFapproachtypicallyconsiderahorizonof5years.
• Thesurveyemphasizesourlearningfromtheprevioussurveythatthe“ruleofthumb”oranorganizationalhurdlerate is preferred over objective models such as the Capital AssetPricingModel(CAPM)toestimatethecostofcapital.
Executive summary
• Thequantumofsubjectivecompany-specificadjustmentsmade to arrive at the cost of capital has gone up since 2014. Thetoptwofactorsnecessitatingsuchadjustmentsassuggestedbyrespondentsarecompany/project-specificriskfactorsandthesizeofthecompany.
• Mostrespondentsacknowledgedthatanadditionalriskpremiumisjustifiablewhenconsideringstrategicinvestmentsinstart-ups,andprovidedtheirviewsonthequantum.Thequantumofpremiumvariedacrossindustries,withmostsectorscappingitatamaximumof10%.
• InusingtheDCFmethodfornon-finiteprojects,anotherkeyareaapartfromcostofcapitalistheterminalvalue.RespondentswereequallydividedbetweenusingtheGordonGrowthModelvs.anExitMultipletoarriveatterminalvalue,andthepopularlong-termstablegrowthrateusedwas~4.5%.
Thedetailedfindingshavebeenelaboratedinthefollowingpages. Happy reading!
6 | India cost of capital survey
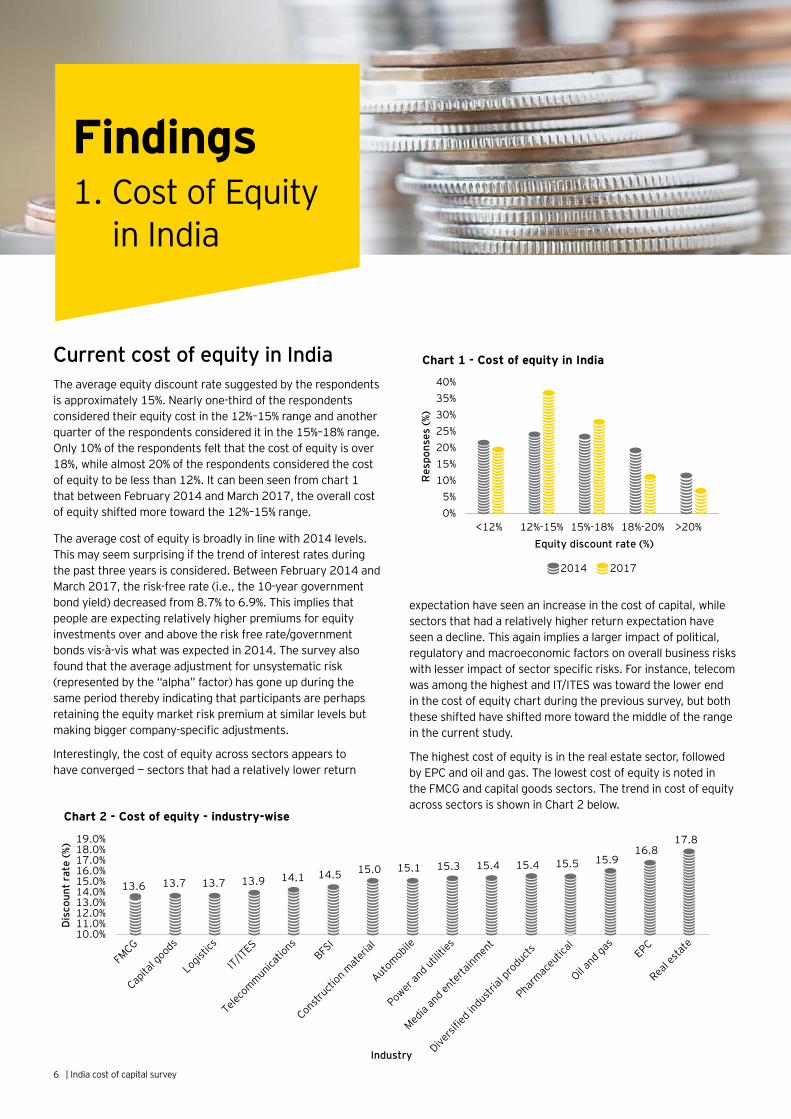
Current cost of equity in India The average equity discount rate suggested by the respondents isapproximately15%.Nearlyone-thirdoftherespondentsconsidered their equity cost in the 12%–15% range and another quarter of the respondents considered it in the 15%–18% range. Only 10% of the respondents felt that the cost of equity is over 18%,whilealmost20%oftherespondentsconsideredthecostof equity to be less than 12%. It can been seen from chart 1 thatbetweenFebruary2014andMarch2017,theoverallcostofequityshiftedmoretowardthe12%–15%range.
Theaveragecostofequityisbroadlyinlinewith2014levels.This may seem surprising if the trend of interest rates during thepastthreeyearsisconsidered.BetweenFebruary2014andMarch2017,therisk-freerate(i.e.,the10-yeargovernmentbondyield)decreasedfrom8.7%to6.9%.Thisimpliesthatpeople are expecting relatively higher premiums for equity investmentsoverandabovetheriskfreerate/governmentbondsvis-à-viswhatwasexpectedin2014.Thesurveyalsofoundthattheaverageadjustmentforunsystematicrisk(representedbythe“alpha”factor)hasgoneupduringthesame period thereby indicating that participants are perhaps retainingtheequitymarketriskpremiumatsimilarlevelsbutmakingbiggercompany-specificadjustments.
Interestingly,thecostofequityacrosssectorsappearstohaveconverged—sectorsthathadarelativelylowerreturn
Findings 1. Cost of Equity
in India
0%5%
10%15%20%25%30%35%40%
<12% 12%-15% 15%-18% 18%-20% >20%
Res
pons
es (%
)
Equity discount rate (%)
2014 2017
Chart 1 - Cost of equity in India
expectationhaveseenanincreaseinthecostofcapital,whilesectors that had a relatively higher return expectation have seenadecline.Thisagainimpliesalargerimpactofpolitical,regulatoryandmacroeconomicfactorsonoverallbusinessriskswithlesserimpactofsectorspecificrisks.Forinstance,telecomwasamongthehighestandIT/ITESwastowardthelowerendinthecostofequitychartduringtheprevioussurvey,butboththeseshiftedhaveshiftedmoretowardthemiddleoftherangein the current study.
Thehighestcostofequityisintherealestatesector,followedbyEPCandoilandgas.ThelowestcostofequityisnotedintheFMCGandcapitalgoodssectors.ThetrendincostofequityacrosssectorsisshowninChart2below.
13.6 13.7 13.7 13.9 14.1 14.5 15.0 15.1 15.3 15.4 15.4 15.5 15.916.8
17.8
10.0%11.0%12.0%13.0%14.0%15.0%16.0%17.0%18.0%19.0%
Dis
coun
t ra
te (%
)
Industry
Chart 2 - Cost of equity - industry-wise
Diversi
fied in
dustr
ial pr
oducts
7India cost of capital survey |
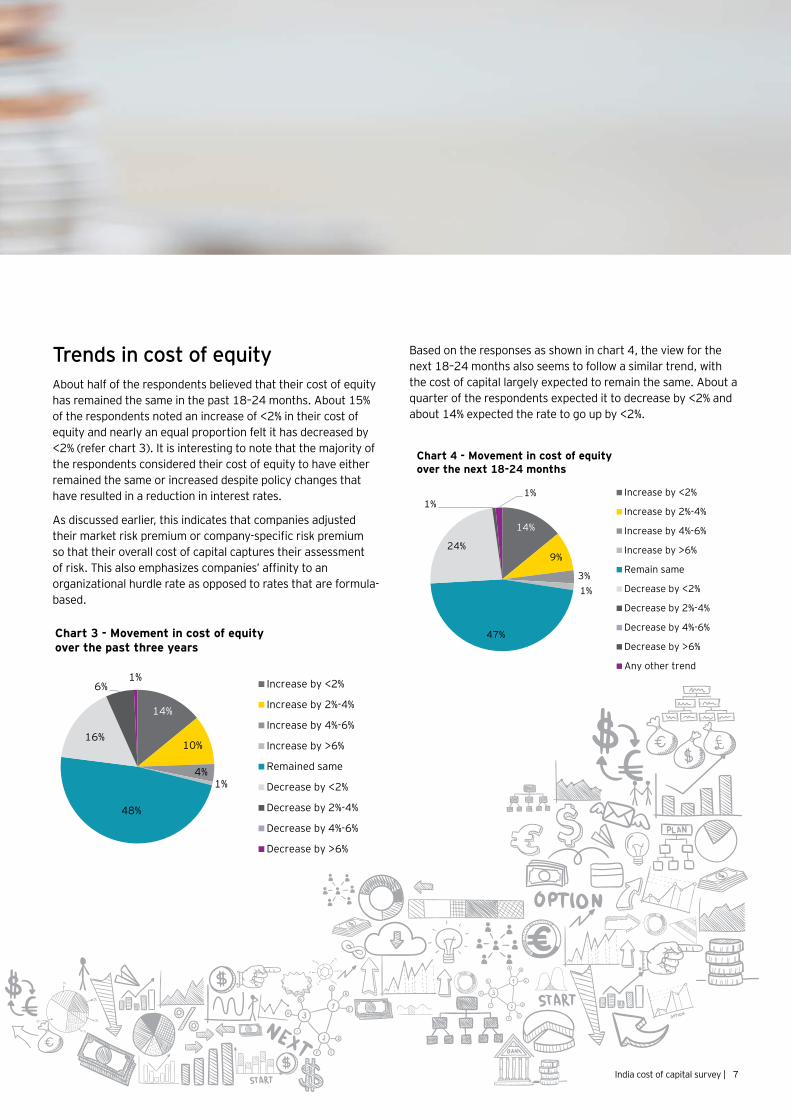
Trends in cost of equityAbout half of the respondents believed that their cost of equity has remained the same in the past 18–24 months. About 15% of the respondents noted an increase of <2% in their cost of equity and nearly an equal proportion felt it has decreased by <2%(referchart3).Itisinterestingtonotethatthemajorityofthe respondents considered their cost of equity to have either remained the same or increased despite policy changes that have resulted in a reduction in interest rates.
Asdiscussedearlier,thisindicatesthatcompaniesadjustedtheirmarketriskpremiumorcompany-specificriskpremiumso that their overall cost of capital captures their assessment ofrisk.Thisalsoemphasizescompanies’affinitytoanorganizationalhurdlerateasopposedtoratesthatareformula-based.
Basedontheresponsesasshowninchart4,theviewforthenext18–24monthsalsoseemstofollowasimilartrend,withthe cost of capital largely expected to remain the same. About a quarter of the respondents expected it to decrease by <2% and about 14% expected the rate to go up by <2%.
14%
10%
4%1%
48%
16%
6%1% Increase by <2%
Increase by 2%-4%
Increase by 4%-6%
Increase by >6%
Remained same
Decrease by <2%
Decrease by 2%-4%
Decrease by 4%-6%
Decrease by >6%
Chart 3 - Movement in cost of equity over the past three years
14%
9%
3%1%
47%
24%
1%1% Increase by <2%
Increase by 2%-4%
Increase by 4%-6%
Increase by >6%
Remain same
Decrease by <2%
Decrease by 2%-4%
Decrease by 4%-6%
Decrease by >6%
Any other trend
Chart 4 - Movement in cost of equity over the next 18-24 months

8 | India cost of capital survey
2. Basis of estimating cost of equity
How does India Inc. decide its cost of capital?Thesurveyestablishesthetrendthatemergedinthefirsteditionofthesurvey—thatthemajorityofcompanies(around42%)continuetopreferusinganorganization-specifichurdlerateastheircostofcapital(Referchart5).Theproportionof respondents that use the CAPM approach has increased from20%intheearliereditiontoabout27%now.Asurprisingrevelationistheuseofbanklendingrate,withnecessaryadjustments,asaguidancetodeterminingthecostofcapitalbyalmost 20% of the respondents .
27%
43%
19%
9%
2% CAPM
Organization specific hurdlerate/ IRR/ Thumb-rule rate
Bank lending rate (withadjustments, if any)
Built-in discount rate (startingwith a base rate adjusted forvarious discounts/premiums)
Other methodologies
Chart 5 - Methods for arriving at discount rate
18
129
23
15 15
42 2
0%
5%
10%
15%
20%
25%
Size of company/ project
Stake under considerationDistressed situationCompany/project specific risk factorsConservativeness / Aggressiveness of projections
Stage of development / gestation period
*Multiple answer options could be selected
All of the above
None of the above
Any other factor
Chart 6 - Factors (alpha) responsible for adjustmentin discount rate
Res
pons
es*(
%)
Alpha factors
What company-specific factors are used to adjust cost of equity?AspertheCAPMtheoryofdiscountrateestimation,therisksthatcompaniesarefacedwithcanbroadlybeputintotwobuckets—systematicrisksandunsystematicrisks.Systematicrisksofacompanyaredependentontheriskoftheoverallmarket/industryandcanbeeliminatedbydiversificationofinvestment.However,unsystematicrisksarespecifictothecompany and not based on factors that affect the overall marketoreventheindustry.Therefore,unsystematicriskscannotbeeliminatedbydiversification.
Whilesystematicrisksarerepresentedbybeta,whichispartofdiscountrateestimationasperCAPM,unsystematicrisksare represented by alpha. There are various factors that could necessitate an alpha adjustment to the cost of capital. The respondentsidentifiedcompany-specificrisksrepresentedbyknownoranticipatedconditionsatthetimeofevaluationasthebiggestfactor,followedbythesizeofthecompany (Referchart6).
Someoftherespondentsindicatedthatforexvolatility,marketsize,growthopportunitylinkedtomarketgrowthandliquidityaresomeotherfactorsthatareadjustedwhiledeterminingthecost of equity.
9India cost of capital survey |
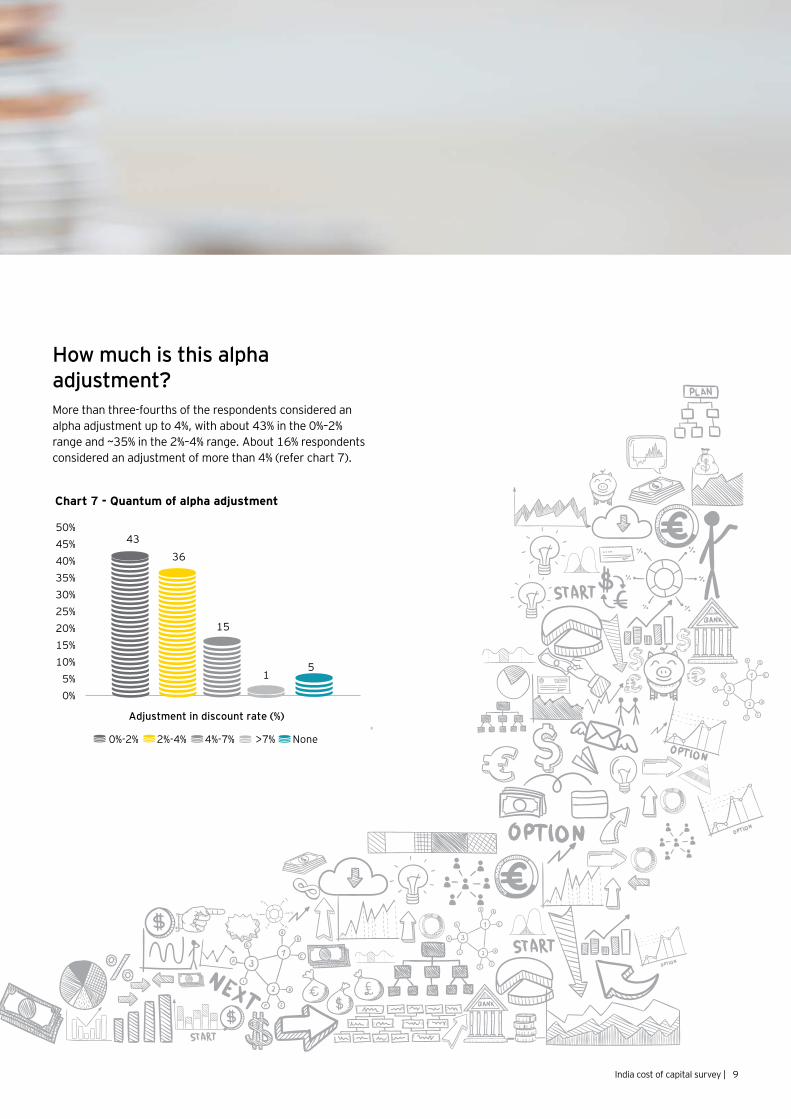
How much is this alpha adjustment? More than three-fourths of the respondents considered an alphaadjustmentupto4%,withabout43%inthe0%–2%rangeand~35%inthe2%–4%range.About16%respondentsconsideredanadjustmentofmorethan4%(referchart7).
43
36
15
15
0%5%
10%15%20%25%30%35%40%45%50%
0%-2% 2%-4% 4%-7% >7% None
Chart 7 - Quantum of alpha adjustment
Adjustment in discount rate (%)
10| India cost of capital survey
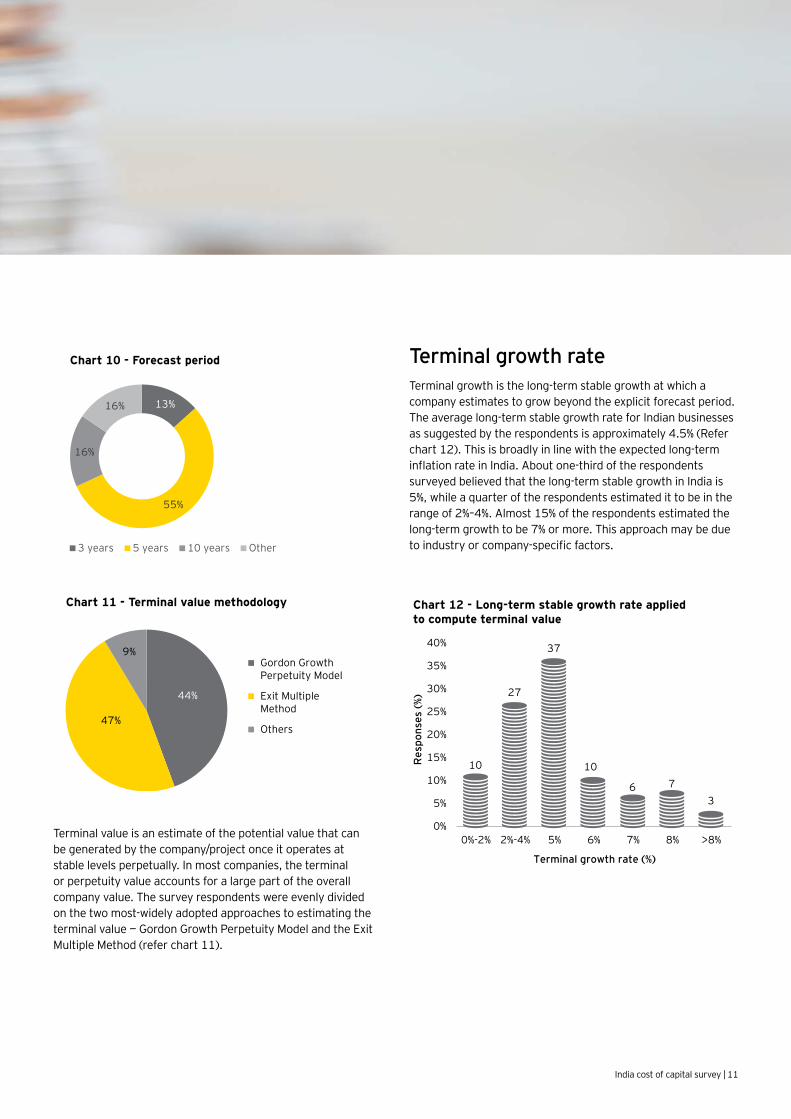
Typical forecast period and terminal value ValuationusingtheDCFapproachinvolvestwocomponents—thevalueofcashflowsfortheexplicitforecastperiodandtheterminalvalueofcashflows.
Theexplicitperiodistheperiodforwhichreasonablydetailedforecasts can be prepared. More than half of the respondents showedaclearpreferenceforconsideringanexplicitforecastperiodoffiveyearsfortheDCFanalysisbeforeapplyingtheterminalvalue(referchart10).Theremainingresponsesareevenlysplitbetween3years,10yearsand“others.”Companiesthatmakeupthe“others’categorywouldprimarilybethosethatevaluatefinite-livedprojectsandusedtheactualremainingprojectlifeastheforecasthorizon.
Preferenceforafiveyearforecastperiodbythemajorityofthe respondents indicates that they typically consider this to be theperiodforwhichreliableestimatescanbepreparedwithareasonable basis.
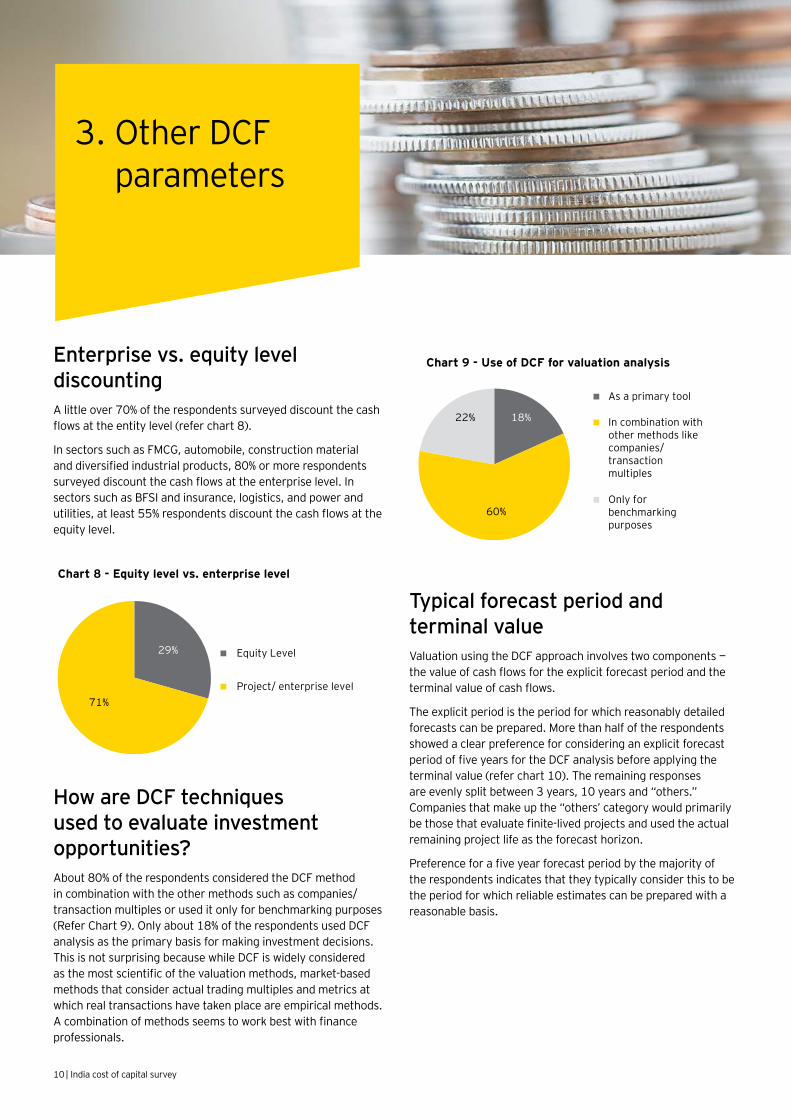
Enterprise vs. equity level discountingAlittleover70%oftherespondentssurveyeddiscountthecashflowsattheentitylevel(referchart8).
InsectorssuchasFMCG,automobile,constructionmaterialanddiversifiedindustrialproducts,80%ormorerespondentssurveyeddiscountthecashflowsattheenterpriselevel.InsectorssuchasBFSIandinsurance,logistics,andpowerandutilities,atleast55%respondentsdiscountthecashflowsattheequity level.
How are DCF techniques used to evaluate investment opportunities?About80%oftherespondentsconsideredtheDCFmethodincombinationwiththeothermethodssuchascompanies/transactionmultiplesoruseditonlyforbenchmarkingpurposes(ReferChart9).Onlyabout18%oftherespondentsusedDCFanalysisastheprimarybasisformakinginvestmentdecisions.ThisisnotsurprisingbecausewhileDCFiswidelyconsideredasthemostscientificofthevaluationmethods,market-basedmethods that consider actual trading multiples and metrics at whichrealtransactionshavetakenplaceareempiricalmethods.Acombinationofmethodsseemstoworkbestwithfinanceprofessionals.
29%
71%
Equity Level
Project/ enterprise level
Chart 8 - Equity level vs. enterprise level
18%
60%
22%
As a primary tool
In combination withother methods likecompanies/transactionmultiples
Only forbenchmarkingpurposes
Chart 9 - Use of DCF for valuation analysis
3. OtherDCFparameters
11India cost of capital survey |
Terminal value is an estimate of the potential value that can be generated by the company/project once it operates at stablelevelsperpetually.Inmostcompanies,theterminalor perpetuity value accounts for a large part of the overall companyvalue.Thesurveyrespondentswereevenlydividedonthetwomost-widelyadoptedapproachestoestimatingtheterminalvalue—GordonGrowthPerpetuityModelandtheExitMultipleMethod(referchart11).
13%
55%
16%
16%
3 years 5 years 10 years Other
Chart 10 - Forecast period
44%
47%
9%Gordon GrowthPerpetuity Model
Exit MultipleMethod
Others
Chart 11 - Terminal value methodology
Terminal growth rateTerminalgrowthisthelong-termstablegrowthatwhichacompanyestimatestogrowbeyondtheexplicitforecastperiod.Theaveragelong-termstablegrowthrateforIndianbusinessesassuggestedbytherespondentsisapproximately4.5%(Referchart12).Thisisbroadlyinlinewiththeexpectedlong-terminflationrateinIndia.Aboutone-thirdoftherespondentssurveyedbelievedthatthelong-termstablegrowthinIndiais5%,whileaquarteroftherespondentsestimatedittobeintherange of 2%–4%. Almost 15% of the respondents estimated the long-termgrowthtobe7%ormore.Thisapproachmaybeduetoindustryorcompany-specificfactors.
27
10
37
10
6 73
0%
5%
10%
15%
20%
25%
30%
35%
40%
0%-2% 2%-4% 5% 6% 7% 8% >8%
Chart 12 - Long-term stable growth rate applied to compute terminal value
Res
pons
es (%
)
Terminal growth rate (%)
12| India cost of capital survey
4. Cost of capital in an international context
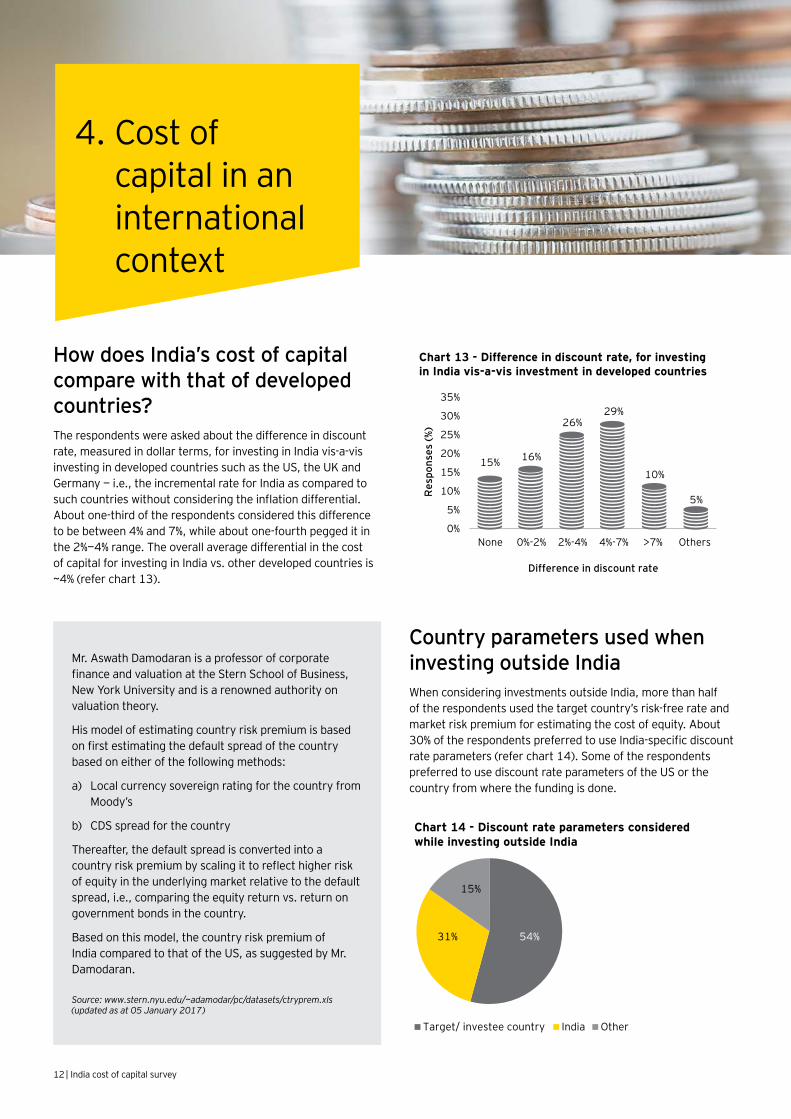
How does India’s cost of capital compare with that of developed countries? Therespondentswereaskedaboutthedifferenceindiscountrate,measuredindollarterms,forinvestinginIndiavis-a-visinvestingindevelopedcountriessuchastheUS,theUKandGermany—i.e.,theincrementalrateforIndiaascomparedtosuchcountrieswithoutconsideringtheinflationdifferential.About one-third of the respondents considered this difference tobebetween4%and7%,whileaboutone-fourthpeggeditinthe 2%—4% range. The overall average differential in the cost of capital for investing in India vs. other developed countries is ~4%(referchart13).
Country parameters used when investing outside IndiaWhenconsideringinvestmentsoutsideIndia,morethanhalfoftherespondentsusedthetargetcountry’srisk-freerateandmarketriskpremiumforestimatingthecostofequity.About30%oftherespondentspreferredtouseIndia-specificdiscountrateparameters(referchart14).Someoftherespondentspreferred to use discount rate parameters of the US or the countryfromwherethefundingisdone.
Mr.AswathDamodaranisaprofessorofcorporatefinanceandvaluationattheSternSchoolofBusiness,NewYorkUniversityandisarenownedauthorityonvaluation theory.
Hismodelofestimatingcountryriskpremiumisbasedonfirstestimatingthedefaultspreadofthecountrybasedoneitherofthefollowingmethods:
a) Local currency sovereign rating for the country from Moody’s
b) CDSspreadforthecountry
Thereafter,thedefaultspreadisconvertedintoacountryriskpremiumbyscalingittoreflecthigherriskofequityintheunderlyingmarketrelativetothedefaultspread,i.e.,comparingtheequityreturnvs.returnongovernment bonds in the country.
Basedonthismodel,thecountryriskpremiumofIndiacomparedtothatoftheUS,assuggestedbyMr.Damodaran.
Source: www.stern.nyu.edu/~adamodar/pc/datasets/ctryprem.xls (updated as at 05 January 2017)
15% 16%
26%29%
10%
5%
0%
5%
10%
15%
20%
25%
30%
35%
None 0%-2% 2%-4% 4%-7% >7% Others
Res
pons
es (%
)
Difference in discount rate
Chart 13 - Difference in discount rate, for investing in India vis-a-vis investment in developed countries
54%31%
15%
Target/ investee country India Other
Chart 14 - Discount rate parameters considered while investing outside India
13India cost of capital survey |
5. Start-ups
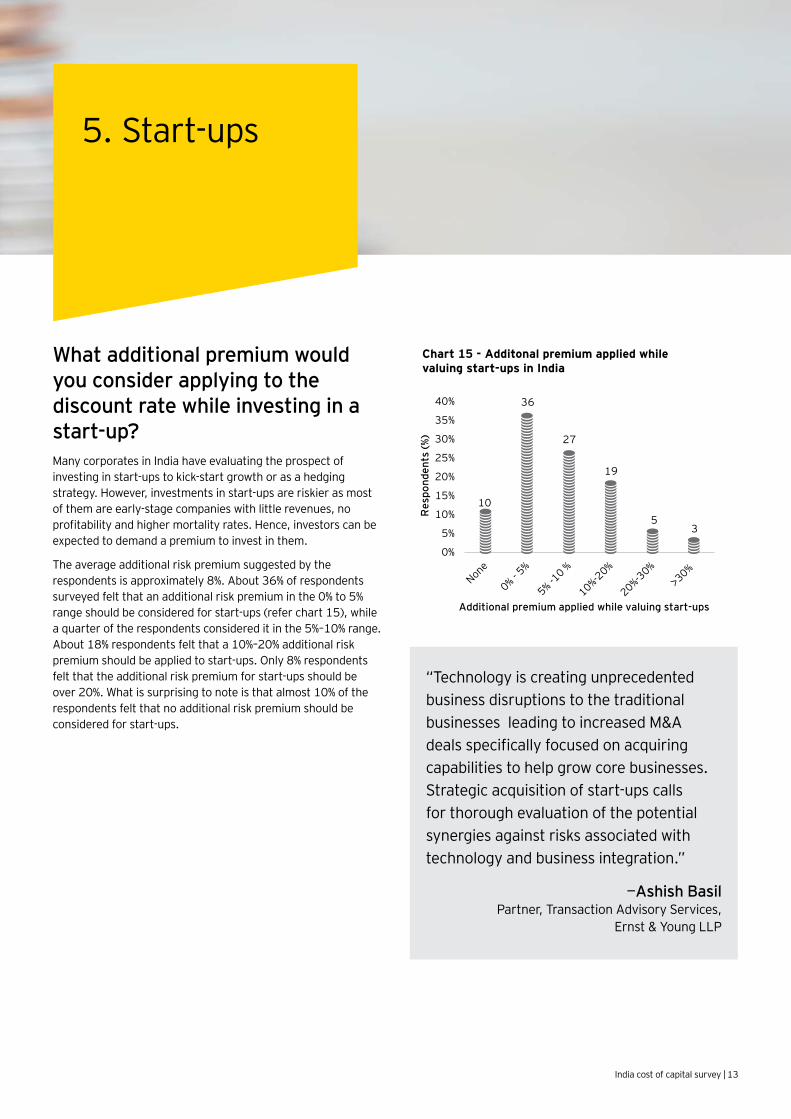
What additional premium would you consider applying to the discount rate while investing in a start-up?Many corporates in India have evaluating the prospect of investinginstart-upstokick-startgrowthorasahedgingstrategy.However,investmentsinstart-upsareriskierasmostofthemareearly-stagecompanieswithlittlerevenues,noprofitabilityandhighermortalityrates.Hence,investorscanbeexpected to demand a premium to invest in them.
Theaverageadditionalriskpremiumsuggestedbytherespondentsisapproximately8%.About36%ofrespondentssurveyedfeltthatanadditionalriskpremiuminthe0%to5%rangeshouldbeconsideredforstart-ups(referchart15),whilea quarter of the respondents considered it in the 5%–10% range. About18%respondentsfeltthata10%–20%additionalriskpremium should be applied to start-ups. Only 8% respondents feltthattheadditionalriskpremiumforstart-upsshouldbeover 20%. What is surprising to note is that almost 10% of the respondentsfeltthatnoadditionalriskpremiumshouldbeconsidered for start-ups.
“Technology is creating unprecedented business disruptions to the traditional businesses leading to increased M&A dealsspecificallyfocusedonacquiringcapabilitiestohelpgrowcorebusinesses.Strategic acquisition of start-ups calls for thorough evaluation of the potential synergiesagainstrisksassociatedwithtechnology and business integration.”
—Ashish Basil Partner,TransactionAdvisoryServices,
Ernst & Young LLP
Chart 15 - Additonal premium applied while valuing start-ups in India
10
36
27
19
53
0%
5%
10%
15%
20%
25%
30%
35%
40%
Res
pond
ents
(%)
Additional premium applied while valuing start-ups
14| India cost of capital survey
About the survey
ObjectiveThereareseveraltheoriesandextensivewrite-upsonhowcostofcapitalisgenerallycomputedaspertheDCFmethod.However,itisinterestingtofindoutifandhowthesetheoriesareactuallyappliedintherealworld.ThissurveywasundertakenwiththatprimaryobjectiveandalsotoseehowcostofcapitalestimationgetsimpactedbyIndia-specificfactors.
This survey is an exhaustive study on the prevailing industry practices of estimating cost of capital for valuing companies and/orprojectswhenmakingcrucialbusinessdecisionssuchasacquiring/divesting,conductinginternalrestructuringexercises,launchingnewprojectsandassessingprojectprogress.Thepurposewastoidentifythepracticalaspects/considerations that determine the cost of capital in India and to quantifysomeoftheseaspects.Further,thecurrentsurveyisafollow-uptothe2014studytoassesschanges,ifany,inthesemethodologies and industry practices over the last three years.
Profile of respondentsThe principal respondents belonged to functions such as finance,businessplanningandcorporatestrategyandmergersand acquisitions. They represented a mix of Indian enterprises andmultinationalcompanies,includinglistedcompaniesandprivate companies. We tried to contact the respondents from thepreviouseditionandalsoapproachednewrespondentsfortheirviews.
QuestionnaireThequestionswerepreparedwithachoiceofanswersinamultiple-choiceformat.Forquestionswheretheansweroptionswerenotcomprehensive,respondentswereprovidedwithacommentboxfortheirviews.
Mostofthequestionswereretainedfromthepreviouseditionofthesurvey.Wealsoaddedafewquestionsbasedoninput/feedbackreceivedfromtherespondentsoftheprevioussurveyandafewnewonestoprovideadditionalinsightsintothemind-setofdecision-makersatorganizationswhenestimatingtheircost of capital/equity. As an improvement over the 2014 edition ofthesurvey,weaddedsomeindustry-specificquestionsforsectorssuchasautomobiles,pharmaceuticals,realestateandtelecommunications.
Mode of surveyThequestionnairewassentouttotherespondentsinelectronicformatthroughasurveylink.
Intheelectronicformat,wecouldautomateselectionsfromdrop-downboxessothatonlyoneanswercouldbeselected(unlessmultiplechoiceswereconsciouslyallowed)andnoquestionisskipped.Hence,allthepercentagefiguresrepresentresponses to a particular question and a proportion of the overall respondents.
CoverageTheEYValuation&BusinessModelling(V&BM)teamreachedout to various companies across industries for this survey betweenNovember2016andFebruary2017.Wesentasurveylinktocollectinputsfrom135CFOsand/orseniormembersofCFOs’teamsacrosssectorssuchasautomotive,diversifiedindustrialproducts,bankingandfinancialservices,FMCG,EPC,IT/ITES,mediaandentertainment,logistics,oilandgas,pharmaceuticals,powerandutilities,realestateandtelecom.
15India cost of capital survey |
Ouroffices
Ahmedabad2ndfloor,ShivalikIshaanNearC.N.VidhyalayaAmbawadiAhmedabad - 380 015Tel: +917966083800Fax:+917966083900
Bengaluru6th,12th & 13thfloorUBCity,CanberraBlockNo.24VittalMallyaRoadBengaluru-560001Tel: +918040275000 +918067275000 +918022240696Fax:+918022106000
TowerC,3rdFloor, RMZInfinity,MunicipalNo.3, OldMadrasRoad,SurveyNo:1477/2&10,Benniganahalli,K.R.Puram,Bengaluru,Karnataka560016Tel: +918067275000Fax:+918022229914
Chandigarh1stFloor,SCO:166-167Sector9-C,MadhyaMargChandigarh-160009 Tel:+911723317800Fax:+911723317888
ChennaiTidelPark,6th&7thFloor ABlock(Module601,701-702)No.4,RajivGandhiSalai Taramani,Chennai-600113Tel: +914466548100 Fax:+914422540120
Delhi NCRGolfViewCorporateTowerBSector42,SectorRoadGurgaon - 122 002Tel: +911244644000Fax:+911244644050
3rd&6thFloor,Worldmark-1IGIAirportHospitalityDistrictAerocity,NewDelhi-110037Tel:+911166718000Fax+911166719999
4th & 5thFloor,PlotNo2B Tower2,Sector126 NOIDA-201304GautamBudhNagar,U.P.Tel: +911206717000Fax:+911206717171
HyderabadOvalOffice,18,iLabsCentreHitechCity,MadhapurHyderabad - 500 081Tel: +914067362000Fax:+914067362200
Jamshedpur1stFloor,ShantiniketanBuildingHoldingNo.1,SBShopAreaBistupur,Jamshedpur–831001Tel: +916576631000BSNL: +916572230441
Kochi9thFloor,ABADNucleusNH-49,MaraduPOKochi-682304Tel: +914843044000Fax:+914842705393
Kolkata22 Camac Street3rdFloor,Block‘C’Kolkata-700016Tel: +913366153400Fax:+913322817750
Mumbai14thFloor,TheRuby29SenapatiBapatMargDadar(W),Mumbai-400028Tel: +912261920000Fax:+912261921000
5thFloor,BlockB-2NirlonKnowledgeParkOff.WesternExpressHighwayGoregaon(E)Mumbai-400063Tel: +912261920000Fax:+912261923000
PuneC-401,4thfloorPanchshilTechParkYerwada (NearDonBoscoSchool)Pune-411006Tel: +912066036000Fax:+912066015900
About EYEY is a global leader in assurance, tax, transaction and advisory services. The insights and quality services we deliver help build trust and confidence in the capital markets and in economies the world over. We develop outstanding leaders who team to deliver on our promises to all of our stakeholders. In so doing, we play a critical role in building a better working world for our people, for our clients and for our communities.
EY refers to the global organization, and may refer to one or more, of the member firms of Ernst & Young Global Limited, each of which is a separate legal entity. Ernst & Young Global Limited, a UK company limited by guarantee, does not provide services to clients. For more information about our organization, please visit ey.com.
Ernst & Young LLP is one of the Indian client serving member firms of EYGM Limited. For more information about our organization, please visit www.ey.com/in.
Ernst & Young LLP is a Limited Liability Partnership, registered under the Limited Liability Partnership Act, 2008 in India, having its registered office at 22 Camac Street, 3rd Floor, Block C, Kolkata - 700016
© 2017 Ernst & Young LLP. Published in India. All Rights Reserved.
EYIN1704-039 ED None
This publication contains information in summary form and is therefore intended for general guidance only. It is not intended to be a substitute for detailed research or the exercise of professional judgment. Neither Ernst & Young LLP nor any other member of the global Ernst & Young organization can accept any responsibility for loss occasioned to any person acting or refraining from action as a result of any material in this publication. On any specific matter, reference should be made to the appropriate advisor.
VN
Ernst & Young LLPEY | Assurance | Tax | Transactions | Advisory
ey.com/in
@EY_India EY|LinkedIn EY India EY India careers
EY refers to the global organization, and/or one or more of the independent member firms of Ernst & Young Global Limited