Cost of Capital for Pharmaceutical, Biotechnology, and ... cost of capital handbook... · Cost of...
29
Cost of Capital for Pharmaceutical, Biotechnology, and Medical Device Firms Scott E. Harrington Alan B. Miller Professor Health Care Management The Wharton School University of Pennsylvania [email protected] http://scottharringtonphd.com DRAFT November 13, 2009 Prepared for The Handbook of the Economics of the Biopharmaceutical Industry Abstract This study provides new estimates of systematic risk and the cost of equity capital for the pharmaceutical, biotechnology, and medical device sectors using data for firms with publicly-traded stock on U.S. exchanges during 2001-2005 and 2006-2008. Two frameworks are employed for estimating firms’ risk and the cost of equity capital: (1) the capital asset pricing model, and (2) the Fama-French three-factor model. Evidence is provided of the relationship between risk, cost of equity, and the intensity of firms’ R&D expenditures. Controlling for firms’ principal sector (pharmaceutical, biotechnology, or device), R&D intensity, as measured by the ratio of R&D expense to total revenues, is positively related to market betas and thus the estimated cost of equity capital. Estimates of the Fama-French model imply a size-related risk premium in the cost of equity for small firms in each sector. Controlling for R&D intensity, average market betas differ significantly across sectors during the periods analyzed. Large biotech firms on average had large, negative, and significant book-to-market betas during 2001-2005, significantly lowering their estimated cost of equity capital, but the negative book-to-market betas and lower estimated cost of equity for large biotechs disappeared during 2006-2008.
Transcript of Cost of Capital for Pharmaceutical, Biotechnology, and ... cost of capital handbook... · Cost of...
Cost of Capital for Pharmaceutical, Biotechnology, and Medical Device Firms
Scott E. Harrington Alan B. Miller Professor Health Care Management
The Wharton School University of Pennsylvania
[email protected] http://scottharringtonphd.com
DRAFT
November 13, 2009
Prepared for The Handbook of the Economics of the Biopharmaceutical Industry
Abstract
This study provides new estimates of systematic risk and the cost of equity capital for the pharmaceutical, biotechnology, and medical device sectors using data for firms with publicly-traded stock on U.S. exchanges during 2001-2005 and 2006-2008. Two frameworks are employed for estimating firms’ risk and the cost of equity capital: (1) the capital asset pricing model, and (2) the Fama-French three-factor model. Evidence is provided of the relationship between risk, cost of equity, and the intensity of firms’ R&D expenditures. Controlling for firms’ principal sector (pharmaceutical, biotechnology, or device), R&D intensity, as measured by the ratio of R&D expense to total revenues, is positively related to market betas and thus the estimated cost of equity capital. Estimates of the Fama-French model imply a size-related risk premium in the cost of equity for small firms in each sector. Controlling for R&D intensity, average market betas differ significantly across sectors during the periods analyzed. Large biotech firms on average had large, negative, and significant book-to-market betas during 2001-2005, significantly lowering their estimated cost of equity capital, but the negative book-to-market betas and lower estimated cost of equity for large biotechs disappeared during 2006-2008.
1
I. Introduction
The investment, financing, and risk management decisions of pharmaceutical,
biotechnology, and medical device firms are fundamentally important to the development and
availability of innovative treatments to enhance health outcomes and the quality of life.
Economically efficient investment, including research and development, requires undertaking
projects with positive “net present value,” i.e., projects for which the discounted value of
expected net cash flows is positive, where the discount rate reflects investors’ opportunity cost
of capital. The cost of capital therefore has significant effects on investment decisions. It also
affects the minimum product prices that are required to make basic research and particular
R&D projects economically attractive.
Given long research and development cycles and relatively low scientific success rates for
individual projects, the effects of the cost of capital on investment decisions can be particularly
large for the pharmaceutical, biotechnology, and medical device sectors. Because firms in
these sectors are primarily financed by equity (common equity issues and retained earnings), as
opposed to debt, the relevant cost of capital for investment decisions is dominated by the cost
of equity capital (see, e.g., Myers and Shyam-Sunder, 1996). Estimates of the cost of equity
capital and understanding factors that influence the cost of equity are thus highly relevant to
project development and policy issues, including drug and device pricing, and measurement of
the average cost of developing a new drug or device (e.g., Dimasi, Hansen, and Grabowski,
2003; DiMasi and Grabowski, 2007; Vernon, Golec, and DiMasi, 2009).
This study provides new estimates of systematic risk and the cost of equity capital for the
pharmaceutical, biotechnology, and medical device sectors using data for firms with publicly
traded stock on U.S. exchanges (including foreign owned-firms) during 2001-2005 and 2006-
2008. Two frameworks are employed for estimating firms’ risk and the cost of equity capital:
2
(1) the capital asset pricing model (CAPM), and (2) the empirically-driven three risk-factor
model of Fama and French (F-F, 1992, 1993).
The CAPM is widely used by corporations, investment banks, and portfolio managers in
valuation and capital budgeting. It is based on the simple notion that investors who are able to
diversify at low cost will only demand compensation for bearing non-diversifiable risk. The
CAPM posits that the risk premium required by investors for holding a particular security will
depend on the sensitivity of the security’s return to returns on the market portfolio of risky
assets, as measured by the security’s “beta.” Beta is a measure of a security’s market risk that
cannot be diversified away by combining it with other securities in a portfolio.
The CAPM assumes a single, market risk factor. The F-F model was developed in
response to evidence that, controlling for market beta, historical mean returns for small firms’
stock were higher than for large firms and historical mean returns for stocks with high ratios of
book-to-market equity (“value” stocks) were higher than those for stocks with low book-to-
market equity (“growth” or “glamour” stocks). The F-F model posits that two non-
diversifiable risk factors affect the required return on a security in addition to its market risk:
(1) a risk factor related to firms’ market capitalization (the size factor), and (2) a risk factor
related to a firms’ ratios of book value of equity capital to the market value of equity capital
(the book-to-market factor). A firm’s cost of equity capital depends on its market, size, and
book-to-market betas and the risk premia associated with each risk factor. While the F-F
model is less widely used in valuation and capital budgeting than the CAPM, it is often used in
comparison with the CAPM. In addition, many investment analysts employ cost of equity
capital estimates that incorporate a size factor if not both the size and book-to-market factors.
This study’s empirical analysis focuses on possible differences in risk and the associated
cost of equity capital across the pharmaceutical, biotechnology, and device sectors and
between large and small firms within each sector. It also provides evidence of the relationship
3
between firms’ risk, cost of equity capital, and the intensity of research and development
expenditures (R&D), as measured by the ratio of R&D to total revenues (“sales”). Prior work
(see below) has emphasized that while technical uncertainty associated with success or failure
during product development and approval is likely diversifiable, expected future R&D
expenditures for a given project create a form of leverage analogous to operating and financial
leverage. That leverage, which declines as the project moves through development, increases
the project’s systematic risk that arises from correlation between the project’s projected
commercial value conditional on success and underlying risk factors priced by investors, such
as market risk.
There are four principal findings from the empirical analysis. First, R&D intensity is
positively related to market betas and thus the estimated cost of equity capital, after controlling
for firms’ principal sector of operations (pharmaceutical, biotechnology, or device). Second,
the choice of model matters. The CAPM and F-F models can produce materially different
estimates of the cost of equity capital. In particular, the results for the F-F model imply a size-
related risk premium in the cost of equity capital for smaller firms in each sector. Third,
controlling for R&D intensity, average market betas can differ significantly across sectors.
Biotech firms had significantly higher market betas than pharmaceutical firms during 2001-
2005. Device firms had significantly higher betas than pharmaceutical firms during 2006-
2008. Fourth, the time period matters, as implied by the preceding results and by a large
negative and significant average book-to-market beta for large biotech firms during 2001-
2005, which significantly lowered the estimated cost of capital during that period, but which
did not persist during 2006-2008.
Section II briefly reviews prior work and discusses the likely relation between the cost of
equity capital and R&D intensity. Section III outlines the CAPM and F-F models and their
empirical implementation. The data and samples are discussed in Section IV. Section V
4
presents beta and cost of equity capital estimates for equally-weighted portfolios formed by
sector and by sector and firm size. Section VI presents results concerning the relationship
between individual firm betas and R&D intensity. Section VII concludes.
II. Prior Work
Enormous theoretical and empirical literatures consider the cost of capital in general and
the cost of equity capital in particular. Much of this research addresses the CAPM and the F-F
models, including their ability to explain cross-sectional stock returns (see, e.g., F-F, 1992,
1993, 2006). While much of this work castes doubt on its empirical veracity, the CAPM
remains the most widely used method in practice for estimating the cost of capital.
The question of whether size and book-to-market factors in returns are persistent and
related to underlying priced risk factors has been extensively debated, including whether
historical size-related return premia compensate for risk related to illiquidity or financial
distress (see van Dijk, 2007), and whether historical book-to-market related return premia
compensate for risk related to earnings volatility or financial distress.
Studies that have employed the CAPM or F-F model to estimate the cost of equity capital
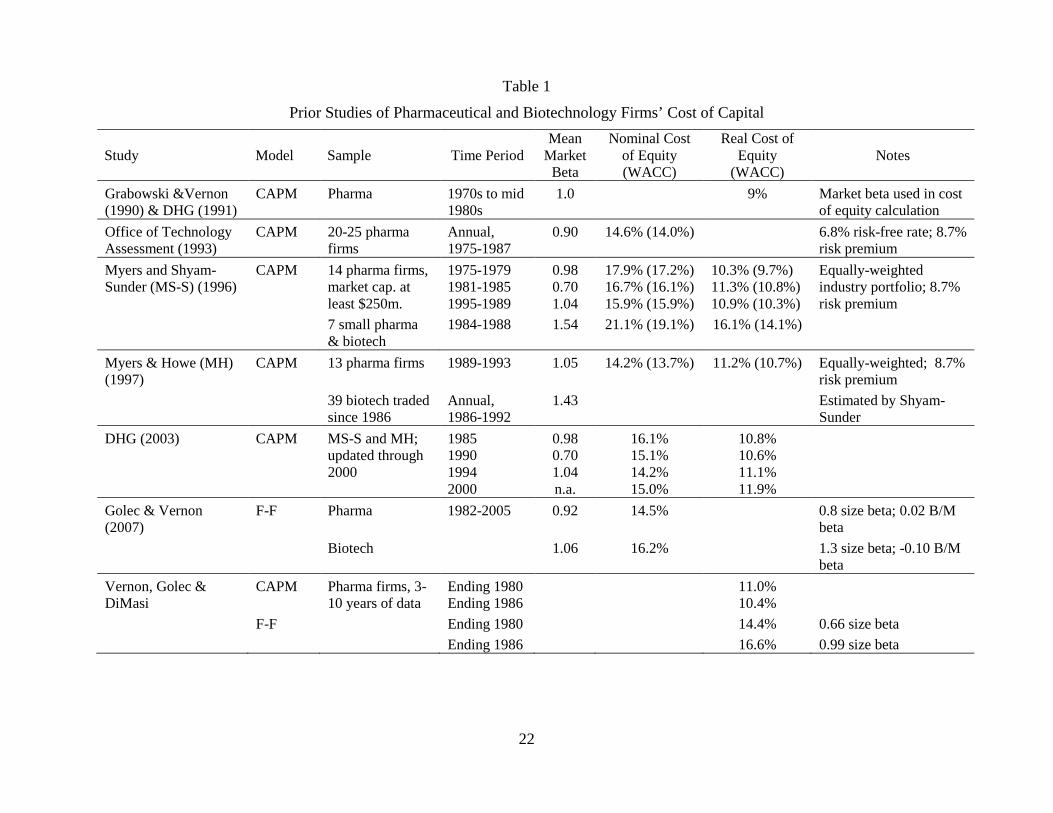
for pharmaceutical and/or biotechnology firms are summarized in Table 1.1 Grabowski and
Vernon (1990) and DiMasi, Hansen, and Grabowski (DHG, 1991) utilize a real cost of capital
estimate of 9 percent assuming an average CAPM beta of one based on beta estimates using
data from the 1970s to the mid-1980s. The Office of Technology Assessment (1993) reports
an average pharmaceutical firm beta of 0.90 based on annual estimates for 20-25 firms during
1975-1987.
1 Also see Cockburn and Lerner (2009), citing high betas for early state ventures. A variety of studies have used the CAPM or F-F based models in event studies of abnormal returns for pharmaceutical and biotechnology stocks (see, e.g., Bastin and Hubner, 2006; Golec, Hegde, and Vernon, 2005; McNamara and Baden-Fuller, 2007)
5
Myers and Shyam-Sunder (1996) provide CAPM-based cost of capital estimates for large
pharmaceutical firms as of 1980, 1985, and 1990. They report mean CAPM betas of 0.98,
0.70, and 1.04 for the 1975-1979, 1981-1985, and 1985-1989 periods, respectively. They also
report an average beta of 1.54 using 1984-1988 data for seven small pharmaceutical and
biotechnology firms.
Myers and Howe (1997) report an average CAPM beta of 1.05 for 13 large
pharmaceutical firms using data for 1989-1993 and an average beta of 1.43 using annual data
on weekly returns during 1986-1992 for 39 biotechnology firms with traded stock throughout
the period. DHG (2003) use the Myers and Shyam-Sunder, Myers and Howe, and updated
beta estimates to estimate the cost of capital and resulting opportunity costs for drugs in
development.
Golec and Vernon (2007) use the Fama-French model to estimate cost of capital for
samples of pharmaceutical and biotechnology firms using 1982-2005 data. The average
market betas are 0.92 for pharmaceuticals and 1.06 for biotechnology firms. The F-F size
betas are large and significant for both samples, especially for biotechs, increasing the
estimated cost of capital. The book-to-market factor betas are close to zero and insignificant
for both sectors. Vernon, Golec, and DiMasi (2009) compare cost of capital estimates obtained
using the CAPM and F-F models for pharmaceutical firms with 3-10 years of returns data
ending in 1980 and 1986. The F-F cost of capital estimates are 300-600 basis points greater
using the F-F model due to large estimated size betas.
Myers and Shyam-Sunder explain why, given the implicit leverage associated with R&D,
systematic risk will likely increase with R&D intensity and be greater for early stage projects
compared with more mature projects. Myers and Howe provide a detailed explanation of how
the quasi-fixed nature of planned R&D expenditures produces a form of leverage analogous to
operating leverage associated with fixed operating costs and financial leverage associated with
6
debt finance. They explain how variation in expected R&D over the life of a project will cause
R&D leverage and systematic risk to decline as a drug moves through the development
process, giving risk to what they term the “risk-return staircase” in drug development.
Myers and Shyam-Sunder and Myers and Howe also note that a positive relationship
between R&D intensity and risk is implied by option pricing models. Berk, Breen, and Naik
(2004) develop a dynamic model of multistage investment to illustrate how risk associated
with ultimate cash flows in R&D intensive ventures has a systematic component even though
technical risk about advancement of a project is diversifiable. They view risky, R&D ventures
as compound options with systematic uncertainty. They explain how an R&D intensive
project can be viewed as a series of compound options on the underlying cash flows of the
project, with the strike price equivalent to the expected future investment in R&D. The risk
premium on the project decreases if the project advances and, as a result, becomes more “in the
money.” When a development stage is completed successfully, expected future investment
drops, thus reducing the strike price and systematic risk of the project.
Myers and Shyam-Sunder conjecture that the higher mean beta they report for small
biotech and pharmaceutical companies than for large pharmaceutical companies is consistent
with high R&D being associated with high systematic risk. In an analysis of the potential
effects of the Clinton Administation’s proposed Health Security Act of 1993 on
pharmaceutical / biotechnology firms’ stock prices and R&D spending, Golec, Hegde, and
Vernon (2005) use the CAPM to estimate abnormal stock returns and report higher average
CAPM betas (estimated with data during 1992-1993) for firms with higher average ratios of
R&D to assets during 1989-1991. 2
2 Also see Ellison and Mullins (2001). In related research, studies of the relationship between R&D intensity and equity values have considered whether stock prices accurately reflect intangible assets associated with R&D. Chan, Lakonishok, and Sougiannis (2001), for example, analyze the relation between historical stock returns and firms’ R&D. Eberhart, Maxwell, and Siddique (2004) provide evidence of
7
III. The CAPM and Fama-French Models
The CAPM and F-F models are expected-return beta representations of linear factor
pricing models.3 The basic formulation of such models is:
E(Rj) = γ + βj1 λ1 + βj2 λ2 + . . . + βjK λK , j = 1, 2, . . . , N (1)
where E(Rj) is the expected return on asset j, γ is the riskless rate of interest (or, if no riskless
rate exists, the expected return on a zero-beta asset or portfolio), λk (k = 1, 2, . . . , K) is the
expected risk premium for the kth risk factor, and βjk (j = 1, 2, . . ., N; k = 1, 2, . . ., K) is the
sensitivity of asset j’s return to the kth risk factor.
The k underlying risk factors proxy for changes in the marginal utility of consumption and
represent sources of risk that cannot be eliminated via portfolio diversification. Equation (1)
portrays the fundamental principle that assets with greater risk sensitivities must provide
investors with higher expected returns; i.e., when they tend to provide greater (smaller) payoffs
when consumption is high (low) and the marginal utility of consumption is low (high).
The single risk factor in the CAPM is the return on the market portfolio of risky assets.
With a riskless interest rate, RF, each asset’s expected return is:
E(Rj)CAPM = RF + βj E(RM – RF) , j = 1, 2, . . . , N (2)
where βj is the asset’s market (“CAPM”) beta, E(RM – RF) is the expected excess return on the
market portfolio (the “market risk premium”). E(Rj)CAPM is the required expected return
positive abnormal stock returns for firms with unexpected increases in R&D. Lev and Sougiannis (1999) consider a possible relationship between R&D and the book-to-market phenomenon in stock returns. Other studies consider possible valuation effects of the accounting treatment of R&D. See, for example, Lev, Sarath, and Sougiannis (2004), and, for specific application to the pharmaceutical and/or biotechnology sectors, Joos (2002, empirical analysis of relations between pharmaceutical firms’ book-to-market ratios and R&D), Healy, Myers, and Howe (2002, simulation analysis of relations between accounting treatment of R&D and pharmaceutical firm economic value), Hand (2004, empirical analysis of relation between market equity value and R&D measures in biotechnology), and Clem, Cowan, and Jeffrey (2004, examination of stock price reactions to proposed changes in accounting treatment of purchased in-process R&D for R&D intensive firms). 3 See, for example, Cochrane (2001), Ch. 5.

8
(opportunity cost of equity capital) for stock j given its risk, βj. If βj varies across assets in
relation to some variable, xj, the cost of capital will vary according to:
.)()(
j
jFM
j
CAPMj
xRRE
x
RE
The F-F model posits three risk factors: (1) the excess return on the market portfolio, (2)
the excess return on a portfolio of “small” stocks versus “big” stocks, and (3) the excess return
on a portfolio of stocks with “high” ratios of book equity to market equity (book-to-market
ratios) and versus stocks with “low” book-to-market ratios. The expected return for asset j is:
E(Rj)FF = RF + βj,MKT-RF E(RM – RF) + βj,SMB E(RS – RB) +βj,HML E(RH – RL), (3)
where βj,MKT-RF is the asset’s excess market return beta (analogous to its CAPM beta), and RS,
RB, RH, and RL are returns on the relevant portfolios of small, big, high book-to-market, and
low book-to-market stocks, respectively (see F-F, 1993). If the F-F betas vary in relation to
some variable, xj, the cost of capital will likewise vary according to:
.)()()()( ,,,
j
HMLjLH
j
SMBjBS
j
RFMKTjFM
j
FFj
xRRE
xRRE
xRRE
x
RE
Given equation (2), an estimate of a security’s or portfolio’s CAPM beta can be obtained
using least squares to estimate the following model with returns data for a given period:
jtFtMtCAPMjCAPMjFtjt RRRR )(,, . (4)
Similarly, given equation (3), estimates of F-F betas can be obtained by estimating:
jtLtHtHMLjBtStSMBjFtMtRFMKTjFFjFtjt RRRRRRRR )()()( ,,,, . (5)
Given beta estimates from (4) and (5), cost of equity capital estimates can be generated as
a function of assumed values for the risk free interest rate and market, size factor, and book-to-
market factor risk premia. If, for example, the assumed risk free rate is 5% and the assumed
market, size factor, and book-to-market factor risk premia are 7%, 3%, and 4%, respectively,
cost of equity capital estimates would be obtained as:
9
CAPMjCAPMjk ,,ˆ07.005.0ˆ
and
HMLjSMLjRFMKTjFFjk ,,,,ˆ04.0ˆ03.0ˆ07.005.0ˆ .
Assumed risk premia typically are based on historical mean excess returns for the relevant
factor portfolios.
IV. Data and Samples
This study estimates CAPM and F-F betas using monthly returns data for two time periods:
2001-2005 (60 monthly returns) and 2006-2008 (36 monthly returns). The 2001-2005 period
follows the dot.com boom and bust and predates the subprime mortgage / financial crisis that
began in 2006 and accelerated during 2007-2008. The 2006-2008 period thus encompasses the
crisis.
The following criteria were used to select sample firms in each period:
The firm’s stock was included in the S&P 1500 and identified in the Standard & Poor’s Industry Survey at the end of the period for pharmaceutical firms, biotechnology firms, or medical device (healthcare products and supplies) firms.
Complete monthly returns were available from CRSP for the sample period.
The firm was included in Compustat each year during the sample period, and had non-missing data for R&D expenses.
The firm had market capitalization of $100 million or more at the beginning of the sample period.4
This procedure resulted in samples of 100 and 99 firms for 2001-2005 and 2006-2008,
respectively. The firms were classified as primarily pharmaceutical, biotechnology, or medical
device using the classification in Standard & Poor’s Industry Surveys.5 Firms were then
classified into large and small firm subgroups within each sector based on whether their market
4 The minimum market capitalization criterion was designed to reduce issues associated with infrequent trading. A handful of firms that met the other criteria were excluded on this basis. 5 Clinical research organizations and labs were excluded even if they reported some R&D expense.
10
capitalization was above or below the median value for the entire sample at the beginning of
the sample period ($2.51 billion for 2001-2005 and $2.48 billion for 2006-2008).6
Monthly returns (including dividends) for each firm were obtained from CRSP available
through Wharton Research Data Services (WRDS). Monthly returns in excess of the monthly
Treasury bill yield (“excess returns”) were calculated for each security. Monthly Treasury bill
yields (the risk-free rate used) and monthly excess returns (above the Treasury bill yield) on
the value-weighted portfolio of all NYSE/AMEX/NASDAQ securities, size-based, and book-
to-market based portfolios were obtained from WRDS (and are also available from Kenneth
French’s website).
R&D expense (net of acquired in process R&D), total revenues (sales), and other financial
data were obtained from the Compustat Annual Fundamentals files, also available through
WRDS. The average lagged (one-year) ratio of a firm’s annual R&D expense to its annual
sales during the sample period was calculated as a measure of its average R&D intensity. A
few values above one were truncated at one for each sample.7 The average lagged ratio of a
firm’s long-term debt to value (long-term debt plus convertible debt plus preferred stock plus
market value of equity) and the average lagged ratio of the firm’s book value of equity to
market value of equity also were calculated for each firm in each period.
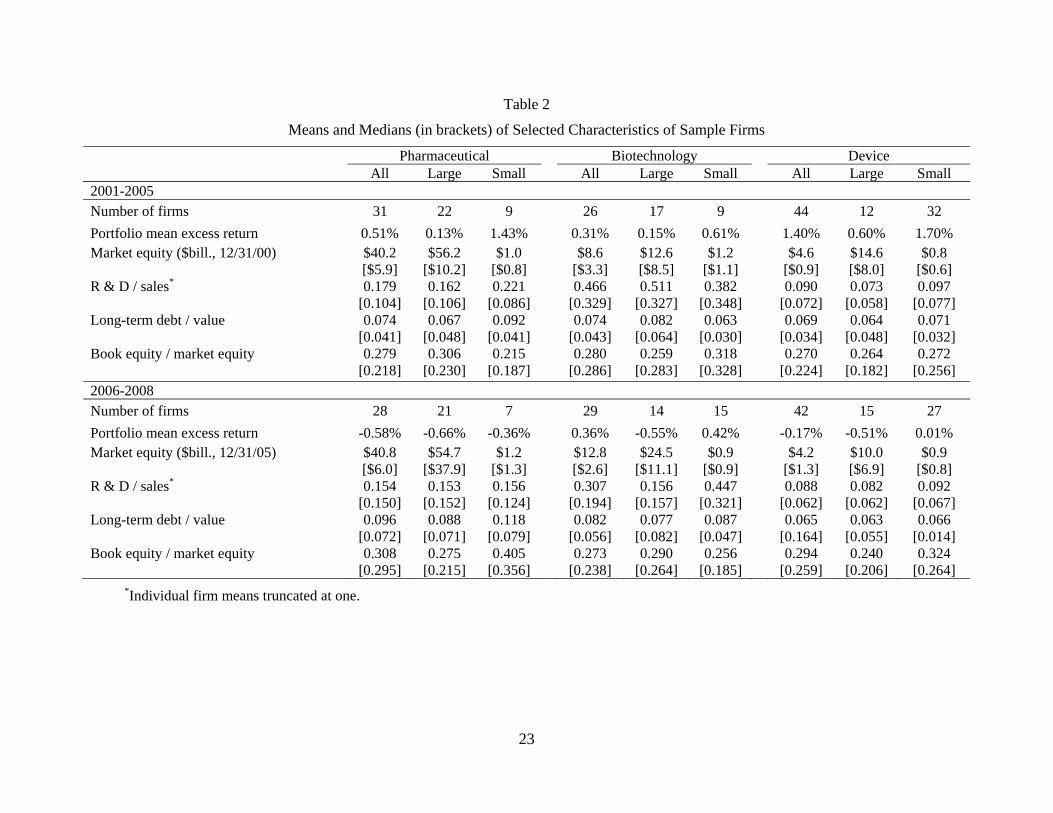
Table 2 shows sample sizes, mean monthly excess returns, and mean and median values of
market capitalization, R&D / sales, long-term debt / value, and book-to-market equity for each
sector and sector-size subgroup for each sample period. Consistent with the general upward
trend in stock prices, the mean excess returns are positive for each category during 2001-2005,
with large excess returns for small pharmaceutical and small device firms. During the 2006-
6 Classifying size groups based on the F-F size portfolio cutoffs would have produced too few small firms for meaningful analysis. 7 For regressions of betas on R&D / sales, qualitatively similar results were obtained using the raw values of the variable.
11
2008 period, when the overall market declined sharply in the latter half of 2008, the excess
returns are negative for each group except small biotech and small device firms. Relatively
few pharmaceutical firms had market capitalizations less than the overall sample median value
during each period, whereas the device firm samples include many small firms. The giant
pharmaceutical firms cause the mean values of market capitalization for the overall
pharmaceutical and large pharmaceutical groups to be much greater than the medians.
During 2001-2005, the mean and median values of R&D / sales are much larger for
biotechs than for pharmaceutical and medical device firms. For example, the median of R&D /
sales for the overall biotech group is 33% compared with 10% for pharmaceutical firms and
7% for device firms. During 2006-2008, however, the mean and median R&D / sales for the
large biotech group are much lower than in 2001-2005, and the difference in R&D intensity
between large biotechs and large firms in the other sectors narrows considerably.
The mean and median values of book-to-market equity are roughly similar across groups
and time periods. The mean and median values of long-term debt / value are low, just
exceeding 10 percent for the small pharmaceutical group during 2006-2008. Because many
firms in these sectors hold substantial cash and marketable securities, measures of net debt
(total debt less cash and marketable securities) would be even lower (and negative for some
firms). As a result of the minimal use of debt finance by most firms, the weighted-average cost
of debt and equity capital will be approximately equal to the cost of equity capital. As has
been true in a number of previous studies, for this reason the focus in this paper is on the cost
of equity capital.
12
V. Beta and Cost of Capital Estimates by Sector and Size
A. CAPM Betas
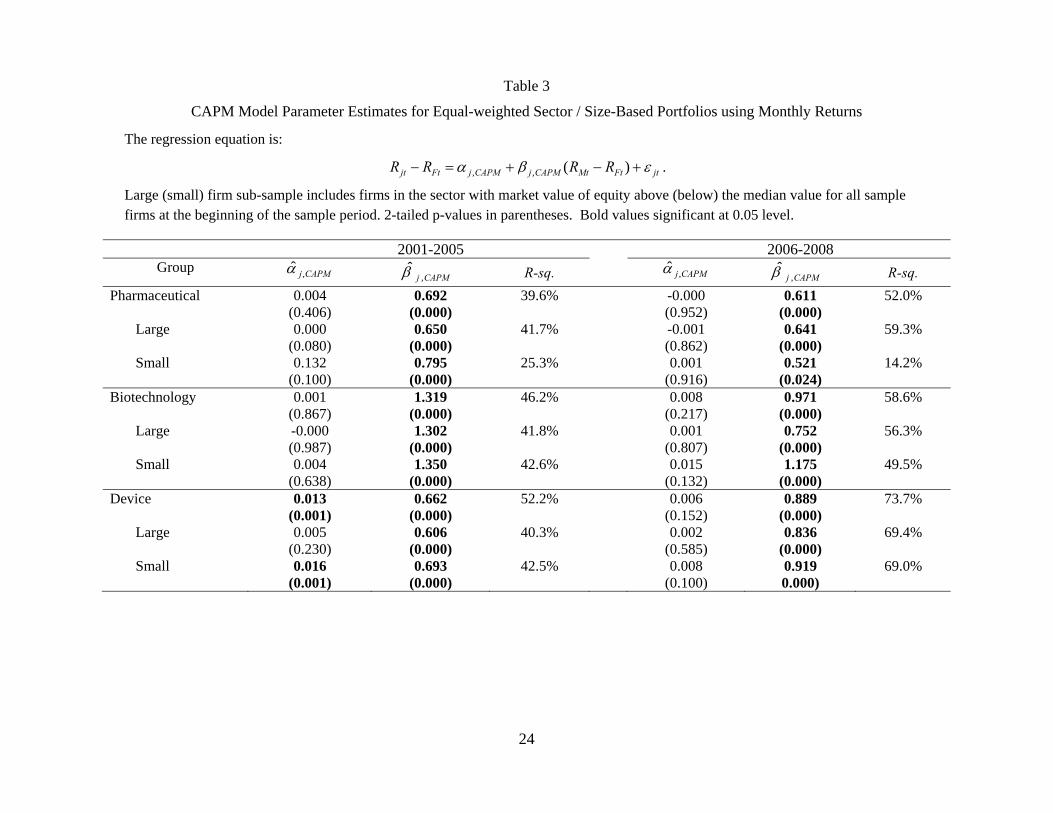
Table 3 shows the results of using equation (4) to estimate CAPM betas for nine equally-
weighted portfolios: three sector portfolios and six sector-size portfolios. Beta estimates for
equally-weighted portfolios are mathematically equivalent to the arithmetic mean of beta
estimates for the securities in the portfolio. A multivariate regression model (MVRM) was
used to jointly estimate the equations for the three sectors and for the six sector-size portfolios.
The MVRM produces estimates identical to estimating the model for each portfolio separately,
but it permits tests of equality of betas across portfolios that reflect possible correlations in
disturbances across the portfolios.
For the 2001-2005 sample, the CAPM beta estimate is much larger for biotechs (1.32)
than for the pharmaceutical firms (0.69) and device firms (0.66), and the differences are
statistically significant at the 0.01 level. During 2006-2008, the CAPM beta estimate for the
pharmaceutical portfolio is 0.61. The large biotech beta drops to 0.75 and the overall biotech
beta drops to 0.97. The beta estimate for the overall device portfolio is 0.89. The biotech and
device betas for 2006-2008 are significantly greater than the pharmaceutical beta at the 0.05
level but not significantly different from each other. The R-squared for the small
pharmaceutical portfolio for 2006-2008, which includes only 7 firms, is only 14%. With the
exception of the small pharmaceutical portfolio, the R-squareds are materially larger during
2006-2008 than during 2001-2005, especially for device firms.
The much higher biotech beta for 2001-2005 is consistent with the much higher R&D
intensity for biotechs during this time period (see Table 2). The drop in biotech portfolio betas
for 2006-2008 coincides with reductions in R&D intensity during this period compared with
2001-2005. The increases in the device portfolio betas during the 2006-2008 period versus
2001-2005 were not accompanied by any increase in R&D intensity.
13
The estimated “alphas” (intercepts) shown in Table 3 are generally positive, especially for
the 2001-2005 period.8 The values for the small device portfolio are large and statistically
significant, producing a large and significant estimate for the overall device portfolio as well.
Controlling for beta, small device firms therefore “outperformed” the overall stock market
during this period. The estimated average risk-adjusted excess return for the small device
portfolio is 1.6% per month.
B. Fama-French Betas
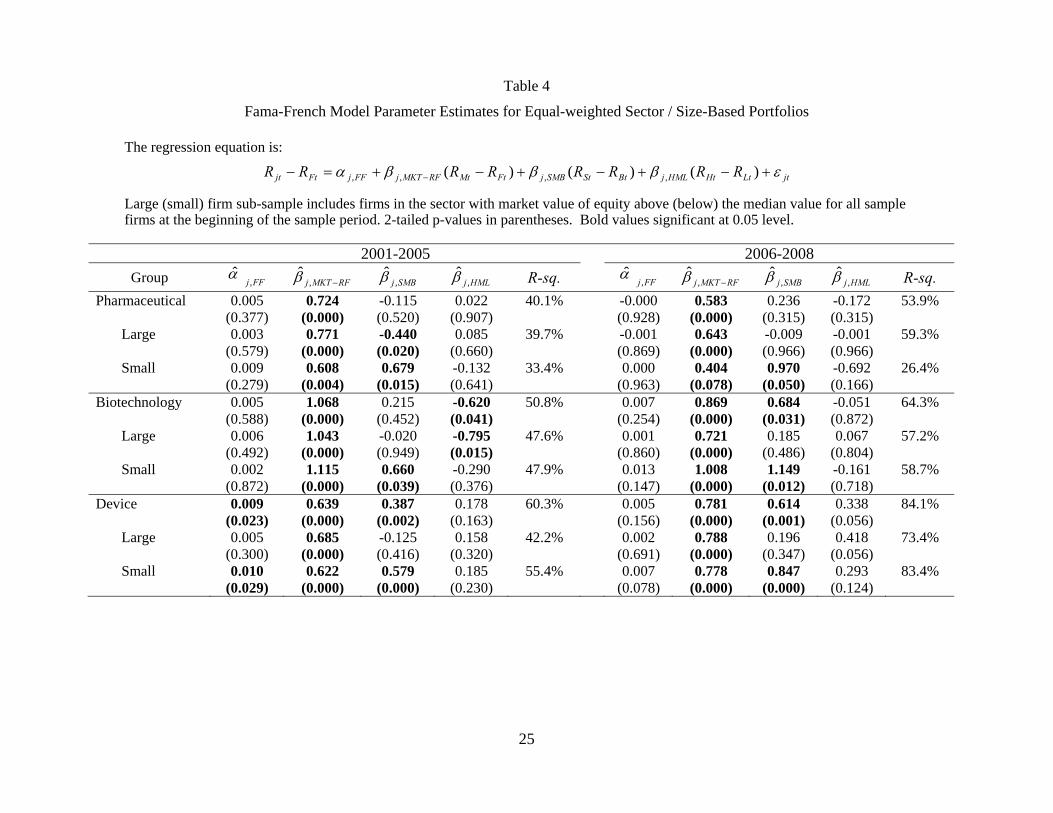
Table 4 shows F-F betas obtained from estimating equation (5) for the nine portfolios.
The market betas are generally lower than those shown in Table 4, with the exception of the
overall and large pharmaceutical betas for 2001-2005, which are larger than the CAPM beta
estimates. The biotechnology market betas again are significantly larger than those for
pharmaceutical and device firms during 2001-2005, and for biotechs and device firms
compared with pharmaceutical firms during 2006-2008. The estimated alphas for device firms
during 2001-2005 are again large and significant due to the small device firm portfolio.
The inclusion of the size and book-to-market factors in the returns equation produces
relatively little increase in R-squareds over the CAPM model. However, consistent with
Vernon, Golec, and DiMasi (2005) and Golec and Vernon (2007), the size factor beta estimates
are positive and statistically significant for the small firm portfolios for each sector and time
period, which is some cases causes the size factor beta to be positive and significant for the
overall sector portfolio. Thus, smaller pharmaceutical, biotech, and device stock returns were
correlated with those of other small firms during these time periods. The large pharmaceutical
firm portfolio has a negative and statistically significant size beta during 2001-2005.
8 The estimated alpha from equation (4), sometimes called “Jensen’s alpha”, is a commonly measure of risk-adjusted performance for portfolios and individual securities.
14
The book-to-market betas are negative, large in absolute value, and significantly different
from zero for the overall and large biotech portfolios during 2001-2005. This result suggests
that, after controlling for overall market returns, biotech stock returns tracked those of growth
stocks during this time period, when average biotech R&D intensity was high. However, the
statistically significant and negative book-to-market betas for biotechs do not persist in 2006-
2008, when the larger biotechs had matured with greater sales and lower R&D intensity.
C. Cost of Equity Capital Estimates
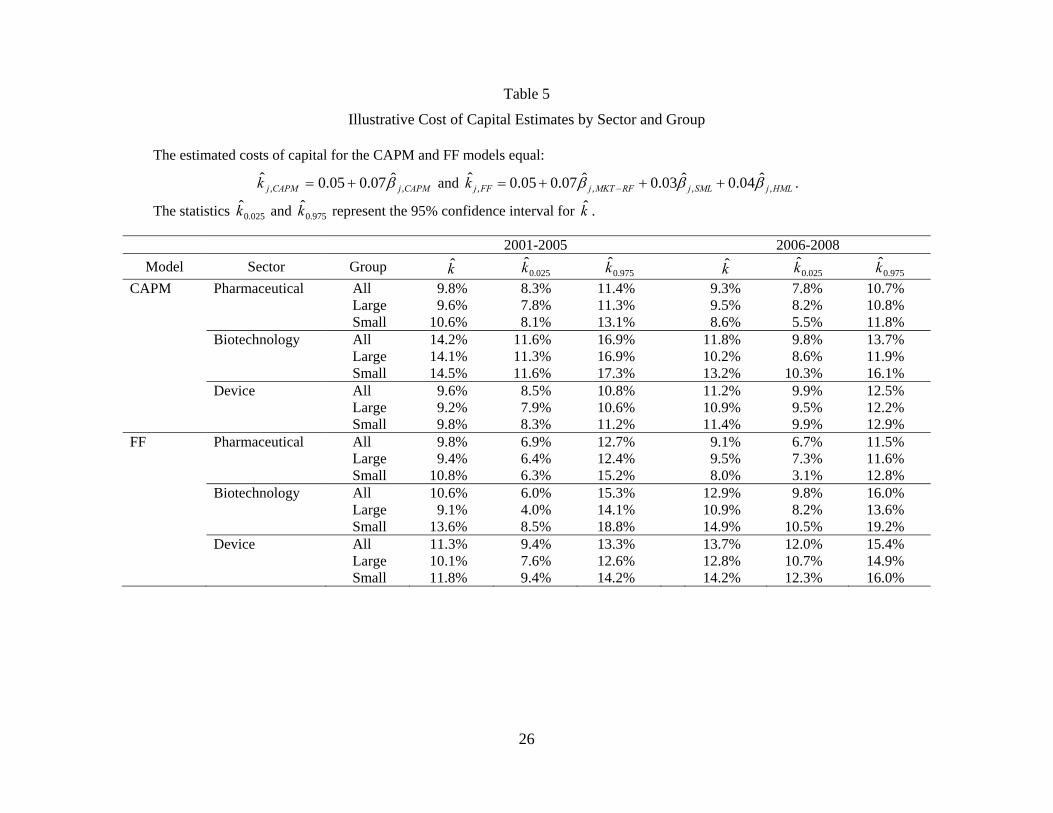
Table 5 uses the CAPM and F-F beta estimates from Tables 3 and 4 and their estimated
variances and covariances to generate (nominal) cost of equity capital estimates and 95%
confidence intervals for those estimates. The estimates assume a risk-free rate of 5 percent per
year, which would correspond to an expected annual real return on short-term Treasuries of 2
percent plus an expected inflation rate of 3 percent.9 Cost of equity capital estimates for a
different riskless rate could be obtained by simple addition or subtraction from those shown.
The assumed market risk premium is 7 percent, which is approximately equal to the average
annualized monthly excess market return available from CRSP during July 1926 – June 2009
(7.1%). The expected excess return on small versus large stocks is assumed to be 3 percent,
compared with an average annualized excess return on the F-F size portfolio of 2.8% during
that period. The expected excess return on high book-to-market versus low book-to-market
stocks is assumed to be 4%. This is 1% (100 basis points) lower than the average annualized
excess return on the F-F book-to-market factor portfolio during July 1926 – June 2009, but it is
more in line with the average return on that portfolio since the mid-1980s.
Given these assumptions, the point estimates of the (nominal) cost of equity capital
based on the 2001-2005 CAPM betas are approximately 10% for pharmaceutical and device
9 Myers and Shyam-Sunder (1996) employed a projected 20-year Treasury rate less the average term premium compared with Treasury bills to proxy for the riskless rate for long-duration R&D investments.
15
firms and 14% for the more R&D intensive and higher beta biotechnology firms. For 2006-
2008, the CAPM-based cost of equity capital estimates are approximately 9% for
pharmaceuticals,11% for device firms, and 12% for biotechs. For biotechs during 2006-2008,
the estimated cost of equity is 13% for the higher beta and more R&D intensive small firms
compared with 10% for larger biotechs.
For the F-F model, the estimated cost of equity capital values for pharmaceutical firms are
similar to those obtained from the CAPM in both time periods. During 2001-2005, the lower
(higher) F-F market beta for small (large) pharmaceutical firms compared with the CAPM
basically offsets the effects of the positive (negative) size beta for small (large) firms (see
Table 4). A similar offset affects the estimated cost of equity for small pharmaceutical firms
for 2006-2008. Due primarily to the positive size betas for small device firms, the F-F cost of
equity values for device firms are about 1-2% higher than those obtained with the CAPM for
2001-2006 and 2-3% higher for 2006-2008 (in part due to positive albeit insignificant book-to-
market betas).
Given the large and negative book-to-market betas for large biotechs during 2001-2005,
the estimated cost of equity for large biotechs using the F-F model during that period is much
lower (9.1%) than the value obtained using the CAPM (14.1%). However, the disappearance
of the relationship between biotechnology firm returns and book-to-market factor returns
during 2006-2008 causes the cost of equity capital estimates for large biotechs to converge for
the two models (10.9% for the F-F model vs. 10.2% for the CAPM).
VI. Individual Firm Betas and R&D Intensity
Individual firm CAPM and F-F beta estimates were also obtained using equations (2) and
(3) for the 2001-2005 and 2006-2008 samples. In order to provide evidence of the relationship

16
between estimated betas, sector, R&D intensity, and firm size (market capitalization), the
following cross-sectional regression model was estimated for each beta estimate and period:
jjjjjlj eEquityMarketLogaSalesDRaDeviceaBiotechaa 43210, /& (6)
where l = CAPM, MKT-RF, SML, or HML, Biotech and Device are sector indicators,
R&D/Sales is the firm’s average ratio of R&D expense to sales for the period (again truncated
at one), and Log Market Equity is the log of the firm’s market value of equity at the beginning
of the sample period. Similar results to those reported below were obtained when indicators
were included for generic pharmaceutical firms, for foreign-owned (or ADR) firms, and
including the average ratio of long-term debt to value. None of the additional variables were
significantly related to the estimated betas. Results with similar implications also were
obtained estimating models (without sector indicators) separately for each sector.
Table 6 shows bivariate correlations between the beta estimates, R&D intensity, log
market equity, and long-term debt / value. As expected, R&D intensity is positively and
significantly related to both CAPM and F-F market betas each period. It is negatively and
significantly related to F-F book-to-market betas in 2001-2005. Again as would be expected,
log market equity is negatively and significantly related to the F-F size betas.
Table 7 shows least squares estimates of equation (6) for each beta estimate and time
period (with heteroskedasticity robust standard errors in parentheses). For the CAPM and F-F
market betas, the estimates for the biotechnology and device indicators are consistent with the
findings of the portfolio analysis, except that the coefficient for the biotech indicator is not
statistically significant during 2006-2008. The CAPM and F-F market betas are positively and
significantly related to R&D intensity in both periods. The coefficient on R&D intensity is
1.17 for the CAPM beta and 0.83 for the F-F market beta for 2001-2005. The coefficients are
approximately one for both market beta measures for 2006-2008. Given an expected market

17
risk premium of 7%, a coefficient for R&D intensity of one implies that, other factors held
constant, the cost of equity capital would increase 0.7% (70 basis points) for every 10
percentage point increase in R&D intensity.
The F-F size betas are negatively and significantly related to log market equity for each
period with estimated coefficients of -0.31 and -0.22 for 2001-2005 and 2006-2008,
respectively. Using a 3% size factor premium and the -0.22 estimate, an increase in market
capitalization at the beginning of 2006 from $948 million (approximately the 25th percentile
value for the 2006-2008 sample) to $16.2 billion (approximately the 75th percentile) would
increase the estimated cost of equity by 1.9% (190 basis points).
Consistent with the portfolio results, there is a strong, negative relationship between F-F
book-to-market betas and R&D intensity during 2001-2005, but the estimated coefficient for
R&D intensity is much closer to zero and insignificant for the 2006-2008 sample. The
coefficient for the device indicator in the book-to-market beta equation is positive and
significant for 2006-2008. Other factors held constant, the magnitude of the coefficient, along
with a 4% book-to-market factor risk premium, would imply a 2.5% (250 basis) point higher
cost of equity for device firms than for pharmaceutical firms. The explanation of this result
(assuming that it’s not spurious) is not clear. It reflects in part the negative (albeit statistically
insignificant) estimated beta for pharmaceutical firms during 2006-2008 (see Table 4).
VII. Conclusions
This study provides estimates of systematic risk and the cost of equity capital for the
pharmaceutical, biotechnology, and medical device sectors using data for firms with publicly
traded stock on U.S. exchanges (including foreign owned-firms) during 2001-2005 and 2006-
2008 using the CAPM and Fama-French three-factor model. It also provides evidence of the
relationship between firms’ systematic risk, cost of equity, and intensity of R&D expenditures.
18
There are four principal findings. First, R&D intensity, as measured by the ratio of R&D
expense to sales, is positively related to market betas and thus the estimated cost of equity
capital, after controlling for firms’ principal sector of operations (pharmaceutical,
biotechnology, or device). Second, the choice of model matters. The CAPM and F-F models
can produce materially different estimates of the cost of equity capital. In particular, and
consistent with other work, the F-F model results imply a size-related risk premium in the cost
of equity for small firms in each sector. Third, controlling for R&D intensity, average market
betas can differ significantly across sectors. Biotech firms had significantly higher market
betas than pharmaceutical firms during 2001-2005. Device firms had significantly higher betas
than pharmaceutical firms during 2006-2008. Fourth, the time period matters, as implied by
the preceding results and by the large negative and significant book-to-market beta for large
biotech firms during 2001-2005, which significantly lowered the estimated cost of capital
during that period but which did not persist during 2006-2008.
These results have potentially important implications for valuation and capital budgeting
of pharmaceutical, biotechnology, and device firms. They raise the possibility of obtaining
better estimates of a firm’s cost of equity using on the cross-sectional relationship between risk
and R&D intensity. They also suggest the possible value in practice of comparing values of
projects based on estimates of the cost of capital using the CAPM and F-F model, at least for
small firms.
Along with theory and prior work, the study’s results concerning risk and R&D intensity
also highlight the question of whether a time-varying discount rate should be used to value
molecules or devices in different stages of development. Although technical (scientific) risk is
likely diversifiable by investors, early stage projects have greater R&D intensity and thus
greater systematic risk. The return required by investors is therefore likely to be greater than
for late stage projects. If a constant discount rate is used to value all expected future cash

19
flows based on a firm’s overall cost of capital, early stage projects would tend to be overvalued
and late stage projects would tend to be undervalued. Additional work is needed to determine
whether and how time-varying discount rates could be employed in practice.
20
References
Bastin, V. and G. Hubner, 2006, Concentrated announcements on clustered data: an event study of biotechnology stocks, Financial Management 35: 129-157.
Berk, J., R. Green, and V. Naik, 2004, Valuation and return dynamics of new ventures, The Review of Financial Studies 17: 1-35.
Chan, K., J. Lakonishok, and T. Sougiannis, 2001, The stock market valuation of research and development expenditures, Journal of Finance 56: 2431-2456.
Clem, A., A. Cowan, and C. Jeffrey, 2004, Market reaction to proposed changes in accounting for purchased research and development in R&D-intensive industries, Journal of Accounting, Auditing & Finance : 405-428.
Cochrane, J., 2001, Asset Pricing, Princeton, N.J., Princeton University Press.
Cockburn, I. and J. Lerner, 2009, The cost of capital for early-stage biotechnology ventures, Boston University and Harvard University, http://www.slideshare.net/NVCA/the-cost-of-capital-for-early-stage-biotechnology-ventures.
DiMasi, J. and H. Grabowski, 2007, The cost of biopharmaceutical R&D: Is biotech different? Managerial and Decision Economics 28: 469-479.
DiMasi, J., R. Hansen, and H. Grabowski, 2003, The price of innovation: new estimates of drug development costs, Journal of Health Economics 22: 151-185.
Eberhart, A., W. Maxwell, and A. Siddique, 2004, An examination of long-term stock returns and operating performance following R&D increases, Journal of Finance 59: 623-650.
Fama, E. and K. French, 1992, The cross-section of expected stock returns, Journal of Finance 47: 427-455.
Fama, E. and K. French, 1993, Common risk factors in returns on stocks and bonds, Journal of Financial Economics 33: 3-56.
Fama, E. and K. French, 2006, The Value Premium and the CAPM, Journal of Finance 61: 2163-2185.
Ellison, S. and W. Mullin, 2001, Gradual incorporation of information: pharmaceutical stocks and the evolution of President Clinton’s health care reform, Journal of Law & Economics 44: 89-129.
Golec, J., S. Hegde, and J. Vernon, 2005, Pharmaceutical stock price reactions to price constraint threats and firm-level R&D spending, NBER Working Paper 11229, March.
Hand, J., 2004, The market valuation of biotechnology firms and biotechnology R&D, in J. McCahery and I. Renneboog, eds., Venture Capital Contracting and the Valuation of High-Technology Firms, Oxford, U.K., Oxford University Press.
Healy, P., S. Myers, and C. Howe, 2002, R&D accounting and the tradeoff between relevance and objectivity, Journal of Accounting Research 40: 677-
Joos, P., 2002, Estimating cross-sectional differences in market-to-book ratios in the pharmaceutical industry, working paper, William E. Simon Graduate School of Business Administration, University of Rochester.
21
Lev, B. and T. Sougiannis, 1999, Penetrating the book-to-market Black Box: the R&D effect, Journal of Business Finance & Accounting 26: 419-449.
McNamara, P. and C. Baden-Fuller, 2007, Shareholder returns and the exploration-exploitation dilemma: R&D announcements by biotechnology firms, Research Policy 36: 548-565.
Myers, S. and Howe, C., 1997, A life-cycle financial model of pharmaceutical R&D, working paper, Program on the Pharmaceutical Industry, Sloan School of Management, MIT.
Myers, S. and L. Shyam-Sunder, 1996, Measuring pharmaceutical industry risk and the cost of capital, in R. Helms, ed., Competitive Strategies in the Pharmaceutical Industry, Washington, D. C., American Enterprise Institute.
Office of Technology Assessment, 1993, Pharmaceutical R&D: Costs, Risks and Rewards, OTA-H-522.
van Dijk, Mathijs A., 2007, Is size dead? A review of the size effect in equity returns, working paper, February.
Vernon, John A., Joseph H. Golec, Joseph A. DiMasi, 2009, Drug development costs when financial risk is measured using the Fama-French three-factor model, Health Economics Letters DOI: 10.1002/hec.1538.
22
Table 1
Prior Studies of Pharmaceutical and Biotechnology Firms’ Cost of Capital
Study Model Sample Time Period Mean
Market Beta
Nominal Cost of Equity (WACC)
Real Cost of Equity
(WACC) Notes
Grabowski &Vernon (1990) & DHG (1991)
CAPM Pharma 1970s to mid 1980s
1.0 9% Market beta used in cost of equity calculation
Office of Technology Assessment (1993)
CAPM 20-25 pharma firms
Annual, 1975-1987
0.90 14.6% (14.0%) 6.8% risk-free rate; 8.7% risk premium
Myers and Shyam-Sunder (MS-S) (1996)
CAPM 14 pharma firms, market cap. at least $250m.
1975-1979 1981-1985 1995-1989
0.98 0.70 1.04
17.9% (17.2%) 16.7% (16.1%) 15.9% (15.9%)
10.3% (9.7%) 11.3% (10.8%) 10.9% (10.3%)
Equally-weighted industry portfolio; 8.7% risk premium
7 small pharma & biotech
1984-1988 1.54 21.1% (19.1%)
16.1% (14.1%)
Myers & Howe (MH) (1997)
CAPM 13 pharma firms 1989-1993 1.05 14.2% (13.7%) 11.2% (10.7%) Equally-weighted; 8.7% risk premium
39 biotech traded since 1986
Annual, 1986-1992
1.43 Estimated by Shyam-Sunder
DHG (2003) CAPM MS-S and MH; updated through 2000
1985 1990 1994 2000
0.98 0.70 1.04 n.a.
16.1% 15.1% 14.2% 15.0%
10.8% 10.6% 11.1% 11.9%
Golec & Vernon (2007)
F-F Pharma 1982-2005 0.92 14.5% 0.8 size beta; 0.02 B/M beta
Biotech 1.06 16.2% 1.3 size beta; -0.10 B/M beta
Vernon, Golec & DiMasi
CAPM Pharma firms, 3-10 years of data
Ending 1980 Ending 1986
11.0% 10.4%
F-F Ending 1980 14.4% 0.66 size beta
Ending 1986 16.6% 0.99 size beta
23
Table 2
Means and Medians (in brackets) of Selected Characteristics of Sample Firms
Pharmaceutical Biotechnology Device All Large Small All Large Small All Large Small 2001-2005
Number of firms 31 22 9 26 17 9 44 12 32
Portfolio mean excess return 0.51% 0.13% 1.43% 0.31% 0.15% 0.61% 1.40% 0.60% 1.70% Market equity ($bill., 12/31/00) $40.2
[$5.9] $56.2
[$10.2] $1.0
[$0.8] $8.6
[$3.3] $12.6 [$8.5]
$1.2 [$1.1]
$4.6 [$0.9]
$14.6 [$8.0]
$0.8 [$0.6]
R & D / sales* 0.179 [0.104]
0.162 [0.106]
0.221 [0.086]
0.466 [0.329]
0.511 [0.327]
0.382 [0.348]
0.090 [0.072]
0.073 [0.058]
0.097 [0.077]
Long-term debt / value 0.074 [0.041]
0.067 [0.048]
0.092 [0.041]
0.074 [0.043]
0.082 [0.064]
0.063 [0.030]
0.069 [0.034]
0.064 [0.048]
0.071 [0.032]
Book equity / market equity 0.279 [0.218]
0.306 [0.230]
0.215 [0.187]
0.280 [0.286]
0.259 [0.283]
0.318 [0.328]
0.270 [0.224]
0.264 [0.182]
0.272 [0.256]
2006-2008 Number of firms 28 21 7 29 14 15 42 15 27
Portfolio mean excess return -0.58% -0.66% -0.36% 0.36% -0.55% 0.42% -0.17% -0.51% 0.01% Market equity ($bill., 12/31/05) $40.8
[$6.0] $54.7
[$37.9] $1.2
[$1.3] $12.8
[$2.6] $24.5
[$11.1] $0.9
[$0.9] $4.2
[$1.3] $10.0 [$6.9]
$0.9 [$0.8]
R & D / sales* 0.154 [0.150]
0.153 [0.152]
0.156 [0.124]
0.307 [0.194]
0.156 [0.157]
0.447 [0.321]
0.088 [0.062]
0.082 [0.062]
0.092 [0.067]
Long-term debt / value 0.096 [0.072]
0.088 [0.071]
0.118 [0.079]
0.082 [0.056]
0.077 [0.082]
0.087 [0.047]
0.065 [0.164]
0.063 [0.055]
0.066 [0.014]
Book equity / market equity 0.308 [0.295]
0.275 [0.215]
0.405 [0.356]
0.273 [0.238]
0.290 [0.264]
0.256 [0.185]
0.294 [0.259]
0.240 [0.206]
0.324 [0.264]
*Individual firm means truncated at one.
24
Table 3
CAPM Model Parameter Estimates for Equal-weighted Sector / Size-Based Portfolios using Monthly Returns
The regression equation is:
jtFtMtCAPMjCAPMjFtjt RRRR )(,, .
Large (small) firm sub-sample includes firms in the sector with market value of equity above (below) the median value for all sample firms at the beginning of the sample period. 2-tailed p-values in parentheses. Bold values significant at 0.05 level.
2001-2005 2006-2008 Group CAPMj ,
CAPMj , R-sq. CAPMj , CAPMj , R-sq.
Pharmaceutical 0.004 (0.406)
0.692 (0.000)
39.6% -0.000 (0.952)
0.611 (0.000)
52.0%
Large 0.000 (0.080)
0.650 (0.000)
41.7% -0.001 (0.862)
0.641 (0.000)
59.3%
Small 0.132 (0.100)
0.795 (0.000)
25.3% 0.001 (0.916)
0.521 (0.024)
14.2%
Biotechnology 0.001 (0.867)
1.319 (0.000)
46.2% 0.008 (0.217)
0.971 (0.000)
58.6%
Large -0.000 (0.987)
1.302 (0.000)
41.8% 0.001 (0.807)
0.752 (0.000)
56.3%
Small 0.004 (0.638)
1.350 (0.000)
42.6% 0.015 (0.132)
1.175 (0.000)
49.5%
Device 0.013 (0.001)
0.662 (0.000)
52.2% 0.006 (0.152)
0.889 (0.000)
73.7%
Large 0.005 (0.230)
0.606 (0.000)
40.3% 0.002 (0.585)
0.836 (0.000)
69.4%
Small 0.016 (0.001)
0.693 (0.000)
42.5% 0.008 (0.100)
0.919 0.000)
69.0%
25
Table 4
Fama-French Model Parameter Estimates for Equal-weighted Sector / Size-Based Portfolios
The regression equation is:
jtLtHtHMLjBtStSMBjFtMtRFMKTjFFjFtjt RRRRRRRR )()()( ,,,,
Large (small) firm sub-sample includes firms in the sector with market value of equity above (below) the median value for all sample firms at the beginning of the sample period. 2-tailed p-values in parentheses. Bold values significant at 0.05 level.
2001-2005 2006-2008
Group FFj ,
RFMKTj , SMBj , HMLj , R-sq. FFj ,
RFMKTj , SMBj , HMLj , R-sq.
Pharmaceutical 0.005 (0.377)
0.724 (0.000)
-0.115 (0.520)
0.022 (0.907)
40.1% -0.000 (0.928)
0.583 (0.000)
0.236 (0.315)
-0.172 (0.315)
53.9%
Large 0.003 (0.579)
0.771 (0.000)
-0.440 (0.020)
0.085 (0.660)
39.7% -0.001 (0.869)
0.643 (0.000)
-0.009 (0.966)
-0.001 (0.966)
59.3%
Small 0.009 (0.279)
0.608 (0.004)
0.679 (0.015)
-0.132 (0.641)
33.4% 0.000 (0.963)
0.404 (0.078)
0.970 (0.050)
-0.692 (0.166)
26.4%
Biotechnology 0.005 (0.588)
1.068 (0.000)
0.215 (0.452)
-0.620 (0.041)
50.8% 0.007 (0.254)
0.869 (0.000)
0.684 (0.031)
-0.051 (0.872)
64.3%
Large 0.006 (0.492)
1.043 (0.000)
-0.020 (0.949)
-0.795 (0.015)
47.6% 0.001 (0.860)
0.721 (0.000)
0.185 (0.486)
0.067 (0.804)
57.2%
Small 0.002 (0.872)
1.115 (0.000)
0.660 (0.039)
-0.290 (0.376)
47.9% 0.013 (0.147)
1.008 (0.000)
1.149 (0.012)
-0.161 (0.718)
58.7%
Device 0.009 (0.023)
0.639 (0.000)
0.387 (0.002)
0.178 (0.163)
60.3% 0.005 (0.156)
0.781 (0.000)
0.614 (0.001)
0.338 (0.056)
84.1%
Large 0.005 (0.300)
0.685 (0.000)
-0.125 (0.416)
0.158 (0.320)
42.2% 0.002 (0.691)
0.788 (0.000)
0.196 (0.347)
0.418 (0.056)
73.4%
Small 0.010 (0.029)
0.622 (0.000)
0.579 (0.000)
0.185 (0.230)
55.4% 0.007 (0.078)
0.778 (0.000)
0.847 (0.000)
0.293 (0.124)
83.4%
26
Table 5
Illustrative Cost of Capital Estimates by Sector and Group
The estimated costs of capital for the CAPM and FF models equal:
CAPMjCAPMjk ,,ˆ07.005.0ˆ and HMLjSMLjRFMKTjFFjk ,,,,
ˆ04.0ˆ03.0ˆ07.005.0ˆ .
The statistics 025.0k and 975.0k represent the 95% confidence interval for k .
2001-2005 2006-2008
Model Sector Group k 025.0k 975.0k k 025.0k 975.0k
CAPM Pharmaceutical All 9.8% 8.3% 11.4% 9.3% 7.8% 10.7% Large 9.6% 7.8% 11.3% 9.5% 8.2% 10.8% Small 10.6% 8.1% 13.1% 8.6% 5.5% 11.8% Biotechnology All 14.2% 11.6% 16.9% 11.8% 9.8% 13.7% Large 14.1% 11.3% 16.9% 10.2% 8.6% 11.9% Small 14.5% 11.6% 17.3% 13.2% 10.3% 16.1% Device All 9.6% 8.5% 10.8% 11.2% 9.9% 12.5% Large 9.2% 7.9% 10.6% 10.9% 9.5% 12.2% Small 9.8% 8.3% 11.2% 11.4% 9.9% 12.9% FF Pharmaceutical All 9.8% 6.9% 12.7% 9.1% 6.7% 11.5% Large 9.4% 6.4% 12.4% 9.5% 7.3% 11.6% Small 10.8% 6.3% 15.2% 8.0% 3.1% 12.8% Biotechnology All 10.6% 6.0% 15.3% 12.9% 9.8% 16.0% Large 9.1% 4.0% 14.1% 10.9% 8.2% 13.6% Small 13.6% 8.5% 18.8% 14.9% 10.5% 19.2% Device All 11.3% 9.4% 13.3% 13.7% 12.0% 15.4% Large 10.1% 7.6% 12.6% 12.8% 10.7% 14.9% Small 11.8% 9.4% 14.2% 14.2% 12.3% 16.0%

27
Table 6
Bivariate Correlations: Betas, R&D / Sales, Log Market Equity, and L-T Debt / Value
CAPMj ,
RFMKTj , SMBj , HMLj , R&D / sales
Log mkt. equity
L-T debt / value
2001-2005
CAPMj , 1.00
RFMKTj , 0.89 1.00
SMBj , 0.21 0.00 1.00
HMLj , -0.43 -0.06 0.11 1.00
R&D / sales 0.63 0.47 0.01 -0.53 1.00
Log mkt. equity -0.11 0.07 -0.70 -0.04 0.00 1.00
L-T debt / value 0.09 0.15 0.20 0.22 0.03 -0.04 1.00
2006-2008
CAPMj , 1.00
RFMKTj , 0.96 1.00
SMBj , 0.10 -0.17 1.00
HMLj , 0.01 -0.05 -0.04 1.00
R&D / sales 0.41 0.36 0.19 -0.16 1.00
Log mkt. equity -0.30 -0.18 -0.44 0.06 -0.15 1.00
L-T debt / value 0.04 0.04 -0.03 0.19 -0.03 -0.07 1.00
Note: Bold values significant at 0.05 level for two-tailed test.

28
Table 7
Cross-Sectional Determinants of CAPM and FF Beta Estimates
2001-2005 (100 co.)
2006-2008 (99 co.)
Risk Measure Variable Coef. p-value Coef. p-value
CAPMj , Biotechnology 0.282 0.041 0.145 0.258 Device -0.002 0.986 0.272 0.015
R&D / Sales 1.173 0.000 1.052 0.025 Log Market Equity -0.045 0.072 -0.043 0.128 Constant 1.187 0.006 0.822 0.006 Adj. R2 0.434 0.263
RFMKTj , Biotechnology 0.136 0.344 0.120 0.397 Device 0.022 0.882 0.239 0.044
R&D / Sales 0.827 0.000 0.982 0.036 Log Market Equity 0.019 0.503 -0.013 0.659 Constant 0.274 0.585 0.556 0.083 Adj. R2 0.237 0.176
SMBj , Biotechnology 0.193 0.211 0.092 0.694 Device -0.032 0.829 0.026 0.909
R&D / Sales -0.157 0.478 0.535 0.240 Log Market Equity -0.305 0.000 -0.222 0.000 Constant 4.715 0.000 2.223 0.000 Adj. R2 0.504 0.212
HMLj , Biotechnology -0.318 0.114 0.267 0.257 Device 0.051 0.770 0.646 0.013
R&D / Sales -1.144 0.000 -0.246 0.568 Log Market Equity -0.002 0.961 0.087 0.114 Constant 0.254 0.680 -0.945 0.128 Adj. R2 0.306 0.107
Note: Bold values significant at 0.05 level for a two-tailed test with robust standard errors.