Cost of capital for onshore wind in EU
37
Cost of Capital for Onshore Wind in EU Webinar Leonardo ENERGY & Ecofys David de Jager 11/02/2016
-
Upload
european-copper-institute -
Category
Technology
-
view
1.254 -
download
1
Transcript of Cost of capital for onshore wind in EU

Cost of Capital for Onshore Wind in EU
Webinar Leonardo ENERGY & Ecofys
David de Jager
11/02/2016

© ECOFYS | |
Agenda
11/02/2016 David de Jager
Risks, Finance and Policies
DiaCore: Cost of capital for onshore wind in Europe
Reducing cost of capital
Conclusion

© ECOFYS | |
Agenda
11/02/2016 David de Jager
Risks, Finance and Policies
DiaCore: Cost of capital for onshore wind in Europe
Reducing cost of capital
Conclusions

© ECOFYS | |
Risks, finance and policies
Planning Construction Operation
11/02/2016 David de Jager
Baseline rate (country risks)
Social risks
Administrative risks
Financing risks
Technical & management risks
Grid access
Policy design risks
Market & regulatory risks
Sudden policy change risks
Finance
Policies
Risk

© ECOFYS | |
0%
20%
40%
60%
80%
100%
Technology costs Taxes Finance cost Total
Breakdown of levelised cost of onshore wind (investor perspective, non-recourse finance)
CAPEX OPEX Tax Interest Risk premium equity
Finance costs can be significant
11/02/2016 David de Jager
70-80 €/MWh
Discount rate of 15% vs 7.5%

© ECOFYS | |
Project finance: Key financial parameters
> DEVEX, CAPEX, OPEX and decommissioning cost
> TIME (development, construction, debt, fiscal, etc.)
> Debt / Equity
– Finance structure (leverage, senior/junior debt, mezzanine, linear/annuity)
– Interest / discount rates
– Terms
– Debt Service Coverage Ratio (DSCR): affects debt/equity ratio
> Taxes
– Tax structure
– Tax rate(s)
– Depreciation
> Income
– Power purchase agreement
– RE support scheme
11/02/2016 David de Jager

© ECOFYS | |
-250
-200
-150
-100
-50
0
50
100
150
200
250
1 2 3 4 5 6 7 8 9 10 11 12 13 14 15 16 17 18 19 20 21 22 23 24 25 26 27 28 29 30 31 32 33 34
DEVEX CAPEX OPEX Decommissiong Energy sales Interest Repayment Tax
Cash flow of a 500 MW offshore wind energy project(investor perspective, in M€)
11/02/2016 David de Jager
Shape of free cash flow determines the overall net present value and internal rate of return
Develo
pm
ent
Decom
mis
sio
nin
g
Operation
FID
Constr
uction

© ECOFYS | |
Free cash flow
11/02/2016 David de Jager
-300
-200
-100
0
100
200
300
0 5 10 15 20 25 30 35
Free cash flow - nominal vs discounted (@ 15%)
Free cash flow (investor) Discounted Free cash flow (investor)

© ECOFYS | |
-300
-200
-100
0
100
200
300
0 5 10 15 20 25 30 35
Free cash flow - nominal vs discounted (@ 15%)
Free cash flow (investor) Discounted Free cash flow (investor)
Free cash flow
11/02/2016 David de Jager
Risks early in the project lifecycle have higher impact on net present value
RISK
RISK
RISK
RISK
RISK

© ECOFYS | |
Agenda
11/02/2016 David de Jager
Risks, Finance and Policies
DiaCore: Cost of capital for onshore wind in Europe
Reducing cost of capital
Conclusion

© ECOFYS | | 11/02/2016 David de Jager
www.diacore.eu

© ECOFYS | |
DiaCore subtask: Enhancing RES investment
> Main objectives:
– Examine the role of risk and its influence on investments in the RES
sector
– Compare the cost of capital and show why it matters
– Provide solutions in order to enhance investments in the RES sector
> Scope of research:
– What is the range between cost of capital in the 28 EU MS for wind
onshore projects and why is there such a range?
– Which risks to wind onshore projects have which impact on RES
investments?
– How do changes in policy design affect costs of capital?
11/02/2016 David de Jager

© ECOFYS | |
Methodology
11/02/2016 David de Jager
Model
•Estimation of costs of capital & ranking of wind onshore-investments risks
•Comprehensive literature study
•Application of RE-frame barriers database (more than 900 listed barriers)
•Draft of 28 EU MS country profiles
Evaluation
•Interviews with financial experts (more than 80 interviews in 26 MS)
•Evaluation of underlying assumptions of model & estimated parameters
•Adaptation of model based on input from interviews
Results
•Aggregation of EU-wide data
•Presentation of results and feedback from more than 40 national experts
•Preparation of deliverables: Country profiles, policy toolbox & final report

© ECOFYS | |
Perceived risks - ranking
11/02/2016 David de Jager

© ECOFYS | |
Perceived risks(based on interviews for onshore wind)
11/02/2016 David de Jager
© ECOFYS | |
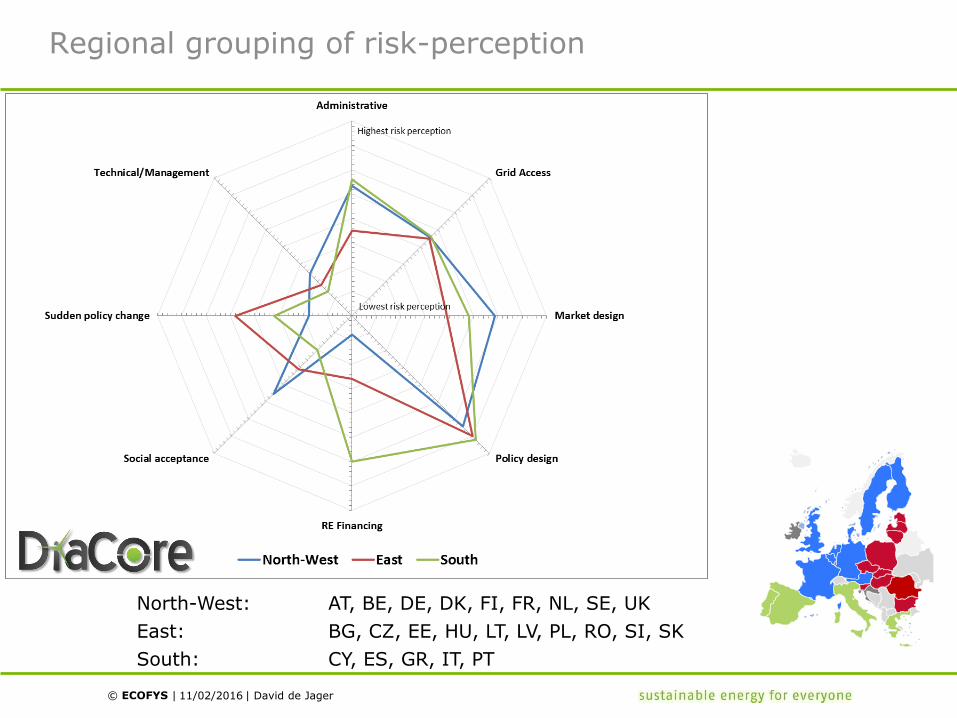
Regional grouping of risk-perception
11/02/2016 David de Jager
North-West: AT, BE, DE, DK, FI, FR, NL, SE, UK
East: BG, CZ, EE, HU, LT, LV, PL, RO, SI, SK
South: CY, ES, GR, IT, PT

© ECOFYS | |
Cost of Equity(approximation based on interviews for onshore wind)
11/02/2016 David de Jager
Cost of Equity across the EU-28
(interview results for onshore wind)

© ECOFYS | |
Cost of Debt(approximation based on interviews for onshore wind)
11/02/2016 David de Jager
Cost of Debt across the EU-28
(interview results for onshore wind)

© ECOFYS | |
Debt/Equity Ratios(approximation based on interviews for onshore wind)
11/02/2016 David de Jager
Debt/Equity ratio across the EU-28
(interview results for onshore wind)

© ECOFYS | |
WACC estimations onshore wind(approximation based on interviews)
11/02/2016 David de Jager
𝑾𝑨𝑪𝑪 =𝑬
𝑬+𝑫∗ 𝑹𝒆 +
𝑫
𝑬+𝑫∗ 𝑹𝒅 ∗ (𝟏 − 𝒕𝒂𝒙)

© ECOFYS | |
WACC estimations and support schemes for onshore wind
11/02/2016 David de Jager

© ECOFYS | |
Conclusions DiaCore
> Weighted Average Cost of Capital (WACC) significantly varies across EU
Member States between 3.5% (Germany) and 12% (Greece) for onshore
wind projects in 2014
– Cost of equity: 6% (Germany) and more than 15% (in Estonia, Greece,
Latvia, Lithuania, Romania and Slovenia)
– Cost of debt: 1.8% (Germany) and 12.6% (Greece)
– Debt/equity: 80%/20% to 50%/50%
> High cost of capital lead to increasing wind onshore deployment costs
> Across all EU Member States, the risks induced by policy design is perceived
as most pressing
11/02/2016 David de Jager

© ECOFYS | |
Agenda
11/02/2016 David de Jager
Risks, Finance and Policies
DiaCore: Cost of capital for onshore wind in Europe
Reducing cost of capital
Conclusion

© ECOFYS | |
‘Triple A’ policy ingredients per risk category
Planning Construction Operation
11/02/2016 David de Jager
Baseline rate (country risks)
Social risks
Administrative risks
Financing risks
Technical & management risks
Grid access
Policy design risks
Market & regulatory risks
Sudden policy change risks

© ECOFYS | |
Country risk
11/02/2016 David de Jager
> Political stability
> Societal stability (e.g. strikes)
> Structure of governance
> Legal system
> Corruption
> Exchange rate fluctuations
> Economic situation and development
• Generic conditions applicable
to all investments
• Differ per Member State

© ECOFYS | |
Country risk
11/02/2016 David de Jager
> Political stability
> Societal stability (e.g. strikes)
> Structure of governance
> Legal system
> Corruption
> Exchange rate fluctuations
> Economic situation and development
• Role of RE in value creation and
long-term economic development
• Role of RE in reducing country risk
Policy ingredients
• Promote strategic investment
• Link investment to employment
creation and capacity building
• Supplier development
programmes
• Local Content
Requirements (LCRs)
• Develop industrial clusters
• Improve cooperation between
public and private R&D
• Enhance know-how through
education & training

© ECOFYS | |
Social acceptance risks
> Delay or cancellation of projects (NIMBY/NOPE)
> Higher DEVEX and longer development periods
11/02/2016 David de Jager
Policy ingredients
• Stakeholder participation
• New/innovative democratic models
• (Partial/Initiated) Co-development by government
• Streamline administrative procedures, and manage them properly
• Enable or prescribe financial participation (e.g. crowdfunding)
• Facilitate citizen project ownership
• Address distributional impact of renewable energy support policies

© ECOFYS | |
Administrative risks
> Long and complex procedures increase project risk
– Spatial planning
– Environmental impact
– Health and Safety
– …
11/02/2016 David de Jager
Policy ingredients
• Streamline and align administrative procedures, and manage
them properly
• Educate/train civil servants
• Prepare guidelines / best practices
• One-stop shops

© ECOFYS | |
Financing risks
> During the project development phase the market, financial, economic
and/or policy circumstances might change
> How to ensure that projects are bankable and investable after the
development phase or at the moment of re-financing?
11/02/2016 David de Jager
Policy ingredients
• Government or public/private investment funds and bank
• Catalyst
• Safety-net
• Loan guarantees
• Export credit facilities
• Align policy support with finance practices (e.g. frontloading,
banking/flexibility)

© ECOFYS | |
Technical & management risks
> Risk of budget overruns for key financial parameters (DEVEX, CAPEX, OPEX)
> Risk of lower energy production
> Typically main responsibility of project developer
11/02/2016 David de Jager
Policy ingredients
• Performance and risk databases for new/innovative technologies
• Guarantees / insurance (e.g. for drilling for geothermal energy)
© Ecofys

© ECOFYS | |
Grid access risks
> No access to grid = no project return
> Grid access risks:
– Development phase: grid access procedure / timing
– Start of operation phase: risk of delays in grid connection
– Operation phase: reliability of operation, risk of curtailment
11/02/2016 David de Jager
Policy ingredients
• Clear procedures and processes (governments/regulators/TSOs)
• Right to grid access
• Liabilities and compensation in case of delayed or interrupted
access, or curtailment

© ECOFYS | |
Policy design risks
> Policy dependence of RE deployment is a risk factor
> Policy design affects project risk
11/02/2016 David de Jager
Policy ingredients
• Reduce revenue risk by using contracts for difference instead of
fixed premium systems
• Flexibility / banking
• Reduce compliance risk by a careful tender design
• Increased predictability of policy influences on market
development (e.g. market restructuring)

© ECOFYS | |
Market design and regulatory risks
> Market risks related to government energy strategy and power market
liberalisation
11/02/2016 David de Jager
Policy ingredients
• Reduce the revenue risk by continued RES support in times of
moderately negative electricity prices
• Provide compensation for RES generators in case of grid related
curtailment of RES generation

© ECOFYS | |
Sudden policy change risks
> The risk of any unexpected, unanticipated, short-term announced or sudden
changes of policies or policy design features.
11/02/2016 David de Jager
Policy ingredients
• Don’t do it
• Design responsive yet predictable policy instruments
• Integrate RE policies into economic and industrial policy
frameworks

© ECOFYS | |
Agenda
11/02/2016 David de Jager
Risks, Finance and Policies
DiaCore: Cost of capital for onshore wind in Europe
Reducing cost of capital
Conclusion

© ECOFYS | |
Conclusion
Key features of Triple A policies for RE:
> Tailor-made, addressing key financial challenges of a particular
product/market combination and country
> Aligned to one another and embedded in a broader economic policy context
> If all countries would have the same renewable energy policy risk profile as
the best in class, EU Member States could reduce the policy costs for wind
onshore by more than 15%
> RE policies should result in a dynamic, responsive ‘lock-in’
into renewable energy
> The lock-in provides the investor certainty which will drive cost reductions
through innovations, learning, and economies of scale, and through lower
cost of capital
11/02/2016 David de Jager

© ECOFYS | |
David de Jager
Principal Consultant
Ecofys Netherlands b.v.
I: www.ecofys.com
T: +31 30 6623388
11/02/2016 David de Jager
www.diacore.eu