Cost Estimation Chapter 5 Copyright © 2011 by The McGraw-Hill Companies, Inc. All rights...
46
Cost Estimation Chapter 5 Copyright © 2011 by The McGraw-Hill Companies, Inc. All rights reserved. McGraw-Hill/Irwin 5 - 1
-
Upload
molly-dawson -
Category
Documents
-
view
218 -
download
1
Transcript of Cost Estimation Chapter 5 Copyright © 2011 by The McGraw-Hill Companies, Inc. All rights...

Cost Estimation
Chapter 5
Copyright © 2011 by The McGraw-Hill Companies, Inc. All rights reserved.McGraw-Hill/Irwin 5 - 1
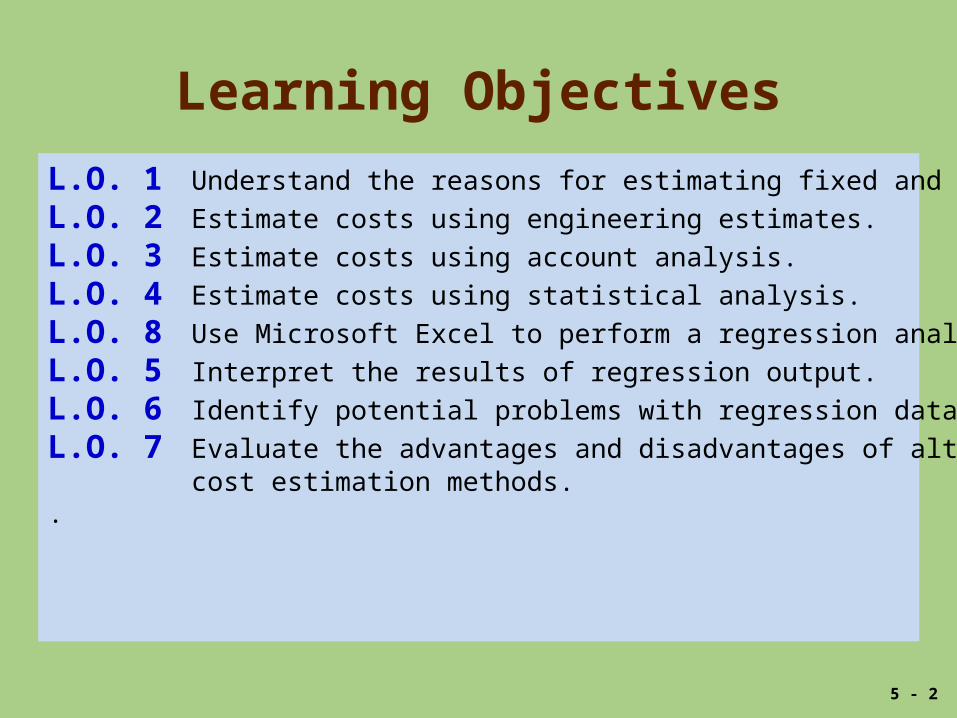
Learning Objectives
L.O. 1 Understand the reasons for estimating fixed and variable costs.
L.O. 2 Estimate costs using engineering estimates.
L.O. 3 Estimate costs using account analysis.
L.O. 4 Estimate costs using statistical analysis.
L.O. 8 Use Microsoft Excel to perform a regression analysis
L.O. 5 Interpret the results of regression output.
L.O. 6 Identify potential problems with regression data.
L.O. 7 Evaluate the advantages and disadvantages of alternativecost estimation methods.
.
5 - 2

Why Estimate Costs?
• Managers make decisions and need to comparecosts and benefits among alternative actions.
Key question:
• What adds value to the firm?
• Cost estimates can be an important element inhelping managers make decisions.
5 - 3

Basic Cost Behavior PatternsL.O. 1 Understand the reasons for estimating fixed and variable costs.
Costs
Fixed costs Variable costs
Total fixed costs do notchange proportionately
as activity changes.
Per unit fixed costschange inversely as
activity changes.
Total variable costschange proportionately
as activity changes.
Per unit variable costremain constant asactivity changes.
5 - 4

Methods Used to EstimateCost Behavior
• Charlene, owner of Charlene’s Computer Care (3C),wants to estimate the cost of a new computerrepair center.
3 Methods:• Engineering estimates
• Account analysis
• Statistical methods
LO1
5 - 5
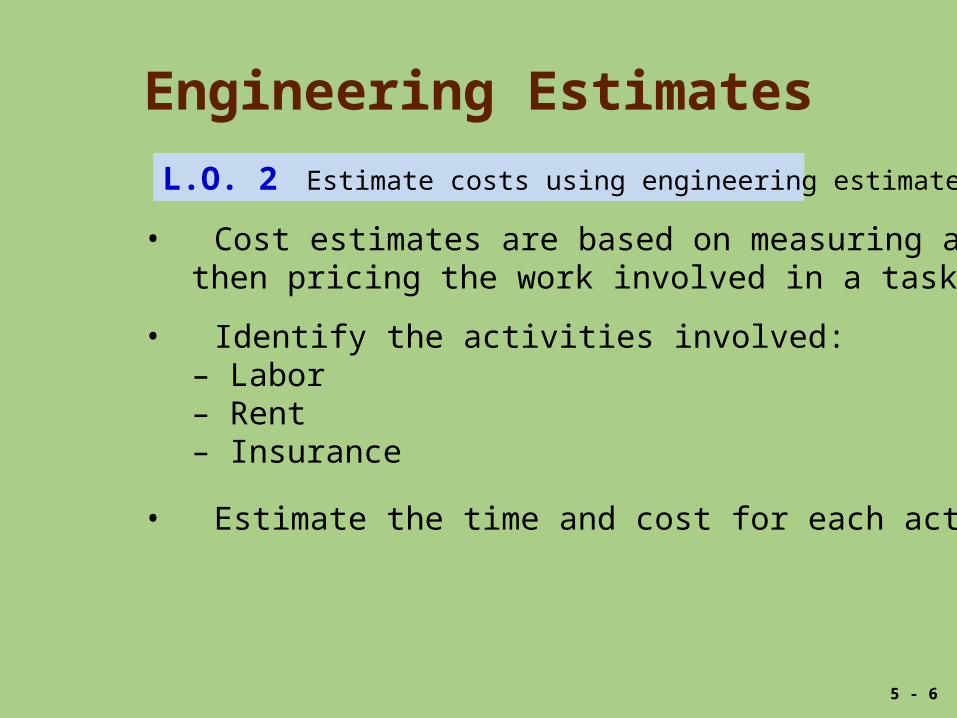
Engineering Estimates
L.O. 2 Estimate costs using engineering estimates.
• Cost estimates are based on measuring andthen pricing the work involved in a task.
• Identify the activities involved:– Labor– Rent– Insurance
• Estimate the time and cost for each activity.
5 - 6

Engineering Estimates
Advantages:• Details each step required to perform an operation
• Permits comparison of other centers with similar operations
• Costs for totally new activities can be estimated withoutprior activity data.
Disadvantages:• Can be quite expensive to use
LO2
• Based on optimal conditions
5 - 7
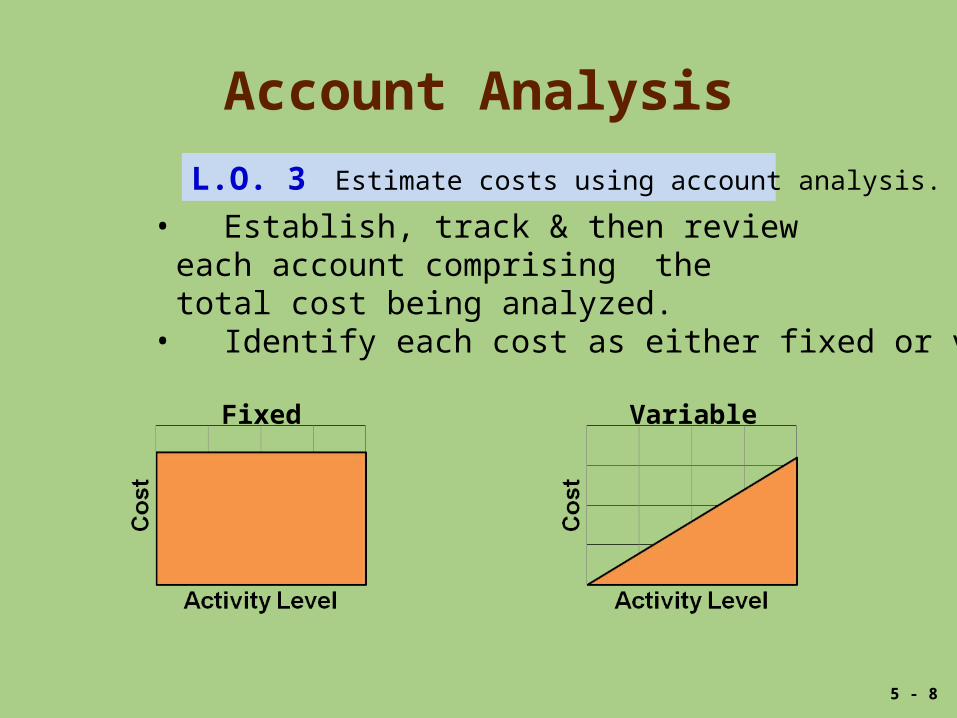
Account Analysis
L.O. 3 Estimate costs using account analysis.
• Establish, track & then review each account comprising the total cost being analyzed.
• Identify each cost as either fixed or variable.
Fixed Variable
5 - 8

Account AnalysisExhibit 5.1
John’s cost estimation using account analysis
LO3
5 - 9
Factory Overhead at 4,519 Machine Hours
Total Variable FixedRent $ 20,784 $ 9,696 $ 11,088
Utilities $ 15,588 $ 7,272 $ 8,316
Administration $ 20,784 $ 9,696 $ 11,088
Supplies $ 10,392 $ 4,848 $ 5,544
Maintenance $ 31,175 $ 14,543 $ 16,632 Other $ 5,196 $ 2,424 $ 2,772 Totals $ 103,918 $ 48,478 $ 55,440
Demo problem 1
What is the variable cost per machine hour?

Account AnalysisDemo 1
Cost estimation using account analysis
Fixed costs + (Variable cost/unit × No. of units) = Total cost
LO3
5 - 11
Determine the cost formula.

Account Analysis
Advantages:• Managers and accountants are familiar with
company operations and the way costs reactto changes in activity levels.
Disadvantages:
• Relies heavily on judgment of Managers and accountants who may be biased.
• Decisions often have major economic consequencesfor managers and accountants.
LO3
5 - 12
• Cost of data collection may surpass benefit.
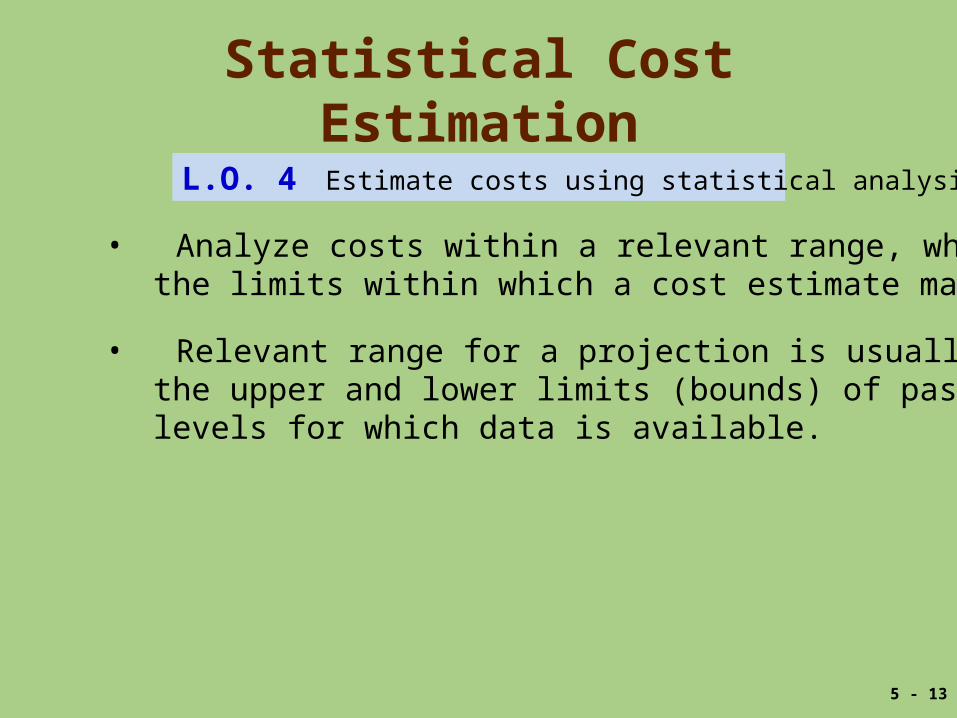
Statistical Cost Estimation
L.O. 4 Estimate costs using statistical analysis.
• Analyze costs within a relevant range, which isthe limits within which a cost estimate may be valid.
• Relevant range for a projection is usually betweenthe upper and lower limits (bounds) of past activitylevels for which data is available.
5 - 13
LO4
5 - 14
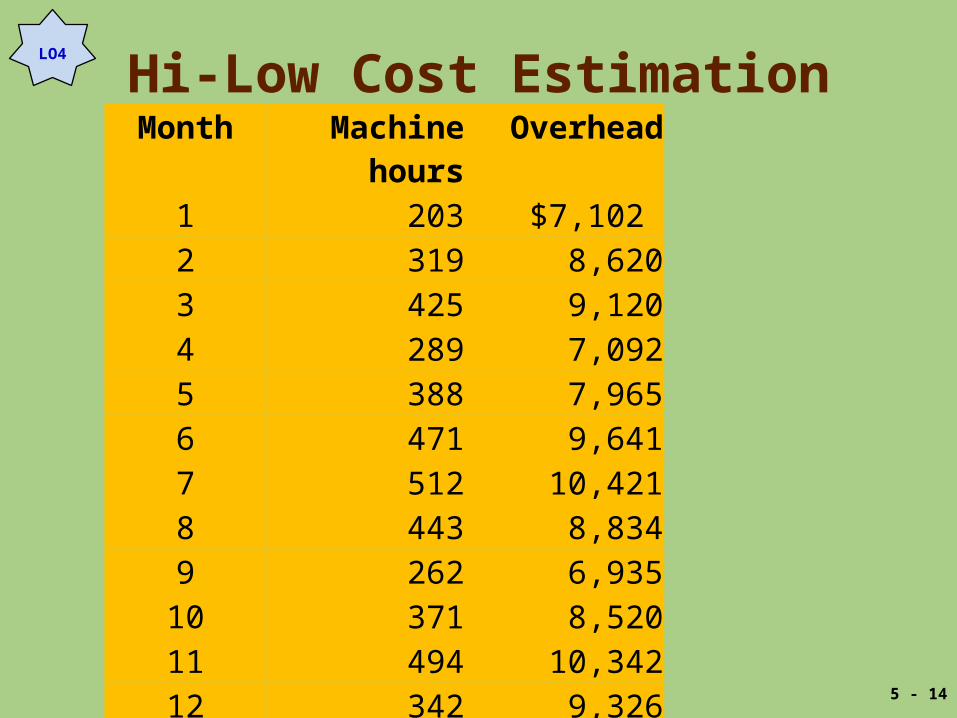
Hi-Low Cost EstimationMonth Machine
hoursOverhead
1 203 $7,102 2 319 8,6203 425 9,1204 289 7,0925 388 7,9656 471 9,6417 512 10,4218 443 8,8349 262 6,935
10 371 8,52011 494 10,34212 342 9,326
Total 4,519 $103,918

Demo 2

Hi-Low Cost Estimation
• This is a method to estimate cost based on two costobservations, the highest and lowest activity level.
High
Low
Change
MonthOverhead
costsRepair-hours
LO4
5 - 16

Hi-Low Cost Estimation
Variable cost per unit (V) =
(Cost at highest activity level – Cost at lowest activity level)(Highest activity level – Lowest activity level)
Fixed cost (F) =
Total cost athighest activity
– (Variable cost × Highest activity level)
Total cost atlowest activity
– (Variable cost × Lowest activity level)
or
LO4
5 - 17
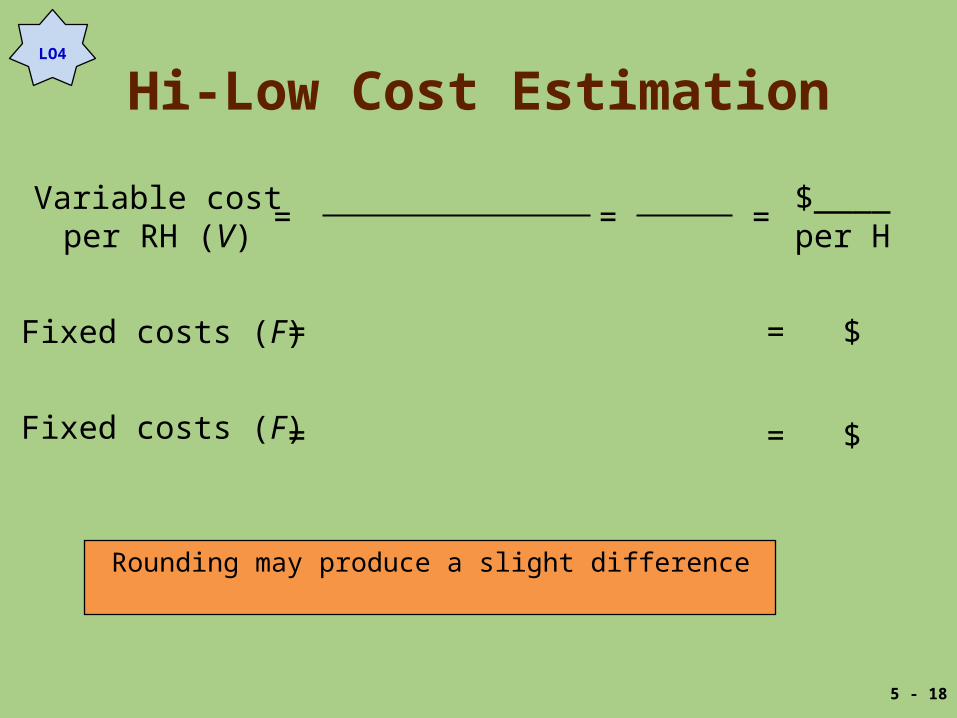
Hi-Low Cost Estimation
Variable costper RH (V)
= = =$____per H
Fixed costs (F) = = $
Fixed costs (F) = = $
Rounding may produce a slight difference
LO4
5 - 18

Hi-Low Cost Estimation
Variable costper RH (V)
= = =
Fixed costs (F) = =
Fixed costs (F) = =
LO4
5 - 19
$3,319
309
$10,421 – [10.74 x512]
$7,102 – [10.74 x203]
Rounding may produce a slight difference
$10,421- 7,102
512 – 20310.74
4,922
4,922

Hi-Low Cost Estimation
• How do we estimate manufacturingoverhead with 400 hours?
TC = F + VX
LO4
5 - 20
400 hours:$4,922 + (10.74x400)= $9,218

Regression Analysis
• Regression is a statistical procedure todetermine the relation between variables.
• It helps managers determine how well theestimated regression equation describesthe relations between costs and activities.
LO4
5 - 21
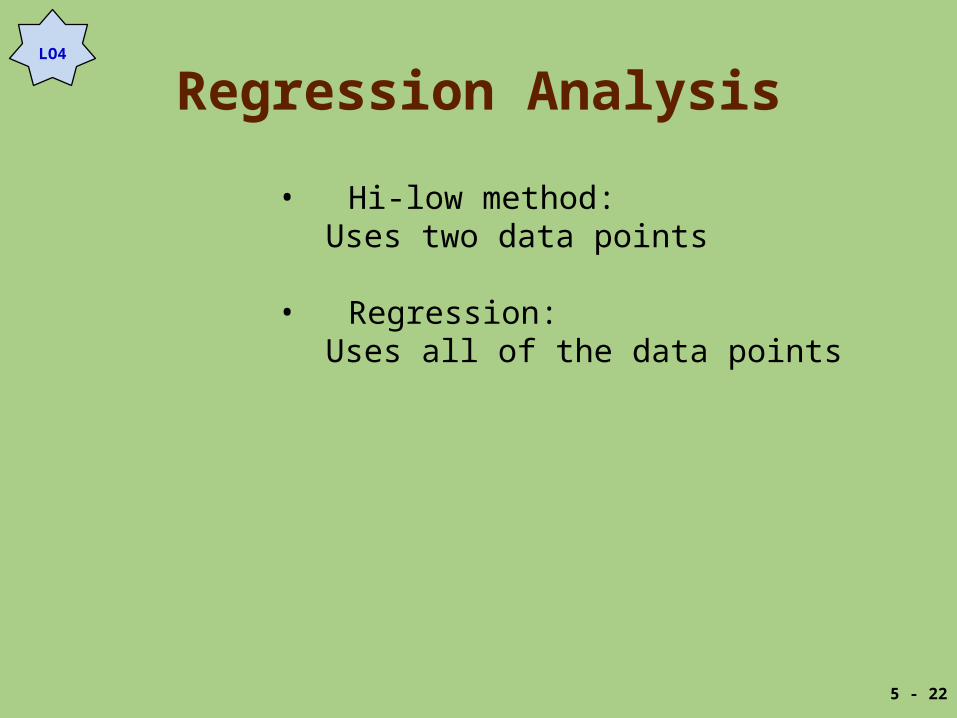
Regression Analysis
• Hi-low method:Uses two data points
• Regression:Uses all of the data points
LO4
5 - 22

Regression Analysis
The Regression Equation:
Y = a + bX
LO4
5 - 23

Microsoft as a Tool
L.O. 8 (Appendix A) Use Microsoft Excelto perform a regression analysis.
• Demo 3 will serve as our Example.
• Interpreting the output is the key to the analysis.
5 - 24

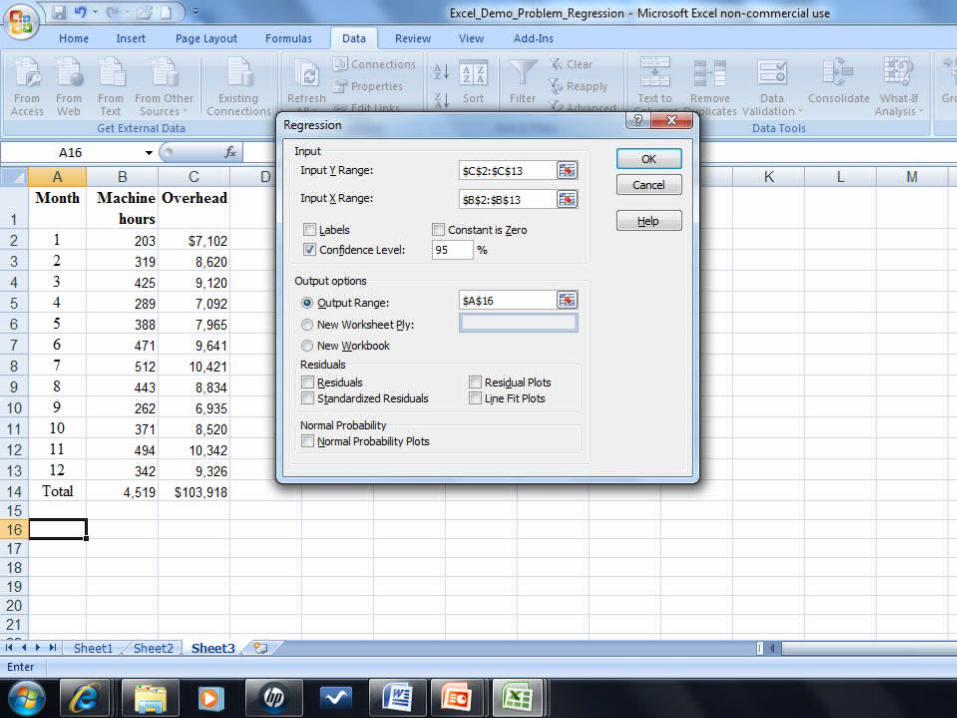
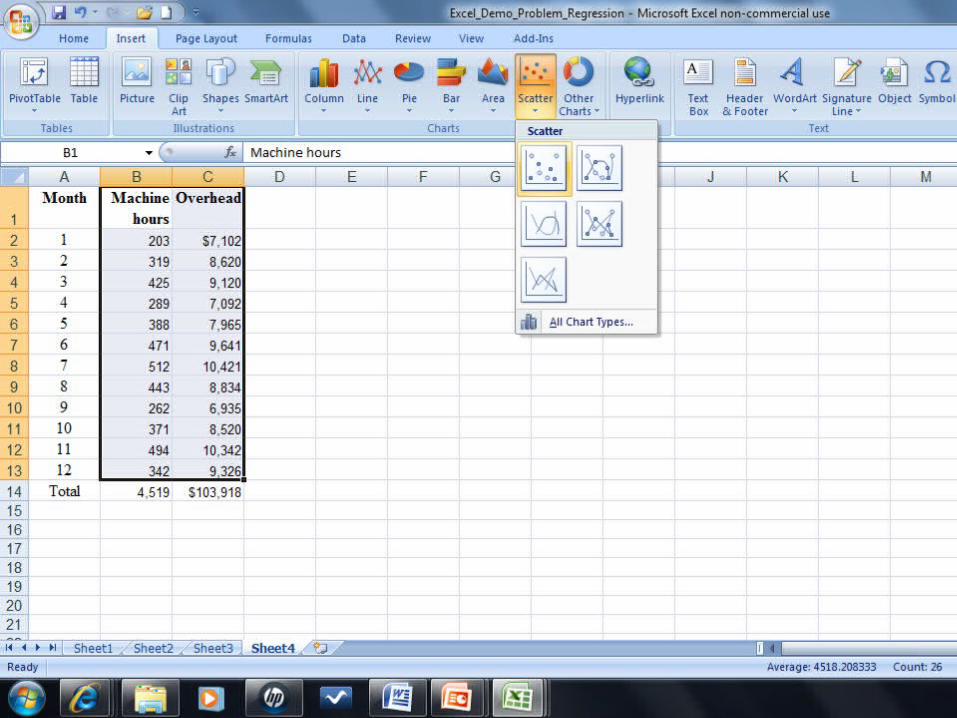
Microsoft as a Tool♦ The following steps are based Microsoft Office 2007
• Step 1: Ensure you have the Analysis TookPak installed.
• Step 2: Enter the data for the Dependent and Independent Variables.
• Step 3: Select Regression from the Data Analysis option.
• Step 4: Select the data to use in the regression.• Step 5: Run the regression.


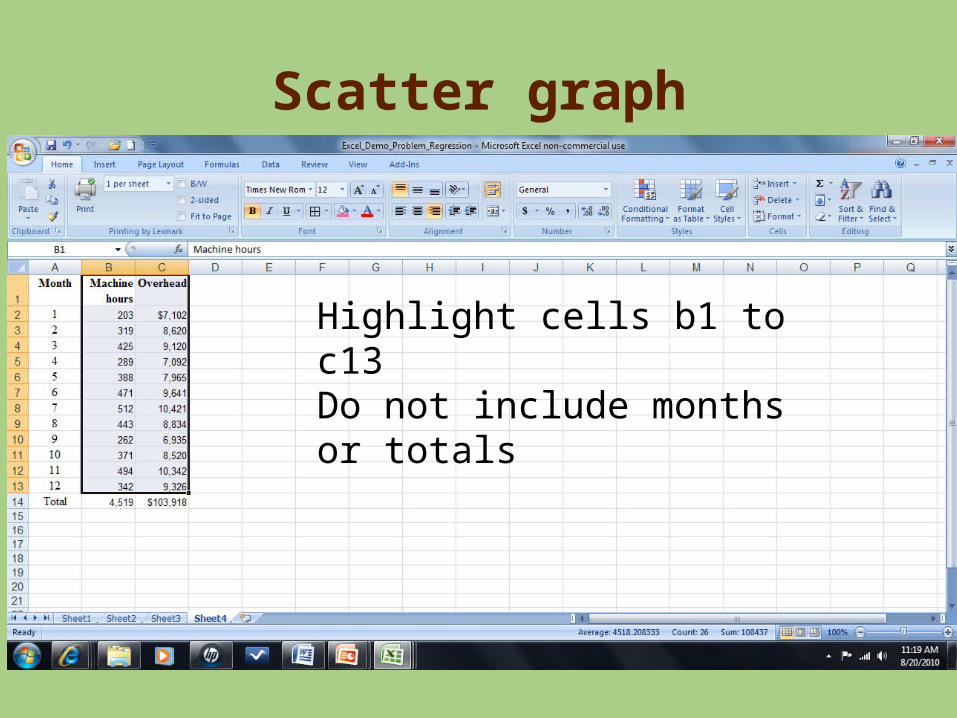
Scatter graph
Highlight cells b1 to c13Do not include months or totals

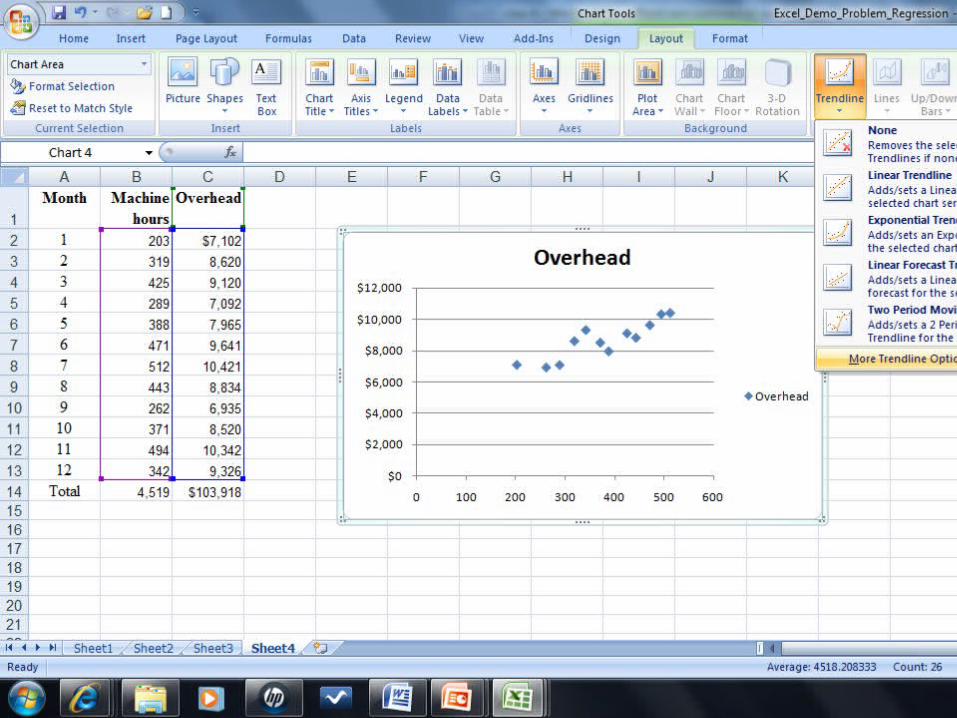


Interpreting Regression
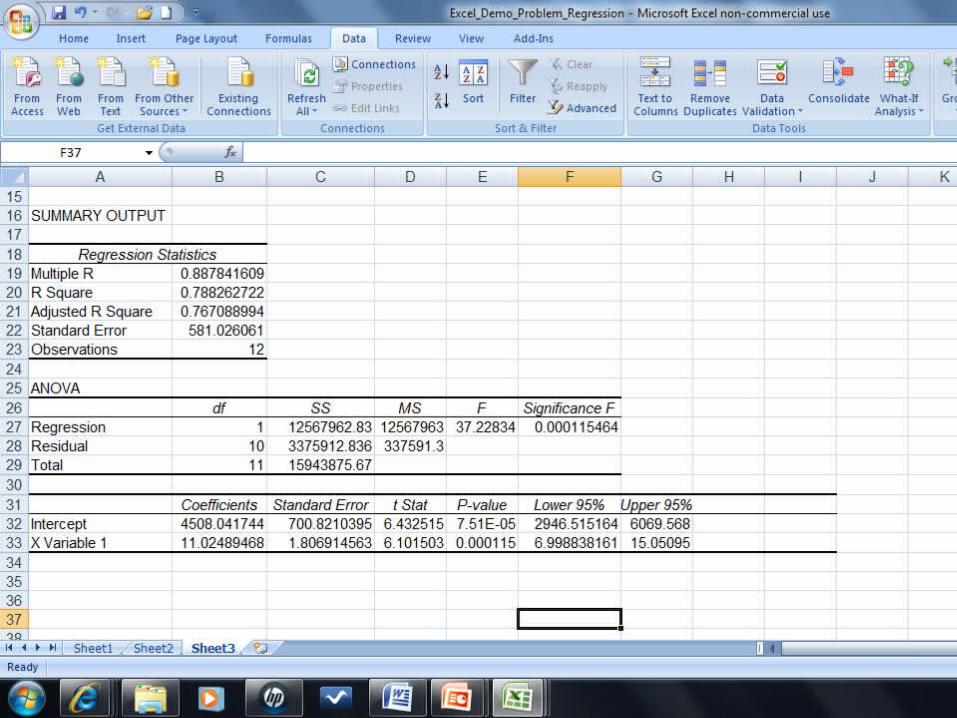
• The computer output of scatter graphgives the following formula:
Total overhead = $4,508 + ($11.025 per MH × No. of MH)
• Estimate 3C’s overhead with 400 repair hours.
TC = F + VX
TC = $6,508 + ($11.02 × 400) = $8,916
LO5
5-34

Interpreting Regression
L.O. 5 Interpret the results of regression output.
• Independent variable: Fixed Costs– Coefficients/Intercept
• Dependent variable: Variable costs– Coefficients/X Variable 1
5 - 35

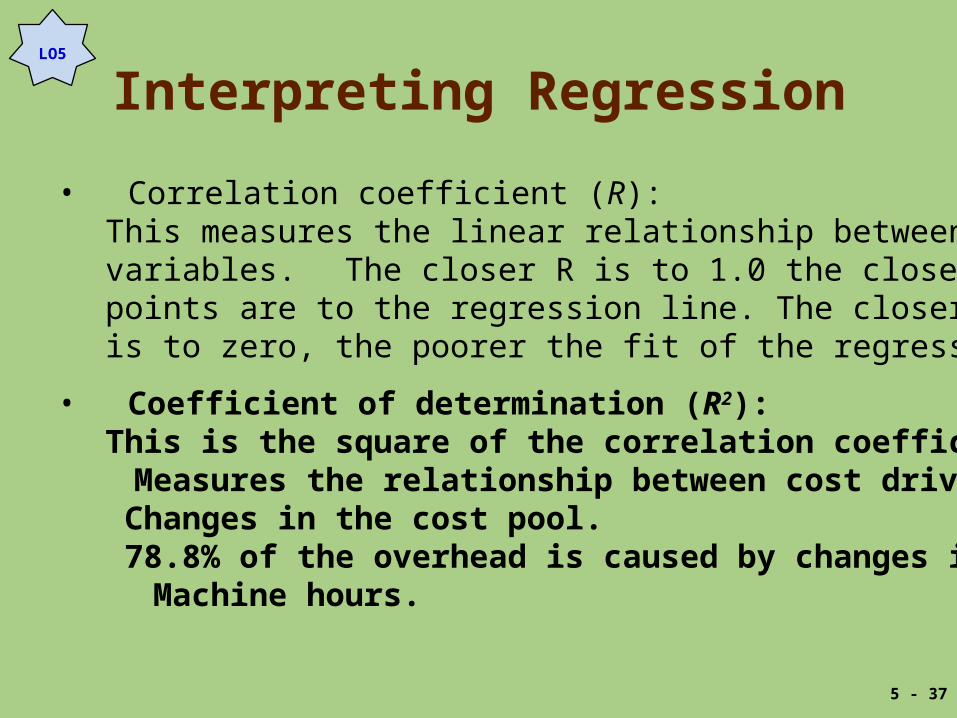
Interpreting Regression
• Correlation coefficient (R):This measures the linear relationship betweenvariables. The closer R is to 1.0 the closer thepoints are to the regression line. The closer Ris to zero, the poorer the fit of the regression line.
• Coefficient of determination (R2):This is the square of the correlation coefficient.
Measures the relationship between cost driver and Changes in the cost pool. 78.8% of the overhead is caused by changes in
Machine hours.
LO5
5 - 37
Interpreting Regression
• T-statistic:Generally, if it is over 2, then it is considered significant.
If significant, the cost is NOT totally fixed.
LO5
5 - 39
95% Confidence:Gives a range where you can have 95% confidence that the variable cost coefficient is between the upper & lower levels.


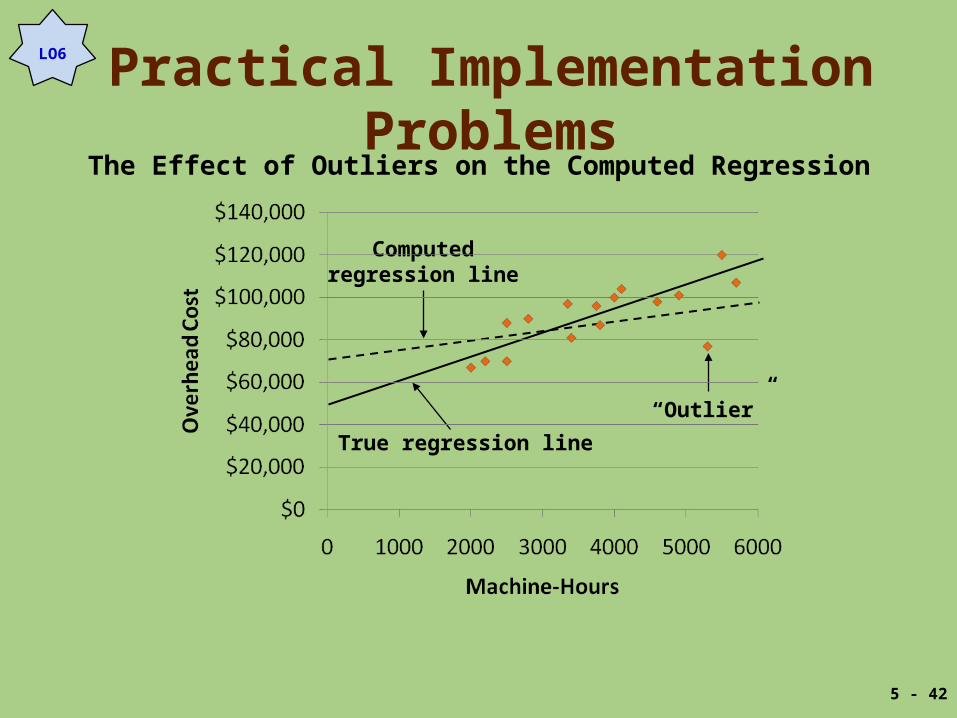
Practical Implementation Problems
L.O. 6 Identify potential problems with regression data.
• Effect of:– Nonlinear relations– Outliers– Spurious relations– Using data that do not fit the assumptions
of regression analysis
5 - 41
Practical Implementation Problems
Computedregression line
True regression line
“Outlier”
The Effect of Outliers on the Computed Regression
LO6
5 - 42

Practical Implementation Problems
• Problem:Outliers move the regression line.
• Solution:Prepare a scattergraph, analyze the graph,and eliminate highly unusual observationsbefore running the regression.
LO6
5 - 43

Statistical Cost Estimation
L.O. 7 Evaluate the advantages and disadvantagesof alternative cost estimation methods.
Advantages:• Reliance on historical data is relatively inexpensive.• Computational tools allow for more data to be used
than for non-statistical methods.
Disadvantages:• Reliance on historical data may be the only readily
available, cost-effective basis for estimating costs.• Analysts must be alert to cost-activity changes.
5 - 44

Effect of Different Methodson Cost Estimates
• Estimated manufacturing overhead with 400 repair-hours.
LO7
5 - 45

Data Problems
• Missing data
• Outliers
• Allocated and discretionary costs
• Inflation
• Mismatched time periods
LO7
5 - 46