Cost-Effectiveness of Reductions in Greenhouse Gas Emissions from High- Speed Rail and Urban...
15
Cost-Effectiveness of Reductions in Greenhouse Gas Emissions from High-Speed Rail and Urban Transportation Projects in California Juan Matute and Mikhail V. Chester
-
Upload
jarvis-howey -
Category
Documents
-
view
215 -
download
0
Transcript of Cost-Effectiveness of Reductions in Greenhouse Gas Emissions from High- Speed Rail and Urban...
Cost-Effectiveness of Reductions in Greenhouse Gas Emissions
from High-Speed Rail and Urban Transportation Projects in
California
Juan Matute and Mikhail V. Chester

California auctions the right to emit Greenhouse Gas Emissions. In FY 2014-15, the state expects at least $832 million in GHG allowance revenues (at ~ $11.50/MTCO2e).
Investments of these revenues must reduce GHG emissions in the state.
Many projects and programs compete for these revenues. The State Legislature determines allocations.- a lack of information about relative cost-effectiveness- projects that reduce GHG emissions for less than allowance
cost produce a net savings
2
Why Cost-Effectiveness?

The Projects
California High Speed Rail - (Phase 1 - Blended)
Los Angeles Metro Orange Line Bus Rapid Transit
Los Angeles Metro Orange Line Bikeway
Los Angeles Metro Orange Line Light Rail Transit
3

Project Geography
California High Speed Rail
● San Francisco to Los Angeles (Anaheim)● 520 miles● CAHSR Authority predicts opening in 2029
4

Project GeographyMetro Orange Line Busway
● 14 miles of 2-lane, predominantly concrete busway● Phase 1 Opened in 2005
Metro Orange Line Bikeway
● 14 miles of asphalt, roughly 14-feet wide● Phase 1 Opened in 2005
Metro Gold Line
● LA Union Station to Sierra Madre● 13.7 Mile OCS light rail● Phase 1 Opened in 2003
5

Project Comparison
Public Capital Subsidy
(millions, 2012$)
Auto to Facility Mode Shift
Air to Facility
Mode Shift% & Avg. MiNear-Term
% & Avg. MiLong-Term
% & Avg. Mi
CA HSR (2012) $44,247 81% (150) 17.23%
CA HSR (2014) $44,247 92% (118) 5.58%
Metro Gold $1,072 25% 52%
Metro Orange BRT $399 4.49% 4.49%
Metro Orange Bike $12 67% 80%
6

Economic Costs Assessed
7
Time
public capital subsidy
public subsidies for operations
net economic savings from project’s users who shift from automobiles or aircraft
Cos
ts
public subsidies for capital costs
public subsidies for operations after the project has been constructed and ridership has stabilized
the full public subsidy required to construct and operate the project
...adjusted by the net economic savings from project’s users who shift from automobiles or aircraft

Variable Economic CostsPublic Operating
Subsidy for Mode Switchers
Facility User Cost for Trip
Avoided User Cost
CA HSR (2012) $52.75 $0.555/mi for avoided auto$97/trip for avoided air
Metro Gold LRT $4.3M $1.50 $0.555/mi for avoided auto
Metro Orange BRT $1.5M $1.50 $0.555/mi for avoided auto
Metro Orange Bike 0 $0.555 for avoided auto
CAUTO = Cost of avoided automobile trips.USHIFT = Number of users shifting from automobiles.D = Distance of competing automobile trip (miles).R = IRS mileage rate ($/mile).
CAIR = Cost of avoided air travel.USHIFT = Number of users shifting from air.Y = Air travel ticket cost.
Avoided Air Trips (for High-speed Rail)
Avoided Automobile Trips
8

GHG Analysis
Sources:Emissions are net over 100-year period From previous studies:
● Metro Gold & Orange Lines: Chester, M., S. Pincetl, Z. Elizabeth, W. Eisenstein, and J. Matute. Infrastructure and automobile shifts: positioning transit to reduce life-cycle environmental impacts for urban sustainability goals. Environmental Research Letters, Vol. 8, no. 1, 2013.
● California High Speed Rail: Chester, M. V., and A. Horvath. High-speed rail with emerging automobiles and aircraft can reduce environmental impacts in California’s future. Environmental Research Letters, Vol. 7, no. 3, 2012.
New study - Metro Orange Line Bikeway● PRé Consultants. SimaPro 8.0.3 using ecoinvent v3 data. 2013.
9

10
Cost-Effectiveness of GHG Reductions from Evaluated Projects
11
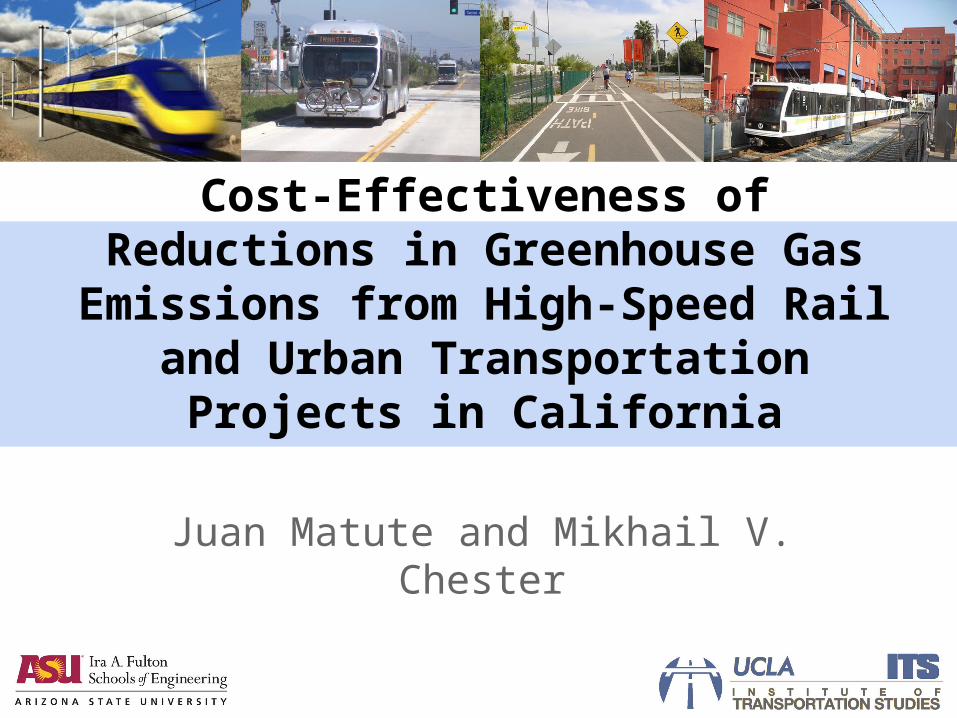
Cost-Effectiveness of GHG Reductions from Evaluated Projects
Public Capital
Cost
Public Operating Subsidy
(marginal case)
Full Public Cost
(Ops + Capital)
Full Public Cost Less Net User
Costs
CAHSR(2012 Business Plan)
$298 - $298 -$335
CAHSR (Independent Study - High) $428 $203 $654 -$109
Orange BRT Line $589 $252 $1,162 -$588
Gold LRT Line $1,767 $724 $3,809 -$882
Bicycle/Pedestrian Pathway (Proportional - 4.49%)
$56 - $56 -$3,561
Bicycle/Pedestrian Pathway(Full – 100%) $2,697 - $2,697 -$5,125
(2012 $/metric tonne CO2-e)
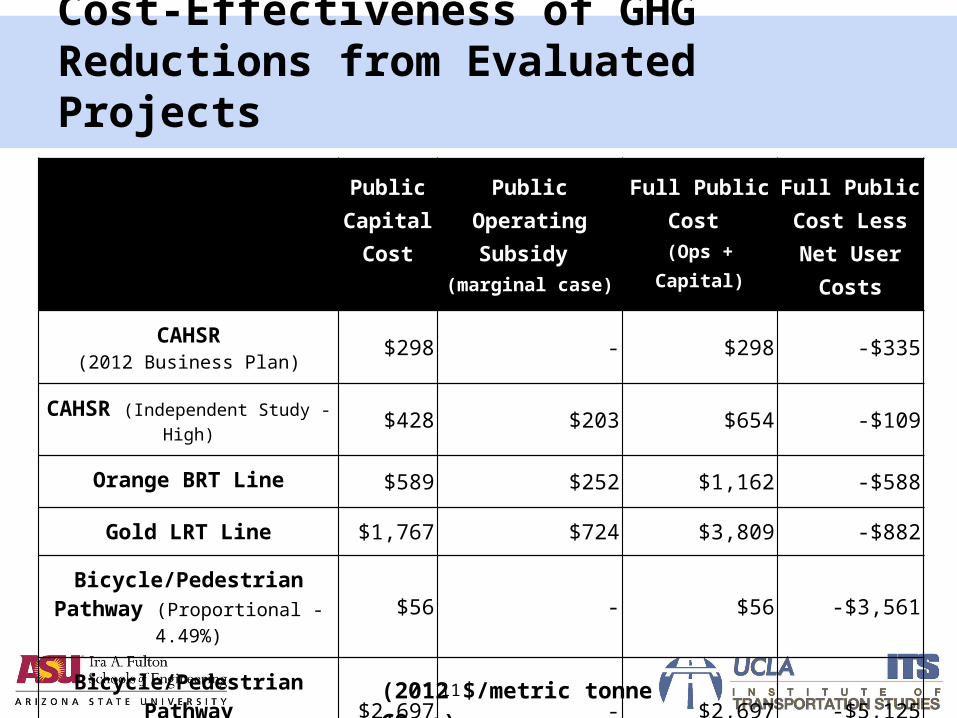
Sensitivity - Range of GHG Reduction Costs
12
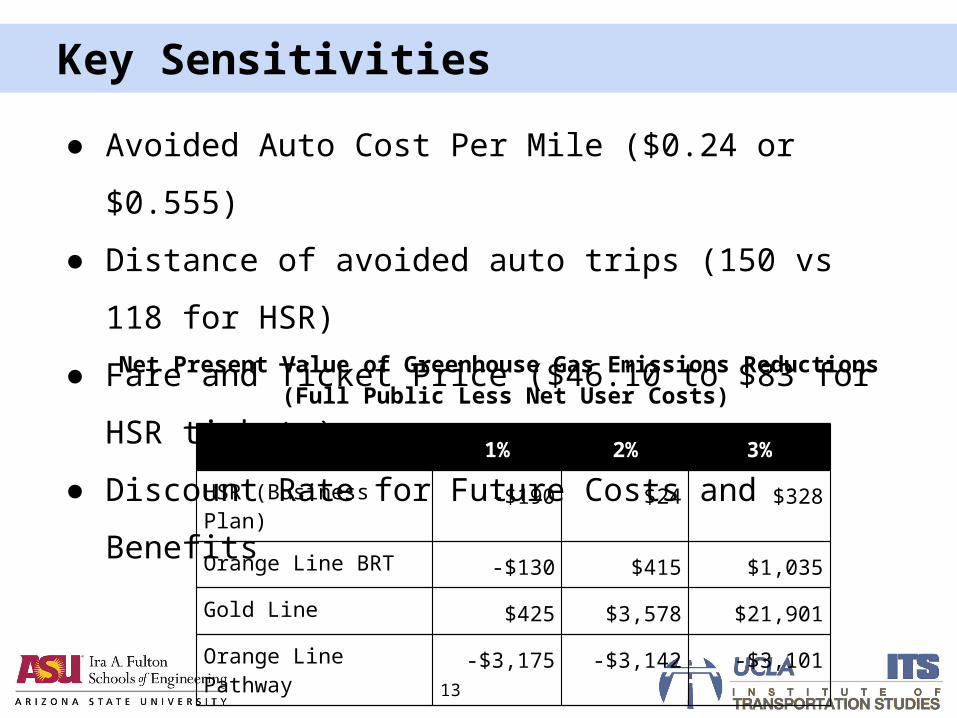
Key Sensitivities
● Avoided Auto Cost Per Mile ($0.24 or $0.555)
● Distance of avoided auto trips (150 vs 118 for
HSR)
● Fare and Ticket Price ($46.10 to $83 for HSR
ticket )
● Discount Rate for Future Costs and Benefits
13
1% 2% 3%
HSR (Business Plan) -$190 $24 $328
Orange Line BRT -$130 $415 $1,035
Gold Line $425 $3,578 $21,901
Orange Line Pathway -$3,175 -$3,142 -$3,101
Net Present Value of Greenhouse Gas Emissions Reductions (Full Public Less Net User Costs)

● Whether a GHG reduction project is cost-effective depends on the costs assessed
● Many GHG abatement projects produce negative costs, which represent a net cost savings independent of the GHG emissions reductions
● Our results are not sensitive to slight variations in the California allowance price (currently $11.50 per tonne).
● Public transit systems typically offer lower GHG emissions per passenger kilometer traveled than a competing automobile trip, but require initial cost and GHG investments to create opportunities for mode shifting and user cost savings.
14
Conclusions

Questions?
Juan MatuteUCLA Institute of Transportation
Mikhail V. ChesterAssistant ProfessorCivil, Environmental, and Sustainable [email protected]