
Cost Effectiveness Analysis for Diagnostic Testingarup.utah.edu/media/costEffectiveEval/Cost...
43
Cost Effectiveness Analysis for Diagnostic Testing Robert Schmidt MD, PhD, MBA Director, Center for Effective Medical Testing University of Utah School of Medicine, Department of Pathology and ARUP Laboratories
Transcript of Cost Effectiveness Analysis for Diagnostic Testingarup.utah.edu/media/costEffectiveEval/Cost...

Cost Effectiveness Analysis for
Diagnostic Testing Robert Schmidt MD, PhD, MBA
Director, Center for Effective Medical Testing University of Utah School of Medicine, Department of Pathology
and ARUP Laboratories

Objectives
• Review the basic types of analyses that support cost-effectiveness analysis
• Describe the opportunities and challenges in applying cost-effectiveness analysis to diagnostic tests
• Examples of how lab data is being used to determine if certain lab testing strategies are cost effective

Hierarchy of Effectiveness
Analytical Performance LOD, precision, linearity, interferences
Clinical Performance Can it discriminate patient groups (sensitivity, specificity)
Clinical Efficacy and Effectiveness Does it affect outcomes?
Cost-Effectiveness Can we afford it?
Societal Impact Is society better off with this test?
Horvath R, et al. 2014

What is the goal of cost effectiveness analysis?
• Economic Perspective: Maximize overall welfare of society • education vs roads vs healthcare
• Clinical Perspective: Maximize welfare of an individual patient

Cost Evaluation Basics
System Resource 1, C1
Heath Outcome, O
Resource 2, C2 Resource 3, C3
Other Value, V
Savings, S

Evaluating Costs: Choice of Perspective
Item Perspective
Societal Healthcare Agency Provider
Productivity losses x
Patient time x
Family time x
Medications x x
Physician Time x x x

Impact of perspective MSS vs NIFT for Down Syndrome
Walker BS, et al. 2014 PMID: 25273838
25273838

Impact of perspective on decision limits Contingent use of NIPT for Down Syndrome
MSS
NIFT
CVS Amnio
“High Risk”
No Further Testing
“Low Risk”
Negative
Positive
Risk by MSS
P(Ri
sk)
“High Risk”
Perspective Optimal Cutoff
NIFT Referral rate
Societal 1:1515 24%
Government 1:420 9%
Payer 1:350 7%
Walker BS, et al. 2015
MSS Cutoff

Threshold optimization
False Positive Rate
True
Pos
itive
Rat
e
Optimal decision limit = f(FPR, TPR, FNR, TNR)

Other costing issues
• Costs vs charges • Discounting • Capital charges • Overhead allocation

Valuing Outcomes
System Resource 1, C1
Heath Outcome, O
Resource 2, C2 Resource 3, C3
Other Value, V
Savings, S

How to Handle Outcomes
• Three Choices
1. Ignore outcomes (cost minimization)
2. Don’t value outcomes, use natural units (cost-effectiveness analysis)
3. Value outcomes a) Utility (cost-utility analysis) b) Money value (cost-benefit analysis)
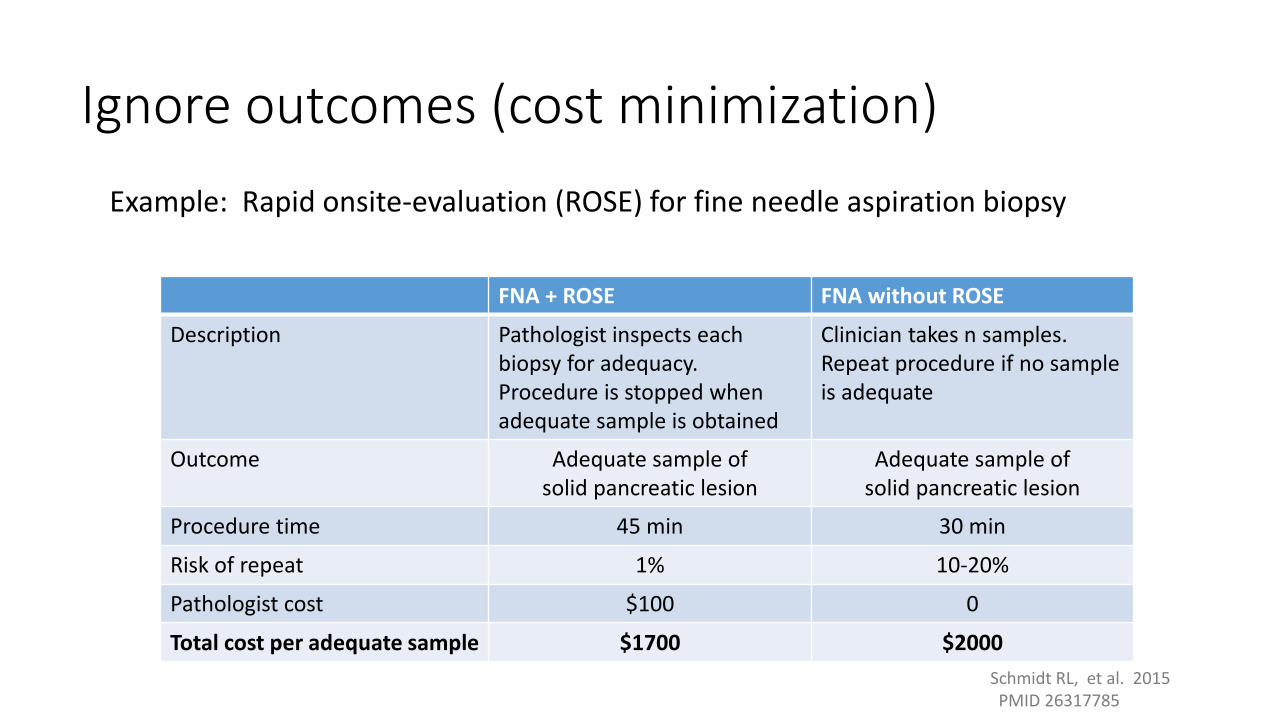
Ignore outcomes (cost minimization) Example: Rapid onsite-evaluation (ROSE) for fine needle aspiration biopsy
FNA + ROSE FNA without ROSE
Description Pathologist inspects each biopsy for adequacy. Procedure is stopped when adequate sample is obtained
Clinician takes n samples. Repeat procedure if no sample is adequate
Outcome Adequate sample of solid pancreatic lesion
Adequate sample of solid pancreatic lesion
Procedure time 45 min 30 min
Risk of repeat 1% 10-20%
Pathologist cost $100 0
Total cost per adequate sample $1700 $2000 Schmidt RL, et al. 2015 PMID 26317785
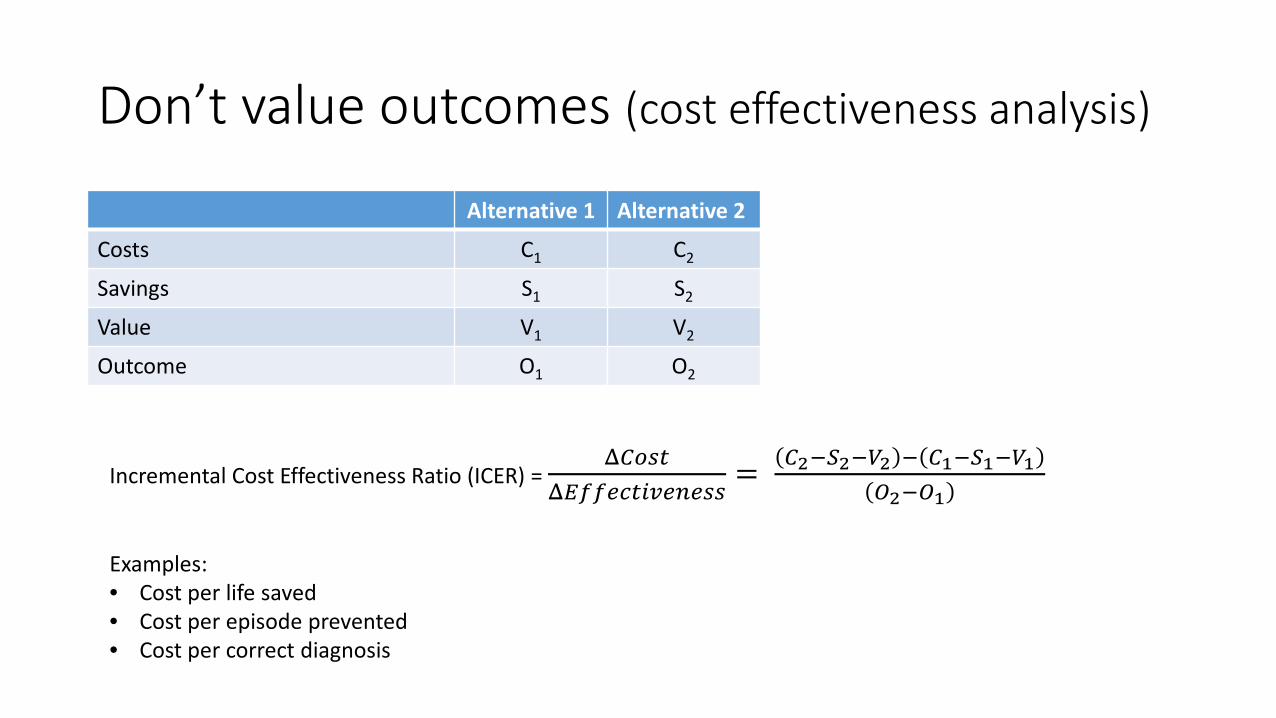
Don’t value outcomes (cost effectiveness analysis)
Alternative 1 Alternative 2
Costs C1 C2
Savings S1 S2
Value V1 V2
Outcome O1 O2
Incremental Cost Effectiveness Ratio (ICER) = Δ𝐶𝐶𝐶𝐶𝐶𝐶𝐶𝐶
Δ𝐸𝐸𝐸𝐸𝐸𝐸𝐸𝐸𝐸𝐸𝐶𝐶𝐸𝐸𝐸𝐸𝐸𝐸𝐸𝐸𝐸𝐸𝐶𝐶𝐶𝐶= 𝐶𝐶2−𝑆𝑆2−𝑉𝑉2 − 𝐶𝐶1−𝑆𝑆1−𝑉𝑉1
𝑂𝑂2−𝑂𝑂1
Examples: • Cost per life saved • Cost per episode prevented • Cost per correct diagnosis

Cost-effectiveness analysis
• Comparisons are limited to alternatives that affect the same outcome • Hospital infections due to a specific organism • Readmission prevented for CHF • Death averted • Diagnosis of a specific disease • Days in ICU
𝐼𝐼𝐼𝐼𝐼𝐼𝐼𝐼𝐼𝐼𝐼𝐼𝐼𝐼𝐼𝐼𝐼𝐼𝐼𝐼𝐼𝐼 𝐶𝐶𝐶𝐶𝐶𝐶𝐼𝐼 𝐸𝐸𝐸𝐸𝐸𝐸𝐼𝐼𝐼𝐼𝐼𝐼𝐸𝐸𝐸𝐸𝐼𝐼𝐼𝐼𝐼𝐼𝐶𝐶𝐶𝐶 = $𝑂𝑂𝑂𝑂𝐶𝐶𝐸𝐸𝐶𝐶𝑂𝑂𝐸𝐸 𝑂𝑂𝐸𝐸𝑚𝑚𝐶𝐶𝑂𝑂𝑚𝑚𝐸𝐸
= $𝑑𝑑𝐸𝐸𝑚𝑚𝐶𝐶𝑑 𝑚𝑚𝐸𝐸𝐸𝐸𝑚𝑚𝐶𝐶𝐸𝐸𝑑𝑑

Example: Traditional Maternal Serum Screening (integrated test) vs Noninvasive Fetal Testing (cfDNA)
Walker BS, et al. 2015 PMID: 25273838

Valuing Health Outcomes
Health Dimension Outcome 1 Outcome 2
Pain No Problem Problem
Mobility Problem Major Problem
Self-care Major Problem Major Problem
Usual Activities Problem Some Problem
Anxiety/Depression Some Problem No Problem

Standard Gamble Perfect Health (utility = 1)
Dead (utility = 0)
Dialysis (utility = ?)
p
1 - p
Expected Utility = U(Dialysis) = p*U(perfect health) + (1-p)*U(dead) = p

Time Tradeoff
Dialysis (10 yrs)
Perfect Health (? yrs)
Utility = yrs perfect health / yrs dialysis

Utility
• Measure of relative preference for health states
• Preference for whom?

Quality Adjusted Life Years
1 yr of perfect health = 1 QALY 1 yr on dialysis = 0.7 QALY
Perfect Health Dialysis Dead
3 years 8 years
Total = 3 + 5.6 = 8.6 QALY

Cost utility analysis
Item Alternative 1 Alternative 2
Resource Consumption C1 C2
Resource Savings S1 S2
Other Value V1 V2
Health Outcomes (Utility) U(O1) U(O2)
𝐼𝐼𝐶𝐶𝐸𝐸𝐼𝐼 = 𝐶𝐶2 − 𝑆𝑆2 − 𝑉𝑉2 − 𝐶𝐶1 − 𝑆𝑆1 − 𝑉𝑉1
𝑈𝑈 𝑂𝑂2 − 𝑈𝑈 𝑂𝑂1=
$𝑄𝑄𝑄𝑄𝑄𝑄𝑄𝑄

Cost-effectiveness plane
Δ Cost
Δ Effectiveness
Winners (less costly, more effective)
Losers (more costly, less effective)
???
???

Cost-effectiveness plane
Δ Cost
Δ Effectiveness
Winners (less costly, more effective)
Losers (more costly, less effective)
??? (Willingness to pay)
??? (Willingness to accept)

Cost-effectiveness plane
Δ Cost
Δ Eff
Dominated alternative

Cost-effectiveness plane
Δ Cost
Δ Eff
Efficient frontier

Cost benefit analysis (value outcomes in dollars)
Item Alternative 1 Alternative 2
Resource Consumption C1 C2
Resource Savings S1 S2
Other Value V1 V2
Health Outcomes (Willingness to pay)
W(O1) W(O2)
𝑁𝑁𝐼𝐼𝐼𝐼 𝐵𝐵𝐼𝐼𝐼𝐼𝐼𝐼𝐸𝐸𝐸𝐸𝐼𝐼 = 𝑊𝑊 𝑂𝑂2 − 𝑂𝑂1 − 𝐶𝐶2 − 𝑆𝑆2 − 𝑉𝑉2 − 𝐶𝐶1 − 𝑆𝑆1 − 𝑉𝑉1 = $

Comparison of outcome evaluation methods
Method Characteristics of Outcomes
Example Evaluation (outcomes) More than One? Different
Types? Different
Magnitude?
Cost Minimization No No No
FNA sampling protocols (adequate biopsy sample for solid pancreatic
lesion)
Cost Effectiveness No No Yes Diagnostic tests for TB (cases of TB detected)
Cost Utility Yes Yes (restricted) Yes Diagnostic test for kidney failure vs infection
(mobility, self care, anxiety/depression, pain)
Cost Benefit Yes Yes (unrestricted) Yes Education vs healthcare (diagnostic test)
(net benefit in dollars)

Converting Resources to Outcomes
System Resource 1, C1
Heath Outcome, O
Resource 2, C2 Resource 3, C3
Other Value, V
Savings, S

Converting Resources to Outcomes
Measurement (clinical trial)
Resource 1, C1
Heath Outcome, O
Resource 2, C2 Resource 3, C3
Other Value, V
Savings, S
Model Resource 1, C1
Heath Outcome, O
Resource 2, C2 Resource 3, C3
Other Value, V
Savings, S

Decision Analytic Model
Bilir SP, et al. 2015
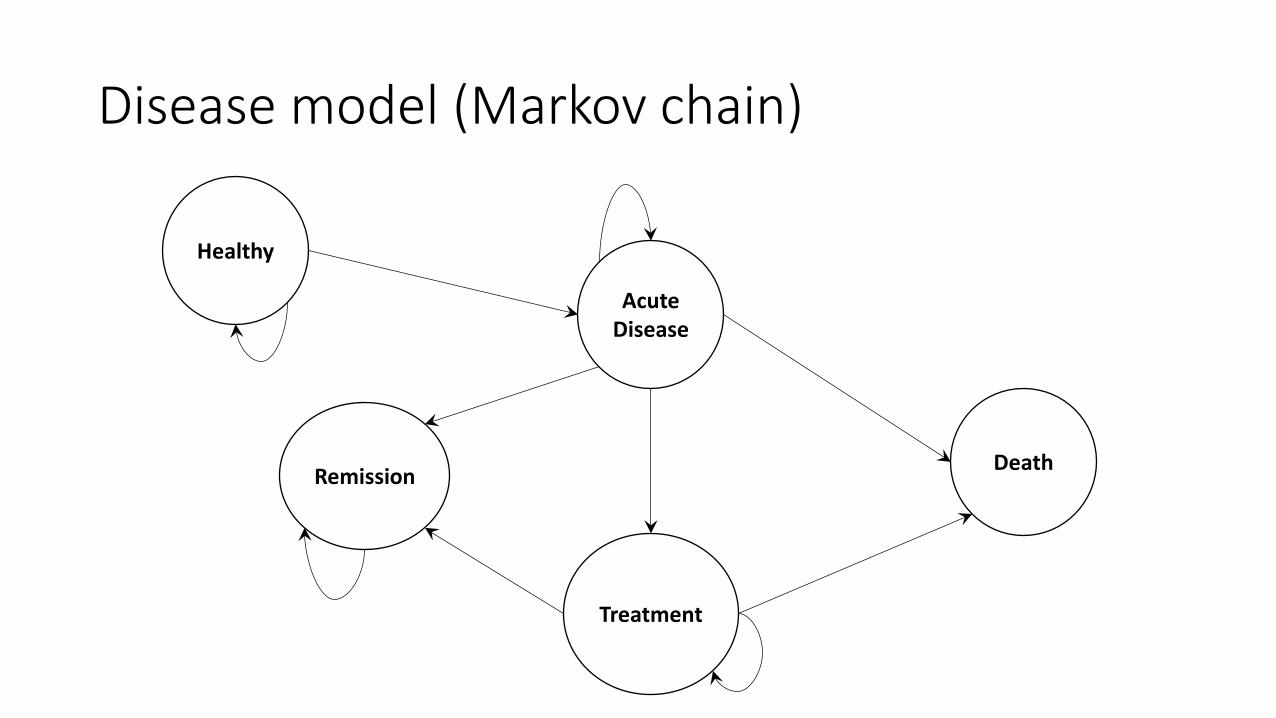
Disease model (Markov chain)
Healthy
Acute Disease
Treatment
Remission Death

Models require many inputs
• Costs • Probabilities
• Test performance • Disease model (transition probabilities)
• Outcomes

Walker BS, et al. 2015

All models are wrong, but some are useful
• Examples of wrong but useful models • Ideal gases • Point masses • Competitive market • Newtonian fluid • First order kinetics • Fickian diffusion
Box GP, 1987

One way sensitivity analysis Cost of NIPT ICER
200 -398,000
300 -300,000
400 -200,000
500 -100,000
600 125,000
700 150,000
800 175,000

Probabilistic Sensitivity Analysis
trial NIPT Cost
Lifetime Cost
Uptake of NIPT
Uptake of Diagnostic
Testing ICER 1 642 1200000 72 75 -1074
2 660 1900000 75 76 -1395
3 567 1200000 69 68 -1660
4 212 1800000 78 56 -1563
… 649 1000000 71 76 -1594
… 691 2100000 79 66 -1790
… 687 2900000 79 64 -2000
1,000,000 293 2700000 80 59 -1289

Probabilistic Sensitivity Analysis MSS (integrated test) vs NIFT
Walker BS, et al. 2015 PMID: 25273838

Opportunities
• CEA is theoretically correct way to evaluate tests • Modeling provides insight
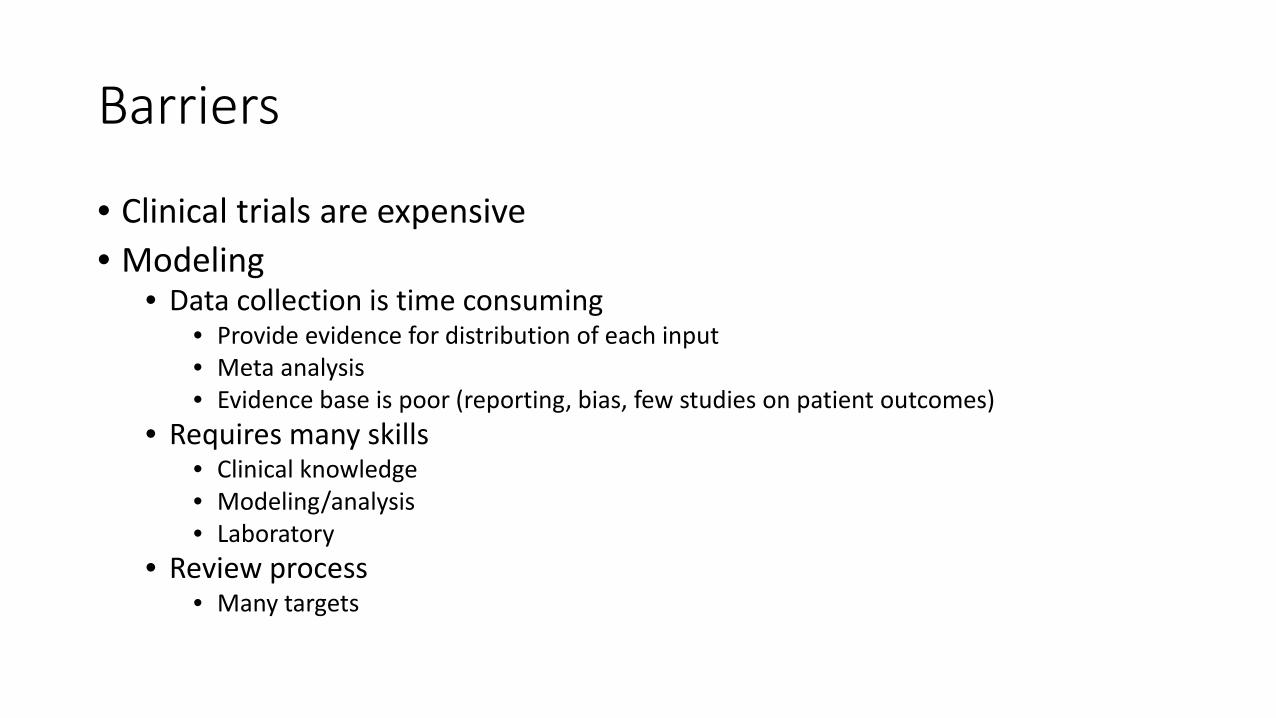
Barriers
• Clinical trials are expensive • Modeling
• Data collection is time consuming • Provide evidence for distribution of each input • Meta analysis • Evidence base is poor (reporting, bias, few studies on patient outcomes)
• Requires many skills • Clinical knowledge • Modeling/analysis • Laboratory
• Review process • Many targets

Conclusions
• CEA is time consuming
• CEA can provide insight into important questions about lab testing
• CEA can be cost-effective for selected problems • Not all problems required CEA
• There is a gap between what is needed and what is being produced
Objectives
• Review the basic types of analyses that support cost-effectiveness analysis
• Describe the opportunities and challenges in applying cost-effectiveness analysis to diagnostic tests
• Real-world examples of how lab data is being used to determine if certain lab testing strategies are cost effective

References
• Horvath AR, et al. From biomarkers to medical tests: the changing landscape of test evaluation. Clin Chim Acta 2014;427:49-57.
• Bilir SP, et al. The economic impact of rapid Candida species identification by T2Candida among high-risk patients. Future Microbiology 2015; 10(7):1133-1144.
• Schmidt RL, Walker BS, Cohen MB. When is rapid on-site evaluation cost-effective for fine-needle aspiration biopsy? PLoS ONE. 10(8) : e0135466
• Walker BS, Jackson BR, Grenache DN, Ashwood ER, Schmidt RL. Cost-effectiveness of the contingent use of cfDNA for screening for Down syndrome. PLoS ONE. 2015; 10(7):e0131402.
• Walker BS, Jackson BR, LaGrange D, Ashwood ER, Schmidt RL. A cost effectiveness analysis of cell free DNA as a replacement for serum screening for Down syndrome. Prenatal Diagnosis. 2015; 35(5):440-446.