COST DRIVERS - innovativemedicines.ca
33
COST COST DRIVERS DRIVERS COST DRIVERS ANALYSIS OF PRIVATE DRUG PLANS IN CANADA 2021
Transcript of COST DRIVERS - innovativemedicines.ca

COST COST DRIVERSDRIVERSCOST DRIVERSANALYSIS OF PRIVATE DRUG PLANS IN CANADA2021

2 Innovative Medicines Canada Cost Drivers Analysis of Private Drug Plans in Canada 2021
Yearin review
AUTHORS:
Viktoria Roman, Innovative Medicines CanadaJoe Farago, Innovative Medicines CanadaSuzanne Lepage, Suzanne Lepage Consulting Inc. .
SUGGESTED CITATION:
Innovative Medicines Canada Cost Drivers Analysis of Private Drug Plans in Canada 2021
Readers are welcome to cite any information in this reportwith attribution to Innovative Medicines Canada
2 Innovative Medicines Canada Cost Drivers Analysis of Private Drug Plans in Canada 2021

Innovative Medicines Canada Cost Drivers Analysis of Private Drug Plans in Canada 2021 3
TABLE OF CONTENTS
Executive Summary
1. Introduction and background
2. Overall Private Drug Plan Claims Growth
3. Impact of COVID-19 on Private Drug Claims
4. Impact of Chronic Disease
5. Impact of Days Supply Limits
6. Regional Growth Analysis
7. Impact of Age
8. Impact of Treatment Costs
9. Growth by Therapeutic Class
10. Discussion and Implications
11. Recommendations
Data Sources, Methodology, and Definitions
4
5
7
9
11
14
20
24
26
28
29
30
31
Innovative Medicines Canada Cost Drivers Analysis of Private Drug Plans in Canada 2021 3

4 Innovative Medicines Canada Cost Drivers Analysis of Private Drug Plans in Canada 2021
EXECUTIVE SUMMARY
KEY FINDINGS: • This year’s report highlights that, contrary to popular belief, overall annual cost
growth in the Canadian private drug benefits market has been consistently around 5% for the last decade, and most of the growth is due to increased utilization rather than cost increases:
o Private market drug claims costs grew 5.3% in 2020, consistent with a compound annual rate of 5.3% between 2014 and 2019.
o Two-thirds (68%) of this growth was driven by increased utilization (more people claiming more drugs due to increased demand), rather than increases in the cost of the drugs.
• Chronic disease continues to be a major cost driver for private drug plans, accounting for the largest share of plan costs (69%). Most of private drug spending is for lower-cost non-specialty drugs (68%), including treatments for modifiable chronic diseases.
• The COVID-19 pandemic changed the composition of drug claims in 2020. Although there were fewer claimants overall, those who made claims received more drugs, mostly for chronic diseases and higher-cost drugs.
• Claims for 30 days of supply or less accounted for 58% of the claims and 43% of the costs for oral solid drugs to treat chronic disease in 2020. Similar trends
were observed in previous years, suggesting that this result was due not solely to the 30-day supply limit in the early months of the pandemic but to a longer-
term trend.

Innovative Medicines Canada Cost Drivers Analysis of Private Drug Plans in Canada 2021 5
1. INTRODUCTION ANDBACKGROUND
The sustainability of private drug plans has been an ongoing topic of discussion in the private benefits market for the past several years. Publications from the private benefits market have created an impression that private drug plans are unaffordable and unsustainable due to increases in drug prices. To shed further light on this issue, Innovative Medicines Canada has been working since 2018 with IQVIA, a global leader in healthcare market insights, to examine private plan cost growth. To get a solid understanding of cost growth, we examine the key cost growth drivers at the national and regional levels.
The results of this year’s report have unique characteristics, as 2020 was an unprecedented year due to the COVID-19 pandemic. In 2020, people were less likely to see their physicians and a 30-day supply limit on medication introduced in April and May had a direct impact on the composition of cost drivers. As a result, this year’s report takes a closer look at days supply prescription fill rates by days’ supply and compare them with historical trends.
This report shows that fewer patients submitted claims in private plans in 2020 than in 2019, and there was a change in the composition of claimants due to the COVID-19 pandemic. Data shows that, in 2020, fewer patients used acute and low-cost therapies (e.g., anti-infectives) and there was a reduction in newly diagnosed chronic disease patients. As a result, the composition of claimants has shifted towards those claiming chronic and higher-cost drugs.
Innovative Medicines Canada Cost Drivers Analysis of Private Drug Plans in Canada 2021 5

6 Innovative Medicines Canada Cost Drivers Analysis of Private Drug Plans in Canada 2021
Private drug plan claims have three main cost drivers
The cost growth of drug claims in private drug plans in Canada can be attributed to three primary drivers: increases in the number of claimants (more people claiming), increases in the number of claims that claimants make (making more claims) and increases in costs per claim due to the adoption of new innovative medicines or to factors such as distribution fees and the frequency of dispensing. The combination of the first two — increases in the number of claimants and the increase in the number of claims — represents utilization.
Private drug plan claims costs represent only one component of the overall cost of private drug benefits plans. Additional costs are added on by insurers, third-party administrators, benefit consultants, wholesalers, and pharmacies (see Figure 21).
Figure 1. Drivers of Drug Cost Growth
Cost perclaim
Utilization
DRUG COST GROWTH DRIVERS
6 Innovative Medicines Canada Cost Drivers Analysis of Private Drug Plans in Canada 2021

CAGR-7.4%
CLAIMANT GROWTH
4321CAGR
CLAIMS GROWTH
11.9%CAGR
3.6%
$CAGR1.5%COST PER CLAIM
UTILIZATION
TOTAL DRUG COST
CAGR$
5.3%
Utilization is primary driver of total growth.
Figure 2: Private Drug Plan Cost Drivers of Overall Cost Growth, 2019–2020
2. OVERALL PRIVATE DRUG PLAN CLAIMS GROWTHThe overall growth in private drug plan claims in 2020 was 5.3% (see Figure 2), which was consistent with the five-year compound annual growth rate (CAGR) of 5.3% for 2014 to 2019 (see Figure 3). This consistent year-over-year growth demonstrates that if these costs were spread equitably among plan sponsors, thus buffering unexpected high-cost claims, private drug plans could be much more affordable.Although the 2016–2019 cost drivers report showed a temporary decrease in drug cost utilization due to changes to OHIP+ (which offered free medication to Ontarians under age 25 from January 1, 2018, to March 31, 2019, but then required them to migrate back to private health plans), utilization still accounted for more than half of private drug plan claims costs. In 2020, utilization returned to its historical high as the major driver of cost growth (68%) — that is, growth in the number of claimants and number of claims per claimant. In 2020, cost per claim grew by 1.5% (accounting for 28% of total cost growth), in line with annual inflation. Meanwhile, a minimal 0.2% of cost growth was due to cross effects attributable to the impact of the interaction of the main cost drivers, given that they happen simultaneously and not in isolation.
Innovative Medicines Canada Cost Drivers Analysis of Private Drug Plans in Canada 2021 7Innovative Medicines Canada Cost Drivers Analysis of Private Drug Plans in Canada 2021 7

8 Innovative Medicines Canada Cost Drivers Analysis of Private Drug Plans in Canada 2021
Growth in 2020 was consistent with compound annual growth from 2014 to 2019.
5.9%
6.6%
4.2%
6.3%
0.8%
9.0%
5.3%
2014 2015 2016 2017 2018 2019 2020
% G
row
th
Cost Growth10
8
6
4
2
0
CAGR 2016-2019: 5.3%
Figure 3: Private Drug Plan Cost Growth, 2014–2020
8 Innovative Medicines Canada Cost Drivers Analysis of Private Drug Plans in Canada 2021

Innovative Medicines Canada Cost Drivers Analysis of Private Drug Plans in Canada 2021 9
3. IMPACT OF COVID-19ON PRIVATE DRUGCLAIMS
COVID-19 NOTABLE EFFECTS The COVID-19 pandemic has had some notable effects on private drug plans. In 2020, there were fewer claimants (7.4% decrease). Those who did claim appeared to have more serious health issues, as we saw the average claims per claimant grow by 11.9%. (See Figure 4.)Patients were also less likely to visit their doctor when they became sick, which resulted in fewer claimants using acute
or low-cost therapies, such as anti-infectives, and fewer claimants with newly diagnosed chronic diseases. However, those who made claims used more drugs for chronic diseases and higher-cost drugs, resulting in a higher cost per claimant (up 13.7%) than in the previous several years. (See Figure 5.) It is expected that cost per claimant will shift back to lower historical levels once the COVID-19 pandemic is over.
Between March and June 2020, most provincial drug plans put a 30-day limit on prescriptions in anticipation of drug shortages. This limit was the likely cause for the increase in the number of claims per claimant in private plans in 2020.
3.8%
0.8%-0.4%
1.4% 0.2%
2.9%
-2.1%
11.9%
-0.8%
3.1% 4.0%2.0%
3.5%
-3.1%
7.3%
-7.4%2013 2014 2015 2016 2017 2018 2019 2020
Claims growth Claimant growth
12
8
4
0
-4
-8
% G
row
th
Growth in 2020 was consistent with compound annual growth from 2014 to 2019.
Innovative Medicines Canada Cost Drivers Analysis of Private Drug Plans in Canada 2021 9Innovative Medicines Canada Cost Drivers Analysis of Private Drug Plans in Canada 2021 9
Source: Innovative Medicines Canada Cost Drivers Analysis of Private Drug Plans in Canada 2021; Innovative Medicines Canada Cost Drivers Analysis 2016-2019; Innovative Medicines Canada, Costs Drivers Analysis of Private Drug Plans 2012–2016.

$538 $555 $569 $584 $596 $612 $637 $647$736
3.1% 2.6% 2.6% 2.1% 2.7%4.1%
1.6%
13.7%
0.0
2.0
4.0 6.0 8.0
10.0 12.0
14.0
2012 2013 2014 2015 2016 2017 2018 2019 2020
% G
row
th
Aver
age
Cos
t per
Cla
iman
t ($)
Avg Cost per Claimant Cost per Claimant Growth
YoY 2019-2020: 13.7%800
700
600
500
400
200
100
0
16.0
Average cost per claimant was higher in 2020 due to the COVID-19 pandemic.
Figure 5: Total Private Drug Plan Average Cost per Claimant, 2012-2020
10 Innovative Medicines Canada Cost Drivers Analysis of Private Drug Plans in Canada 2021
Source: Innovative Medicines Canada Cost Drivers Analysis of Private Drug Plans in Canada 2021; Innovative Medicines Canada Cost Drivers Analysis 2016-2019; Innovative Medicines Canada, Costs Drivers Analysis of Private Drug Plans 2012–2016.

4. IMPACT OF CHRONIC DISEASE
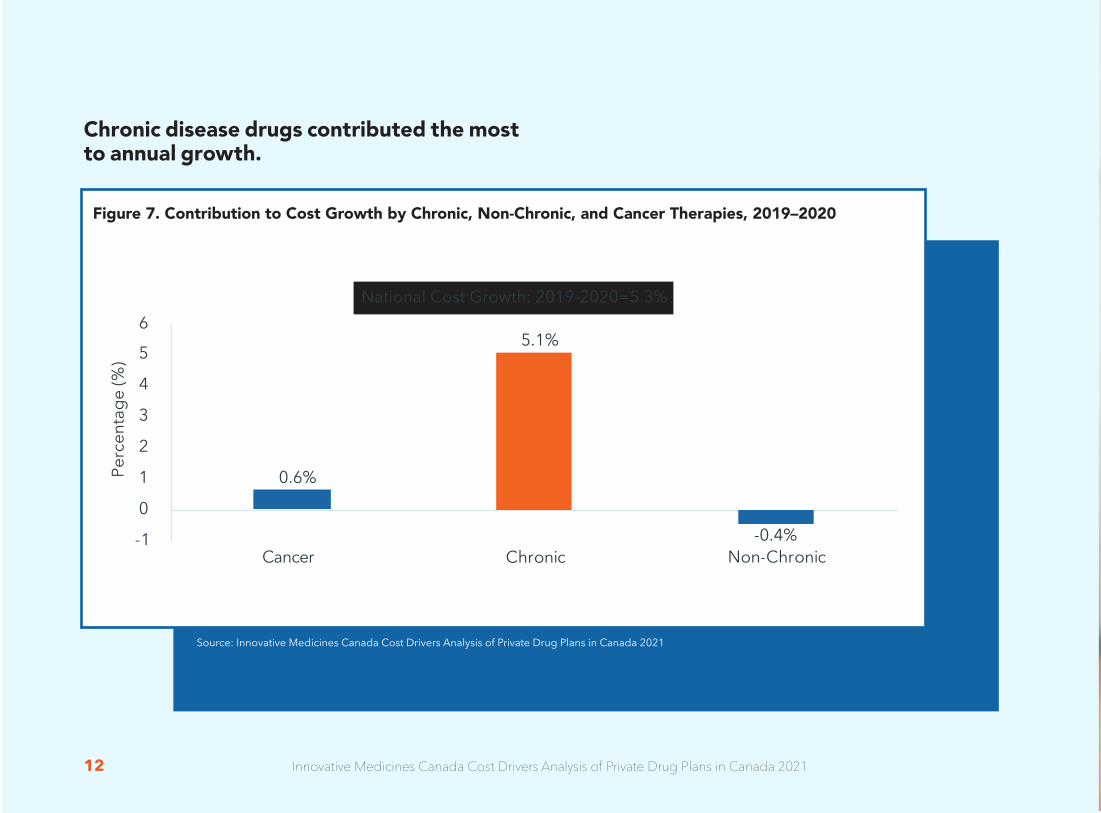
In 2020, chronic disease continued to be a major factor in driving increases in utilization and overall plan costs. Chronic diseases are defined as non-communicable diseases that can be treated but not cured and that are persistent and generally slow in progression.To assess the impact of one-time versus ongoing claims, this analysis compared drugs that treat chronic diseases and drugs that treat non-chronic conditions. For this analysis, cancer medications were kept as a separate category and not classified as either chronic or non-chronic. In 2020, chronic disease drugs accounted for the largest share of plan costs, at 69% (see Figure 6), and contributed the most to 2020 growth, at 96% (see Figure 7). Utilization accounted for most of the 2020 changes for drugs that treat both chronic and non-chronic conditions. Costs for drugs for both chronic and non-chronic conditions were primarily affected by the increase in claims per claimant, although the growth in utilization was tempered by a decline in number of claimants for drugs that treat non-chronic condition. (See Figure 8 .) It is important to note that some chronic diseases, such as rheumatoid arthritis and multiple sclerosis are unavoidable and may require treatment with specialty or biologic drugs to better manage the natural progression of the disease. However, 68% of private drug spending is for low-cost drugs (see Section 8, Impact of Treatment Costs), including treatments for many modifiable chronic diseases, such as type 2 diabetes, high cholesterol, and high blood pressure — chronic diseases that can be prevented or better managed through programs to improve the overall health of plan members.
Chronic disease drugs account for the largest share of plan costs.
Figure 6. Share of 2020 Private Drug Plan Cost by Chronic, Non-Chronic, and Cancer Therapies
CancerNon-ChronicChronic
69.0%
25.2%
5.9%
Innovative Medicines Canada Cost Drivers Analysis of Private Drug Plans in Canada 2021 11
12 Innovative Medicines Canada Cost Drivers Analysis of Private Drug Plans in Canada 2021
0.6%
5.1%
-0.4% -1
0
1
2
3
4
5
6
Cancer Chronic Non-Chronic
Perc
enta
ge (%
)
National Cost Growth: 2019-2020=5.3%
Chronic disease drugs contributed the most to annual growth.
Figure 7. Contribution to Cost Growth by Chronic, Non-Chronic, and Cancer Therapies, 2019–2020
12 Innovative Medicines Canada Cost Drivers Analysis of Private Drug Plans in Canada 2021

12.8%6.1%
-4.2%-11.0%-0.9%
3.1%
-15
-10
-5
0
5
10
15
Chronic Non-Chronic
Perc
enta
ge (%
)
7.5% -1.6%Cost Growth
Claims per claimant effect Claimant effect Cost per claim effect
Utilization accounts for most of the growth for chronic and non-chronic.
Figure 8. Cost Growth Drivers by Chronic and Non-Chronic Therapies, 2019–2020
Innovative Medicines Canada Cost Drivers Analysis of Private Drug Plans in Canada 2021 13
14 Innovative Medicines Canada Cost Drivers Analysis of Private Drug Plans in Canada 2021
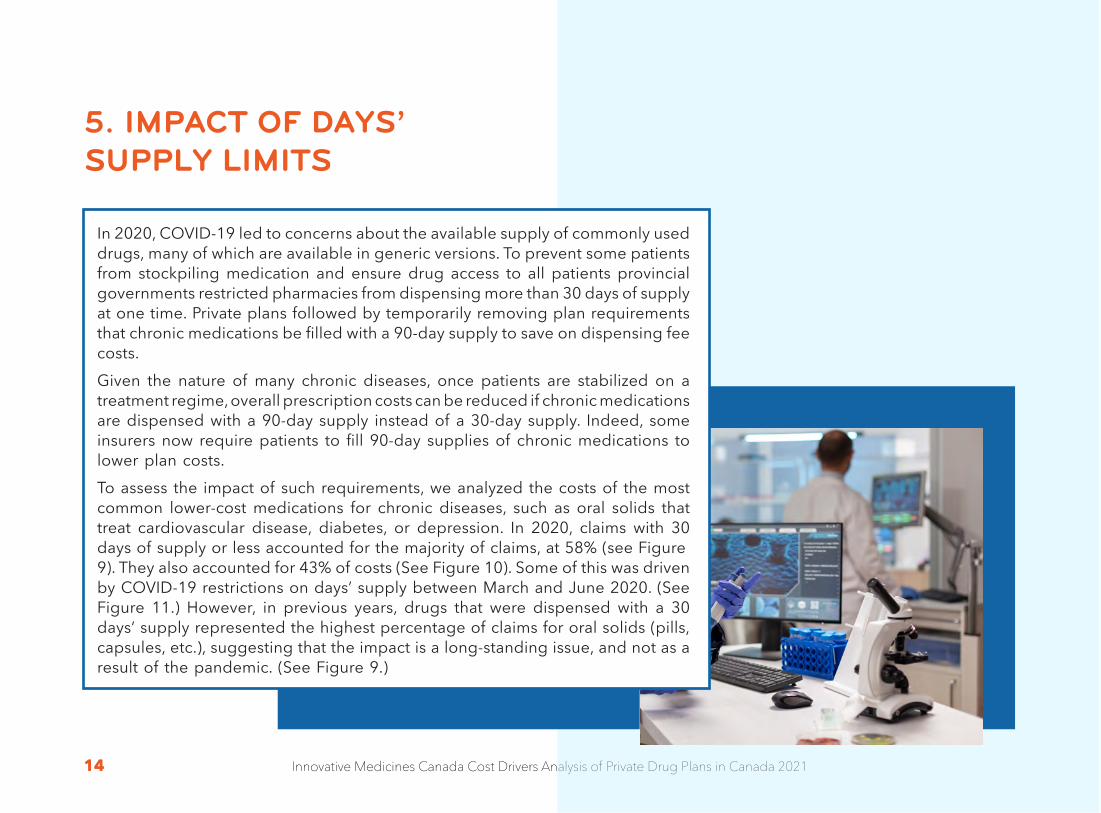
5. IMPACT OF DAYS’SUPPLY LIMITS
In 2020, COVID-19 led to concerns about the available supply of commonly used drugs, many of which are available in generic versions. To prevent some patients from stockpiling medication and ensure drug access to all patients provincial governments restricted pharmacies from dispensing more than 30 days of supply at one time. Private plans followed by temporarily removing plan requirements that chronic medications be filled with a 90-day supply to save on dispensing fee costs.Given the nature of many chronic diseases, once patients are stabilized on a treatment regime, overall prescription costs can be reduced if chronic medications are dispensed with a 90-day supply instead of a 30-day supply. Indeed, some insurers now require patients to fill 90-day supplies of chronic medications to lower plan costs.To assess the impact of such requirements, we analyzed the costs of the most common lower-cost medications for chronic diseases, such as oral solids that treat cardiovascular disease, diabetes, or depression. In 2020, claims with 30 days of supply or less accounted for the majority of claims, at 58% (see Figure 9). They also accounted for 43% of costs (See Figure 10). Some of this was driven by COVID-19 restrictions on days’ supply between March and June 2020. (See Figure 11.) However, in previous years, drugs that were dispensed with a 30 days’ supply represented the highest percentage of claims for oral solids (pills, capsules, etc.), suggesting that the impact is a long-standing issue, and not as a result of the pandemic. (See Figure 9.)
14 Innovative Medicines Canada Cost Drivers Analysis of Private Drug Plans in Canada 2021

Innovative Medicines Canada Cost Drivers Analysis of Private Drug Plans in Canada 2021 15
In 2020, 30-day supply claims accounted for the most claims and cost.
Innovative Medicines Canada Cost Drivers Analysis of Private Drug Plans in Canada 2021 15
49% 49%58%
9% 9%8%
33% 33%28%
9% 9% 6%
0
102030
4050
607080
90100
2018 2019 2020
≤30 31-60 61-90 ≥91
Perc
enta
ge (%
)
Figure 9. Private Drug Claims by Share of Days Supply, 2019-2020

16 Innovative Medicines Canada Cost Drivers Analysis of Private Drug Plans in Canada 2021
We would expect that common medications for chronic disease would be more likely to be dispensed in 90 days’ supply, resulting in lower dispensing fee costs than if they were dispensed in 30 days’ supply. However, half or more of these chronic drugs are dispensed in 30 days’ supply, with an accompanying higher proportion of dispensing fees (see Figure 12). Figure 11 shows that among oral medications for chronic diseases, cardiovascular and antidiabetic oral drugs had higher average days’ supply than antidepressants and antipsychotics. There is a significant opportunity for private drug plans to leverage 90 days’ supply for chronic treatments to generate savings by reducing the significant proportion of non-drug related claims costs. The share of dispensing fees in claims costs, for example, could be reduced from 33% to 16%. (See Figure 12.)
16 Innovative Medicines Canada Cost Drivers Analysis of Private Drug Plans in Canada 202116 Innovative Medicines Canada Cost Drivers Analysis of Private Drug Plans in Canada 2021

Innovative Medicines Canada Cost Drivers Analysis of Private Drug Plans in Canada 2021 17
28% 30% 38%
9% 9%9%
47% 47%43%
15% 14% 10%
0
10
20
304050
60
7080
90
100
2018 2019 2020
≤30 31-60 61-90 ≥91
Perc
enta
ge (%
)
In 2020, 30-day supply claims accounted for the most claims and cost.
Figure 10. Private Drug Costs by Share of Days’ Supply, 2018–2020
Innovative Medicines Canada Cost Drivers Analysis of Private Drug Plans in Canada 2021 17

18 Innovative Medicines Canada Cost Drivers Analysis of Private Drug Plans in Canada 2021
42% 42% 40%
29%34%
41% 42% 40% 43% 42% 42% 43%
62% 62%56%
34%
44%
55%60%
57%63% 63% 62% 64%
59% 59%53%
33%41%
53%57% 54%
60% 59% 58% 60%
20
30
40
50
60
70
Jan Feb Mar Apr May Jun Jul Aug Sep Oct Nov Dec
Antidepressants, antipsychotics, and ADHD Cardiovascular Antidiabetic
Perc
enta
ge (%
)
In 2020, 30-day supply claims accounted for the most claims and cost.
Figure 11. Average Days of Supply per Claim, Oral Solids, 2020

Innovative Medicines Canada Cost Drivers Analysis of Private Drug Plans in Canada 2021 19
In 2020, 30-day supply claims accounted for the most claims and cost.
20
31
20
15 14
22
33
22
16 15
23
33
22
1715
24
33
23
17 16
All Days' Supply Categories
≤30 31-60 61-90 ≥91
2017 2018 2019 202035
30
25
20
15
10
5
0
Perc
enta
ge (%
)
Figure 12. Proportion of Dispensing Fee in Overall Cost, 2017–2020
In 2020, 30-day supply claims accounted for the most claims and cost.
Innovative Medicines Canada Cost Drivers Analysis of Private Drug Plans in Canada 2021 19Innovative Medicines Canada Cost Drivers Analysis of Private Drug Plans in Canada 2021 19

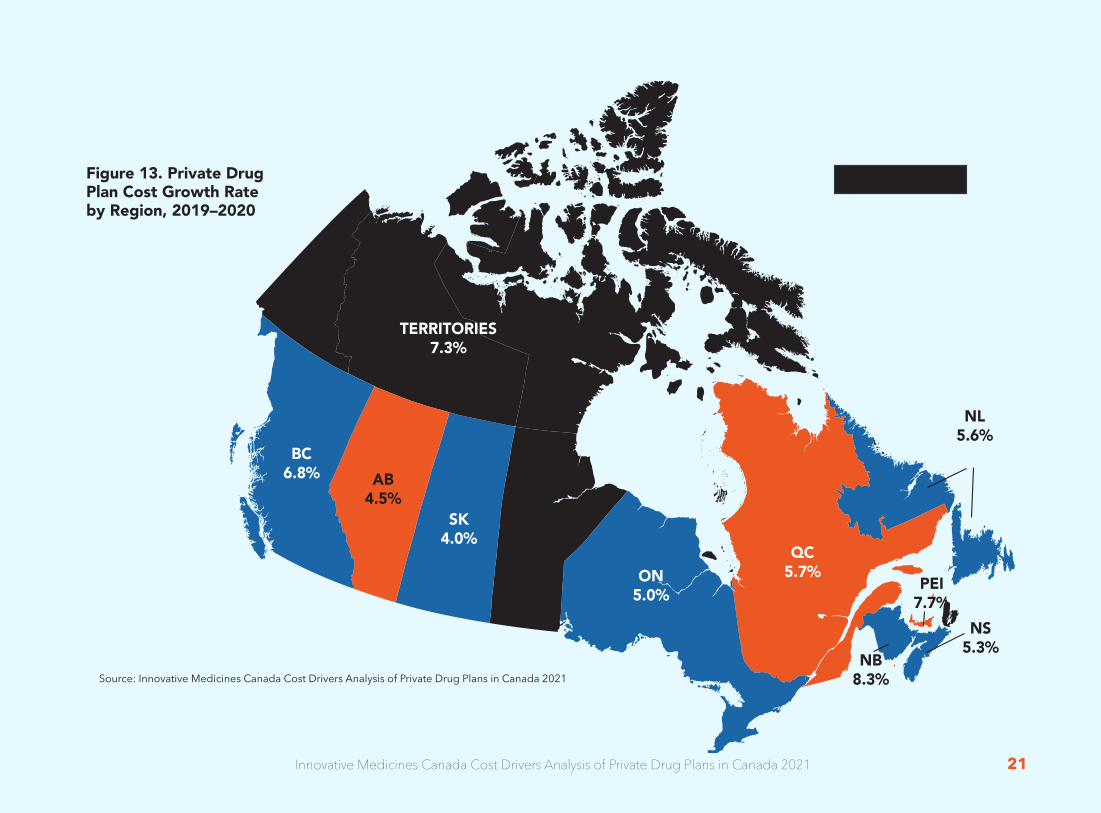
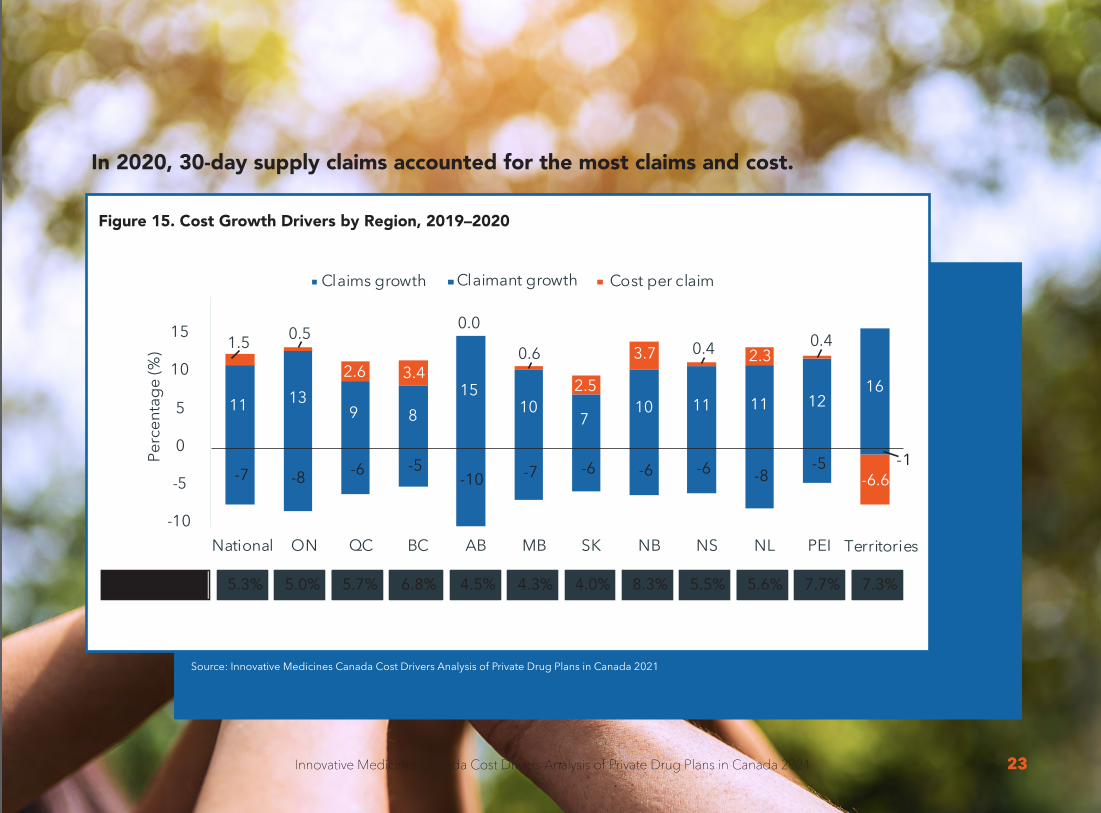
6. REGIONAL GROWTH ANALYSIS
Analyzing the cost growth for drug plan claims by region sheds light on differences across Canada that are likely due to variations in regional population, employment, and provincial drug plans.In 2020, New Brunswick, PEI, and the territories had the highest growth rate among the provinces. Ontario’s growth was slightly lower than the 5.3% national average growth, while Quebec’s growth was slightly above the national rate, at 5.7%. (See Figure 13.) Ontario and Quebec contributed to the lion’s share of 2020 cost growth — together they accounted for 74% of national growth. (See Figure 14.)Utilization was the main driver in all provinces. A reduction in claimants slowed growth but that was offset by a higher than historical growth in the number of claims. (See Figure 15.)
20 Innovative Medicines Canada Cost Drivers Analysis of Private Drug Plans in Canada 2021
Innovative Medicines Canada Cost Drivers Analysis of Private Drug Plans in Canada 2021 21
Figure 13. Private Drug Plan Cost Growth Rate by Region, 2019–2020
NATIONAL 5.3%
NL5.6%
ON5.0%
NS5.3%
NB8.3%
QC5.7%
PEI7.7%
MB4.3%
SK4.0%
AB4.5%
BC6.8%
TERRITORIES7.3%
Innovative Medicines Canada Cost Drivers Analysis of Private Drug Plans in Canada 2021 21

22 Innovative Medicines Canada Cost Drivers Analysis of Private Drug Plans in Canada 2021
2.1%1.8%
0.4% 0.3%0.1% 0.1%
0.3% 0.2% 0.1% 0.0% 0.0%0
1
2
ON QC BC AB MB SK NB NS NL PEI Territories
Perc
enta
ge (%
)
National Cost Growth: 2019-2020=5.3%
Figure 14. Contribution to Private Drug Plan Cost Growth by Region, 2019–2020
In 2020, 30-day supply claims accounted for the most claims and cost.
22 Innovative Medicines Canada Cost Drivers Analysis of Private Drug Plans in Canada 2021
Innovative Medicines Canada Cost Drivers Analysis of Private Drug Plans in Canada 2021 23
11 139 8
1510
710 11 11 12
16
-7 -8 -6 -5-10 -7 -6 -6 -6 -8
-5 -1
1.5 0.5
2.6 3.4
0.0
0.6
2.5
3.7 0.4 2.3
-6.6
-10
-5
0
5
10
15
National ON QC BC AB MB SK NB NS NL PEI Territories
Perc
enta
ge (%
)
Claims growth Claimant growth Cost per claim
5.3% 5.0% 5.7% 6.8% 4.5% 4.3% 4.0% 8.3% 5.5% 5.6% 7.7% 7.3%
0.4
Cost Growth
Figure 15. Cost Growth Drivers by Region, 2019–2020
In 2020, 30-day supply claims accounted for the most claims and cost.
Innovative Medicines Canada Cost Drivers Analysis of Private Drug Plans in Canada 2021 23Innovative Medicines Canada Cost Drivers Analysis of Private Drug Plans in Canada 2021 23

24 Innovative Medicines Canada Cost Drivers Analysis of Private Drug Plans in Canada 2021
7. IMPACT OF AGE
POSITIVE CLAIMANT GROWTH Consistent with prior years’ reports, the 45–65 age group drove most (53%) of the 2020 private drug claims cost growth. (See Figure 16.) Utilization accounted for the majority of the growth in all age groups. The 65+ age group was the only age band with positive claimant growth, whereas the number of claimants decreased the most for the under 25 years age group. (See Figure 17.)
As shown in Section 3, “Impact of COVID-19 on Private Drug Claims,” fewer patients claimed drugs for acute and low-cost therapies in 2020, and there were fewer newly diagnosed chronic disease patients. It is likely that due to the COVID-19 pandemic, many younger plan members chose not to seek medical care.
Most of the cost growth attributed to the 45-65 age group was likely due to patients with chronic conditions diagnosed prior to the pandemic. The older age groups (45+) are also the most likely to have more chronic conditions, make more claims, and use higher cost drugs. This would explain the higher cost per claimant and
cost per claim in 2020 compared with previous years.
0.6%
1.3%
2.8%
0.6%
0
1
2
3
Perc
enta
ge (%
)
<25 ≥25 - <45 ≥45 - <65 ≥65
National Cost Growth: 2019-2020=5.3%
Claimants aged 45-65 years drove most of the cost growth.
Figure 16. Contribution to Cost Growth by Age Group, 2019–2020
24 Innovative Medicines Canada Cost Drivers Analysis of Private Drug Plans in Canada 2021

Innovative Medicines Canada Cost Drivers Analysis of Private Drug Plans in Canada 2021 25
11.1% 9.6% 9.5%6.1%
-14.8%-8.1%
-4.8%
1.9%
8.2%
3.2% 0.5%
-2.8%
-15
-10
-5
0
5
10
15
20
Perc
enta
ge (%
)
Cost Growth 5.8% 5.2% 5.3% 5.1%
Claims per claimant effect Claimant effect Cost per claim effect
<18 ≥18 - <25 ≥25 - <45 ≥45 - <65
Figure 17. Cost Growth Drivers by Age Group, 2019–2020
Utilization accounted for most of the growth in all age groups.
Innovative Medicines Canada Cost Drivers Analysis of Private Drug Plans in Canada 2021 25

26 Innovative Medicines Canada Cost Drivers Analysis of Private Drug Plans in Canada 2021
8. IMPACT OF TREATMENT COSTS
≥$25k - <$100k≥$10k - <$25k<$10k≥$100k
Non-specialty drugs make up 68% of total drug costs.
Figure 18. Share Private Plan Costs, by Treatment Cost Category, 2020
When private drug plan costs were analyzed by treatment cost categories, non-specialty drugs (drugs that cost less than $10,000 annually per patient) were found to have made up the majority (68%) of total private drug plan costs in 2020 (see Figure 18). Drugs that cost between $10,000 and $25,000 annually per patient contributed the most to overall cost growth (2.8% of cost growth of 5.3% — that is, 58% of total growth) (see Figure 19).
As newer and potentially life-saving therapies are developed to treat conditions that previously lacked effective treatment options, patients are accessing medicines that significantly improve their health, prevent further disability, and allow them to live a more productive life. Unfortunately, some of these benefits are not captured in the cost of the drug plan but instead materialize in reduced absenteeism, long-term disability, or the use of other therapies that manage symptoms but are not curative.
Some publications suggest that higher-cost drugs are becoming more dominant in Canada, making private drug plans unaffordable and unsustainable. Although innovative, higher-cost treatments continue to grow, private drug claim cost increases remain approximately 5% annually, and utilization and chronic diseases continue to be the principal drivers of cost growth.
The main issue facing today’s private payer market is specific to the fully-insured benefits plans, which are typical for small to medium-sized plan sponsors. This issue can also impact larger plans that purchase pooling insurance. The current insurance model and pooling mechanisms are unable to spread the risk broadly enough to buffer these full-insured plans from high-cost claims. Although overall cost growth remains manageable, the underlying risk-sharing model has been notable to effectively insure these types of plans.
Figure 16. Contribution to Cost Growth by Age Group, 2019–2020
96%
68.1%
20.6%
1.8%
26 Innovative Medicines Canada Cost Drivers Analysis of Private Drug Plans in Canada 2021

Innovative Medicines Canada Cost Drivers Analysis of Private Drug Plans in Canada 2021 27
1.3%
2.8%
0.5% 0.6%
0
1
2
3
<$10k ≥$10k - <$25K ≥$25k - <$100k ≥$100k
Perc
enta
ge (%
)
National Cost Growth: 2019-2020=5.3%
Figure 19. Contribution to Cost Growth by Treatment Cost Category, 2019–2020
Drugs costing $10K–$25K had the greatest impact on overall cost growth.
Innovative Medicines Canada Cost Drivers Analysis of Private Drug Plans in Canada 2021 27

28 Innovative Medicines Canada Cost Drivers Analysis of Private Drug Plans in Canada 2021
9. GROWTH BYTHERAPEUTIC CLASSBIOLOGICS FOR AUTO-
IMMUNE DISEASES Similar to the findings in our previous report, the three fastest-growing therapeutic classes in private drug plan costs in 2020 were biologics for auto-immune diseases (e.g., rheumatoid arthritis, psoriasis, inflammatory bowel disease, and age-related macular degeneration), diabetes drugs (including diabetes glucose meters and test strips), and cancer drugs (see Figure 20). It is important to note that inclusion of glucose meters
and test strips in the diabetes drugs category adds to the claims growth attributed to this disease condition.
13.4% 13.4%
11.3%
10
11
12
13
14
Biologic disease modifiers forRA/PsO/IBD/AMD
Antidiabetic Cancer
Perc
enta
ge (%
)
Biologic, diabetic, and cancer drugs are the top-growing therapeutic classes.
28 Innovative Medicines Canada Cost Drivers Analysis of Private Drug Plans in Canada 2021
Figure 20. Three Top-Growing Therapeutic Classes in Private Drug Plan Costs, 2019-2020
Innovative Medicines Canada Cost Drivers Analysis of Private Drug Plans in Canada 2021 29
10. SUMMARY AND IMPLICATIONS
• Private drug claim costs have grown at a consistent level of approximately 5%annually for many years. Private drug claim cost growth demonstrates thatthere is a need for better risk management to distribute costs more equitablyamong plan sponsors to ensure private drug plans remain affordable.
• Private drug claims growth continues to be driven by utilization and lower-cost chronic disease drugs rather than newer drugs or increased cost perclaim. The price increase portion of the overall cost increases have beenconsistent with annual inflation in the past several years. In addition, lower-cost drugs (less than $10,000 per patient annually) continued to make up themajority (68%) of total private drug plan costs in 2020, while drugs to treatchronic diseases accounted for the largest share of plan costs (69%) andcontributed the most to 2020 growth representing 5.1% of the total 5.3%growth (96%).
• COVID-19 was likely the reason for the reduced number of claimants and forthe higher cost for those who claimed in 2020. Provincial supply restrictionsdue to COVID-19 increased private drug claim costs — but also highlighted asavings opportunity for private drug plans to leverage 90 days’ supply refillrequirement for chronic treatments.
Innovative Medicines Canada Cost Drivers Analysis of Private Drug Plans in Canada 2021 29

30 Innovative Medicines Canada Cost Drivers Analysis of Private Drug Plans in Canada 2021
11. RECOMMENDATIONS
1. Chronic disease continues to be the largest contributor tooverall costs and claims growth. There is an opportunityfor employers to offer programs to improve plan memberhealth and reduce the risk of their plan members developing chronic diseases. Reductions in the prevalence of chronicdisease could have a significant impact on future drugtrends by freeing up dollars for future new medications.
2. There is an opportunity to reduce the cost of claims byencouraging the use of plan designs that require 90 daysof supply for chronic medications. This will lower claimscosts by reducing the other charges of a claim not relatedto the drug costs, such as dispensing fees and markups asa percentage of each claim.
3. Although drug plans represent a significant cost to plansponsors, there needs to be an equal measure of the valueof the coverage and the outcomes the drugs deliver to planmembers, their families, and the organization.
This report analyzes drug claims, which are only one of the components used to determine health benefit premiums paid by plan sponsors. There are opportunities for collaboration to improve the insurance industry’s risk management and pooling methodology to better meet the needs of Canadian plan sponsors and ensure long-term benefit plan sustainability.
30 Innovative Medicines Canada Cost Drivers Analysis of Private Drug Plans in Canada 2021

Innovative Medicines Canada Cost Drivers Analysis of Private Drug Plans in Canada 2021 31
DATA SOURCES, METHODOLOGY, AND DEFINITIONS
1. The analysis in this report is based on the IQVIA Private Drug Plan Claims database,the largest national private drug plan claims database in Canada, which represents82% of pay direct private drug claims nationally. (Figures in this report have notbeen adjusted to represent 100% of the market.)
2. Drug claims represent only one component of the overall cost of a private drugbenefit plan. (See Figure 20.) An insurer’s risk management process, premiumsetting processes, and pooling methodology all contribute to the actual benefitplan cost paid by plan sponsors. (For more information see Innovative MedicinesCanada’s 2016–2019 Analysis of Private Drug Claim Cost Drivers, Section 9, HealthBenefit Premiums.)
3. Claims costs are based on eligible amount, including both the plan-paid andthe patient-paid portions, and include drug ingredient costs and pharmacyand wholesaler markups (dispensing fees are not included, except in Quebec).The exception to this is Section 5, Impact of Days’ Supply Limits, which includesdispensing fee. However, since dispensing fee data is not available in Quebec, itis excluded from this section.
4. A “claim” in this analysis is defined as one fill for one drug identification number(DIN) at one time. The cost may vary from claim to claim, based on the number ofdays supplied for each claim.
5. Although private spending on drugs includes group benefit plans, individualhealth insurance, and cash-paying customers, this report includes only drug paydirect claims processed through group and individual private drug plans, and notinsured cash-paying customers.
Innovative Medicines Canada Cost Drivers Analysis of Private Drug Plans in Canada 2021 31

32 Innovative Medicines Canada Cost Drivers Analysis of Private Drug Plans in Canada 2021
20%
22%
58%Total Cost of Claim
Insurance Charges
Wholesale Markup + Pharmacy Markup + Dispensing Fees
Manufacturer’s List Price (MLP)
27%
73%
Up to
Total Cost of Prescription* Wholesale Markup +
Pharmacy Markup + Dispensing Fees
Manufacturer’s List Price (MLP)
Breaking Down the Total Cost of PrescriptionsBreaking Down the Total Cost of Prescriptions
*QC markup includes dispensing fees.** All $ values are projected using QIMS claims capture rates†For fully pooled/insurance plans.
†
Figure 21. Breaking Down the Total Cost of Prescriptions
32 Innovative Medicines Canada Cost Drivers Analysis of Private Drug Plans in Canada 2021

Innovative Medicines Canada Cost Drivers Analysis of Private Drug Plans in Canada 2021 33
AUTHORS:Viktoria Roman, Innovative Medicines CanadaJoe Farago, Innovative Medicines CanadaSuzanne Lepage, Suzanne Lepage Consulting Inc. .
COST DRIVERS REPORT 2021Innovative Medicines Canada represents
Canada’s innovative pharmaceutical industry.
55 Metcalfe Street, Suite 1220Ottawa, Ontario K1P 6L5 http://innovativemedicines.ca/
SUGGESTED CITATION:Innovative Medicines Canada (2021). Innovative Medicines Canada Cost Drivers Analysis of Private Drug Plans in Canada 2021Readers are welcome to cite any information in this reportwith attribution to Innovative Medicines Canada