Cost-Benefit Analysis Alternative Fuels and Motive Designs
125
U.S. Department of Transportation Federal Railroad Administration Cost-Benefit Analysis of Alternative Fuels and Motive Designs Office of Research and Development Washington, DC 20590 DOT/FRA/ORD-13/21 Final Report April 2013
Transcript of Cost-Benefit Analysis Alternative Fuels and Motive Designs

U.S. Department of Transportation
Federal Railroad Administration
Cost-Benefit Analysis of Alternative Fuels and Motive Designs
Office of Research and Development Washington, DC 20590
DOT/FRA/ORD-13/21 Final Report April 2013

NOTICE
This document is disseminated under the sponsorship of the Department of Transportation in the interest of information exchange. The United States Government assumes no liability for its contents or use thereof. Any opinions, findings and conclusions, or recommendations expressed in this material do not necessarily reflect the views or policies of the United States Government, nor does mention of trade names, commercial products, or organizations imply endorsement by the United States Government. The United States Government assumes no liability for the content or use of the material contained in this document.
NOTICE
The United States Government does not endorse products or manufacturers. Trade or manufacturers’ names appear herein solely because they are considered essential to the objective of this report.

i
REPORT DOCUMENTATION PAGE Form Approved OMB No. 0704-0188
Public reporting burden for this collection of information is estimated to average 1 hour per response, including the time for reviewing instructions, searching existing data sources, gathering and maintaining the data needed, and completing and reviewing the collection of information. Send comments regarding this burden estimate or any other aspect of this collection of information, including suggestions for reducing this burden, to Washington Headquarters Services, Directorate for Information Operations and Reports, 1215 Jefferson Davis Highway, Suite 1204, Arlington, VA 22202-4302, and to the Office of Management and Budget, Paperwork Reduction Project (0704-0188), Washington, DC 20503.
1. AGENCY USE ONLY (Leave blank)
2. REPORT DATE April 2013
3. REPORT TYPE AND DATES COVERED Technical Report
4. TITLE AND SUBTITLE Cost-Benefit Analysis of Alternative Fuels and Motive Designs
5. FUNDING NUMBERS DTFR-53-00-C-00012
Task Order 249
6. AUTHOR(S) Chris Pinney and Brian Smith
7. PERFORMING ORGANIZATION NAME(S) AND ADDRESS(ES) Transportation Technology Center, Inc. 55500 DOT Road Pueblo, CO 81001
8. PERFORMING ORGANIZATION REPORT NUMBER
9. SPONSORING/MONITORING AGENCY NAME(S) AND ADDRESS(ES) U.S. Department of Transportation Federal Railroad Administration Office of Research and Development Washington, DC 20590
10. SPONSORING/MONITORING AGENCY REPORT NUMBER
DOT/FRA/ORD-13/21
11. SUPPLEMENTARY NOTES COTR: Melissa Shurland 12a. DISTRIBUTION/AVAILABILITY STATEMENT This document is available to the public through the FRA Web site at http://www.fra.dot.gov.
12b. DISTRIBUTION CODE
13. ABSTRACT (Maximum 200 words) This project was funded by the Federal Railroad Administration to better understand the potential cost and benefits of using alternative fuels for U.S. freight and passenger locomotive operations. The framework for a decision model was developed by Transportation Technology Center, Inc., to evaluate the feasibility of these newly emerging technologies. Because these alternatives (fuels and engine designs) are at early stages of development, the objective is to identify the most feasible alternatives and support their future development. Various government agencies, U.S. railroads, and the original equipment manufacturers of locomotives are considered the primary stakeholders in this study.
The biodiesel blend of B20 is compared with the baseline technology (petroleum diesel) using an operating scenario for Class I railroad line-haul operations in 2010 to demonstrate the decision model approach in this study from a volumetric standpoint. This is not a recommendation for using B20 in railroad operations, but it is a good case with which to illustrate the decision framework developed to analyze alternative fuels for future research and development initiatives. The main drivers for the decision model identified in this research effort are cost, energy security, emissions, safety, and efficiency. Under each decision driver, there are multiple criteria that may be used for comparison between proposed alternatives. The goal is to understand if the criteria under the decision drivers are independently a cost or a benefit to industry stakeholders compared with the baseline. 14. SUBJECT TERMS Cost-benefit analysis, alternative fuels, biodiesel, motive designs
15. NUMBER OF PAGES 125
16. PRICE CODE
17. SECURITY CLASSIFICATION OF REPORT Unclassified
18. SECURITY CLASSIFICATION OF THIS PAGE Unclassified
19. SECURITY CLASSIFICATION OF ABSTRACT Unclassified
20. LIMITATION OF ABSTRACT
NSN 7540-01-280-5500 Standard Form 298 (Rev. 2-89) Prescribed by ANSI Std. 239-18
298-102

ii
METRIC/ENGLISH CONVERSION FACTORS ENGLISH TO METRIC METRIC TO ENGLISH
LENGTH (APPROXIMATE) LENGTH (APPROXIMATE) 1 inch (in) = 2.5 centimeters (cm) 1 millimeter (mm) = 0.04 inch (in) 1 foot (ft) = 30 centimeters (cm) 1 centimeter (cm) = 0.4 inch (in)
1 yard (yd) = 0.9 meter (m) 1 meter (m) = 3.3 feet (ft) 1 mile (mi) = 1.6 kilometers (km) 1 meter (m) = 1.1 yards (yd)
1 kilometer (km) = 0.6 mile (mi)
AREA (APPROXIMATE) AREA (APPROXIMATE) 1 square inch (sq in, in2) = 6.5 square centimeters (cm2) 1 square centimeter (cm2) = 0.16 square inch (sq in, in2)
1 square foot (sq ft, ft2) = 0.09 square meter (m2) 1 square meter (m2) = 1.2 square yards (sq yd, yd2) 1 square yard (sq yd, yd2) = 0.8 square meter (m2) 1 square kilometer (km2) = 0.4 square mile (sq mi, mi2) 1 square mile (sq mi, mi2) = 2.6 square kilometers (km2) 10,000 square meters (m2) = 1 hectare (ha) = 2.5 acres
1 acre = 0.4 hectare (he) = 4,000 square meters (m2)
MASS - WEIGHT (APPROXIMATE) MASS - WEIGHT (APPROXIMATE) 1 ounce (oz) = 28 grams (gm) 1 gram (gm) = 0.036 ounce (oz) 1 pound (lb) = 0.45 kilogram (kg) 1 kilogram (kg) = 2.2 pounds (lb)
1 short ton = 2,000 pounds (lb)
= 0.9 tonne (t) 1 tonne (t)
= =
1,000 kilograms (kg) 1.1 short tons
VOLUME (APPROXIMATE) VOLUME (APPROXIMATE) 1 teaspoon (tsp) = 5 milliliters (ml) 1 milliliter (ml) = 0.03 fluid ounce (fl oz)
1 tablespoon (tbsp) = 15 milliliters (ml) 1 liter (l) = 2.1 pints (pt) 1 fluid ounce (fl oz) = 30 milliliters (ml) 1 liter (l) = 1.06 quarts (qt)
1 cup (c) = 0.24 liter (l) 1 liter (l) = 0.26 gallon (gal) 1 pint (pt) = 0.47 liter (l)
1 quart (qt) = 0.96 liter (l) 1 gallon (gal) = 3.8 liters (l)
1 cubic foot (cu ft, ft3) = 0.03 cubic meter (m3) 1 cubic meter (m3) = 36 cubic feet (cu ft, ft3) 1 cubic yard (cu yd, yd3) = 0.76 cubic meter (m3) 1 cubic meter (m3) = 1.3 cubic yards (cu yd, yd3)
TEMPERATURE (EXACT) TEMPERATURE (EXACT)
[(x-32)(5/9)] °F = y °C [(9/5) y + 32] °C = x °F
QUICK INCH - CENTIMETER LENGTH CONVERSION10 2 3 4 5
InchesCentimeters 0 1 3 4 52 6 1110987 1312
QUICK FAHRENHEIT - CELSIUS TEMPERATURE CONVERSIO -40° -22° -4° 14° 32° 50° 68° 86° 104° 122° 140° 158° 176° 194° 212°
°F
°C -40° -30° -20° -10° 0° 10° 20° 30° 40° 50° 60° 70° 80° 90° 100°
For more exact and/or other conversion factors, see NIST Miscellaneous Publication 286, Units of Weights and Measures. Price $2.50 SD Catalog No. C13 10286 Updated 6/17/98

iii
Contents
Executive Summary……………………………………………………………………………….1
1. Introduction .................................................................................................................. 4
1.1 Background ................................................................................................................. 5
1.2 Objectives .................................................................................................................... 6
1.3 Overall Approach ........................................................................................................ 6
1.4 Scope ........................................................................................................................... 7
2. Stakeholder Overview ................................................................................................. 8
2.1 Class I Railroad ........................................................................................................... 8
2.1.1 Locomotive Designs ...................................................................................... 9
2.1.2 Railroad Operations ..................................................................................... 11
2.2 Passenger (Amtrak) ................................................................................................... 15
2.3 Original Equipment Manufacturers ........................................................................... 19
3. Decision Model Framework with a CBA Component .............................................. 21
3.1 Decision Drivers and Decision Model Development ................................................ 21
3.1.1 Cost .............................................................................................................. 22
3.1.2 Energy Security ........................................................................................... 23
3.1.3 Safety (Risk Aassessment) .......................................................................... 24
3.1.4 Emissions .................................................................................................... 25
3.1.5 Efficiency .................................................................................................... 27
3.2 Alternative Fuel Comparison Case (Biodiesel, B20) ................................................ 28
3.2.1 Cost .............................................................................................................. 31
3.2.2 Energy Security ........................................................................................... 32
3.2.3 Emissions .................................................................................................... 33
3.2.4 Safety ........................................................................................................... 33
3.2.5 Efficiency .................................................................................................... 33
3.3 B20 Comparison with No. 2 Diesel........................................................................... 36
3.3.1 Cost .............................................................................................................. 38
3.3.2 Energy Security ........................................................................................... 38
3.3.3 Emissions .................................................................................................... 39
3.3.4 Safety ........................................................................................................... 39

iv
3.3.5 Efficiency .................................................................................................... 39
3.3.6 Cost and Benefit Results ............................................................................. 40
3.3.7 Decision Matrix Approach .......................................................................... 41
4. Conclusions................................................................................................................ 44
5. References .................................................................................................................. 46
Appendix A. Overview of Alternative Fuels and Motive Power Technologies ........................ 49
Appendix B. International – Europe ........................................................................................ 108
Appendix C. U.S. National Fire Protection Association Diamond Placard Designations ........................................................................................ 113
Abbreviations and Acronyms ..................................................................................................... 114

v
Illustrations
Figure 1. Transportation Sector Petroleum Consumption .......................................................... 5
Figure 2. Age Distribution of Locomotive Fleet December 31, 2009 ........................................ 9
Figure 3. Class I Railroad Locomotive and Fuel Spending Account Asset Base for Locomotives and Fuel Stations (Book Value) .......................................................... 12
Figure 4. Class I Railroad Locomotive Fuel Stations Compared with Locomotive Assets .................................................................................................... 12
Figure 5. Comparison of Line Haul and Yard Fuel Expenses .................................................. 13
Figure 6. Class I Railroad Efficiency Measures 1965-2010 ..................................................... 15
Figure 7. Amtrak’s Heartland Flyer Powered by a Biodiesel Fuel Blend ................................ 18
Figure 8. (a) NFPA Diamond Placard; (b) Hazard Class 3 Flammable and (c) Combustible Placards .......................................................................................... 25
Figure 9. U.S. Biodiesel Production ......................................................................................... 35
Figure 10. Gallons of Biodiesel Required by Blend (Bx) .......................................................... 36

vi
Tables
Table 1. U. S. Class I Freight Rail System Age Distribution of Locomotive Fleet......................................................................................................... 9
Table 2. Class I Railroad Locomotive Purchasing Data ......................................................... 14
Table 3. Amtrak Road Locomotive Fleet Age ........................................................................ 16
Table 4. Amtrak Switching Locomotive Fleet Age ................................................................ 17
Table 5. Line-Haul Locomotive Operations Baseline ............................................................. 22
Table 6. Measured Consumption of Petroleum Products ........................................................ 24
Table 7. NFPA 704 Baseline Measures for No. 2 Diesel ........................................................ 25
Table 8. New Line-Haul Locomotives Standards ................................................................... 26
Table 9. Energy Content of Selected Fuels ............................................................................. 27
Table 10. B20 Biodiesel Alternative Comparison with Baseline No. 2 Diesel......................... 30
Table 11. Potential Reduction in Petroleum Products B20 ....................................................... 32
Table 12. Comparison of Low Temperature Values for Cloud Point and Pour Point .................................................................................................................. 34
Table 13. Decision Model Comparing B20 with No. 2 Diesel ................................................. 37
Table 14. Matrix to Rank Decision Drivers with Weights ........................................................ 42
Table 15. Matrix to Rank Proposed Alternatives by Decision Driver Scores ........................... 42
Table 16. Matrix to Calculate the Weighted Scores for Each Alternative ................................ 43

1
Executive Summary
This project was funded by the Federal Railroad Administration (FRA) to better understand the potential cost and benefits of using alternative fuels for U.S. freight and passenger locomotive operations. The framework for a decision model was developed by Transportation Technology Center, Inc. (TTCI), to evaluate the feasibility of these newly emerging technologies. Because these alternatives (fuels and engine designs) are at early stages of development, the objective is to identify the most feasible alternatives and to support their future development. Various government agencies, U.S. railroads, and the original equipment manufacturers (OEMs) of locomotives are considered the primary stakeholders in this study.
Energy security policies developed by the U.S. Department of Energy (DOE) and emission standards set forth by the U.S. Environmental Protection Agency (EPA) are driving most of the technology initiatives related to alternative fuels today. Identifying alternatives that may provide benefits in the areas of emissions and energy security in relation to their potential cost, safety, and operating efficiencies are the main analysis objectives of this study.
Energy security deals with many issues related to national security and energy policies. For the purpose of this study, the consumption of petroleum diesel fuel (fossil energy) by U.S. railroads is the key measure. Current and future issues related to petroleum products (crude oil and equivalents) used by railroads include U.S. imports (which are used in part for railroad operations) and essentially the sole energy reliance by railroads. In 2009, approximately 1.6 percent of U.S. transportation petroleum was used by railroads (1).
U.S. railroads have just recently had emission standards regulated by EPA. In 2000, the EPA mandated a set of tier emission levels for existing locomotives by the OEM build date and for new locomotives put into service. Freight and passenger locomotives are designed to meet these tier-level emission standards by using petroleum diesel. Freight railroads account for a small portion of U.S. greenhouse gas (GHG) emissions. According to EPA data, in 2009, total U.S. GHG emissions for railroads were 2.1 percent of total transportation-related emissions (2).
Some of the alternative energy sources being studied and that may be in limited use are biomass, natural gas, and coal. These energy sources have the potential to replace diesel fuel and provide power for locomotive operations. However, most are considered experimental by the railroad industry. In most cases, engine modifications or complete motive power design changes are required. As a result, the use of alternative fuels or locomotive designs that are different from current diesel engine designs represents only a small percentage of the total fleet.
Current fuel standards allow an alternative fuel blend of up to 5-percent biodiesel (B5) with the remaining 95 percent made up of conventional diesel. Biodiesel refers to the fuel produced from renewable sources (biomass). This mixture will meet the American Standard for Testing and Materials (ASTM) D975 diesel fuel specification and can be used in any application as if it were pure petroleum diesel (3). These concentrations are being used in locomotive operations in small amounts today.
By the mid-1960s, essentially all freight locomotives owned and operated by U.S. railroads were dieselized. Passenger locomotives represent a small percentage of the locomotive fleet with a mix of electric and diesel electric; the latter providing the dominate power. Therefore, the baseline case for comparison to proposed alternatives is diesel-electric locomotive technology

2
and its fueling infrastructure. In 2010, just over 28,000 diesel-electric locomotives were in the U.S. fleet for freight and passenger service. This includes both switching (yard) and line-haul (mainline) units.
As an assessment of the cost structure for the railroad industry using a Class I railroad example, expenditures related to locomotives (acquisitions and repair and maintenance) and fueling (fuel and fueling stations) averaged over $12 billion annually from 2008 to 2010. This represents over 25 percent of total Class I railroad spending annually. In addition, the locomotive fleet ranked second in total railroad assets at just over $4.7 billion in 2010. Therefore, alternatives may have significant financial impacts on railroad cost structure and future investments strategies.
On the basis of the literature search and interview process for this study, biodiesel was the alternative selected as a comparison case to the baseline (diesel locomotive technology). Specifically, the blend of 20-percent biodiesel and 80-percent petroleum diesel (B20) was studied. B20 is the most commonly used biodiesel blend for all transportation modes in the United States (4). Resources used to refine biomass into fuel (biodiesel) are a renewable energy source and is typically produced domestically.
The biodiesel blend of B20 is compared with the baseline technology (petroleum diesel) using an operating scenario for Class I railroad line-haul operations in 2010 to demonstrate the decision model approach in this study from a volumetric standpoint. This is not a recommendation for using B20 in railroad operations but a good comparison case to illustrate the decision framework developed to analyze alternative fuels for future research and development initiatives.
The main drivers for the decision model identified in this research effort are cost, energy security, emissions, safety, and efficiency. Under each decision driver, there are multiple criteria that may be used for comparison between proposed alternatives. The goal is to understand whether the criteria under the decision drivers are independently a cost or a benefit to industry stakeholders as compared with the baseline. Only the fuel production ($/diesel gallon equivalent) (DGE) criterion under the cost decision driver and petroleum products (diesel fuel displaced) criterion under the energy security decision driver are independently quantified and compared with the baseline in this B20 comparison case based on available data.
For the B20 scenario, the fuel production criterion under the cost decision driver would require railroads (Class I) to pay a premium of 3.5 percent in fuel costs or just over $250 million dollars for line-haul operations in 2010 by using a biodiesel blend of B20. The price of biodiesel is consistently higher than No. 2 diesel. By normalizing the B20 price by DGE (energy content), there is a further separation in cost between diesel and B20. The price of biodiesel is also affected by the Federal Excise Tax Credit (5); without this subsidy, the retail price to consumers would be even higher than current prices.
The petroleum products criterion under the energy security decision driver using B20 would provide a benefit by displacing approximately 667.5 million gallons of diesel, which is equivalent to approximately 15.7 million barrels of petroleum. This can be normalized into million barrels per day (MMbd), which equals approximately 0.04 (MMbd) of petroleum. The

3
0.04 MMbd estimate represents approximately 0.23 percent of U.S. consumption (19.1 MMbd) or 0.37 percent of U.S. imports (11.8 MMbd) in 2010.1
There is considerable interest in the highest U.S. policy circles to improve energy security (6). Therefore, significant resources have been put into assessing the energy security benefits of reduced U.S. oil imports. With U.S. Federal-proposed rulemaking data for the on-highway vehicle sector, an estimate of the oil import premium is $13.13 per barrel (2009 dollars) (7). Because the proposed rulemaking is evaluating the reduction of petroleum imports through fuel efficiency, it provides an equitable approach for this study. Calculating the 15.7 million barrels of petroleum by the $13.13 per barrel premium yields an estimated societal benefit of just over $200 million.
To populate the remaining inputs for the other decision driver criteria for the B20 comparison case, recommended research and testing for cost (locomotive durability testing and a fueling infrastructure study), energy security (availability and sustainability study), emissions (laboratory tier level emissions testing), and efficiency (fuel consumption and cold temperature testing operations) are recommended to develop a more robust decision model. FRA, railroads, and OEMs are currently addressing some of these important issues.
As an example, FRA sponsored a 1-year test trial in 2010 using a biodiesel fuel blend of B20 to power the Heartland Flyer passenger locomotive, putting this innovation on Time’s list of “The 50 Best Inventions of 2010” (8). The primary objective of the test trial was to evaluate the feasibility and effectiveness of utilizing biodiesel as an alternative fuel. Information from this test trial will be supported with more detailed laboratory testing at Southwest Research Institute (SwRI). Information from these initiatives will help develop criteria under the emissions (tier level emissions) and efficiency (fuel consumption) decision drivers.
Because of the mature nature of diesel locomotive technology for freight and passenger railway operations and its fueling infrastructure, no alternative fuels or motive power designs that differentiate from current diesel technology can be cost justified from the research conducted in this study. Diesel locomotive technology was essentially fully integrated into U.S. railroad operations by the mid-1960s.
However, comparisons among selected alternative fuels and motive power designs are recommended under this framework approach to address future issues related to the rising cost and supply of petroleum diesel fuel and the emission standards required for U.S. railroads. Cooperation among industry stakeholders is vital to the success of evaluating alternatives for future consideration.
1 If B20 replaces diesel fuel, 0.04 million barrels of diesel fuel would be saved per day. The consumption of diesel fuel in the United States is 19.1 million barrels per day, and the import is 11.8 million barrels per day. Therefore, by using B20, saving 0.04 million barrels per day would save approximately 0.23 percent in consumption and 0.37 percent in import.

4
1. Introduction
This project was funded by FRA to better understand the potential cost and benefits of using alternative fuels for U.S. freight and passenger locomotive operations. The framework for a decision model was developed to support industry stakeholders as they evaluate the feasibility of these newly emerging technologies. The primary stakeholders considered in this study are government, railroads, and manufacturers of locomotives in the United States.
As the regulatory body of the railroad industry, safety, cost, and the efficiency of these new alternatives (fuels and engine designs) and the locomotives and infrastructure that may be affected by them are important factors for FRA to monitor as other regulatory groups develop national energy and emissions policies. The emissions standards set forth by EPA in 2000 for locomotives and DOE policies related to energy security are driving some of these technology initiatives. Therefore, energy security and emissions are the main problems to understand in relation to the potential use of alternative fuels and motive power technologies.
Energy security deals with many issues related to national security and energy policies; however for the purpose of this study, the amount of petroleum-based diesel fuel used in railroad transportation and how proposed alternative fuels and motive power designs may affect current consumption levels are important issues to understand. The two specific areas of concern are the amount of imported oil the United States consumes and the future depletion of conventional petroleum resources. As conventional petroleum (crude oil) resources become depleted, alternative energy resources will increasingly replace them. Although emissions are an important problem, EPA emissions standards now regulate this problem.
Petroleum-based diesel powers the modern diesel-electric locomotive. It is derived from fossil energy resources. Some of the alternative energy sources being studied, and that may be in limited use, are biomass, natural gas, hydrogen, and coal. These energy sources have the potential to power the electric traction motors for locomotive operations. However, most are considered experimental by the railroad industry today. In most cases, engine modifications and complete motive power design changes are required. These changes may have a significant impact on railroad infrastructure and locomotive operations on a large scale. Resource availability and the environmental impact of some alternative energy sources are other important issues that must be addressed.
Alternative fuels and motive power designs that differentiate from the modern diesel-electric locomotives for freight and passenger operations are at an early stage of development and usage in the railroad industry today. The number of locomotive units in switching (yard operations) service that differentiate from current designs represents a very small percentage of the total fleet, and there are currently no line-haul (mainline) locomotive units in revenue service. Current fueling standards allow an alternative fuel blend of up to 5-percent biodiesel (B5) with the remaining part made up of conventional diesel. Therefore, small amounts of biodiesel blends are being consumed with some benefits on the emissions side and a small reduction in the consumption of fossil fuel-based petroleum (crude oil).

5
1.1 Background Modern locomotive operations have been influenced significantly by the introduction of the diesel-electric locomotive design introduced in the 1940s. By the mid-1960s, essentially all locomotives owned and operated by Class I railroads were dieselized. The remaining fleet consisted of a few steam engines, several hundred electric, and around 30 gas turbine locomotives. Today, virtually all locomotives are diesel electric. There are approximately 28,000 diesel electric locomotives in operation on the U.S. freight and passenger railroad system.
Of this number, approximately 24,000 are Class I railroad owned or operated with the remaining 4,000 owned or operated by shortline and passenger (9, 10, 11). (On average, 800–1,000 units are purchased, and around 125 are rebuilt annually (10) for Class I railroads.) With retirements of older locomotives, the entire fleet size has remained consistently at 28,000 since 1965 (11). However, the average horsepower (hp) per unit has increased significantly. The typical line-haul unit today would be over 4,000 hp. On the passenger side, the National Railroad Passenger Corporation (Amtrak) operates a mix of electric and diesel locomotives. Diesel is the predominate power source for the passenger fleet, which consists of approximately 500 locomotives.
Locomotives operate over a vast network. The U.S. Class I railroad system covers nearly 124,000 miles of track in the United States. It works as an interchange system; therefore locomotives and freight cars operate between railroad carriers and require consistent fueling infrastructure, repair, and maintenance facilities. Interchange operations extend into Canada and Mexico. Locomotive operations are designed almost exclusively for compression-ignition engine technology using ASTM fuel specifications. Amtrak, the largest passenger service railroad serves more than 500 destinations in 46 states and three Canadian provinces on more than 21,200 miles of routes. Amtrak operates a mix of diesel and electric locomotives, and diesel is the predominate power for locomotive passenger operations.
Figure 1 shows approximately 1.6 percent of the U.S. transportation sector (highway and nonhighway) petroleum is consumed by U.S. railroads (12). Because the consumption of diesel fuel requires fossil-based energy sources, the United States imports foreign oil to meet this demand. On a net basis, the United States imports nearly 50 percent of the oil it consumed (13). U.S. policies suggest a link between oil imports and U.S. national security (14). One of the DOE’s main policy themes is developing programs to improve energy security for the United States.
Figure 1. Transportation Sector Petroleum Consumption
Pipeline0.0%
Highway86.4%
Water4.3%
Air7.6%
Rail1.6%

6
In 1965, the railroad industry reported consumption of just over 3.5 billion gallons of diesel fuel with the average price of $0.09 per gallon. An important point is that fuel costs represented approximately 3.5 percent of the industry’s total operating expenses. In 2008, Class I railroads reported the consumption of 3.9 billion gallons of diesel fuel with an average price of $3.12 per gallon. In 2009 with the recession looming, car loads declined, and the consumption of diesel declined to 3.2 billion gallons at a price point of $1.77 per gallon with less demand. In 2010, consumption increased to 3.5 billion gallons at an average price per gallon of $2.25 with total fuel expenses of about $7.9 billion, representing nearly 19 percent of total operating expenses ($42.7 billion). For 2008, 2009, and 2010, the percentage of total operating expenses for fuel was 26, 15, and 19 percent, respectively. The number of gallons consumed between the mid-1960s and today has not changed significantly, but the efficiency with which the fuel is utilized and the financial landscape for railroad spending on fuel has changed.
On the emissions side, U.S. railroads have only recently had emission standards regulated by EPA. In 2000, EPA developed a set of tier-level emission standards for existing locomotives by OEM build date and for new locomotives put into service. Freight railroads account for only a small portion of U.S. GHG emissions. According to EPA data, total U.S. GHG emissions in 2009 were 6,633 teragrams (trillion grams) of carbon dioxide equivalents. Nontransportation sources (power plants, industry, etc.) accounted for 73 percent of this total, and transportation accounted for the remaining 27 percent. The 37.2 teragrams accounted for by freight railroads was just 0.6 percent of total U.S. GHG emissions from all sources and just 2.1 percent of transportation-related GHG emissions (2).Therefore, the main goal on the emission side today is developing technology to meet EPA tier emission levels through retrofit programs or new designed locomotives.
1.2 Objectives For this study, alternative fuels and motive power designs in use or under consideration for use around the world for freight and passenger railroad transportation were investigated. The current strategies and recommendations of industry stakeholders (railroads and OEMs) were reviewed. The most practical fuels that may be supported by the industry were analyzed. A decision model with a Cost Benefit Analysis (CBA) component that may be used to compare selected alternatives to current technology (conventional diesel locomotive engines) was developed.
1.3 Overall Approach The approach of this study is to develop the framework for a decision model that may be used to compare and contrast potential alternative fuels and motive power designs to existing technology using fossil-based diesel fuel and modern locomotive compression-ignition engines. Key drivers included in the framework are safety, cost, and efficiency implications for selected alternatives. Identifying technology-based solutions to help reduce U.S. reliance on fossil fuel-based energy sources (energy security) and meeting emissions regulations is the main objective of this study. Therefore, the key decision drivers in the study are cost, energy security, emissions, safety and efficiency, with their associated criteria.
Input from four primary stakeholder groups helped formulate the framework of this study: FRA, freight (Class I), passenger (Amtrak) railroads, and the OEMs that build, retrofit, and maintain diesel-electric locomotives in U.S. operations. In addition, an international perspective, primarily from Europe, was assessed.

7
1.4 Scope Developing the framework for a decision model to support industry stakeholders as they evaluate the feasibility of alternatives to diesel fuel and diesel locomotive technology is the primary objective of this study. Stakeholders for this study are the U.S. Government (FRA), railroads (freight and passenger), and manufacturers of locomotives.
The following are key deliverables:
• Overview of Class I railroad, passenger railroad (Amtrak), and OEM strategies as they relate to alternative fuels and motive power designs (Section 2).
• Selection and overview of potential alternative fuels and motive power designs for the North American railroad industry (Appendix A).
• Overview of initiatives and strategies for using alternatives to fossil fuel-based rail technology in Europe (Appendix B).
• Development of the framework for a decision model with a cost-benefit analysis (CBA) component to support industry stakeholders as they evaluate the feasibility of alternatives to diesel fuel and diesel locomotive technology (Section 3).
• Selection of an alternative (fuels and or engine designs) to illustrate the proposed decision model framework for analyzing alternative fuels and motive power designs (Section 3.2)
• Development of a decision matrix to support the decision model analysis component. Under the framework for the decision model, this is a proposed component for the decisionmaking process between stakeholders (Section 3.3.7).

8
2. Stakeholder Overview
This section provides an overview of Class I railroad, passenger railroad (Amtrak), and OEM strategies as they relate to alternative fuels and motive power designs. A series of interviews were conducted with each stakeholder group. The primary goal was to better understand the perspective of the various stakeholders in regard to the potential of alternative fuels and motive power designs and to identify what factors impact their decisions when considering the various technologies.
2.1 Class I Railroad There are seven Class I railroads: BNSF Railway (BNSF), CSX Transportation, Grand Trunk Corporation (owned by Canadian National Railway Company), Kansas City Southern Railway Company, Norfolk Southern Corporation, Soo Line (owned by Canadian Pacific), and Union Pacific Railroad Company (UP). Together with their counterparts in Canada and Mexico, the U.S. freight railroads form the world’s most efficient, lowest-cost freight rail system. In addition to providing shippers with an affordable and an efficient way to move their products, freight railroads provide enormous public benefits, including fuel efficiency, low GHG emissions, and reduced highway congestion.
2.2 Locomotive Fleet Modern U.S. locomotive operations have been influenced significantly by the introduction of the diesel-electric locomotive design introduced in the 1940s. By the mid-1960s, essentially all locomotives owned and operated by Class I railroads were dieselized. The remaining fleet consisted of a few steam engines, several hundred electric, and around 30 gas turbine locomotives. Today, virtually all Class I railroad locomotives are diesel electric. There are approximately 28,000 diesel-electric locomotives in operation on the U.S. freight railroad system with about 24,000 owned or operated by Class I railroads (15).
On average, 800–1,000 new locomotives are purchased and around 125 are rebuilt annually. With retirements of older locomotives, the fleet size has remained fairly consistent since 1965 (10). However, the average horsepower per unit has increased significantly. The typical line-haul unit today would be approximately 4,000 hp. Figure 2 and Table 1 show the age distribution of the fleet in 2009. New locomotives manufactured and purchased by railroads must meet EPA tier emissions standards. In addition, locomotives in service must continue to meet EPA tier emission standards by build date, including after rebuild (which in some cases is now more restrictive).

9
Figure 2. Age Distribution of Locomotive Fleet December 31, 2009
Table 1. U.S. Class I Freight Rail System Age Distribution of Locomotive Fleet
Locomotives in Age Bracket
Date Built* Number Percent
Jan. 1, 2009–Dec. 31, 2009 461 1.9
Jan. 1, 2008–Dec. 31, 2008 777 3.2
Jan. 1, 2007–Dec. 31, 2007 911 3.8
Jan. 1, 2006–Dec. 31, 2006 1,122 4.7
Jan. 1, 2005–Dec. 31, 2005 875 3.6
Jan. 1, 2000–Dec. 31, 2004 4,650 19.3
Jan. 1, 1995–Dec. 31, 1999 4,173 17.4
Jan. 1, 1990–Dec. 31, 1994 2,464 10.2
Jan. 1, 1985–Dec. 31, 1989 1,558 6.5
Before 1985 7,054 29.3
Total 24,045 100.0
*Disregards year of rebuilding. Represents 2009 Class I railroad statistics.
2.2.1 Locomotive Designs Excerpts from this section are developed from a report for FRA on “Rail Efficiency Study” (16). Locomotives in the United States typically use a large bore (500–750 cubic inches per cylinder), medium-speed (up to approximately 1150 rpm) design of diesel engine. Locomotive engines typically range from 8 to 20 cylinders, dependent on horsepower requirements. Both two-cycle and four-cycle diesel engine technologies are used.
4 yrs.4%
3 yrs.5%
2 yrs.4%
20-24 yrs.6% 1 yr.
3%
> 1 yr.2%
25 > yrs.30%
15-19 yrs.10%
5-9 yrs.19%
10-14 yrs.17%

10
Historically, freight locomotives ranged from 1,500 to 3,600 hp. In the early 1990s, locomotive horsepower increased to over 4,000 hp. A limited number (~300) of locomotives of up to 6,000 hp were developed and sold.
Currently, there are no new four-axle medium hp locomotives being manufactured by Electro-Motive Diesel, Inc. (EMD), or General Electric Transportation Systems (GETS). Four-axle locomotives are important for yard operations because of their ability to safely negotiate sharp curves on industrial and branch lines, and bridges and trestles with limited weight capacities. Several small manufacturers offer four-axle locomotives that are essentially remanufactured EMD locomotives. Repowering a previously owned locomotive versus purchasing a remanufactured locomotive was another factor in selecting the repower alternative, because it avoids the cost of purchasing the locomotive platform.
2.3 Alternative Fuels – Locomotives Biodiesel fuel is an alternative to diesel fuel now being considered in multiple railroad demonstration projects. Mixtures of biodiesel and regular No. 2 diesel at mix levels from 2 percent to approximately 20 percent are being considered.
Several alternatives to diesel powered locomotives have been demonstrated and tested over the last 20 plus years; e.g., UP has tested a line-haul locomotive powered by natural gas. For this case, a fuel tender was required to allow enough fuel storage capacity to traverse the given routes (usually requires liquefied natural gas (LNG) to have enough storage capability). Additionally, the BNSF continues to operate four natural gas locomotives in switcher service in California.
Another demonstration of alternative fuels usage was a cooperative program between the U.S. Department of Defense (DOD), BNSF, and a private company called Vehicle Projects from Golden, Colorado. The demonstration used the Green Goat concept hybrid locomotive where the small diesel engine was replaced by a pair of fuel cells that ran off of stored hydrogen. Green Goat locomotives work under the principal that smaller high efficiency four-cycle diesel engines can be run at a continuous high speed (efficient operating point) to charge a bank of storage batteries. Utilizing the existing traction motor system, the batteries are used as the main power source for “high power” switching operations. Because it is a switching operation, the traction system is not utilized as often for long periods of high power operations. The system does require sufficient diesel engine power and battery storage capability to last through the required duty cycles for typical line-haul operations. That concept completed its demonstration and is currently under phase II development to increase the duty cycle capability for the unit (i.e., larger battery storage, lighter weight battery technology, and increased hydrogen storage).
Several other possible fuels are available for consideration, which have a variety of hardware change requirements onboard the locomotive such as the potential for cryogenic fuel storage and, in some cases, significant modifications of the existing diesel engine.
2.3.1 Repower Alternatives Four-axle locomotives are important for switching operations because of their ability to safely negotiate light track, sharp curves on industrial and branch lines, and for bridges and trestles with limited weight capacities. Several small manufacturers offer four-axle locomotives that are essentially remanufactured EMD locomotives.

11
Options are available to repower older four- and six-axle switcher size locomotives with newer, efficient, medium-speed large bore, clean burning engines or to utilize multiple smaller output four-cycle high efficiency, clean burning engines. Each option provides the ability to improve the efficiency of older locomotive designs and is offered to allow older locomotives to be brought up to more current efficiency and emissions standards rather than to simply continue to rebuild them at former standards.
Wabtec’s website on a multi-engine (GenSet) low emission switcher suggests a fuel savings of up to 35 percent depending on duty cycle, with emissions benefits of 70–90 percent (an improvement from Tier 0 to Tier 2 EPA emissions levels).
EMD offers an eight-cylinder 710ECO engine technology repower kit. The locomotive is certified to Tier 0 because typically the built dates of the original locomotives fall into the Tier 0 time span. According to EMD, the engines actually perform at Tier 2 levels. This environmentally friendly performance is achieved with up to 25-percent savings in fuel consumption and over 50-percent lube oil savings and is augmented by a fully integrated Automatic Engine Start Stop system that can reduce engine idle time by over 50 percent.
2.3.2 Railroad Operations Railroad stakeholders recognized several primary cost centers that may be benchmarked to current operations. These benchmarks may be used to compare how the potential implementation of alternative fuels and motive power designs affect locomotive and fueling infrastructure cost structures. Capital expenditures, operating expenses, and the investments in railroad assets that may be affected by these new technologies are all important issues.
The most important cost centers to railroad stakeholders are the following: (1) the annual costs of diesel fuel consumed in line haul and yard operations, (2) initial capital cost of newly purchased locomotives and average capital expenditures per year for the fleet, (3) repair and maintenance expenses of the locomotive fleet, and (4) the infrastructure cost of fueling stations, and current fuel efficiency of the locomotive fleet.
Figure 3 shows railroad spending by accounts that may be affected by alternative fuels and motive power designs. The Locomotive Bar shows a 3-year average (2008–2010) for capital expenditures of locomotive acquisitions and operating expenses for repair and maintenance of the fleet at $3.4 billion annually. The Fuel Bar also shows a 3-year average (2008–2010) for capital expenditures of fuel stations and operating expenses for fuel at $8.6 billion annually. Total spending for the locomotive and fuel accounts was over $12 billion annually. Using a 3-year average, these accounts represent over 25 percent of total Class I railroad spending annually. Therefore, major cost centers are associated with these potential new technologies (17).

12
OPEX = operating expenses; CAPEX = capital expenditures
Figure 3. Class I Railroad Locomotive and Fuel Spending Account Asset Base for Locomotives and Fuel Stations (book value)
Assets that Class I railroads are invested in are important accounts to understand from a cost structure standpoint when considering technology changes to the system. In 2010, the locomotive fleet ranked second to rail in total railroad assets. Figure 4 shows fueling stations for locomotive fueling operations are small compared with locomotive assets. However, $547 million is a significant investment in any industry, and the combined asset base of $4.7 billion for both accounts is a major investment as it relates to current railroad operations (17).
Figure 4. Class I Railroad Locomotive Fuel Stations Compared with Locomotive Assets
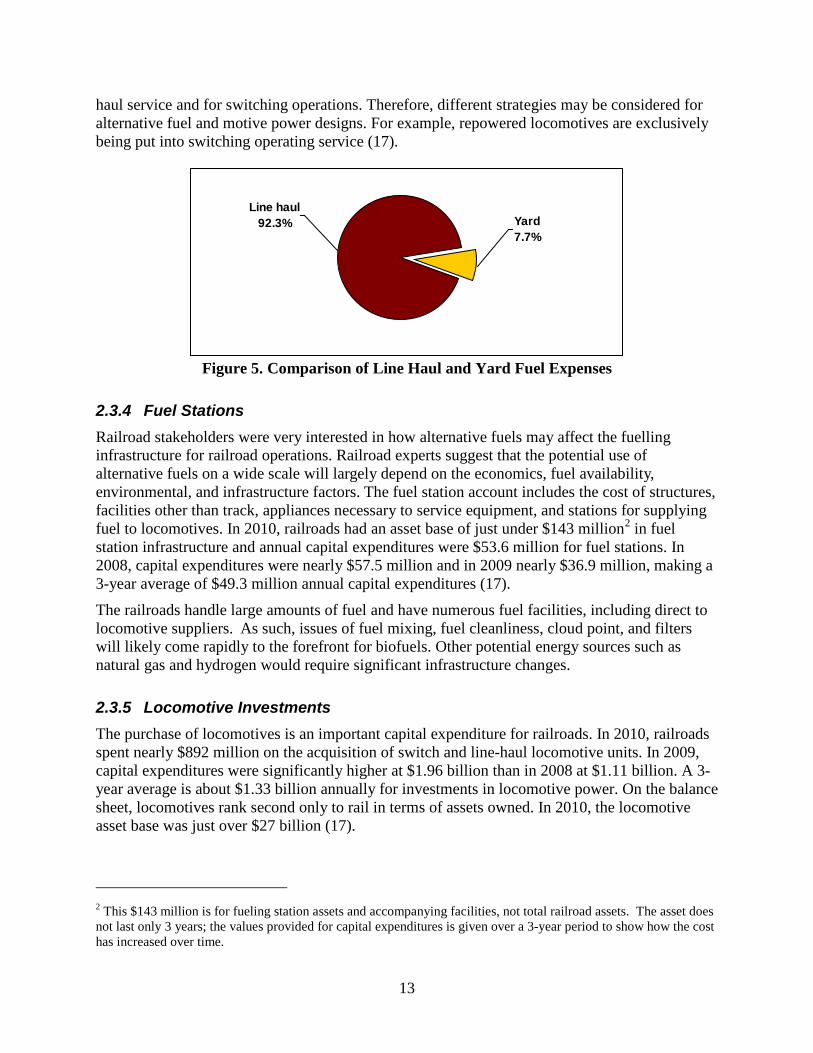
2.3.3 Fuel Consumption In 2010, Class I railroads consumed approximately 3.5 billion gallons of diesel at an average price per gallon of $2.25, making total fuel expenses about $7.9 billion. This represented nearly 19 percent of total operating expenses ($42.7 billion). In 2009, total fuel expenses were nearly 15 percent of total operating expenses, and in 2008, they were just over 26 percent. The 3-year average (2008–2010) for total fuel expenses was $8.6 billion annually. Note that fuel expenses for yard and line-haul operations are significantly different, as Figure 5 shows. In 2008, just over 92 percent of the fuel was consumed in line-haul service and about 8 percent was in yard operations. Railroad stakeholders use different strategies for locomotive acquisitions for line-
Millions $
Locomotives $4,197
Fuel Stations,
$547
CAPEX CAPEX
OPEX
OPEX
$0
$2,000
$4,000
$6,000
$8,000
$10,000
Locomotive Fuel
Mill
ions
$
$3.4B
$8.6B
13
haul service and for switching operations. Therefore, different strategies may be considered for alternative fuel and motive power designs. For example, repowered locomotives are exclusively being put into switching operating service (17).
Figure 5. Comparison of Line Haul and Yard Fuel Expenses
2.3.4 Fuel Stations Railroad stakeholders were very interested in how alternative fuels may affect the fuelling infrastructure for railroad operations. Railroad experts suggest that the potential use of alternative fuels on a wide scale will largely depend on the economics, fuel availability, environmental, and infrastructure factors. The fuel station account includes the cost of structures, facilities other than track, appliances necessary to service equipment, and stations for supplying fuel to locomotives. In 2010, railroads had an asset base of just under $143 million2 in fuel station infrastructure and annual capital expenditures were $53.6 million for fuel stations. In 2008, capital expenditures were nearly $57.5 million and in 2009 nearly $36.9 million, making a 3-year average of $49.3 million annual capital expenditures (17).
The railroads handle large amounts of fuel and have numerous fuel facilities, including direct to locomotive suppliers. As such, issues of fuel mixing, fuel cleanliness, cloud point, and filters will likely come rapidly to the forefront for biofuels. Other potential energy sources such as natural gas and hydrogen would require significant infrastructure changes.
2.3.5 Locomotive Investments The purchase of locomotives is an important capital expenditure for railroads. In 2010, railroads spent nearly $892 million on the acquisition of switch and line-haul locomotive units. In 2009, capital expenditures were significantly higher at $1.96 billion than in 2008 at $1.11 billion. A 3-year average is about $1.33 billion annually for investments in locomotive power. On the balance sheet, locomotives rank second only to rail in terms of assets owned. In 2010, the locomotive asset base was just over $27 billion (17).
2 This $143 million is for fueling station assets and accompanying facilities, not total railroad assets. The asset does not last only 3 years; the values provided for capital expenditures is given over a 3-year period to show how the cost has increased over time.
Yard7.7%
Line haul92.3%
14
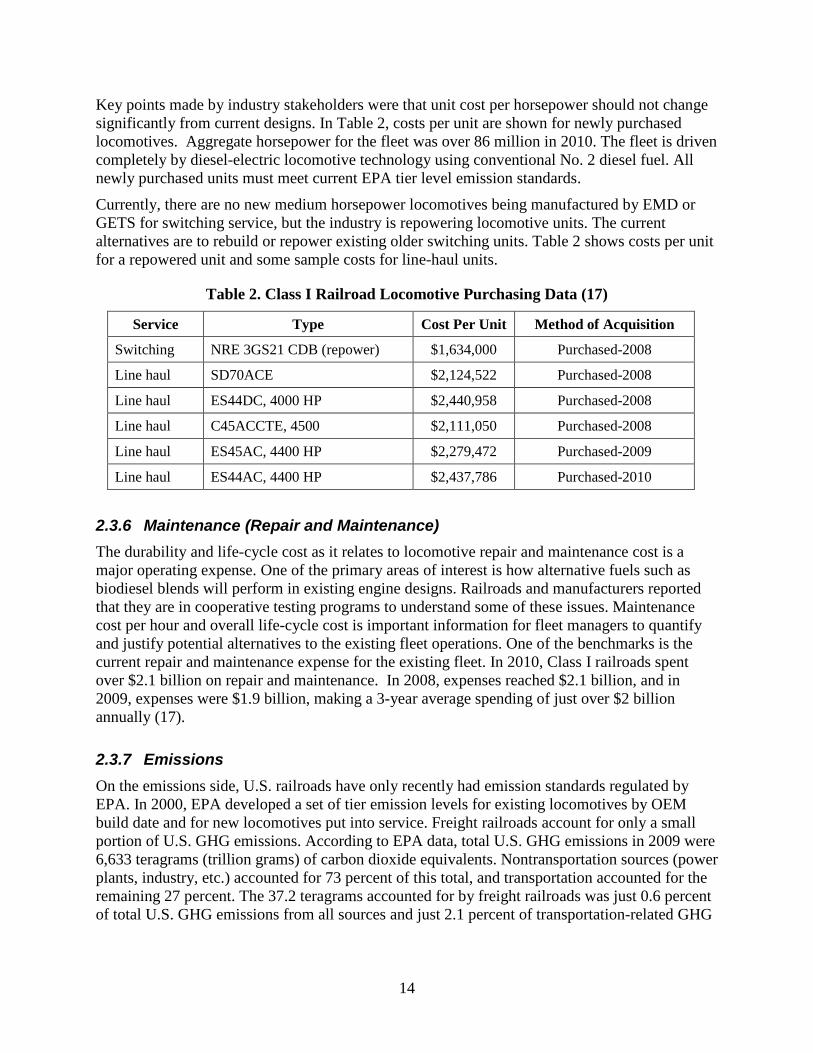
Key points made by industry stakeholders were that unit cost per horsepower should not change significantly from current designs. In Table 2, costs per unit are shown for newly purchased locomotives. Aggregate horsepower for the fleet was over 86 million in 2010. The fleet is driven completely by diesel-electric locomotive technology using conventional No. 2 diesel fuel. All newly purchased units must meet current EPA tier level emission standards.
Currently, there are no new medium horsepower locomotives being manufactured by EMD or GETS for switching service, but the industry is repowering locomotive units. The current alternatives are to rebuild or repower existing older switching units. Table 2 shows costs per unit for a repowered unit and some sample costs for line-haul units.
Table 2. Class I Railroad Locomotive Purchasing Data (17)
Service Type Cost Per Unit Method of Acquisition
Switching NRE 3GS21 CDB (repower) $1,634,000 Purchased-2008
Line haul SD70ACE $2,124,522 Purchased-2008
Line haul ES44DC, 4000 HP $2,440,958 Purchased-2008
Line haul C45ACCTE, 4500 $2,111,050 Purchased-2008
Line haul ES45AC, 4400 HP $2,279,472 Purchased-2009
Line haul ES44AC, 4400 HP $2,437,786 Purchased-2010
2.3.6 Maintenance (Repair and Maintenance) The durability and life-cycle cost as it relates to locomotive repair and maintenance cost is a major operating expense. One of the primary areas of interest is how alternative fuels such as biodiesel blends will perform in existing engine designs. Railroads and manufacturers reported that they are in cooperative testing programs to understand some of these issues. Maintenance cost per hour and overall life-cycle cost is important information for fleet managers to quantify and justify potential alternatives to the existing fleet operations. One of the benchmarks is the current repair and maintenance expense for the existing fleet. In 2010, Class I railroads spent over $2.1 billion on repair and maintenance. In 2008, expenses reached $2.1 billion, and in 2009, expenses were $1.9 billion, making a 3-year average spending of just over $2 billion annually (17).
2.3.7 Emissions On the emissions side, U.S. railroads have only recently had emission standards regulated by EPA. In 2000, EPA developed a set of tier emission levels for existing locomotives by OEM build date and for new locomotives put into service. Freight railroads account for only a small portion of U.S. GHG emissions. According to EPA data, total U.S. GHG emissions in 2009 were 6,633 teragrams (trillion grams) of carbon dioxide equivalents. Nontransportation sources (power plants, industry, etc.) accounted for 73 percent of this total, and transportation accounted for the remaining 27 percent. The 37.2 teragrams accounted for by freight railroads was just 0.6 percent of total U.S. GHG emissions from all sources and just 2.1 percent of transportation-related GHG

15
emissions (2).Therefore, the main goal on the emission side today is developing technology to meet EPA tier emission levels through retrofit programs or new designed locomotive.
2.3.8 Efficiency By the mid-1960s, essentially all locomotives owned and operated by U.S. Class I railroads were dieselized. Railroads have made great progress in efficiency gains as measured in revenue ton-miles per gallon of diesel consumed and the average length of haul, as Figure 6 shows. Since 1965, efficiency has increased nearly 150 percent to 484 revenue ton miles per gallon of diesel, while the average length of haul has increased over 80 percent to just over 900 miles (10).
Although many operational improvements have contributed to these efficiency gains, the locomotive engine is considered the core item for efficiency improvements. The diesel-electric locomotive represents the major fuel consumption component of rail operations. These improvements have influenced the length of haul for railroads today. Increasing the length of haul affects logistical operations of fueling and cycle times for delivery to customers, reducing transportation costs and improving customer service (10).
Figure 6. Class I Railroad Efficiency Measures 1965–2010
2.4 Passenger (Amtrak) Amtrak is a passenger railroad. The U.S. Department of Transportation (DOT) owns all issued and outstanding preferred stock. Amtrak’s principal business is to provide rail passenger transportation service in the major intercity travel markets of the United States.
Amtrak operates a nationwide rail network, serving more than 500 destinations in 46 states and 3 Canadian provinces on more than 21,200 miles of routes. Amtrak-owned equipment includes Amfleet®, Superliner®, Viewliner®, and other railroad passenger cars totaling 1,518, plus 459 locomotives, 80 Auto Train® vehicle carriers, and 101 baggage cars.
050
100150200250300350400450500550
19651975
19851995
19971999
20012003
20052007
2009
Rev-
Ton
Mile
s pe
r Gal
lon
01002003004005006007008009001,000
Aver
age
leng
th o
f Hau
l (M
iles)
Rev-Ton Miles per gallon of Fuel Average Length of Haul

16
Amtrak’s fuel, power, and utilities expenses increased $26.9 million, or 9.9 percent, to $299.7 million in 2010 compared with $272.8 million in 2009. Of this increase, $25.6 million is the result of a 21.1-percent increase in average diesel fuel costs to $2.24 per gallon in 2010 (from $1.85 per gallon in 2009). The remainder of the increase is to the result of an increase in diesel fuel usage.
With an average age of 25 years, many car types in Amtrak’s fleet have exceeded their commercial life. Replacement of the current fleet is one of Amtrak’s most pressing needs, given the fleet’s age, reliability issues, and the increase in demand for passenger rail. In Fiscal Year 2010, Amtrak released a comprehensive fleet strategy that outlined plans for completely replacing Amtrak’s fleet by 2040. For the purpose of the section, only locomotive-related information is referenced for both diesel-electric and electric locomotives (18).
2.4.1 Fleet Strategy The fleet planning process is designed to shape the fleet so that it delivers the services customers want, meets the strategic requirements of the business regarding sustainability, helps develop a viable supplier base, enhances the product offered to customers, and identifies the funding requirements to meet these goals. The current locomotive fleet for road service and switching service is shown is in Table 3 and Table 4 (11).
Table 3. Amtrak Road Locomotive Fleet Age
Equipment Type Active Fleet 12/1/2010
Year Started in Service
Age of Locomotive in 2010
Average Mileage
P32-8 18 1991 19 years 1,900,000
P32DM 18 1995–1998 12–15 years 1,500,000
P32DM 18 1995–1998 12–15 years 1,500,000
P40 12 1993 17 years 1,800,000
P42 200 1996–2001 9–14 years 2,000,000
F59PHI 21 1998 12 years 1,400,000
AEM7 49 1980–1988 22–30 years 3,700,000
HHP-8 15 1999–2001 9–11 years 960,000
Acela Express Power Cars 40 1999–2000 10–11 years 1,400,000
NPCU 22 1976–1981 29–34 years 3,700,000

17
Table 4. Amtrak Switching Locomotive Fleet Age
Equipment Type Active Fleet 12/1/2010 Year Started in Service
Age of Locomotive in 2010
SW1 1 1950 60
SW1000 7 1950 60
GP38H 7 1966 44
MP15 10 1970 40
SW 1500-SW1001 3 1973 37
GP38 5 1976 34
GP15D 10 2004 6
GenSet MP14/MP21 2 2010 -
Amtrak’s fleet strategy plan has been updated throughout to reflect the current state of the fleet, programs that are under way, and changes in the larger business environment. Some equipment has been returned to service. Funding provided under the American Recovery and Reinvestment Act allowed stored Amfleet I cars to be returned to service, providing much needed capacity on the Northeast Corridor. Fifteen P-40 diesel locomotives have been refurbished and returned to service, providing additional capacity on long-distance routes and State-supported services.
On the basis of demand, analysis, and defined life policies under the plan, Amtrak needs to buy 70 electric locomotives and 280 diesel locomotives over the next 15 years. These electric locomotives will replace all of the existing ones on the Northeast Corridor, which should provide a significant improvement in reliability for the electric locomotive fleet, as well as increase capacity for future service expansion. Alternative uses for the HHP-8 locomotives remain under review, and their ultimate disposal will be addressed later. A reserve fleet will be required as the new locomotives enter service, and the HHP-8 fleet should be suitable for this work, because their leases will run for a few years after the arrival of the new locomotives.
Amtrak is undertaking a progressive approach to switcher fleet replacement. The new switchers will replace traditional locomotive designs with GenSet technology. GenSets use two or three 500-horsepower diesel engines that meet Tier 4 EPA truck emission standards, which are stricter than EPA locomotive emission standards. New switchers will use about 60 percent less fuel, with a corresponding emissions reduction. The emissions reductions will allow Amtrak to take advantage of diesel emission reduction grant programs in partnership with State and local agencies in the places where the switchers are operated.
Two new switchers have already been introduced in California—one in Oakland and one in Los Angeles. Two more GenSet switchers will be introduced in Chicago. In cooperation with the Brotherhood of Locomotive Engineers and Trainmen, Amtrak has applied for a grant to update a switcher in Washington, DC, which will be rebuilt to take a new GenSet configuration, extending its service life and altering the replacement plan considerably.

18
Alternative Fuels Testing
A 1-year trial to use a renewable biodiesel fuel blend to power the Heartland Flyer, shown in Figure 7, put this innovation on Time’s list of “The 50 Best Inventions of 2010.” Initiated by the Oklahoma DOT, in collaboration with Amtrak, FRA, and the Texas DOT, the trial began April 2010 and was designed to evaluate the use of B20, a blend of 20-percent biofuel and 80-percent regular ultra low sulfur diesel fuel. The test program was funded through an FRA grant. According to Amtrak, test details were made available in the last quarter of 2011 (18).
Figure 7. Amtrak’s Heartland Flyer Powered by a Biodiesel Fuel Blend
The primary objective of the test program was to evaluate the feasibility and effectiveness of utilizing biodiesel as an alternative fuel for passenger locomotives. The test program focused on the following elements:
Revenue Service Trial of B20 Amtrak is operating the Heartland Flyer in normal passenger service while utilizing biodiesel blended (B20) fuel. Amtrak is measuring and recording the B20 fuel consumption of the engine on a daily basis.

19
Power Assembly Inspection and Analysis Task 2 was completed prior to the commencement of revenue service testing. Amtrak performed at a minimum pre- and post-revenue service test inspection and analysis of two power assemblies from the locomotive engine. The analyses identified any and all adverse effects of the B20 fuel on engine components expected to be directly or indirectly impacted by the utilization of B20 fuel.
Engine Exhaust Emissions Analysis Following the 12-month revenue service test period, Amtrak will collect locomotive exhaust emissions data. Exhaust emissions from the locomotive will be analyzed in accordance with EPA locomotive exhaust emissions Federal test protocol. GETS or another contract provider with equivalent capabilities will conduct the engine exhaust emissions testing and provide documentation of the results to be included in the final report.
Miscellaneous Maintenance/Inspection/Test Amtrak will perform analysis of the engine oil every 10 days for degradation and/or dilution. Amtrak will have the pure biodiesel, B100 fuel samples analyzed to determine that the fuel meets ASTM D6751 standards (19). Amtrak will subject the diesel fuel to be blended with the pure biodiesel (B100) to be tested monthly to ensure it meets ASTM D975 specifications and similarly the B20 blend will be tested monthly to determine conformance with ASTM D7467 specifications (3, 20).
2.3 Original Equipment Manufacturers Locomotives used in the United States are primarily produced by two manufacturers: EMD and GETS. EMD manufactures its locomotives primarily in London, Ontario, Canada, and its engines in La Grange, IL. Both EMD and GETS were interviewed for this study. The GETS locomotive manufacturing facilities are located in Erie, PA, whereas its engine manufacturing facilities are located in Grove City, PA. These manufacturers produce both the locomotive chassis and propulsion engines. They also remanufacture engines.
EMD and GETS were interviewed regarding the testing of biodiesels. It is important to note that competition between manufacturers limits the available testing information. Manufacturers of locomotives and locomotive engines issued their positions on the use of biodiesel (updated from reference 21):
• GETS—Biodiesel use up to B5 is acceptable in GETS engines because it fits within ASTM specifications. Values above that level are not acceptable. Under the express terms of GETS’ warranty, the failure of the railroad to use the prescribed fuel (i.e., No. 2 diesel) voids the contractual warranty obligations. The use of alternative fuels may also be in violation of the EPA locomotive emission regulations, because the engines are emission certified by using petroleum diesel.
• EMD— Biodiesel use up to B5 is acceptable in EMD engines because it fits within ASTM specifications. EMD “does not approve or prohibit the use of biodiesel fuels or biodiesel blends with distillate diesel fuel” (22). However, if an engine failure arises as a result of using biodiesel, it will be not covered by the engine warranty. EMD also notes that fuel system components may require modification to accommodate the lower energy

20
content of biodiesel fuels. Furthermore, the use of biodiesel may impact the regulatory emission compliance of the engines, and it is the responsibility of the user to obtain the proper regulatory exemptions to use biodiesel in any emission regulated EMD engine.
• MotivePower—allows the use of biodiesel blends up to B20, in consultation with Caterpillar, the manufacturer of the Head End Power engine. Caterpillar has agreed to the use of B20 biodiesel in their products if the lubrication properties of the fuel are equal to the No. 2 diesel, and if the energy content is equivalent.
• Because biodiesel is the main alternative fuel in locomotive operations today, it was the primarily emphasis of this section. With the increasing usage of biodiesel and with incidents of related engine problems, the major manufacturers of diesel fuel injection equipment (FIE) issued a common position statement on the use of biodiesel in 2000 (23), which was updated in 2004 (24), 2007 (25), and 2009 (26).
• Until 2007, the FIE manufacturers stated that blends of up to 5 percent of biodiesel in mineral diesel fuel should not create any serious engine problems if the final blend meets the European diesel fuel specification EN 590 at the point of sale, provided the biodiesel fuel used in the blend meets EN 14214. In 2009, they changed their position to allow up to 7 percent provided the biodiesel component meets EN 14214:2009 and the final blend meets EN590:2009. The key biodiesel issue for the FIE manufacturers is resistance to oxidation. Aged or poor quality biodiesel fuel may contain organic acids, free water, peroxides, and products of polymerization, which can attack many components and reduce the service life of FIE.

21
3. Decision Model Framework with a CBA Component
This section provides the framework for a decision model with preliminary results. To illustrate the proposed framework, a baseline for diesel locomotive technology is developed and compared with a selected alternative fuel technology (biodiesel B20) by using the proposed decision drivers. Decision theory is a general approach to decisionmaking when the outcomes associated with alternatives are often in doubt. From the initial findings of this study, alternative fuels and motive power designs are at an early stage of development in the railroad industry. Therefore, the results of this study and proposed recommendations should only be used to develop further research and development initiatives for the most feasible alternatives.
Although the specifics of each situation vary, decisionmaking generally involves the same basic steps that are followed in this study: (1) recognize and clearly define the problem, (2) collect the information needed to analyze possible alternatives (for the purpose of this study the objective is to develop a framework to help select the alternatives that show the best potential for future implementation), and (3) choose and implement the most feasible alternatives (this step is outside the scope of this study).
The decision model framework provides a locomotive unit to unit comparison where applicable. Larger scale implementation scenarios are outside the scope of this project. In addition, this model represents a high level analysis tool that requires railroad industry review and recommendations. Some inputs suggested by stakeholders are undefined at this time because of insufficient data discussed in this section. An important task under this project is to propose additional work activities to build a more robust model and to recommend research initiatives to validate model inputs.
3.1 Decision Drivers and Decision Model Development Key decision drivers for the decision model were selected, based on the literature search conducted for this project, stakeholder interviews, and the statement of work developed by FRA. As the regulatory body of the railroad industry, safety, cost, and the efficiency of these new technologies and the locomotives and infrastructure that may be affected by them are areas FRA may monitor as other regulatory groups develop national energy and emissions policies. The EPA emission standards set forth in 2000 and DOE policies related to energy security are driving some of these technology initiatives. The key decision drivers are cost, energy security, safety (risk assessment), emissions, and efficiency. For the purpose of this study, line-haul Tier 2-compliant locomotives and Class I railroad data is used as a representation of railroad operations.
From the decision drivers developed in the stakeholder interview process, Table 5 provides a synopsis of baseline measures that may be used to compare current technology to proposed alternative fuels and motive powers designs. Only line-haul locomotive units are evaluated in this preliminary model where applicable and some specific drivers can only be considered estimates at this time. One of the goals of the study is to identify research initiatives where data is lacking to provide a complete model to validate the model inputs.

22
Table 5. Line-Haul Locomotive Operations Baseline Line-Haul Locomotive (No. 2 Diesel) Key Decision Drivers Drivers Baseline Cost Locomotive:
New Purchase $/unit $2,200,000 Life-Cycle Cost (durability) $/unit/year $280,000
Fuel:
Production Cost $/DGE $3.95 Infrastructure:
Fueling Stations $/unit $8,000 Energy Security
Petroleum Products (diesel fuel) gallons/DGE 1 Emissions (Tier 2 Line-Haul Levels)
Hydrocarbons (HC) g/hp-h 0.30 Carbon Monoxide (CO) g/hp-h 1.5 Oxides of Nitrogen (NOx) g/hp-h 5.5 Particulate Matter (PM) g/hp-h 0.20
Safety (Risks assessment) Employee exposer [NFPA 704]†
Flammability NFPA 704 Rating 2 Health Hazard NFPA 704 Rating 1 Reactivity NFPA 704 Rating 0
Efficiency Energy
Energy Content (fuel) Btu/gallon 129,500 Gross Engine Power hp/N8 Undefined *BSFC lb/hp-h Undefined
Temperature (operations) Cloud Point Degrees/C (F) –35 to 5 (–31 to 41) Pour Point Degrees/C (F) –35 to –15 (–31 to 5)
*Brake-specific fuel consumption. †NFPA, National Fire Protection Agency; h, hour.
3.1.1 Cost The direct cost of locomotives and fueling were the primary cost centers of interest to stakeholders. Railroad experts suggest that the potential use of alternative fuels on a wide scale will largely depend on the economics, fuel availability, environmental, and infrastructure development. From the stakeholder interviews, the initial capital expenditure of a new locomotive, its life cycle cost (durability), fuel cost (per equivalent gallon of energy), and fueling infrastructure were the primary cost centers that were recommended for comparison as shown in Table 5.
An estimate of $2.2 million for a newly purchased Tier 2-compliant locomotive is based on Class I railroad purchasing data from Table 2 of this report. These estimates were developed using samples from different OEMs, railroads, and year of purchase (2008–2010).
23
In the interview process, locomotive life-cycle cost referred to by stakeholders as durability of the equipment was an important issue. Although no data was provided by stakeholders during the interview process, a life-cycle cost estimate was developed for a typical line-haul locomotive based on the acquisition cost of $2.2 million, a 30-year useful life, salvage value of 10 percent, and Class I railroad cost of capital. A 90-percent locomotive availability rate is also used in the calculation. These variables yielded an estimated life-cycle cost of approximately $280,000 per year (this driver requires further research to validate the input).
Fuel production for this analysis is measured by the price of energy produced per DGE. The content of 1 gallon of diesel produces approximately 129,500 British thermal units (Btu) of energy. For the purpose of this study, the average price for a gallon of diesel reported by DOE is used for the baseline case. The average retail price for diesel was $3.95 in July 2011 (27). Therefore, this input represents a means of comparing other energy sources in terms of price and energy content produced.
For fueling infrastructure, the driver is the cost invested in fueling stations per locomotive in service. Railroad stakeholders were very interested in how alternative fuels may affect the fueling infrastructure for railroad operations. The fueling infrastructure account includes the cost of structures, facilities other than track, appliances necessary to equipment for service, and stations for supplying fuel to locomotives.
In 2010, railroads had an asset base of just under $143 million in fuel station infrastructure and capital expenditures of $53.6 million, equaling $196 million total expenditures and assets. The fueling infrastructure decision driver is then developed by adding the asset base to capital spending and dividing it by the number of locomotives in service ($196 million/24,000 = ~$8,000 per unit).
With the potential implementation of new technology, a per unit measure can be made based the additional investments made in fueling infrastructure. It should be noted that this is only a Class I railroad driven assumption; fueling infrastructure outside of railroad operations is not included.
3.1.2 Energy Security Energy security deals with many issues related to national security and energy policies. For the purpose of this study, the amount of diesel fuel from petroleum products (barrels of oil or oil equivalent) used in railroad transportation and how proposed alternative fuels or motive power designs may affect current consumption levels are the key measures. United States total consumption, including imports, of petroleum products is the benchmark for comparison for the energy security decision driver. Resource availability and sustainability of proposed alternative fuels are also important issues to stakeholders. This subject is touched on briefly in Section 4.
The United States consumed 19.1 million barrels per day (MMbd) of petroleum products in 2010, for all sectors. Imports were 11.8 million barrels per day (MMbd) of petroleum products (13). Gallons per DGE and liquid volumes between diesel and alternative fuels are the proposed factor for this decision driver. The purpose of this calculation is to understand the current amount of diesel consumed in DGEs that may be compared to an alternative fuel or motive power design change. The final calculation converts diesel gallons consumed into barrels of petroleum products consumed.

24
The benchmark factor in Table 5 for the energy security driver is normalized to 1, which represents the number of DGEs for Btu/gallon of diesel (129,500). As the energy content of fuel or engine efficiency changes as a result of alternative fuels or motive power designs, there may be changes in the consumption of diesel and petroleum products.
In 2010, Class I railroads consumed 3.6 billion gallons of diesel for line-haul operations. On the basis of a calculation using refinery yield statistics for petroleum and other liquids, this represents approximately 85 million barrels of petroleum products annually or 234,000 barrels per day of consumption (0.2 MMbd). Therefore, as a comparative measure to U.S. consumption of petroleum and imports, it is estimated that Class I railroad line-haul operations represented approximately 1.2 percent of U.S. consumption and 2.0 percent of U.S. imports, as Table 6 shows.
Table 6. Measured Consumption of Petroleum Products
U.S. Petroleum Consumption1
Petroleum (MMbd)1
Diesel Gallons (billions)2
Petroleum (MMbd)3
Petroleum (MMbd)
U.S. Consumption 19.1 3.6 0.2
1.2%
U.S. Imports 11.8 2.0% 1U.S. Energy Information Administration: June 24, 2011. 2U.S. Class I railroads: Annual line-haul diesel gallons are 3.6 billion (freight), 2010. 3Each gallon of petroleum diesel fuel was assumed to equal 1 gallon of petroleum products (crude oil and equivalents) with 42 gallons equaling one barrel.
3.1.3 Safety (risk assessment) Achieving and maintaining the safe operation of commercial railroads in the United States falls under the jurisdiction of FRA. In addition, each railroad interviewed conveyed the importance of safety. Therefore, safety is an important decision driver for stakeholders when considering alternative fuels and motive power designs to current operations. Employee exposure, storage, and transport were the main concerns.
The U.S. National Fire Protection Association (NFPA) standard NFPA 704 was selected as the baseline measure for diesel (28). Table 7 shows the ratings for diesel used in locomotive operations NFPA 704 define the familiar red, blue, yellow, and white “fire diamond” used by emergency personnel to quickly and easily identify the risks posed by hazardous materials. Appendix C contains the details of the four NFPA diamond placard designations and describes the safety risks associated with fuels.
The NFPA fire diamond placard shown in Figure 8a correlates with the ratings in Table 7. For transport of diesel, the Hazard Class 3 flammable and combustible placards are required (Figure 8b & c) (ANSI Z400.5-2004 Standard (United States) MSDS ULSD Fuel).

25
Table 7. NFPA 704 Baseline Measures for No. 2 Diesel
Description NFPA Rating Diamond Color
Flammability 2 Red
Health 1 Blue
Instability/Reactivity 0 Yellow
Special - White
Figure 8. (a) NFPA Diamond Placard; (b) Hazard Class 3 Flammable; and (c) Combustible Placards
3.1.4 Emissions Emissions were selected as a decision driver by stakeholders because of EPA emission standards mandated in 2000. Each stakeholder recommended that a comparison of proposed alternative fuels or motive power designs to existing technology be included in the decision model. For the purpose of this study Tier 2 emission levels are used as a benchmark for comparison as shown in Table 9 for line-haul locomotives. The specific emission driver that may be compared with alternative fuels and motive power designs on a mass basis (grams per brake horse power hour (g/bhp-h)) created by the locomotive engine under testing specifications. Table 5 under the emissions driver shows the baseline criteria for Tier 2 line-haul levels.
Test procedures used to compare the performance should be based on the Federal Test Procedure (FTP) as recommended. Table 8 shows the new line-haul locomotive standards (g/bhp-h) and dates of compliance for the U.S. line-haul fleet (29).
b c
a

26
Table 8. New Line-Haul Locomotives Standards (29)
Locomotive Group Date
PM NOx HC
Previous Standard
New Standard
Previous Standard
New Standard
Previous Standard
New Standard
Remanufactured Line-Haul Locomotive Standards
Remanufactured Tiers 0 & 1
2008 as available
2010 required 0.60 0.22
9.5 (Tier 0)
7.4 (Tier 1)
7.4
(8.0 if no SLAC)
1.00 (Tier 0)
0.55 (Tier 1)
0.55
(1.00 if no SLAC)
Remanufactured Tier 2
2008 as available
2013 required 0.20 0.10 5.5 5.5 0.30 0.30
Newly Built Line-Haul Locomotive Standards
Tier 3 2012 -- 0.10 -- 5.5 -- 0.30
Tier 4 2015 -- 0.03 -- 1.3 -- 0.14 SLAC = separate loop intake air cooling. Additionally, in all locomotive groups: Idle emissions control—must equip locomotive with automatic engine stop/start. HC standards are Total HC, except Tier 4 (nonmethane hydrocarbon (NMHC)). Part 92 smoke standards apply if particulate matter family emission limit (PM FEL) > 0.05 g/bhp-h but are generally waived from testing. Part 92 CO standards continue to apply (at Tier 2 levels for Tiers 3&4); notch caps also apply. Must also meet switch-cycle standards of the same tier (of Tier 2 for Tier 3 line-haul locomotive) except for Tier 4.
The FTP should be considered the standard test procedure when comparing alternative fuel and motive power designs. However, as with EPA’s test procedures for other vehicles and engines, the locomotive test regulations also allow alternate test procedures to be used, provided that they have been demonstrated to yield results equivalent or superior to those obtained from the FTP.
The FTP for locomotives is a nominally steady-state test procedure that measures gaseous (HC, CO, and NOx), PM, and smoke emissions from locomotives with the engine at a series of steady-state speed and load conditions. Measurement of emissions would actually be performed during both steady-state operations and during the limited periods of engine accelerations between notches. The reason for this is that in-use locomotive operation is not truly steady state. Rather, locomotive operation is a combination of long periods of largely steady-state operation at individual notches and short transient periods between notch changes. In developing the final test procedure, EPA sought to ensure that all measured emission rates are representative of actual in-use emissions.
The test procedures, other than the test sequence, are based largely on those previously established for on-highway heavy-duty diesel engines in 40 CFR 86 Subparts D and N (U.S. Code of Federal Regulations) (30). Specifically, the raw sampling procedures and many of the instrument calibration procedures are based on Subpart D, and the dilute particulate sampling procedures and general test procedures are based on Subpart N.

27
3.1.5 Efficiency Efficiency of locomotive operations is a key decision driver recommended by stakeholders as a comparative measure to using alternative fuels or motive power designs. The energy content of fuel, gross engine power, and brake-specific fuel consumption (BSFC) of the engine and temperature-related fuel operations were of primary interest.
The driver for energy content is Btu/gallon of fuel consumed. Diesel energy content is the benchmark for efficiency at 129,500. Table 9 shows examples of energy content of fuel measured in Btu/gallon. The information illustrates significant ranges of various alternative fuels in Btu/gallon. The percent change column has many operational implications relating to cost, onboard fuel storage, and length of haul for railroads today.
Table 9. Energy Content of Selected Fuels
Fuel Btu/gallon Btu/gallon (percentage change)
Diesel No. 2 129,500 100.0
Biodiesel (B5) 128,940 99.6
Biodiesel (B20) 127,250 98.3
Biodiesel (B100) 118,300 91.4
Natural Gas (LNG) 75,000 57.9
Hydrogen 25,293 19.5
The other impacts on engine output capability using alternative fuels are gross engine power and BSFC. These measures are recommended for testing with a Tier 2 level line-haul locomotive. At this time, these measures are undefined for the baseline No. 2 diesel case on many of the more modern high horse-power engines in this study. FRA-funded testing on two higher horsepower line-haul locomotive engine families is being contracted currently with SwRI in San Antonio, TX, and through these proposed tests a baseline may be developed.
When conducting engine tests, one measure of engine health is to verify that an engine is able to produce its rated gross engine power output at its designed (usually highest) control setting (for a locomotive Notch 8). Emissions certifications are related to emissions, which constitute output levels for a given power output. When testing an engine with different fuels, it is common to determine the engine control system’s ability to use the fuel by verifying that the engine can produce full-rated horsepower. It should also be noted that the engine certification is conducted with a “certification fuel” (a pure fuel with normally no alternative fuel component) whose makeup is not only specified (40 CFR Section 1065.703) (31) but also is sampled, tested, and verified for use. If an engine is not capable of producing full-rated horsepower at the proper control setting with a certified fuel, the engine condition is usually reviewed.
The BSFC is the measure of fuel consumed at a given control setting with the output of the engine limited by a brake, or in this case, by resistance of the output device (generator or alternator) with the output of the device measured and dissipated by a set of electrical resistor grids. In this way, tightly controlled testing can be conducted and repeated with the output of

28
each test condition compared with that of other test conditions. For BSFC, the fuel consumption is measured and normalized (divided) by the amount of horsepower produced at a particular engine control setting (lb/hp-h).
It is important to measure both gross engine power output and fuel consumption (BSFC), because this can help to understand differences in engine performance, depending on the fuels tested and the engines used for test (and the ability of the control system to adapt as necessary).
Low temperature properties of fuels are measured by the cloud point and pour point as described below.
Cloud point, [°C (°F) –35 to 5 (–31 to 41)]. The temperature at which small solid crystals are first visually observed as the fuel is cooled (ASTM D2500, D5771, D5772, or D5773). Below the cloud point, these crystals might plug filters or drop to the bottom of a storage tank. Cloud point is the most widely used and most conservative estimate of the low temperature operability limit. However, fuels can usually be pumped at temperatures below the cloud point. A related test is for the wax appearance point, ASTM D3117.
Pour point, [°C (°F) –35 to –15 (–31 to 5)]. The temperature at which the fuel contains so many agglomerated crystals that it is essentially a gel and will no longer flow (ASTM D97, D5949, or D5950). Distributors and blenders use the pour point as an indicator of whether the fuel can be pumped, even if it would not be suitable for use without heating or taking other steps (4).
3.2 Alternative Fuel Comparison Case (Biodiesel, B20) On the basis of the literature search, interview process, and information in Appendix A, biodiesel was selected as the alternative fuel comparison case, specifically the blend of 20-percent biodiesel and 80-percent petroleum diesel (B20). This is not a recommendation for using B20 in railroad operation, but it is a good comparison case to illustrate the proposed decision framework for analyzing alternative fuels or motive power designs. This comparison is made to the baseline (No. 2 diesel) and potentially to other selected alternatives for future analysis. The following are some of the potential benefits of biodiesel blend B20 for railroad operations:
• It is renewable and may be produced from domestic resources.
• It displaces petroleum-derived diesel fuel.
• It can be used as a 20-percent blend in most on-highway diesel equipment with minor or no modifications.
• It may reduce global warming GHG emissions.
• It is safe as compared to petroleum diesel and suitable for sensitive environments. Other areas of interest for the use of biodiesel in railroad operations are the following:
• Further understanding of the effects on railroad fueling infrastructure and engine designs are warranted.
• The lower energy content (Btu/gallon) as compared with conventional diesel may have significant operational issues for railroads.
• The full risks of temperature (cold weather) impacts have not been fully explored.

29
Biodiesel refers to the fuel produced from renewable sources that meets ASTM International D6751, the standard for biodiesel. Biodiesel is most commonly used as a blend with petroleum diesel. At concentrations of up to 5 (volume) percent (B5) in conventional diesel fuel, the mixture will meet the ASTM D975 diesel-fuel specification and can be used in any application as if it were pure petroleum diesel. These concentrations are likely being used in locomotive operations today, but the extent is not known.
At concentrations of 6–20 percent, biodiesel blends have been used in off-highway (farming) equipment and in some on-highway equipment with minor or no modifications to the equipment, although certain manufacturers do not extend warranty coverage if equipment is damaged by these blends. The B6 to B20 blends are covered by the ASTM D7467 specification that was approved in June 2008. B100 is covered by ASTM 6751.
B20 is the most commonly used biodiesel blend in the United States, because it provides a good balance between material compatibility, cold weather operability, performance, emission benefits, and costs (4). B20 is also the minimum blend level allowed for compliance with the Energy Policy Act of 1992 (EPAct), which requires the use of renewable fuels or alternative fuel vehicles by certain covered fleets. Equipment that can use B20 includes compression-ignition engines, fuel oil and heating oil boilers, and turbines. However, the long-term effects on diesel locomotive engines in terms of durability and emissions are not fully understood at this time.
The following sections will compare information developed from the baseline case for diesel line-haul operation in Section 3.1 and in Table 5 to the B20 operating scenario results in Table 10.

30
Table 10. B20 Biodiesel Alternative Comparison with Baseline No. 2 Diesel
Line-Haul Locomotive
Key Decision Drivers Drivers Diesel (No. 2) Biodiesel (B20)
Cost
Locomotive:
New Purchase $/unit $2,200,000 Undefined
Life-Cycle Cost (durability)
$/unit/year $280,000 Undefined
Fuel:
Production Cost $/DGE $3.95 $4.09
Infrastructure:
Fueling Stations $/unit $8,000 Undefined
Energy Security
Petroleum Products (diesel fuel) gallons/DGE 1 0.814
Emissions (Tier 2 Line-Haul Levels)
Hydrocarbons (HC) g/hp-h 0.30 Undefined
Carbon Monoxide (CO) g/hp-h 1.5 Undefined
Oxides of Nitrogen (NOx) g/hp-h 5.5 Undefined
Particulate Matter (PM) g/hp-h 0.20 Undefined
Safety (Risks assessment)
Employee exposure (NFPA 704)
Flammability NFPA Rating 2 2
Health Hazard NFPA Rating 1 1
Reactivity NFPA Rating 0 0
Efficiency
Energy
Energy Content (fuel) Btu/gallon 129,500 127,250
Gross Engine Power hp/N8 Undefined Undefined
BSFC lb/hp-h Undefined Undefined
Temperature (operations)
Cloud Point Degrees/C (F) –35 to 5 (–31 to 41) –16 to –1 (3 to 30)
Pour Point Degrees/C (F) –35 to –15 (–31 to 5) –17 to –9 (1 to 16)

31
3.2.1 Cost Locomotive The potential new purchase or retrofit cost for locomotives that would operate using B20 is undefined for the purpose of this study. According to OEMs, no locomotives in service or newly built units have design modifications for use with biodiesel blends. Both OEMs and railroads were interested in the potential cost and design issues related to biodiesel use, especially onboard locomotive fuel systems and capacity design changes that may result from using B20.
Elastomers (rubber components), metals, and plastics in locomotive fuel systems were potential areas that may require component modifications, which may lead to warranty issues between railroads and OEMs. Pure biodiesel is not compatible with certain elastomers, metals, and plastics that are commonly used with petroleum diesel. Generally (but not always), biodiesel blends of 20 percent or lower have a much smaller effect on these materials; very small concentrations of biodiesel in B5 or B2 have no noticeable effect on materials compatibility.
The life-cycle cost (durability), as a result of using B20 or lower blends, is undefined for the purpose of this study. Railroads and suppliers were concerned about the long-term potential impact on current engine designs relating to longevity as a result of changes in engine oil contaminants with biofuel consumption. Research and testing by OEMs, railroads, and suppliers are ongoing to understand the effects B20 will have on existing locomotives in service and newly purchased units. However, no data was found or provided during the interview process to quantify the potential change in life-cycle cost as the result of using B20 in railroad locomotives.
Fuel Fuel production for this analysis is measured by the price of energy produced per DGE. The energy content of 1 gallon of diesel produces approximately 129,500 Btu. The average price for a gallon of diesel was $3.95 in 2010. The energy content of B20 is 127,250 Btu/gallon with an average price per gallon of $4.09 in DGE in 2010. Therefore, $4.09 is used in this analysis as a comparison to the baseline of $3.95, which is an increase of about 3.5 percent over diesel. Even though this is a spot price comparison from 2010, biodiesel is historically a higher cost than diesel with government subsidies, as reported by EIA (13).
Fuel expenses were close to $7.3 billion in 2010 for Class I railroad line-haul operations. Therefore, a 3.5-percent increase in fuel cost by using B20 would be a significant increase in operational costs to railroad operations using the decision framework for this study. It is important to note that the spot prices are only used to develop the fuel production factor of 3.5 percent. At this time, a B20 price for railroads has not been established. Railroad and highway fuel prices differ because railroads are not subject to highway taxes. As a result, average prices for railroads are typically lower than average retail prices. Therefore, the fuel production factor can be applied only to the total expense of line-haul operation as an equitable comparison to B20.
The potential cost to the fueling infrastructure is undefined at this time. As referenced in the baseline case, in 2010, railroads had an asset base of just under $143 million in fuel station infrastructure and capital expenditures were $53.6 million; therefore, total investment and annual capital expenditures equaled $196 million. The effects of biodiesel blends on the fueling infrastructure are of great interest to railroads and fuel suppliers. Because of the investment in railroad infrastructure for dieselized operations, it is important to understand the logistical issues

32
related to biodiesel blends. A knowledge base may be developed and benchmarked from on-highway operations for railroad fueling infrastructure. Onboard fueling and storage of biodiesel should be approached independently through approved testing.
3.2.2 Energy Security Biodiesel (B20) reduces the amount of diesel fuel consumed; therefore, it is a benefit under the decision framework for this study. On the basis of the calculations in this section, 667.5 million gallons of petroleum diesel may be displaced annually by a scenario of using 100 percent B20 in line-haul operations. This represents approximately 0.23 percent of the U.S. petroleum product consumed and 0.37 percent of U.S. imports annually, as Table 11 shows.
Table 11. Potential Reduction in Petroleum Products B20 U.S. Petroleum Consumption1
Petroleum (MMbd)1
Diesel Gallons (million)2
Reduction (MMbd)3
Reduction (MMbd)
U.S. Consumption 19.1 667.5 0.04
0.23%
U.S. Imports 11.8 0.37% 1U.S. Energy Information Administration: June 24, 2011. 2U.S. Class I railroads: Annual line-haul diesel gallons (estimated reduction). 3Each gallon of petroleum diesel fuel was assumed to equal 1 gallon of petroleum products (crude oil and equivalents) with 42 gallons equaling one barrel.
As stated, 1 is the normalized baseline factor for diesel fuel. Essentially, all locomotives in Class I railroad service are powered by diesel. Diesel energy content is 129,500 Btu/gallon. Therefore, the base case for diesel is a constant factor of 1 (gallons/DGE) that may be multiplied by the number of gallons consumed.
To determine the impact on the consumption of petroleum diesel by substituting biodiesel, a comparison case is made with a B20 blend. By using B20 as an example, the volume of diesel and biodiesel used in 2010 Class I railroad line-haul operations becomes (0.8 × 3.585 billion gallons diesel) = 2.868 billion gallons, and (0.20 × 3.585 billion gallons B100) = 717 million gallons, respectively, per year.
However, with the simultaneous reduction in energy content of the fuel, an additional step is required to determine how much total B20 blend is needed for the same total energy content. Table 9 shows the energy content of B20 per gallon is 127,250 Btu, resulting in an energy content reduction from pure diesel to B20 blend of 0.983 (which requires 1.7 percent more volume of B20 blend to be used to make up for lost energy).
The increase in total B20 fuel required compared with straight diesel is (1.017 × 3.585 billion gallons) = 3.648 billion gallons. The diesel component increase then becomes (2.868 billion × 1.017) = 2.918 billion gallons with the B100 component becoming (717 million gallons × 1.017) = 730 million gallons. Actual diesel replaced then becomes (3.585 billion gallons – 2.918 billion gallons) = 667.5 million gallons (or 15.9 million barrels or 0.044 MMbd).
Therefore, the relative change for the line-haul operation scenario is a reduction in diesel-fuel consumption of approximately 667.5 million gallons, with a resulting energy security factor of

33
0.814 (2.918 billion gallons/3.585 billion gallons). This assumes 100-percent use of domestically produced B20 fuel for line-haul operations.
3.2.3 Emissions The primary measure for this decision driver is how B20 will affect current engine designs under EPA’s tier emission levels, specifically, Tier 2 levels shown in Table 10. FRA-funded testing on two higher horsepower line-haul locomotive engine (one Tier 2) families is being contracted currently with SwRI in San Antonio, TX. This will help further investigate the potential emissions performance of biodiesel blends up to B20 on railroad scale engines.
Although this enhances the knowledge base of the potential impact of biodiesel blends, it is noted that the data gathered will not represent the potential impact on the wide variety of other locomotive emissions tier levels. This effort represents a small component of the testing required to show performance across all engine families (limited by available funding) and is limited to emissions testing only (as extended durability testing represents a significant effort on a variety of engine families as well).
To date, data on single cylinder four-stroke and older two-stroke roots-blown engines tend to demonstrate either decreases or no change in HC, CO, and PM emissions but also have noted increases in NOx emissions—a 7- to 8-percent increase in NOx was noted on the four-stroke single cylinder engine, and a 5- to 6-percent increase in NOx was noted for the two-stroke 16-cylinder engine (21).
3.2.4 Safety In using the NFPA standards as a reference for relative safety consideration between various alternative fuels (Section 3.1.3), it is noted that there are no significant differences between the measured levels for flammability, health hazard, reactivity, and transport between standard diesel fuel and biodiesel blends (B20).
NFPA will be used as a reference to evaluate other risk factors of other alternative fuel options. Needs for ancillary systems (changes to fire protection systems) should be included in not only the safety assessment but also the cost and required infrastructure change categories.
3.2.5 Efficiency The energy content of B20 is approximately 1.7 percent lower than that of petroleum diesel fuel as shown in Table 10. Although it may be possible to overcome this change in energy content mechanically by injecting more material into the cylinder to gain the same engine output power, it will have a related impact on decreasing the distance that a train can travel by that amount based on the built-in fuel storage capability. It may also have impacts on the refueling requirements (volumes handled on any given fueling) and locations of fueling infrastructure.
For the purpose of this study, baseline and comparison values for No. 2 diesel and B20 are undefined for gross engine power and BSFC. As mentioned previously, FRA-funded testing on two higher horsepower line-haul locomotive engine families is being contracted currently with SwRI. In addition to emissions results, both gross engine power and BSFC measure will be generated for B20 and No. 2 diesel.

34
Gross engine power is an important measure to determine if the engine can attain its rated horsepower at a maximum control setting with a biodiesel blend (B20). The horsepower can be limited if the fuel used contains less Btu/gallon. However, depending on the engine control system and the ability to control fuel consumption, the engine may be able to produce the rated, or near fully rated horsepower by consuming increased amounts of fuel. As a result, the BSFC value (measured in either volume or weight of fuel consumed to produce power, lb/hp-h) will increase or decrease with the amount of fuel consumed.
If a fuel provides 5 percent less energy per gallon of fuel, for example, with a basic engine control system, the engine might produce 5 percent less energy while consuming a “normal” amount of fuel, or it could produce up to full rated horsepower while consuming an increased amount of fuel. Depending on the control system and the capability of the fueling system, the engine could produce a power level somewhat less than the fully rated amount with a somewhat increased amount of fuel consumption. Therefore, when conducting fuel comparison testing, it is highly necessary to measure both energy output of the engine (horsepower) and simultaneous fuel consumption (BSFC) for all fuels tested.
Ultimately, it is recommended that results from a Tier 2-level line-haul locomotive be used in the decision model as a baseline for diesel and a comparison case using B20 (as those are most common and are sold today). As the emissions standards continue to tighten (i.e., Tier 3 and Tier 4), the baseline for these measurements should change accordingly.
The efficiency of low temperature properties is measured by the cloud point and pour point of diesel as compared with B20 (see Section 3.1.5). The lower temperature values are the benchmarks as they relate to these low-temperature properties for diesel locomotive operations shown in Table 10.
A comparison of low temperature values for cloud point and pour point are shown in Table 12. The difference in low temperature ranges for diesel and B20 suggest that operational issues may exist for railroad operations, and further investigation is recommended for cold weather operations. Logistics for fueling and locomotive operations are designed exclusively for dieselized operations today.
Table 12. Comparison of Low Temperature Values for Cloud Point and Pour Point
Temperature Degrees Diesel (No. 2) B20 Median (Diesel/B20)
Cloud Point °C (°F) –35 to 5 (–31 to 41) –16 to –1 (3 to 30) –13/9 (5/17) Pour Point °C (°F) –35 to –15 (–31 to 5) –17 to –9 (1 to 16) –25/–13 (–15/–9)
Differences in ambient operating conditions such as cold temperature performance of alternative fuels and power systems have to be accounted for appropriately for each operational environment. For diesel engines, cold temperature performance of the fuel (cloud point, pour point) is extremely important and has to be factored into daily operations.
Negative changes in alternative fuel performance characteristics require changes to normal operations and may result in it being unusable in a revenue service environment. Several demonstration programs have been conducted that evaluate high-level usage issues related to engine wear and cold temperature operations; however, no program reports to date have allowed fuels, storage devices, locomotives, and related hardware to be shut down unexpectedly in severe

35
ambient conditions (which does occur in daily operations). Therefore, the full risks of temperature impacts and requirement to get equipment back to operational condition have not been fully explored.
Production of Biodiesel Since the adoption of the Renewable Fuel Standard (RFS2) by EPA in 2010 (32), Federal biofuel requirements (rather than state mandates) may be a driver in biodiesel demand. According to a statement issued by the National Biodiesel Board (NBB) in January 2008, annual production capacity for biodiesel in the United States was 2.24 billion gallons (5). By early to mid-2009, production capacity was expected to increase to 3.47 billion gallons. However, current biodiesel production capacity utilization in the United States is extremely low. Actual production in 2008 was 678 million gallons or 30 percent of production capacity. A rapid rise in production occurred in 2007 and 2008 (Figure 9), followed by a decline in 2009 as the result of the economic recession and a further decline in 2010 to 311 million gallons because of the expiry of the blenders tax credit.
250
490
678
506
311
0100200300400500600700800
2006 2007 2008 2009 2010Year
Mill
ion
US
Gal
lons
(MM
gal)
Figure 9. U.S. Biodiesel Production *(Source: Energy Information Administration)
In 2010, U.S. Class I railroads consumed 3.6 million gallons of diesel in line-haul operations. To illustrate the amount of biodiesel required at different blend levels for railroad operations, Figure 10 was constructed. In 2010, total U.S. production was 311 million gallons, whereas consumption was 222 or just over 70 percent of production. On the basis of line-haul consumption, it would require 701 million gallons of biodiesel by volume to meet the demand for B20 at 100-percent utilization of the B20 alternative fuel. Referencing current production levels in 2010, this is a difference of approximately 390 million gallons.
As stated by NBB, by the early to mid-2009, production capacity was expected to increase to 3.47 billion gallons (5). Therefore, production capacity far exceeds demand and production levels at this time. It is important to note that production capacity and availability of resources

36
for production are mutually exclusive production factors. The availability of resources for production is not discussed in detail in this report.
Figure 10. Gallons of Biodiesel Required by Blend (Bx)
3.3 B20 Comparison with No. 2 Diesel Table 13 shows the biodiesel blend B20 compared with No. 2 diesel as an operating scenario to demonstrate the proposed decision model approach. The aim is to understand whether the proposed decision drivers in the decision model are independently a cost or a benefit to industry stakeholders as compared with petroleum diesel locomotive operations. Then, for each decision driver provide quantitative and qualitative results and recommendations for their validation. Because the use of biodiesel in railroad industry is at an early stage of development, additional research and testing for specific decision drivers are recommended.
3,505
1,752
35017570
701
0500
1,0001,5002,0002,500
3,0003,5004,0004,5005,000
B2 B5 B10 B20 B50 B100
Biodiesel Blends
US
Gallo
ns (M
illio
n)

37
Table 13. Decision Model Comparing B20 with No. 2 Diesel Key Decision Drivers Drivers Diesel (No. 2) Biodiesel (B20) Change (+/-) Cost/Benefit Cost Locomotive: New Purchase $/unit $2,200,000 Undefined Undefined Undefined Life-Cycle Cost (annual) $/year/unit $280,000 Undefined Undefined Undefined
Fuel:
Production Cost $/DGE $3.95 $4.09 3.5% Cost Infrastructure: Fueling Stations $/unit $8,000 Undefined Undefined - Undefined -
Energy Security
Petroleum Products (diesel fuel)
gallons/DGE 1 0.814 -0.186% Benefit
Emissions (Tier 2 Line-haul)
Hydrocarbons (HC) g/hp-h 0.30 Undefined Undefined - Undefined Carbon Monoxide (CO) g/hp-h 1.5 Undefined Undefined - Undefined Oxides of Nitrogen (NOx) g/hp-h 5.5 Undefined Undefined Undefined Particulate Matter (PM) g/hp-h 0.20 Undefined Undefined Undefined
Safety (Risks assessment)
Employee exposure [NFPA 704]
Flammability NFPA Rating 2 2 No change No change - Health Hazard NFPA Rating 1 1 No change No change - Reactivity NFPA Rating 0 0 No change No change -
Efficiency
Energy Energy Content (fuel) Btu/gallon 129,500 127,250 -1.7% Cost Gross Engine Horsepower hp/N8 Undefined Undefined Undefined - Undefined - BSFC lb/hp-h Undefined Undefined Undefined - Undefined - Temperature (operations) Median:
Diesel/B20
Cloud Point C Degrees/C (F) –35 to 5 (–31 to 41) –16 to –1 (3 to 30) –13/9 (5/17) Cost Pour Point Degrees/C (F) –35 to -15 (–31 to 5) –17 to –9 (1 to 16) –25/–13 (–15/–9) Cost

38
3.3.1 Cost On the basis of the data collected in this study, only fuel production is quantifiable at this time and is considered a cost to U.S. railroads. Because of the higher production price and lower energy content of B20, it would be a significant cost to the railroad industry. The price of biodiesel is consistently higher than No. 2 diesel. By normalizing the B20 price by DGE, there is a further separation in cost between diesel and B20. As an illustration of the potential cost increase using average retail prices from July 2011 for B20 and fuel consumption (gallons) data from 2010, Class I railroads would have paid a premium of 3.5 percent or just over $250 million for line-haul operations.
The price of biodiesel is affected by the Federal Excise Tax Credit; without this subsidization, the retail price to consumers would be even higher than current retail prices. Qualitative questions are related to whether biodiesel can be produced in large quantities at a cost that is competitive with petroleum diesel prices in the future. This is a direct cost to railroads; therefore, little can be done by railroads to reduce the price of biodiesel. They must rely on producers and distributors of biodiesel to improve the production process to gain cost efficiencies.
Recommendations:
• To understand the potential capital cost (increase or decrease) of acquiring locomotives designed to run efficiently on biodiesel, information from durability testing and emission testing is required.
• Engine durability testing on Tier 2-compliant line-haul locomotives with blends up to B20 is needed to understand the effects on life cycle cost.
• A study is needed to identify the impact of biodiesel blends of up to B20 on current fueling infrastructure (capacity, maintenance, and storage).
3.3.2 Energy Security The use of B20 is considered a benefit in terms of reducing the consumption of petroleum products by U.S. railroads. This benefit falls mainly in the area of energy security policies to reduce the transportation sector’s reliance on petroleum-based imports and replacement of petroleum products with alternative fuels.
On the basis of the scenario of using B20 in Class I railroad line-haul operations, approximately 667.5 million gallons of diesel or 0.04 MMbd of petroleum may have been displaced in 2010 (Section 3.2.1.). This represents approximately 0.23 percent of U.S. consumption or 0.37 percent of U.S. imports.
Today, there are no commercial incentives for railroads to reduce diesel consumption as an energy source that would offset the potential inefficiencies that may be incurred by using replacement energy sources (alternative fuels).
There is considerable interest in the highest U.S. policy circles to improve energy security (1).
Therefore, significant resources have been put into assessing the energy security benefits of reduced U.S. oil imports. An estimate of the oil import premium based on U.S. Federal proposed rules for the on-highway vehicle sector is $13.13 per barrel (2009 dollars). Because the proposed rulemaking is evaluating the reduction of petroleum imports through fuel efficiency, it provides

39
an equitable approach for this study. Calculating the 15.7 million barrels of petroleum by the $13.13 per barrel premium yields an estimated benefit of just over $200 million.
Recommendations:
• A study is recommended to understand the potential sustainability and availability of biodiesel at various railroad consumption demand scenarios.
3.3.3 Emissions This decision driver is undefined with no cost or benefit assessment at this time. It is recommended that emissions testing based on EPA-mandated testing protocol be conducted to understand and measure the changes that may result in using biodiesel blends (B20) for this decision driver.
On the basis of the upcoming testing by SwRI, the benefits and/or cost will be related to emission changes in the four general criteria areas (HC, CO, NOx, and PM) for a selected line-haul engine family as compared with the diesel case.
If testing results yield reductions in any of the criteria areas as compared with the diesel case, benefits may be attributable to meeting future tier emission levels. Today, there are no commercial incentives for railroads to reduce emission levels below EPA regulatory limits. Potential costs may be related to increases in any of the four general criteria areas.
Recommendations:
• FTP emissions testing on a Tier 2 compliant line-haul locomotive. This testing is recommended to understand how the four general emissions criteria (HC, CO, NOx, or PM) under the Tier 2 emissions levels (g/hp-h) compare with the diesel (test fuel) and biodiesel blends up to B20.
3.3.4 Safety As noted in previous sections of this report, there are no significant differences between the measured levels for flammability, health hazard, reactivity, and transport between standard diesel fuel and biodiesel blends (B20). Therefore, no cost or benefits are assessed for the safety decision driver. However, for other alternative fuel and/or motive power design options that may be evaluated, NFPA will be used as a reference to the various risk factors but needs for ancillary systems (changes to fire protection systems) will need to be included in not only the safety assessment but also in the cost and required infrastructure change sections.
3.3.5 Efficiency The efficiency measures proposed for comparison to B20 under the energy category are energy content, gross engine power, and BSFC. The energy content of B20 is approximately 1.7 percent lower than that of petroleum diesel fuel; therefore, it is a cost to railroad operations. However, gross engine power and BSFC are undefined at this time and are important variables along with the energy content variable to access fuel efficiency of locomotives tested with various fuel types.

40
Conclusions can be drawn from these variables to estimate changes in efficiency for freight and passenger railroads. A key fuel efficiency measure for freight is revenue ton-miles per gallon of diesel consumed, whereas passenger fuel efficiency can be measured by passenger ton-miles per gallon of diesel consumed. Since 1965, freight fuel efficiency has increased nearly 150 percent to 484 revenue ton-miles per gallon of diesel for Class I railroads.
Recommendations:
• FTP emissions testing on Tier 2-compliant line-haul locomotives with biodiesel blends of up to B20. Under the recommended emissions testing for the emissions decision driver, both gross engine power and BSFC results should be measured as part of this test. The information from these variables may be used to evaluate fuel efficiency changes between diesel and biodiesel (B20).
The efficiency measures under the temperature category consist of the cloud point and pour point. These measures show significant differences in temperature ranges between diesel and biodiesel (B20). Therefore, it is considered a cost in terms of potential operational changes to railroad for fuel storage and distribution.
Several demonstration programs have been conducted that evaluate high-level issues related to engine wear and cold temperature operations. From November 2009 to March 2010, four GE AC4400CW diesel-electric locomotives were held in captive service on Canadian Pacific’s mainline between Calgary and Edmonton. The primary focus of the study was to assess the feasibility of using up to a maximum of 5-percent (B5) biodiesel blend in freight locomotives operating in cold weather service.
Although the test successfully demonstrated the viability of B5 biodiesel use in cold weather freight rail service, there are renewable fuel supply chain issues to address. These issues were identified in the test and include the availability of biodiesel and distribution infrastructure, the limited number of vendors, quality control, and the availability of appropriate blends.
Although demonstration programs have been conducted that evaluate high-level issues related to engine wear and cold temperature operations, no program reports to date have allowed fuels/storage devices/locomotives and related hardware to be shut down unexpectedly in severe ambient conditions (which does occur in daily operations). Therefore, the full risks of temperature impacts and requirements to get equipment back to operational condition have not been fully explored.
Recommendations:
• Low-temperature operations testing on Tier 2-compliant line-haul locomotives with blends of up to B20 to understand technical issues and potential cost
• Low-temperature testing on fuel storage infrastructure and distribution systems with blends of up to B20 to understand technical issues related to operational efficiencies and potential cost
3.3.6 Cost and Benefit Results For the B20 scenario, only fuel production under the cost decision driver and petroleum products under the energy security decision driver are independently quantified as shown in Table 13. Energy content under the efficiency decision driver is quantified but requires additional variables

41
(gross engine power and BSFC) to draw conclusions related to fuel efficiency. The cloud point and pour point under the efficiency decision driver are generally considered a cost but require additional research to quantify as a measured cost.
It is estimated that Class I railroads would have paid a premium of 3.5 percent or just over $250 million for line-haul operations in 2010. As a measure of this relative purchasing power, over 100 new line-haul locomotives could be acquired ($2.2 million per unit).
Class I railroad line-haul operations would have displaced approximately 667.5 million gallons of diesel, or 0.04 MMbd of petroleum based products in 2010, as shown in Section 3.2.1. This represents approximately 0.23 percent of U.S. consumption or 0.37 percent of U.S. imports in 2010.
An estimate of the oil import premium based on U.S. Federal proposed rules for the on-highway vehicle sector is $13.13 per barrel (2009 dollars) (2). Calculating the 15.7 million barrels of petroleum by the $13.13 per barrel premium yield an estimated benefit of just over $200 million.
3.3.7 Decision Matrix Approach In the case of alternative fuels, a decision matrix is recommended to support the decision driver analysis component. This can be a powerful tool to help support the decisionmaking process for selecting the best technologies for further development. Under the framework for the decision model, this is a proposed component for the decisionmaking process.
Development of the decision matrix relies on the quantitative (CBA) and qualitative (interview process and literature search) information developed for each proposed alternative. This tool is designed to be used for making decisions between new alternatives being evaluated. For instance, if the new alternatives being considered for further research and testing are biofuels (biodiesel) and natural gas (LNG), this tool can help support the process of selecting the most valued alternative by stakeholder.
3.3.8 Decision Matrix Attributes This decision matrix relies on stakeholder inputs to draw conclusions on selecting the best alternatives. Therefore, U.S. railroads, OEMs, and FRA inputs are recommended for proposed alternative fuels and/or motive power technologies. Three steps are used to develop results: (1) rank the decision drivers with weights, (2) rank the proposed alternatives by decision driver score, and (3) calculate the weighted scores for each alternative (highest scores represent the higher valued alternatives). It can be used for multiple stakeholders or within stakeholders groups. To illustrate the functionality of the decision matrix, an example with two stakeholders and two alternatives are provided.
Step 1: Rank decision drivers (weights) Generally (independent of any specific alternative), each decision driver must be ranked from 1 to 100 (with a maximum weight of 100) when considering the potential use of alternative fuels and/or motive power designs for railroad locomotive operations (Table 14). These weights will remain a constant variable independent of the alternatives being considered for evaluation.

42
Table 14. Matrix to Rank Decision Drivers with Weights
Decision Driver: Weights (1–100)
Decision Drivers Stakeholder 1 Stakeholder 2 Weights
Cost 20 20 40
Energy security 20 20 40
Emissions 20 20 40
Safety 20 20 40
Efficiency 20 20 40
100 100 200 Step 2: Rank decision driver alternatives (scores) For each alternative being considered, determine what score (1 = worst, 10 = best) represents the importance or value of each decision driver in relation to the alternative proposed.
Table 15 illustrates two alternatives ranked by score (although multiple alternatives may be evaluated).
Table 15. Matrix to Rank Proposed Alternatives by Decision Driver Scores
Alternative 1 Decision Driver: Scores (1–10) Decision Drivers Stakeholder 1 Stakeholder 2 Scores Cost 5 5 10 Energy security 5 5 10 Emissions 5 5 10 Safety 5 5 10 Efficiency 5 5 10
Alternative 2 Decision Driver: Scores (1–10) Decision Drivers Stakeholder 1 Stakeholder 2 Scores Cost 5 5 10 Energy security 5 5 10 Emissions 5 5 10 Safety 5 5 10 Efficiency 5 5 10

43
Step 3: Calculating the weighted scores The weights for each decision driver in step 1 are constant variables that are multiplied by the scores for each alternative in step 2. This calculation produces a weight score for each decision driver and a total weighted score (Table 16).
Table 16. Matrix to Calculate the Weighted Scores for Each Alternative
Decision Driver: Weighted Scores
Alternatives Cost Energy security Emissions Safety Efficiency Total
Alternative 1 400 400 400 400 400 2,000 Alternative 2 400 400 400 400 400 2,000

44
4. Conclusions
The framework for a decision model with a cost-benefit component was developed to guide industry stakeholders as they evaluate the feasibility of alternatives to diesel fuel and diesel locomotive technology. The primary stakeholders proposed to further develop the decision model are government, railroads, and manufacturers of locomotives in the United States.
Because of the mature nature of diesel locomotive technology for freight and passenger railway operations and its fueling infrastructure, no alternative fuels or motive power designs that differentiate from current diesel technology can be cost justified from the research conducted in this study. However, comparisons among selected alternative fuels are suggested under this decision framework approach to evaluate potential alternatives. Cooperation between industry stakeholders is vital to the success of evaluating alternatives for future consideration.
Energy security policies developed by DOE and emission standards set forth by EPA are driving most of the technology initiatives related to alternative fuels today. The main objective of the decision model recommended in this study was to identify alternatives that may provide benefits in the areas of emissions and energy security in relation to their potential cost, safety, and operating efficiencies.
For the B20 scenario illustrated in this study, it is estimated that Class I railroads would have paid a premium of 3.5 percent or just over $250 million for line-haul operations in 2010. Class I railroad line-haul operations would have displaced approximately 667.5 million gallons of diesel, or 0.04 MMbd of petroleum equivalents. The oil import premium (estimating the cost of U.S. imports) is $13.13 per barrel, which yields a societal benefit of just over $200 million.
To populate the remaining inputs for the other decision driver criteria for the B20 comparison case in this study, recommended research and testing for cost (locomotive durability testing and a fueling infrastructure study), energy security (availability and sustainability study), emissions (laboratory tier level emissions testing), and efficiency (fuel consumption and cold temperature testing operations) are recommended to further develop the decision model case for B20. FRA, railroads, and OEMs are currently addressing some of these important issues.
Future alternative fuels will be selected based on cost and applicability and will be balanced with the ability to meet efficiency and emissions requirements. Although the main alternative energy options include natural gas, coal, and biomass, the form of their utilization remains to a large degree uncertain for the railway industry.
The fuel supply infrastructure will be an important factor in choosing future fuel options. The existing infrastructure is capable of handling liquid hydrocarbon fuels including diesel and gasoline. A number of important alternative fuel options include diesel-like liquids composed mostly of paraffinic hydrocarbons. Fuels in this category include Fischer-Tropsch (FT) synthetic diesel made of natural gas (gas-to-liquid (GTL)), coal (coal-to-liquid (CTL)), or renewable diesel made by hydrogenation of vegetable oils (used mainly in blends of diesel and biodiesel).
Although some of these blends will meet the ASTM D975 standard, engine issues are always possible when changes are introduced to the fuel composition. Some negative characteristics shared by paraffinic fuels often include poor lubricity and poor low temperature operability. At this time, there are no published studies on the operation of locomotive engines with synthetic

45
diesel fuel. Research is necessary to determine the compatibility of locomotive engines with synthetic diesel, its impact on the fuel system, engine wear and durability, emission levels, as well as cold weather performance.
Other alternative fuel options exist, supported by government policies or by various groups of interests that are not compatible with the existing infrastructure, include hydrogen (as a long-term fuel option for light vehicles) and natural gas. Because the development of an additional fuel infrastructure would involve a substantial cost to society, it would have to be well justified.
Because of the initiatives currently under investigation in Europe, as they relate to the uses of biofuels, and the conclusions from RSSB that improved diesel fuels were among the most suitable for rail from other potential fuel sources, an overview of information as it relates to biofuels were included in this report. According to the RSSB report, biofuels have the potential to reduce GHG emissions, which contribute to climate change. The use of biofuels can potentially increase energy security, reducing a country’s reliance on imported energy products.

46
5. References
1. Department of Energy. 2011. “Transportation Energy Data Book: Edition 30,” Oak Ridge National Laboratory, OakRidge, TN, http://info.ornl.gov/sites/publications/files/Pub31202.pdf
2. Association of American Railroads. November 2011. “Freight Railroads Help Reduce Greenhouse Gas Emission.” AAR Position Paper, Washington, D.C., https://www.aar.org/keyissues/Documents/Background-Papers/Freight-RR-Help-Reduce-Emissions.pdf
3. ASTM Standard D975. 2011. “Standard Specification for Diesel Fuel Oils,” ASTM International, West Conshohocken, PA, 2011, DOI:10.1520/D0975-11, www.astm.org
4. U. S. Department of Energy. 2009. “Biodiesel Handling and Use Guidelines,” U.S. Department of Energy, NREL/TP-540-43672, Revision December 2009.
5. National Biodiesel Board. 2011. “Economic Impact of Removing The Biodiesel Tax Credit for 2010 And Implementation of RFS2 Targets Through 2015,” http://www.biodiesel.org/reports/20110608_gen-425.pdf
6. Atkins, Frank J., Tayyebi Jazayeri, S. M. April 2004. “A Literature Review of Demand Studies in World Oil Markets,” Discussion Paper 2004-07, Department of Economics, University of Calgary, Canada.
7. Leiby, P. N. October 14, 2011. “Approach to Estimating the U.S. Oil Security Premium for the Proposed 2017-2025 Light-Duty Vehicle GHG/Fuel Economy Rule.” Oak Ridge National Laboratory.
8. Walsh, Bryan. 2010. “Amtrak’s Beef-Powered Train.” Time (November 11), http://www.time.com/time/specials/packages/article/0,28804,2029497_2030622,00.html
9. American Short Line and Regional Railroad Association. 2009. Short Line and Regional Facts and Figures. Washington, D.C.
10. Association of American Railroads. 1965 to 2010. Railroad Facts. Washington, D.C.
11. Amtrak. February 2011. Amtrak Fleet Strategy: Building a sustainable fleed for the future of America’s intercity and high-speed passenger railroad.
12. U.S. Department of Energy. 2009. Affordable, Low-Carbon Diesel Fuel from Domestic Coal and Biomass, U.S. Department of Energy, Report DOE/NETL-2009/1349, http://www.netl.doe.gov/energy-analyses/pubs/CBTL%20Final%20Report.pdf
13. U. S. Energy Information Administration. July 2010. Petroleum. U.S. Energy Information Administration. http://eia.gov/petroleum
14. HR6. 2007. The Energy Independence and Security Act of 2007, U.S. Senate Committee on Energy and Natural Resources, http://energy.senate.gov/public/index.cfm?FuseAction=IssueItems.Detail&IssueItem_ID=f10ca3dd-fabd-4900-aa9d-c19de47df2da&Month=12&Year=2007
15. Simmons Boardman. 1966. The Car and Locomotive Cyclopedia. Omaha, NE.

47
16. Smith, B. and J. Gray. October 2011. “Rail Fuel Efficiency Study,” final report by Transportation Technology Center, Inc. to Federal Railroad Administration, Washington, D.C.
17. Association of American Railroads. 2010. Data from class I railroads annual reports (R-1s) to the Surface Transportation Board.
18. Amtrak. 2010. America’s Railroad Annual Report FY 2010. 19. ASTM Standard D6751. 2011. “Standard Specification for Biodiesel Fuel Blend Stock
(B100) for Middle Distillate Fuels,” ASTM International, West Conshohocken, PA, 2011, DOI:10.1520/D06751-11B, www.astm.org
20. ASTM Standard D7467. 2010. “Standard Specification for Diesel Fuel Oils, Biodiesel Blend (B6 to B20),” ASTM International, West Conshohocken, PA, 2011, DOI:10.1520/D7467-10, www.astm.org
21. Majewski, W.A. et al. August 2011 “Alternative Fuels Availability Make-up and Potential Impact on Locomotive Engines,” Research Report R-999, Association of American Railroads, Transportation Technology Center, Inc., Pueblo, CO.
22. Electro Motive Division. 2005. “Diesel Fuel Recommendations All EMD and Former CDED Engines,” Electro Motive Division, Electromotive Maintenance Instruction M.I. 1750 Rev. 1, 2005.
23. Fuel Injection Equipment. 2000. “Fatty Acid Methyl Ester Fuels as a Replacement or Extender for Diesel Fuels,” FIE (Fuel Injection Equipment) Manufacturers Common Position Statement: Delphi, Stanadyne, Denso, Bosch, June 2000.
24. Fuel Injection Equipment. 2004. “Fatty Acid Methyl Ester Fuels as a Replacement or Extender for Diesel Fuels,” FIE (Fuel Injection Equipment) Manufacturers Common Position Statement: Delphi, Stanadyne, Denso, Bosch, June 2004,
25. Fuel Injection Equipment. 2007. “Fatty Acid Methyl Ester Fuels as a Replacement or Extender for Diesel Fuels,” FIE (Fuel Injection Equipment) Manufacturers Common Position Statement: Delphi, Stanadyne, Denso, Bosch, January 2007.
26. Fuel Injection Equipment. 2009. “Fuel Requirements for Diesel Fuel Injection Systems,” Diesel Fuel Injection Equipment Manufacturers Common Position Statement 2009: Delphi, Stanadyne, Denso, Bosch, September 2009, http://www.globaldenso.com/en/topics/091012-01/documents/common_position_paper.pdf
27. U. S. Department of Energy. 2011. “Clean Cities Alternative Fuel Price Reports,” July 2011, http://www.afdc.energy.gov/pdfs/afpr_jul_11.pdf
28. National Fire Protection Association. NFPA 704. 2012. “Standard System for the Identification of the Hazards of Materials for Emergency Response,” Quincy, MA, www.nfpa.org
29. Environment Protection Agency. EPA’s line-haul and switcher emission standards tables. http://www.epa.gov/midwestcleandiesel/publications/webinars/epa_line_haul_and_switcher_emission_standards.pdf
30. U. S. Code of Federal Regulations. 2011. CFR Title 40: Protection of Environment, Part

48
86—Control of Emissions from New and In-Use Highway Vehicles and Engines. Washington, D.C. http://www.ecfr.gov/cgi-bin/text-idx?c=ecfr;sid=0771c0f03c4754688a9501ebae683300;rgn=div5;view=text;node=40%3A18.0.1.1.2;idno=40;cc=ecfr
31. U. S. Code of Federal Regulations. 2011. CFR Title 40: Protection of Environment, Part 1065—Engine Testing Procedures. Washington, D.C. http://www.ecfr.gov/cgi-bin/text-idx?sid=694d902c88ce2521aa19ca25a747a11a&c=ecfr&tpl=/ecfrbrowse/Title40/40cfrv33_02.tpl
32. U. S. Environmental Protection Agency. 2010. Renewable Fuel Standard. Washington, D.C., http://www.epa.gov/otaq/fuels/renewablefuels/index.htm

49
Appendix A. Overview of Alternative Fuels and Motive Power Technologies
This section contains material from the Association of American Railroads Research Report R-999, Alternative Fuels Availability, Make-up, and Potential Impact on Locomotive Engines (Majewski et al., 2011). A number of important alternative fuel options include diesel-like liquids composed mostly of paraffinic HCs. Fuels in this category include FT synthetic diesel made of natural gas (GTL) or coal (CTL), or renewable diesel made by hydrogenation of vegetable oils. Although properties will vary depending on the particular production process, all of these fuels show similarities and have potentially attractive properties. They are unlikely to be used in the pure form, but they will be used as blending stock to improve properties of conventional No. 2 diesel.
Although the blends will meet the ASTM D975 standard, engine issues are always possible when changes are introduced to the fuel composition. Some negative characteristics shared by paraffinic fuels often include poor lubricity and poor low temperature operability. At this time, there are no published studies on the operation of locomotive engines with synthetic diesel fuel. Research is necessary to determine the compatibility of locomotive engines with synthetic diesel, its impact on the fuel system, engine wear/durability, emission levels, as well as cold weather performance.
The role of biodiesel has been increasing, currently driven by the Federal RFS (RFS2). Under the ASTM D975 standard, up to 5-percent biodiesel can be blended into No. 2 diesel without disclosing it to the customer. It is important that the railroad industry ensures that locomotives can be operated with at least B5 blends. To date, testing biodiesel blends in medium-speed diesel engines in North America has been limited to a small number of studies. The data available suggests that biodiesel impacts on medium-speed engines may not necessarily mirror those in high-speed diesel engines surveyed by EPA in 2002. The following additional work is needed to:
• Quantify the effect on emissions and performance on EPA-regulated Tiers 0, 1, and 2 locomotives (The effects on NOx emissions of Tiers 1 and 2 locomotives are a real concern because even a small increase in NOx from these engines may cause emissions to exceed the certification limit.)
• Quantify the effects on combustion and FIE system behavior
• Characterize the cold weather performance Manufacturers of high-speed diesel engines for on-road and off-road applications have expressed a number of concerns about the long-term impact of biodiesel on the FIE system, aftertreatment devices, and the lubricating oil. Some of the issues pertinent to the locomotive application are as follows:
• Impact on the long-term performance of the FIE system and the ability of the locomotive to maintain emission levels
• Effect on aftertreatment devices that may see use in Tier 4 locomotives
• Compatibility with the current lubricating oil specifications

50
Feedstock is another source of uncertainty with biodiesel fuels. Although most of U.S. biodiesel is made from soybeans, some of the larger scale biodiesel plants can process the more cost-effective imported palm oil feedstock. Palm oil biodiesel has poorer low temperature operability properties than most other biodiesels. In the future, biodiesel can also be made from algae, with a yet unknown impact for its fuel properties.
Considering the need for a new fuel infrastructure, a wide-scale introduction of LNG as locomotive fuel remains unlikely. However, niche markets for LNG/compressed natural gas (CNG)/liquefied petroleum gas (LPG) locomotives, as well as political pressures to switch to gaseous fuels, will persist in areas with air quality problems such as California or Texas. These pressures will likely diminish after 2015 once EPA Tier 4 locomotives with exhaust aftertreatment technologies are launched.
DME can be manufactured from coal via gasification and synthetic gas. Although in North America the alternate route of coal utilization—FT synthetic diesel—seems to be gaining momentum, DME can still play a role. Significant interest in DME as automotive fuel exists in China, Japan, as well as in Europe.
DME, although compatible with diesel combustion, is a gaseous fuel that requires a dedicated FIE system. It also has insufficient lubricity and requires lubricity additives. A wide-scale research program with the participation of railroads, engine manufacturers, emission labs, DME fuel suppliers, and other stakeholders would be necessary to demonstrate the feasibility of DME as locomotive fuel.
Energy recovery technologies can provide considerable reductions in fuel consumption and GHG emissions. The most market-ready energy recovery technology is the hybrid locomotive. The most significant research issues in hybrid locomotives are related to the high energy storage requirements and an efficient and cost-effective battery technology.
Flywheel energy storage is another technology that appears to be compatible with the railroad application, but it requires further research to make it practical.
Some energy recovery technologies, for instance thermoelectric, may warrant interest from the railroad industry provided more progress is achieved in the highway diesel engine applications.
A.1 Regulations With ultralow emission requirements adopted for nearly all categories of diesel engines, future environmental priorities are gradually shifting from exhaust emissions to GHG emissions and energy supply and security. One of the reasons for the shift in focus toward energy supply is the depletion of oil resources. There are indications that the production capacity of conventional oil resources is likely to decline already in the 2010–2020 timeframe. This will drive the use of unconventional oil resources, alternative fuels—notably natural gas, the worldwide resources of which increased significantly with the development of shale gas extraction technologies—as well as increased energy efficiency.
Following the changes in environmental priorities and energy supply and security, governments worldwide have been adopting new regulations that affect fuels and engine/vehicle technologies, including:

51
● Renewable fuels/biofuels regulations—These are designed to gradually increase the consumption of renewable fuels in the total fuel mix on the market. One of the approaches is to legislate a minimum volume or percentage of renewables that must be blended into petroleum fuels. The regulations include life-cycle GHG emissions/carbon intensity criteria that must be met by fuels to earn the “renewable” designation. Alternative approaches exist, such as “carbon taxes” designed to provide financial incentives for increased usage of renewable fuels and/or disincentives for petroleum fuels.
● GHG emission and fuel economy regulations—These require increased efficiency of the engine and the powertrain, as well as the efficiency of the entire vehicle. Future regulations may also seek fuel consumption reductions through changes in vehicle operation patterns.
United States. Under the 2005 EPAct, EPA adopted the RFS, which required blending certain volumes of ethanol into gasoline. Under the Energy Independence and Security Act of 2007 (14), the RFS program was expanded in several ways, including the addition of renewable diesel fuel requirements. The expanded legislation, finalized by the EPA in 2010, is often referred to as the RFS2 standard.
For the first time, some renewable fuels must achieve life-cycle GHG emission reductions—compared with the gasoline and diesel fuels they displace—to be counted toward compliance with volume standards. The RFS2 volume requirements are set for the following four categories of fuels:
● Cellulosic biofuel—to be classified in this category, fuels must provide a 60-percent life-cycle GHG emission reduction.
● Biomass-based diesel—a 50-percent GHG emission reduction.
● Advanced biofuel—a 50-percent GHG emission reduction.
● Total renewable fuel—the remaining renewable fuel volumes must provide a 20-percent GHG emission reduction if produced at new facilities (initial construction after December 19, 2007).
The GHG emissions are determined by EPA as the aggregate quantity of GHG emissions—including direct emissions and significant indirect emissions such as emissions from land use changes. The emission reductions are relative to the 2005 petroleum fuel baseline.
In the final rulemaking, EPA relaxed its GHG estimates for a number of conventional biofuels that are now meeting the RFS2 requirements but were to be disqualified under the RFS2 proposal. In particular, EPA determined that biodiesel and renewable diesel from soy oil or waste oils, fats, and greases will meet the 50-percent GHG threshold for biomass-based diesel. Biodiesel and renewable diesel produced from algae oils will also comply with the 50-percent threshold should they reach commercial production.
The RFS2 requires biofuels production to grow from the 2009 level of 11.1 billion gallons to 36 billion gallons in 2022, with 21 billion gallons to come from advanced biofuels. Table A1 lists the exact fuel volume requirements.

52
Table A1. RFS2 Renewable Fuel Volume Requirements, billion gallons
Year Cellulosic Biofuel
Biomass-Based Diesel
Advanced Biofuel
Total Renewable
Fuel 2008 n/a n/a n/a 9.0 2009 n/a 0.5 0.6 11.1 2010 0.1 0.65 0.95 12.95 2011 0.25 0.80 1.35 13.95 2012 0.5 1.0 2.0 15.2 2013 1.0 A 2.75 16.55 2014 1.75 A 3.75 18.15 2015 3.0 A 5.5 20.5 2016 4.25 A 7.25 22.25 2017 5.5 A 9.0 24.0 2018 7.0 A 11.0 26.0 2019 8.5 A 13.0 28.0 2020 10.5 A 15.0 30.0 2021 13.5 A 18.0 33.0 2022 16.0 A 21.0 36.0
2023+ B B B B A - To be determined by EPA through a future rulemaking, but no less than 1.0 billion gallons. B - To be determined by EPA through a future rulemaking.
The minimum volumes of biomass-based diesel after 2012 must be 1 billion gallons or more, to be determined by EPA. NBB has called to increase the volume requirements to 1.3 billion gallons in 2013, 1.6 billion in 2014, and 1.9 billion in 2015 (5). EPA proposed the biomass-based diesel volume to 1.28 billion gallons in 2013.
Every year, EPA develops percentage-based standards for the particular renewable fuel categories to be met during the following year. Table A2 lists the 2011 requirements.

53
Table A2. 2011 RFS2 Fuel Volumes and Percentage Standards
Category Volume Percentage Standard† Actual Ethanol Equivalent
Cellulosic biofuels 6.6 million gallons 6.0 million gallons 0.003% Biomass-based diesel 0.80 billion gallons 1.20 billion gallons 0.69% Advanced biofuels 1.35 billion gallons 1.35 billion gallons 0.77% Total renewable fuels 13.95 billion gallons 13.95 billion gallons 8.01% † Percentage standards are based on ethanol-equivalent volumes, not actual volumes. The ethanol-equivalent volume is determined from the volumetric energy content of a biofuel in comparison to the volumetric energy content of denatured ethanol.
Fuel Economy/GHG Emission Regulations: EPA and U.S. DOT have been developing a number of fuel economy and GHG emission regulations for highway vehicles:
● Fuel economy (Corporate Average Fuel Economy (CAFE)) and GHG standards for model year 2012–2016 light-duty vehicles—the regulation is expected to result in an average MY 2016 vehicle emission level of 250 g CO2/mile and 34.1 mpg (6.9 liters/100 kilometers (km)) CAFÉ fuel economy. Status: final rule.
● Fuel economy (CAFÉ) and GHG standards for model year 2017–2025 light-duty vehicles—four scenarios were suggested, with annual CO2 emission reductions from 3 to 6 percent. The most extreme scenario (6 percent reduction per year) calls for an average CAFÉ fuel economy of 62 mpg by 2025. Status: Notice of Intent.
● Fuel economy and GHG emission standards for medium- and heavy-duty trucks—the regulation would be phased-in from 2014 to 2018, to bring fuel economy improvements between 7 and 20 percent, depending on vehicle category. Status: proposed rule.
Although off-road engines and vehicles could potentially become a subject of GHG emission regulations, the EPA is currently not developing such legislation.
Canada. In September 2010, Canada finalized its Federal Renewable Fuels Regulations, which require gasoline producers and importers to have an annual average renewable fuel content of at least 5 percent based on the volume of gasoline produced and imported. The 5-percent requirement became effective December 15, 2010.
For diesel fuels, Canada’s Renewable Fuels Regulations require an average 2-percent renewable fuel content in diesel fuel and heating distillate oil, effective July 1, 2011. The technical feasibility of the 2-percent requirement was assessed, based on the results of the National Renewable Diesel Demonstration Initiative (NRC, 2010).
The Renewable Fuels Regulations support Canada’s commitment to reduce its total GHG emissions by 17 percent from 2005 levels by 2020. The Regulations are estimated to result in an incremental reduction of GHG emissions of about 1 MT carbon dioxide equivalent per year.
Current biodiesel production in Canada is about 200 million liters (52 million gallons) annually. To meet the 2-percent renewable fuel mandate, about 550 million liters (145 million gallons) of renewable diesel will be required.

54
GHG Regulations: Emission regulations for locomotives that are being developed by Transport Canada will include emission standards for criteria air pollutants as well as limits on GHG emissions. The final regulations are expected to be effective in 2011.
European Union (EU). Two EU directives were adopted that mandate the use of biofuels in the transportation sector:
● Directive 2003/30/EC of May 8, 2003, established the goal of reaching a 5.75 percent share of renewable energy in the transportation sector by 2010.
● Directive 2009/28/EC of April 23, 2009, referred to as the new directive on the promotion of renewable energy, increased this mandate to a minimum of 10 percent in every member state in 2020.
The new renewable energy directive supports the European “20-20-20 goal,” driven by climate change and energy security, which aims to reduce consumption of primary energy by 20 percent by 2020. Under the directive, each member state has a target calculated according to the share of energy from renewable sources in its gross final consumption for 2020. Moreover, the share of energy from renewable sources in the transportation sector must amount to at least 10 percent of final energy consumption in the sector by 2020. The renewable energy targets apply to the total of all forms of energy used in transportation—this includes not only biofuels for internal combustion engines but also electrical energy used in the transportation sector, for example.
The directive encompasses energy from biofuels and bioliquids, which should contribute to a reduction of at least 35 percent of GHG emissions to be taken into account. From January 1, 2017, their GHG emission savings should be increased to 50 percent. On June 10, 2010, the European Commission adopted a regulatory package to encourage industries, governments, and nongovernment organizations to set up certification schemes for all types of biofuels, including those imported into the EU. The package focuses on the sustainability criteria for biofuels and what is to be done to ensure that only sustainable biofuels are used.
CO2 Emission Regulations: EU has adopted CO2 emission standards for light-duty vehicles. A fleet average CO2 emission target of 130 grams/kilometer (g/km) must be reached by each vehicle manufacturer by 2015 using vehicle technology. To meet the EU CO2 emission target of 120 g/km, a further emission reduction of 10 g/km is to be provided by additional measures, such as the use of biofuels.
CO2 emission regulation for light commercial vehicles (such as vans) is in the final stages of development. The EU authorities also intend to develop CO2 emission requirements for heavy-duty highway vehicles, but the development of the regulation is still at an early stage.
The EU has not been developing CO2/GHG emission regulations for off-road engines or vehicles, and it has not announced an intention to develop such legislation.
55
A.2 Alternative Diesel Fuels As the conventional crude oil resources become depleted, alternative energy resources will increasingly replace them, which may include the following:
● Unconventional crude resources—Deep sea, oil sands, oil shale.
● Natural gas—From a resource perspective, natural gas remains the most abundant energy source. According to the International Energy Agency (IEA), global use of gas may rise by more than 50 percent from 2010 levels and account for more than 15 percent of global energy demand by 2035 (IEA 2011). In the early 2000s, worldwide reserves of natural gas were estimated at 140,000 billion cubic meters (bcm), whereas annual global consumption was only 2,100 bcm (Clark, 2002). In recent years, shale gas production methods have been commercialized, contributing to a rapid growth of natural gas production and causing an increase in gas resources. Adding identified shale gas resources to current estimates of other gas resources would increase the total world’s technically recoverable resources by over 40 percent (EIA, 2011). The most efficient utilization of natural gas remains an important open issue. Natural gas could be used directly or converted to liquid (FT diesel, methanol) or gaseous (DME, hydrogen) fuels.
● Coal—Although coal is not particularly usable as a transportation fuel in its solid form, transportation fuels that may be produced from coal include CTL synthetic diesel as well as DME.
● Biomass—Renewable biofuels are believed by many to be the ultimate solution to the problems of GHG emissions and the depleting fossil fuel resources. However, an uncertainty exists about the energy balance and the sustainability of the so-called first generation biofuels (i.e., fuels made from agricultural feedstocks that compete with food resources (examples include corn ethanol and soy biodiesel)). Second-generation biofuels should be developed and commercialized, which could be produced in a sustainable manner. Examples of prospective future renewable fuels include biodiesel made of algae, cellulosic ethanol from wood, synthetic FT diesel, or DME made from synthesis gas obtained via biomass gasification.
Table A3 lists selected alternative fuel options for the transportation industry.

56
Table A3. Alternative Fuel Options
Alternative Fuels
Diesel Engine Compatibility Specifications Status
Biodiesel/ Renewable Diesel
May be used in existing engines, fuel stability, low temperature operability issues, increased filter replacement? Fuel Storage issues?
Requires separate specifications for blends higher than 5% (B5) Existing ASTM standards cover blends up to B20 Meets ASTM D975
B2 – Canada B5 – Standard B20 – Experimental
Synthetic Diesel Fuel Compatible Assume it meets ASTM
D975 Experimental
Natural Gas Not compatible: requires dedicated fuel and ignition/storage systems
Dedicated fuel specifications exist
Road – demonstration Switcher – in-use
Propane Not compatible: requires dedicated fuel and ignition systems
Dedicated fuel specifications exist
Not being considered
Dimethyl Ether
Compatible with compression-ignition, but requires a dedicated fuel system, Engine modifications similar to LPG
Specifications as automotive fuel not yet adopted Experimental
Coal Slurry Fuels Requires dedicated fuel system Major issues in engine wear
No specifications exist Experimental
Ethanol-Water Blends
Issues exist if used in existing engines No specifications exist Experimental
Hydrogen Not compatible: envisioned for use in fuel cell or H2 internal combustion engines
No specifications exist Experimental Switcher – Demonstration
A.3 Advanced Motive Power Technologies As outlined in Table A3, many of the alternative fuel options are not fully compatible with existing engines and/or with the existing distribution infrastructure for liquid, HC-based engine fuels. Thus, the reduction of GHG emissions through the use of alternative fuels may require a significant investment not only in the production of the fuel but also in new engine technology and/or fuel infrastructure, which necessitates a long timeframe. In contrast, GHG reductions through increased engine efficiency may be realized in a shorter term while bringing a monetary benefit to the customer as the result of the reduced fuel consumption (Ryan, 2008).
New combustion modes are also being developed to reduce pollutant emissions. A significant amount of research is being conducted by highway engine manufacturers to develop various premixed diesel combustion modes, such as premixed charge compression ignition (PCCI) and

57
low temperature combustion (LTC). These premixed combustion modes can provide ultralow NOx emissions as well as reduced PM, usually at the expense of increased carbon monoxide/hydrocarbons (CO/HC). One of the major issues is combustion control, especially at higher engine loads. “Mixed-mode” engines are envisioned (Stanton, 2008) that would operate in premixed combustion modes at low load and in the conventional diesel combustion mode at high load.
Fuel economy presents another challenge in advanced combustion research. Although future NOx emission standards seem to be possible to meet through advanced combustion alone, without NOx aftertreatment, this approach may involve a fuel economy and GHG emission penalty. A division has formed between highway engine manufacturers, with some companies integrating urea selective catalytic reduction (SCR) aftertreatment into their engines, and others attempting to ultimately meet future emission standards without NOx aftertreatment. Section A.12 presents more discussion on the advanced combustion research pertaining to locomotive engines.
Another important direction of research is improved energy efficiency through energy recovery in the diesel engine or in the vehicle. Figure A1 illustrates the heat balance of a 1998 model year heavy-duty truck diesel engine operating at its most efficient operating point (Eckerle, 2007). Only 43.5 percent of the chemical energy contained in the fuel is converted into mechanical work.
Figure A1. Energy Balance in 1998 HD Truck Engine
As the chart shows, the largest source of thermal efficiency loss is the heat dissipated from the engine (20 percent) and the heat expelled with the exhaust (30 percent). A number of technologies are being developed that could capture that energy and increase the engine efficiency. U.S. DOE-sponsored research is targeting a 55-percent thermal efficiency in heavy-duty diesel engines by 2015.

58
In addition to increased engine efficiency, further energy and fuel savings are possible through vehicle technology. For example, hybrid powertrains commonly recover some of the energy normally lost during vehicle braking.
A.4 Biodiesel Although a wide variety of materials could potentially carry the label “biodiesel” in that they are biologically derived fuels that can be used in diesel engines, the label is generally applied to a specific class of compounds. In the United States, the ASTM Biodiesel Task Force adopted a definition of biodiesel that limits it to “mono alkyl esters of long chain fatty acids derived from renewable lipid feedstocks, such as vegetable oils and animal fats, for use in compression ignition (diesel) engines” (Howell, 1997). The most common alcohol used in the production of mono alkyl esters is methanol, and the more specific label “methyl ester” is often attached to this type of esterified biodiesel. The mono alkyl ester definition eliminates pure vegetable oils as well as monoglycerides and diglycerides from consideration as biodiesel. This review will limit the term biodiesel to mono alkyl ester fuels.
Note that considerable variation in the definition of biodiesel exists both in North America and worldwide. The term biodiesel may occasionally refer to diesel-like fuels other than alkyl esters. For several years, the term biodiesel was used to describe HC-based fuels manufactured through hydrogenation of fats or vegetable oils—an increasingly more important type of biofuel. For various reasons, the use of the term biodiesel to describe HC fuels produced by hydrotreating oils at a refinery has fallen out of favor, and these fuels are commonly referred to as renewable diesel fuels.
Biodiesel is rarely used in its neat form but is commonly blended with diesel fuel. The resulting blend is commonly referred to as Bx where x is a numerical value representing the volume percentage of biodiesel in the final fuel blend. For example, B2, B5, and B20 are common blend levels and denote a blend of 2-, 5-, and 20-percent biodiesel by volume, respectively, in petroleum diesel fuels. B5 is the highest blend level approved by almost all manufacturers of high-speed diesel engines. Under the ASTM D975 standard, up to 5-percent biodiesel content is allowed in commercial diesel fuel. Some engine manufacturers allow higher level blends. B20 is the minimum blend level eligible for EPAct credits. B100 refers to 100-percent (or “neat”) biodiesel.
A.4.1 Properties and Specifications ASTM Specifications In the United States, ASTM D6751 defines the properties of biodiesel blending stock to be used in blends with diesel fuel up to a blend level of B20. Table A4 shows the technical requirements of ASTM D6751-07b.

59
Table A4. Technical Requirements of ASTM D6751-07b
Property Test Method Limits
Units Min. Max.
Alcohol control either: Flash point or Methanol
ASTM D93 130 °C EN 14110 0.2 % vol.
Flash point ASTM D93 93 °C Kinematic viscosity @40 °C ASTM D445 1.9 6.0 mm2/s
Sulfated ash ASTM D874 0.02 % mass Sulfur:
S15 S500
ASTM D5453 0.0015 % mass ASTM D5453 0.05 % mass
Copper corrosion ASTM D130 No. 3 Cetane number ASTM D613 47 Cloud point ASTM D2500 Report °C Carbon residue ASTM D4530 0.05 % mass Acid number ASTM D664 0.50 mg KOH/g Free glycerin ASTM D6854 0.020 % mass Total glycerin ASTM D6854 0.240 % mass Distillation, 90% ASTM D1160 360 °C Water and sediment ASTM D2709 0.05 % vol. P ASTM D4951 0.001 % mass Ca + Mg EN 14538 5 µg/g Na + K EN 14538 5 µg/g Oxidation stability EN 14112 3 Hours
Visual appearance ASTM D4176 Free of undissolved water, sediment, and suspended matter
In 2008, the ASTM adopted standards for biodiesel blends. Blends of B5 or less were incorporated into the diesel fuel standard, ASTM D975. Up to 5-percent biodiesel can be blended into No. 1 or No. 2 diesel fuel so long as:
• the biodiesel component meets the requirements of ASTM D6751, and
• the final blend meets the requirements of D975. Labeling of the finished blend is not required; therefore, it may not be possible for the purchaser to know whether the fuel contains biodiesel unless an analysis is carried out.
B6–B20 blends are covered by a stand-alone ASTM specification D7467, as Table A5 shows.

60
Table A5. ASTM D7467 Standard for B6–B20 Blends
Property Test Method Limits
Units Min. Max.
Biodiesel content ASTM D7371 6 20 % vol. Flash point ASTM D93 52 °C Kinematic viscosity @40 °C ASTM D445 1.9 4.1 mm2/s
Ash ASTM D482 0.01 % mass Sulfur:
S15 S500 S5000
ASTM D5453 ASTM D2622
15 µg/g 0.05 % mass 0.5 % mass
Copper corrosion ASTM D130 No. 3 Cetane number ASTM D613 41 Cloud point ASTM D2500 Report °C Carbon residue, 10% bottom ASTM D524 0.35 % mass
Acid number ASTM D664 0.3 mg KOH/g Distillation, 90% ASTM D86 343 °C Water and sediment ASTM D2709 0.05 % vol. Lubricity, HFRR @ 60 °C ASTM D6079 520 µm Cetane index or Aromaticity
ASTM D976-80 40 ASTM D1319-03 35 % vol.
Oxidation stability EN 14112 6 Hours
Major Standards Development Issues In the winter of 2005–2006, the first winter after Minnesota’s B2 mandate came into existence, there were widespread filter plugging problems across the State (Zeman, 2006). Although a large number of these problems occurred with fuel blends when the biodiesel component did not meet the requirements of ASTM D6751, this was not the case for all these problems. A number of problems were encountered with biodiesel that was entirely in compliance with the existing standard. In these cases, filter plugging problems occurred at temperatures above the cloud point of the fuel. Clearly, the existing parameters used to define the low temperature operability limit of fuels for diesel engines were not adequate even for low-level biodiesel/diesel fuel blends.
An important aspect of these precipitates in many cases is that they did not redissolve after the fuel was warmed up. Contaminants such as sterol glucosides and/or soap in combination with water or saturated monoglycerides are thought to be at the root of such precipitates.
To address the issue, a specific operational type test was developed for biodiesel to reproduce the conditions under which precipitates can form above the fuel’s cloud point. In this test, the Cold Soak Filtration Test (CSFT), a 300-milliliter sample of the biodiesel is cooled to 4.4 °C and soaked at this temperature for 16 hours. It is then gently heated to room temperature where the

61
time taken to pass through a 0.7-µm filter is recorded. The CSFT and appropriate test limits are currently being determined for inclusion into ASTM D6751.
Although the CSFT test appears to address many of the filter plugging concerns encountered in vehicle fuel systems, not everyone is in agreement that this is sufficient to entirely address precipitation issues with biodiesel/diesel blends above the cloud point of the fuel. Evidence suggests that saturated monoglycerides on their own can come out of a solution at low temperatures given sufficient time and collect in the bottom of fuel storage tanks (Brewer, 2007) and unheated distribution system filters (Selvidge, 2007). If other contaminants are not present, these saturated monoglycerides easily redissolve when the temperature of the fuel rises and would not be detected with the CSFT. Unlike vehicle fuel systems, the temperature of fuel storage and distribution system tanks and filters does not generally rise rapidly, and the presence of these insolubles could be a problem in some cases.
Fuel Handling The railroads handle large amounts of fuel and have numerous fuel facilities, including direct to locomotive suppliers. As such, issues of fuel mixing, fuel cleanliness, cloud point, and filters will likely come rapidly to the forefront.
Because biodiesel has different properties compared with petroleum diesel—including stability and low temperature operability—special fuel handling demands apply to biodiesel. Special handling procedures or completely new infrastructure and/or storage facilities may be required to address the following issues:
• General handling and storage guidelines (stability)
• Blending facilities
• Solvency effect of biodiesel
• Heated storage for B100
• Free water
Storage and fuel system issues have been seen in large-scale on-highway trial programs (e.g., the Las Vegas Clark County School District busing program). These issues are seen even in areas where temperatures are considered moderate by railroad standards. Biodiesel handling and use guidelines have been published by the U.S. DOE (2009).
Fuel Quality Issues The U.S. DOE National Renewable Energy Laboratory (NREL) has conducted biodiesel fuel quality surveys since 2004 (McCormick, 2005; Alleman, 2007 and 2008). According to estimates for 2007, 10 percent of the volume of U.S. biodiesel may be out of specification (Alleman, 2008).
To address many of the quality issues, a voluntary BQ-9000 program has been started in the United States that allows biodiesel producers and marketers to certify that not only do their fuels meet ASTM D6751 requirements but also that proper sampling, testing, storage, sample retention, shipping, and handling procedures are in place (BQ-9000 2008).

62
A.4.2 Commercial and Economic Factors Figure A2 outlines the average U.S. retail prices for No. 2 diesel fuel and B100 for the dates indicated (DOE, 2011). The dashed line represents the price of B100 adjusted for energy content, expressed in dollars per DGE. Owing to the rapid rise in diesel prices and a lower rise in B100 prices for April–July 2008, the price of B100 had matched (or was even lower at some geographical locations) that of diesel fuel. Because diesel prices rose in recent months, the price gap between B100 and diesel narrowed again. When the energy content is taken into account, biodiesel (B100, $/DGE in the chart) has been always more expensive than diesel fuel.
Figure A2. Average U.S. Retail Prices for Diesel and B100
The U.S. price of biodiesel is affected by the Federal Excise Tax Credit (so-called “blenders credit”), effective January 1, 2005. It provides blenders with $1 per gallon for B100 made from agricultural products and $0.50 per gallon for B100 made from other oils (e.g., cooking oils). The tax credit lapsed in December 2009—which resulted in a 42 percent drop in U.S. biodiesel production in 2010—but was reinstated from December 2010 (NBB, 2011).
Obligatory blending of biodiesel into the diesel fuel has been mandated by some States. Typically, the mandate requires that all diesel fuel sold in a State contain a minimum of a 2-percent biodiesel (B2) blend. Some States are adding language that would increase the B2 blend to a B5 or an even higher level after a designated period. Some States tie their biodiesel requirements to the local feedstock or biodiesel fuel production (e.g., Pennsylvania bill HB1202 of July 2008).
The first State that adopted biodiesel blending requirements was Minnesota, where a B2 mandate has been applied since 2005. A bill adopted in May 2008 increased the mandatory blend level as
0
1
2
3
4
5
6
Feb 20
06
Jun 2
006
Oct 20
06
Mar 20
07
Jul 2
007
Oct 20
07
Jan 20
08
Apr 20
08
Jul 2
008
Oct 20
08
Jan 20
09
Apr 20
09
Jul 2
009
Oct 20
09
Jan 20
10
Apr 20
10
Jul 2
010
Oct 20
10
Jan 20
11
Apr 20
11
Ret
ail P
rice,
$/g
allo
n
B100, $/DGE
B100, $/gal
Diesel, $/gal

63
follows: 5 percent from May 1, 2009; 10 percent from May 1, 2012; and 20 percent from May 1, 2015. Other States that adopted or are considering the adoption of some form of biodiesel requirement include California, Florida, Louisiana, Kansas, Connecticut, Missouri, Oregon, Mississippi, Arkansas, Montana, and New Mexico as well as some Canadian provinces.
Since the adoption of the RFS2 by EPA in 2010, Federal biofuel requirements (rather than individual State mandates) are becoming the major driver in biodiesel demand.
According to a statement issued by NBB in January 2008, annual production capacity for biodiesel in the United States was 2.24 billion gallons. By early to mid-2009, production capacity was expected to increase to 3.47 billion gallons. However, current biodiesel production capacity utilization in the United States is extremely low. Actual production in 2008 was 678 million gallons or 30 percent of production capacity. A rapid rise in production occurred in 2007–2008, followed by a 2009 decline as the result of the economic recession and a further decline in 2010 because the blenders’ tax credit expired.
An increase in biodiesel production can be expected from 2011 because of the reinstatement of the blenders’ tax credit in 2011 and the increasing RFS2 mandates for biomass-based diesel, proposed at 1.0 billion gallons and 1.28 billion gallons for 2012 and 2013, respectively. Biodiesel remains the main option for fulfilling this mandate because the North American production capacity of the main alternative—the refinery-made renewable diesel—remains low.
Most feedstocks currently used in biodiesel production compete with food production. Although the estimates of the relative contribution of diverting feedstocks to biofuel production on food prices vary significantly, it is generally agreed that biofuel production is only one factor of many contributing to global food price increases. Although technology to produce biofuels from nonfood feedstocks is developing, it is unclear how long it will take for these technologies to be commercialized.
The increase in food commodities also affects biodiesel feedstock costs. This may have the effect of shifting from high-cost feedstocks, such as virgin vegetable oils, to less costly feedstocks, such as imported palm oil or used cooking oil and animal fat. Depending on the operating environment and government policy, this may also affect existing producers by making their product less competitive with other fuels.
A dispute over U.S. exports of biodiesel to Europe is another possible risk factor. The European Biodiesel Board accused U.S. producers of dumping subsidized biodiesel on the European market at a cost lower than production costs in EU countries. U.S. blenders receive the blenders’ credit regardless of the country of origin of the biodiesel or whether it is sold on the domestic market or exported. The EU estimated that 300 million gallons of biodiesel was exported to the EU from the United States in 2007. Although this would appear to represent most of the U.S. production, a significant portion of it is likely imported to the United States, blended with a small quantity of petroleum diesel (e.g., into B99) to collect the tax credit, and then exported to Europe. In March 2009, EU trade authorities imposed antidumping and countervailing measures on imports of U.S. biodiesel, which are set for 5 years. These measures were further strengthened in May 2011 to prevent exports of U.S. biodiesel via third countries such as Canada.

64
A.4.3 Environmental Impacts
Life-Cycle Analysis: Energy and GHG Emissions Energy. One of the main advantages claimed for biodiesel is its renewable character and the potential to reduce petroleum consumption. Biodiesel’s raw resources, such as soybeans or rapeseed, are entirely renewable. The U.S. DOE NREL conducted one of the first life-cycle analyses for biodiesel (Sheehan, 1998). In terms of energy, the NREL analysis found that 0.31 megajoule of fossil energy is needed to produce 1 megajoule of biodiesel, thus representing a 69-percent energy gain over the fossil energy input. Similar figures were reported by other authors. For example, IEA reviewed seven European rapeseed biodiesel studies, which were reporting that biodiesel production resulted in fossil energy savings from 30 to 80 percent (IEA, 2004).
According to newer studies, however, the issue of life-cycle energy efficiency of biodiesel remains largely uncertain. There are several fossil fuel energy inputs, such as those in the process of growing biodiesel crops that might have been underestimated or overlooked. Some authors estimated that growing and processing soybeans require 32 percent more fossil energy than the energy content in the produced biodiesel (Pimentel, 2005). The difference between this and the former estimates can be attributed to higher assumed energy inputs in soy agriculture such as machinery, fuels, fertilizers, lime, herbicides, and electricity.
GHG Emissions. Because of the renewable character of carbon in the fuel, biodiesel can also potentially provide reductions of life-cycle CO2 emissions. Carbon is biologically cycled when plants such as soybean crops convert atmospheric CO2 to carbon-based compounds through photosynthesis. Biomass-derived fuels participate in the relatively rapid biological cycling of carbon to the atmosphere (via engine tailpipe emissions) and from the atmosphere (via photosynthesis). Fossil fuel combustion, in contrast, releases carbon that was removed from the atmosphere millions of years ago. For this reason, shifting from fossil fuels to biomass-derived fuels can reduce the amount of CO2 in the atmosphere.
An early estimate of life-cycle CO2 emissions for biodiesel and petroleum diesel fuels conducted by the DOE (Sheehan, 1998) indicated that the use of biodiesel resulted in a 78-percent reduction in life-cycle CO2 emissions (this effect is entirely to the result of the biological recycling of CO2; the tailpipe emissions are actually higher for biodiesel than for petrodiesel). The analysis considered several life-cycle CO2 contributions, such as emissions from the refinery and other industrial emissions that occurred during the production and distribution of fuels.
However, newer studies include an increasing number of additional factors and assumptions that have an impact on the life-cycle GHG effect of biodiesel. These factors include indirect land use change effects from cultivation of soybeans or rapeseed, such as changes in carbon content in the soil—which decreases in cultivated land—as well as GHG emissions from fertilizers (NOx) or effects related to displaced products, such as glycerin (Delucchi, 2003).
Studies that take indirect land use changes into account have raised significant doubt about the net GHG emissions reduction potential of alkyl ester biodiesel. A technical analysis by the University of California related to California’s Low Carbon Fuel Standard (Arons, 2007) found that the net GHG emissions of biodiesel made from U.S. Midwest soybeans varied significantly depending on how the land use issues were treated. A life-cycle analysis methodology (Greenhouse gases, Regulated Emissions, and Energy use in Transportation (GREET)) that is known to have shortcomings when dealing with land use changes gave U.S. Midwest soybean
65
fatty-acid methyl ester (FAME) biodiesel a net GHG intensity of 30 g CO2 equivalent/megajoule. This is about 42 percent of that for petroleum diesel (71 g CO2 equivalent/megajoule) with the same analysis. However, when an alternative life-cycle analysis (Life-cycle Emission Model (LEM)) that deals with land use changes in a more comprehensive manner was used, the soy-based biodiesel gave an astounding 224 g CO2 equivalent/megajoule, which is over three times higher than that for petroleum diesel (73 g CO2 equivalent/megajoule) estimated with the same analysis.
Similar concerns have been raised over rapeseed-derived FAME. Some authors suggested that if rape is grown on dedicated farmland, the life cycle GHG emissions are almost equivalent to those for petroleum diesel (Johnson, 2007). Others, based on a detailed analysis of NOx release in agricultural production, have negated any climate benefit of rapeseed biodiesel (Crutzen 2007). Studies showed that between 3 and 5 percent of the nitrogen fertilizer used for growing rape is emitted as NOx, twice the value used by the United Nations Intergovernmental Panel on Climate Change to calculate the impact of fertilizers on climate change, causing up to 70 percent more GHG emissions than using the equivalent amount of fossil-based diesel.
Even more uncertainty exists about the net GHG effect for tropical biodiesel crops, such as palm oil or soybeans grown over cleared Amazon rainforest. Clearing forests for plantations usually produces a significant GHG release, which may be compensated for only after a very long time of biodiesel use. In the case of palm oil, significant GHG emissions are also generated in the production process (Reijnders 2008). Palm oil mills produce large amounts of organic waste, up to as much as 80 percent of the inputs, a part of which enters waste water. During effluent treatment, a large part of the carbon input in the waste water undergoes anaerobic decomposition to methane, a potent GHG, which makes the overall GHG benefit of palm oil derived biodiesel uncertain.
Potential Policy Impacts. The growing uncertainty over the life cycle GHG emission impacts associated with the production of biodiesel feedstocks may have a potential impact on biofuels policies and future regulations by governments worldwide, especially in countries that are committed to ambitious GHG emission reduction goals.
As mentioned earlier, under the RFS2 proposal by the EPA, conventional biodiesel such as that made from soy was assigned a life cycle GHG reduction effect of less than 50 percent, which would disqualify the fuel from being designated as biomass-based diesel. The GHG reduction effect of biodiesel was increased to above the 50 percent threshold later during the rulemaking process, allowing biodiesel to be designated as both biomass-based diesel and advanced biofuel.
In the EU, a growing public concern has followed the adoption of the biofuels directives in 2003 and 2009. The regulatory authorities have been criticized for acting hastily, without proper understanding of the life cycle GHG effects of biofuels. With mounting scientific evidence indicating that the overall GHG emissions might be actually increased through the use of rapeseed or palm oil biodiesel, there are opinions—shared by many environmental groups—that the EU biofuels directives might have a counterproductive effect and increase climate change emissions. In response, the European Commission has initiated the development of regulatory measures to ensure sustainability of biofuels.
According to recent reports by the European Commission obtained by Reuters, biodiesel from Asian palm oil, South American soybeans, and EU rapeseed all had a bigger overall climate

66
impact than conventional diesel. “Europe’s biodiesel industry could be wiped out by EU plans to tackle the unwanted side effects of biofuel production” (Reuters 2011).
Emissions of Pollutants Most testing with biodiesel has been carried out on high-speed diesel engines and only limited data is available for medium-speed diesels. Figure A3 shows some average trends on emissions for pre-1998 high-speed diesel engines from an EPA survey (2002) for different blend levels of biodiesel. On average, PM, CO, and total hydrocarbons (THC) emissions decrease, whereas NOx emissions increase with increased proportion of biodiesel in the blend.
Figure A3. Average Impact of Biodiesel on Emissions for High-Speed Diesel Engines Work on on-highway engines since 2004 suggests that the PM reduction potential may be higher than with the older pre-1998 engines. Part of the PM reduction control strategy for these newer engines is reduced lubricating oil consumption. The relative contribution of combustion generated soot to total PM would be higher, and fuel effects on PM would be accentuated. On the downside, the NOx increase with the newer engines was higher than in the older engines used in the EPA survey (Figure A4).
Cha
nge
in E
mis
sion
s, P
erce
ntag
e
Biodiesel Content in Blend, Percentage

67
Figure A4. Relative Increase in NOx for Pre-1998 and 2004 On-Highway Diesel Engines
The NOx increase with biodiesel has been fairly consistently noted. One characteristic of this NOx increase is that its magnitude is strongly dependent on engine load. Figure A5 shows the relative NOx increase for B20 and B50 blends from a 2006 Cummins ISB on-road engine measured for different test cycles having different average power demands (Sze, 2007).
0
10
20
30
0 50 100 150Average cycle power, hp
% in
crea
se in
NO
x w
ith b
iodi
esel
bl
end B50
B20
Figure A5. Relative Increase in NOx Measured on Different Drive Cycles
Having Different Average Power Requirements
Cha
nge
in E
mis
sion
s, P
erce
ntag
e %
Incr
ease
in N
Ox w
ith B
iodi
esel
Ble
nd
Biodiesel Blend, Percentage

68
Some would argue that biodiesel can show a NOx decrease in some cases, and therefore, the claim that biodiesel always causes a NOx increase is unwarranted (McCormick, 2006a). However, examination of data used to support this argument shows that NOx decreases only occur on drive cycles with very low average power demands such as those used with some urban buses (Sze, 2007). The data also shows that in cases where a NOx decrease is noted, a significantly higher fuel penalty is observed when compared to cases where NOx increases, suggesting that the NOx decrease at low loads is the result of degradation in engine efficiency (Majewski, 2008).
The increases in NOx with biodiesel can be attributed to numerous factors that depend on details of the engine being considered. Changes in controlled parameters such as fuel injection timing, injection pressure, and exhaust gas recirculation (EGR) rate can play a major role. However, even in cases where measures to hold these controlled parameters constant have been taken, NOx increases have persisted because of changes in combustion phasing, peak temperatures, and mixture stoichiometry (Cheng, 2006; Majewski, 2008).
Results from Rail Applications Although a significant body of work exists on the effect of biodiesel on emissions for high-speed engines, only limited data is available for medium-speed diesel engines such as those used in North American rail service.
Tests with an unregulated two-stroke EMD GP38-2 locomotive with an EMD roots blown 16-645E diesel engine using both EPA line haul and EPA switch duty cycles showed statistically significant increases in NOx of about 5–6 percent and decreases in CO with B20. No impact on PM or THC was detected (Fritz, 2004). This study suggested that the engine used is the most likely candidate for use of biodiesel by freight railroads because of its extensive use in switcher and road-switcher applications, and as such, it is likely to be centrally fuelled and operated in urban areas.
In another study using a four-stroke single cylinder medium-speed research engine having a similar power assembly to a GE 7FDL locomotive engine, B5 and B20 blends where tested using an Association of American Railroads’ three-mode test cycle. With the B20 blend, a 13- to 19-percent decrease in CO, a 7- to 8-percent increase in NOx, and a 13- to 19-percent decrease in PM emissions were noted (Su, 2005).
Trials outside of North America have also been carried out. Tests with B20 by the French railway operator National Corporation of French Railways (Société Nationale des Chemins de fer français (SNCF)) showed some reduction in smoke number but increases in all other emissions (Skinner, 2007). In the United Kingdom (UK) (where many passenger rail applications use multiple small diesel power plants such as Cummins NT855, Cummins QSX-19, and MTU 6R-183), tests with a Cummins NT855 engine, while showing trends consistent with Figure A3 up to B20, showed a poor response from the engine at blend levels above B20. Significant increases in PM and HC emissions were measured at B50 and B100 levels (Skinner, 2007).
The study by Fritz suggests that there is no PM reduction benefit to using biodiesel in some common locomotives. It should be kept in mind, however, that these tests were carried out on an unregulated two-stroke locomotive with PM emissions of 0.62 g/kilowatt hour (kWh) (0.46 g/bhp-h) on the EPA line-haul duty cycle. PM emissions from this two-stroke engine are dominated by lubricating oil components and the impact of fuel effects would be relatively

69
insignificant. As these unregulated locomotives are replaced with EPA-certified locomotives, PM emissions will decrease to the level where fuel effects may become detectible. The work by Su suggests that this is indeed the case; PM decreases comparable to those in Figure A3 were measured using B20 from an engine with PM emissions of 0.16 g/kWh (0.12 g/bhp-h).
The results from the European tests also point to the fact that assumptions about emission reductions, especially for higher level blends, should not be taken as a given. Some level of testing is required to verify that locomotive operation and emissions performance will not be adversely affected.
The increases in NOx with biodiesel blends, however, may be a concern. The studies by Fritz (2004) and Su (2005) measured NOx increases comparable to those shown in Figure A3. Depending on the particular engine and the operating environment, these NOx increases could pose a significant challenge to using higher level blends of biodiesel.
Concerns over NOx increases were a particular concern for Canadian Railroads that operated under a memorandum of understanding (MOU) that capped NOx emissions. Estimated NOx emissions are near the capped limit, and increases cannot be tolerated (Dunn, 2003).
NOx emissions higher than those achieved with certification fuel may also be a concern for EPA-certified locomotives. Data from the 2007 EPA certification database shows that little increase in NOx levels can be tolerated from locomotives meeting 2000 Tier 1 and Tier 2 PM and NOx levels before NOx emissions exceed the line-haul certification limit (Figure A6). Line-haul operation is weighted to operate at high loads where the relative increase in NOx would be more pronounced (Figure A5).
0
0.1
0.2
0.3
0.4
0.5
0.6
0.7
0 2 4 6 8 10 12NOx, g/bhp-hr
PM, g
/bhp
-hr
Tier 0Tier 1Tier 2EMD freshEMD remanGE freshGE reman
0
0.1
0.2
0.3
0.4
0.5
0.6
0.7
0.8
0 5 10 15 20NOx, g/bhp-hr
PM, g
/bhp
-hr
Tier 0Tier 1Tier 2EMD freshEMD remanGE freshGE reman
EPA Line-Haul Duty Cycle EPA Switch Duty Cycle
Figure A6. EPA Certification Results for NOx and PM for Fresh and Remanufactured EMD and GETS Locomotives
In switch mode, however, there is a greater margin between the certification level and the certification limit for NOx. A larger increase in NOx could be tolerated before exceeding the certification limit. However, EPA certification rules state that locomotives must meet emissions for both line-haul and switch duty cycles.

70
A.4.4 Engine Performance Effects Energy Content The energy content of biodiesel is lower and its specific gravity is higher than No. 2 diesel. Table A6 lists the volumetric energy contents. As a result of these differences, loss of engine power and increased fuel consumption can be expected.
Table A6. Energy Content of Biodiesel and No. 2 Diesel
Fuel Energy Content
MJ/l Btu/gal Biodiesel (B100) 32.9 118,170 Biodiesel B20 – 127,250 No. 2 Diesel 36.0 129,500
A survey by EPA on pre-1998 high-speed engines found that the average fuel consumption increase by mass for a wide range of engines was about 9 percent for B100 and varied almost linearly with the proportion of biodiesel in the blend (EPA, 2002). For a B20 blend, the average increase expected would then be a little under 2 percent.
The fuel consumption penalty can, however, be highly dependent on the particular engine in question. In one study with three different on-road high-speed diesel engines (Sharp, 2000), the fuel consumption penalty ranged from 13 to 17 percent for B100 and 2 to 7 percent for B20 over the U.S. FTP Transient test cycle. The same study measured a power loss of about 7 percent with B100 and about 2 percent with B20.
Work with engines used in rail applications is relatively limited, but reflects the trends seen with high-speed engines.
In a study with an EMD GP38-2 locomotive equipped with a two-stroke EMD roots blown 16-645-E diesel engine, no detectable differences were measured in fuel consumption between B20 and diesel fuel on both the EPA line-haul and EPA switch duty cycles. Power losses ranged from 0.9 to 2.4 percent depending on the base diesel fuel. The engine load control system on this particular engine sets a fixed volumetric fueling rate at each notch position (Fritz, 2004).
Tests with a four-stroke single cylinder medium-speed research engine having a similar power assembly to a GE 7FDL locomotive engine showed a power loss of 1–3 percent with B20. The impact on fuel consumption was minimal (Su, 2005).
Compatibility with Existing Engines Several concerns exist regarding the use of biodiesel blends, especially higher level blends or B100, in existing diesel engines not designed for biodiesel fuels. The major potential issues are as follows:
• Material Compatibility—Changes in fuel composition and the introduction of alternative fuels often create unforeseen problems in seals, gaskets, o-rings, as well as metallic components in the fuel system. An experimental laboratory study (Besee, 1997) concluded that the physical properties of nitrile rubber, nylon 6/6, and high-density

71
polypropylene were affected by biodiesel and its blends; whereas Teflon, Viton 401-C, and Viton GFLT appeared to have good resistance to biodiesel.
• Engine Oil Dilution—Engine oil can be diluted by fuel, such as by fuel exiting the fuel injectors that did not fully vaporize and impinge on the cylinder liner. The differences in fuel properties of biodiesel (decreased volatility, higher surface tension, and higher density) can lead to larger fuel droplets leaving the injector that travel farther and take longer to evaporate. These droplets are more likely to impinge on the cylinder wall and be scraped into the crankcase by the piston rings. Once in the crankcase, the higher boiling point biodiesel components are less likely to evaporate than the lower boiling point diesel fuel components.
• Fuel System Compatibility—In addition to the already mentioned fuel filter plugging, other potential compatibility issues with fuel systems have been investigated. Some fuel injection pumps lubricated by engine oil can introduce small amounts of lubricating oil into the fuel. Fang (2003) suggested that the polar nature of biodiesel may destabilize over-based detergents found in lubricating oil that enters the fuel system, leading to excessive deposits in the fuel filter and premature fuel filter plugging. Excessive deposit formation and wear in fuel injectors and pumps are also important considerations. According to some studies, biodiesel can have a negative impact on deposit formation in fuel injectors if insufficient detergent additives are used (Caprotti, 2007). Fuel system issues can also be caused by the presence of impurities (free methanol, water, glycerin, solid impurities) and aging products (organic acids, polymerization products).
• Aftertreatment Effects—Additional issues may exist with new engines fitted with catalytic exhaust after treatment, for instance, particulate filters. Potential problems may be caused by high ash levels in biodiesel PM and/or catalyst deactivation by metals (e.g., P, Na, K, Ca, Mg). The 10 milligram per kilogram level of phosphorus allowed in biodiesel by most standard specifications has been shown to cause catalyst deactivation with B100 (Krahl, 2006). Out-of-spec samples with even higher phosphorus content were reported by U.S. biodiesel quality surveys (McCormick, 2005). EU car manufacturers disallow the use of B100 in vehicles with particulate filters, presumably the result of oil dilution during filter regeneration (performed via in-cylinder postinjection). A recent study by the DOE NREL examined the impact of biodiesel impurities on catalytic emission controls, including diesel oxidation catalyst (DOC), diesel particulate filter (DPF), and SCR catalysts (Williams, 2011). It was found that B20 blends with metals at the maximum ASTM specification level would cause catalyst deactivation and metal migration into the cordierite catalyst substrates with detrimental effects to the substrate mechanical properties and would increase (double) the ash amount in the DPF. Thus, the ASTM biodiesel specification is not sufficiently protective for aftertreatment technologies when using B20 or higher biodiesel blends.
Experience with high-speed diesel engines indicates that low-level blends up to B5 can be used in most existing engines with no engine modifications. Almost all heavy-duty highway and nonroad engine manufacturers allow blends up to B5 with no changes.
With blend levels higher than B5, compatibility depends on the manufacturer and specific engine model being considered. Some engines tolerate up to B20 with no changes. Other manufacturers

72
have taken deliberate design steps to ensure their engines are compatible with higher level blends. Others offer OEM retrofit kits to make some engine models compatible.
Some tests have been conducted with biodiesel in locomotive engines. GETS completed performance testing on a single cylinder engine with B2-B20 blends and S15-S500 blends. Durability testing in a stationary engine is ongoing and operability testing in a locomotive application is planned (Lawson, 2008).
In B20 trials using Bombardier Class 220 and Class 221 locomotives equipped with Cummins QSK19-R engines by Virgin Cross Country in the UK, modifications were made to the fuel feed and return lines, fuel filter, and fuel fill adapter (Edwards, 2007).
A.5 Renewable Diesel The term renewable diesel usually refers to hydrotreated vegetable oils (HVO) or animal fats. The feedstocks, identical to those used for ester-based biodiesel production, are treated with hydrogen in a refinery process that removes oxygen, resulting in a paraffin fuel similar to synthetic FT/GTL diesel. Renewable diesel fuels can meet the ASTM D975 standard. Considering their value for refiners, the fuels will likely be used as blending stock to improve properties of No. 2 diesel.
Terminology confusion exists around renewable diesel, in part because of one of the leading developers of that technology, the Finnish oil company Neste Oil. At the time Neste Oil introduced its NExBTL HVO diesel, it referred to it as second generation biodiesel. Later, the company dropped the term biodiesel and renamed the fuel NExBTL renewable diesel.
From the fuel quality point of view, renewable diesel presents an attractive method of vegetable oil feedstock utilization, producing HC fuel with no stability, low temperature operability, or engine compatibility problems, which have troubled ester-based biodiesel. The life-cycle GHG emission effect of renewable diesel depends mostly on the sustainability of the feedstock, as discussed in the section on biodiesel.
A.5.1 Commercial Status From the commercial point of view, renewable diesel is currently the only alternative to biodiesel to satisfy the biomass-based diesel quotas of the EPA RFS2 program, as well as the EU biofuels mandates.
Although there are no commercial renewable diesel plants in North America, Neste Oil invested into several NExBTL renewable diesel facilities intended to supply the EU and the North American biofuel markets. Neste commissioned its first two NExBTL facilities in Finland at the Porvoo refinery in 2007 and 2009, with a combined capacity of 380,000 metric tons per annum (t/a). In 2010, Neste opened the world’s largest renewable diesel plant in Singapore, with a capacity of 800,000 t/a. A similar-sized facility under construction in Rotterdam could be commissioned in 2011. Palm oil imported from Indonesia and Malaysia is the main feedstock used by these plants. Other feedstocks can be also processed, such as waste animal fats from Australia and New Zealand.
Under April 2008 decisions of the U.S. Internal Revenue Service and the U.S. EPA, renewable diesel produced in stand-alone plants (as opposed to coprocessing with petroleum diesel) was

73
eligible for the EPAct $1/gallon tax credit. These decisions were fought by the biodiesel lobby that feared that refiners would produce renewable diesel from less expensive feedstocks, such as imported palm oil, rather than U.S.-grown soybeans.
A.5.2 Properties and Emissions Properties of the renewable diesel fuel are very similar to GTL diesel. The Neste NExBTL contains no sulfur, oxygen, nitrogen, or aromatics (Kuronen, 2007). The cetane number can be very high, up to 90. Cloud point can be adjusted by severity of the process from –5 to –30 °C. Heating value is similar to diesel fuel, storage stability is good, and water solubility is low.
In a study by Neste Oil and VTT Technical Research Centre of Finland, emissions from two heavy-duty engines and two urban buses were compared using HVO and sulfur-free EN 590 diesel fuel (Kuronen, 2007). The following emission reductions were measured with the HVO fuel, compared to EN 590 diesel: NOx: 7–14 percent; PM: 28–46 percent; CO: 5–78 percent; and HC: 0–48 percent.
A.6 Natural Gas Contrary to crude oil, natural gas supplies are considered abundant and should be ample for even greatly expanded use of the fuel. Therefore, the share of natural gas in the total energy mix is believed to grow in the coming decades at the expense of the shrinking crude oil supply.
It remains uncertain what will be the dominant utilization method of the growing natural gas production. Natural gas could be used as a transportation fuel in several ways:
● It can be used directly to fuel internal combustion engines as LNG or CNG. This section deals with such direct use of CNG/LNG fuels.
● Natural gas can be also converted to liquid HC fuels, such as diesel fuel, via GTL technologies.
● Finally, natural gas can be used to produce gaseous fuels (e.g., DME or hydrogen).
The recent increase in natural gas resources can be largely attributed to the commercialization of horizontal drilling combined with hydraulic fracturing (i.e., fracturing the rock using fluids under pressure)—a technique commonly referred to as fracking. Early experiments with commercial shale gas production were conducted in the 1980s and 1990s by Mitchell Energy in the Barnett Shale in Texas. Mitchell Energy succeeded and other companies aggressively began fracking so that by 2005, the Barnett Shale alone was producing almost half a trillion cubic feet per year of natural gas. The development of shale gas has become a game changer for the U.S. natural gas market—dry shale gas production in the United States increased from 0.39 trillion cubic feet in 2000 to 4.80 trillion cubic feet in 2010, which was 23 percent of U.S. dry gas production (EIA, 2011).
Shale gas resources are not limited to the United States but are found in a number of other countries (Figure A7): China, Argentina, Mexico, South Africa, and Canada are the top players. When the identified, technically recoverable shale gas resources are added to current estimates of natural gas resources, the world’s total technically recoverable gas resources increase by over 40 percent (EIA, 2011).

74
Figure A7. Estimated Global Shale Gas Technically Recoverable Resources
A number of potential environmental issues exist with shale gas production, which includes the following:
● GHG emissions
● Contamination of drinking water supplies
Because of its lowest carbon-to-hydrogen ratio, natural gas has the lowest carbon footprint among all fossil fuels. By increasing the natural gas share in their total energy volume, energy producers would be able to reduce their carbon footprint and, in some cases, even meet the applicable, legislated carbon emission reduction targets. However, shale gas is believed to have substantially higher life-cycle GHG emissions than conventionally produced natural gas, because of methane leaks in the production, which can be approximately 5 percent of the gas volume. Some studies suggest that the GHG impact of shale gas is actually higher than that of coal (Howarth, 2011). According to these findings, the migration from coal to natural gas for electricity production would not produce GHG emission reductions if the natural gas is obtained from shale resources.
The water contamination issue is linked to the hydraulic fluids used in fracking. Concerns exist that fracking may cause adverse environmental impacts, including contamination of drinking water supplies and withdrawal of large volumes of water from creeks and streams. Some States are pushing for Federal control and regulation of natural gas drilling by EPA and/or other Federal agencies. For instance, the New York Attorney General announced a lawsuit against the

75
Federal Government for its “failure to commit to a full environmental review of proposed regulations that would allow natural gas drilling—including the potentially harmful ‘fracking’ technique—in the Delaware River Basin” (NY, 2011). Natural gas drilling is currently not under Federal jurisdiction.
A.6.1 Railroad Experience Natural gas is a mixture of gases typically consisting of at least 90-percent methane, along with small amounts of ethane, propane, nitrogen, CO2, and trace amounts of other gases. Natural gas is not a “natural” diesel fuel because it has high octane and a low cetane number. Several approaches allow the use of methane-based gaseous fuels in the diesel engine. Each of them, however, requires a conversion or a modification to the diesel engine. A conversion to Otto cycle has often been done in highway engines, but development work is also carried out to use the diesel cycle. In the latter case, which is more common in the rail application, diesel pilot ignition is often used for igniting the fuel mixture.
Since the mid-1980s, a number of projects were launched by the railroad industry in North America and worldwide to assess the viability of natural gas-fueled locomotives (Fritz, 1997; Xin, 1998; Payne, 1999). In 1984, a program to develop natural gas fueled locomotives was started in Russia. In 1993, four types of natural gas-fueled locomotives, including CNG diesel switching locomotives and LNG freight trains, were commissioned in the Russian railway industry (Xin, 1998). Germany has developed 165-kilowatt CNG locomotives and tested them in rail yard switching operation. Japan, Finland, and the Czech Republic have also designed locomotives that operate on natural gas (Xin, 1998).
In the United States, experiments on LNG/diesel dual-fueled locomotives were conducted by BNSF until the mid-1990s. Morrison Knudsen Corporation (MK) introduced an MK1200G LNG-burning locomotive in 1994 (Fritz, 1997). BNSF in Los Angeles, CA, is still using four of these locomotives in revenue service. Perhaps the most comprehensive endeavor in the United States was the GasRail project, a multiyear cooperative industry research undertaking. Initiated in 1993 by the SwRI, it involved the development and integration of an LNG engine and its associated fuel storage and handling systems into an EMD-F59PHI passenger locomotive. The fueling system was of the late-cycle high-injection pressure technology (LaCHIP), similar to the high-pressure injection developed by Westport for natural gas bus application. The installation of the LaCHIP prototype engine into a locomotive was not completed because the program ended in 1998, in part because EMD, the principal locomotive builder participating in the program, did not support it (BNSF, 2007). In March 1992, EMD and the UP announced an agreement for modifying two EMD 3,000-kilowatt model SD60M locomotives that would run either on diesel fuel alone or on dual-fuel with diesel and high-pressure natural gas. In May 1992, GETS announced that they would develop a dual-fuel 3,000-kilowatt model Dash-8 locomotive for the UP. At that time, delivery and testing of these prototype locomotives were scheduled for mid-1993. Work progressed on demonstration units at both companies until 1995, when technical difficulties with the high-pressure fuel injection systems on both designs, combined with the introduction of many other technologies on diesel locomotives, resulted in both builders suspending their LNG freight locomotive programs.

76
In 2005, trials were conducted with GE C30-7 locomotives converted to dual-fuel CNG/diesel operation by the Ferrocarril Central Andino railroad in Peru (Roberson, 2006). India Railways reportedly tested a dual-fuel CNG/diesel locomotive on a line between Delhi and Rewari.
LNG has been evaluated as prospective fuel for future fuel cell power trains (Bourn, 2004). In a project funded by the U.S. DOD, LNG was evaluated as the base fuel for a fuel cell-powered GP-10 switcher operated by the U.S. Army. LNG, which would be reformed onboard into hydrogen, was found to be one of the feasible fuel options for this application.
Natural gas can be stored in two forms: CNG or LNG. LNG is usually favored for the locomotive fuel application, because it offers a higher storage density (Hofeldt, 1993). Approximately five times more LNG can be stored in the same size container than CNG, saving space and making refueling less frequent (Payne, 1999). In addition, the liquefaction process removes impurities that solidify at temperatures at or above the boiling point of methane (e.g., water, CO2, and heavy HCs), thereby reducing the problem of fuel weathering in storage (Owens, 1994).
There are certain applications, however, when CNG may be the preferred option. For example, switch locomotives usually remain close to stations and can be refilled more easily during long idle periods. Commuter rails may also favor CNG because of their frequent and routine stops and close proximity to available fuel supply.
To provide enough LNG for mainline rail operations between current fueling stations, it is necessary to provide a fuel tender car as part of the locomotive consist. To keep natural gas in a liquid state, it must be refrigerated to –259 °F (–162 °C). To maintain such low temperatures, the tender car is constructed of a double-walled stainless steel “thermos bottle” design, capable of keeping the LNG cold for as long as 14 days (Payne, 1999). A heat exchanger aboard the tender car converts the LNG to gas, which flows to the locomotive through a flexible hose connection between the tender and the locomotive engine. No cryogenic fuel is ever transferred onboard the engine. Safety features built in to the coupling inhibit the release of gas in the event of train-tender disconnect.
One of the major factors that have limited the use of natural gas as a transportation fuel is the infrastructure requirement for its transport and storage. The physical characteristics of LNG (as well as CNG) make transport more difficult and expensive than diesel fuel.
LNG cannot be efficiently transported by pipeline for long distances because of pipeline costs and heat transfer. Thus, it must be produced at the site, near the point of consumption, or transported by truck or tank car. For example, the natural gas could be transported from the refinery to liquefaction plants, which are situated near the fueling sites. The fuel consumption rate will determine the plant and the main fuel storage tank size. In addition, mobile liquefaction units are also available that can be used to produce LNG at the fueling site if a low quantity of LNG is desired.
Natural gas is a well-established commercial fuel. LNG production and storage are well understood, and the technology is transferable to conditions likely to be encountered in railroad applications. Operational, storage, and safety guidelines are established and available through the LNG and general cryogenic industry. There appears to be no significant technical problems in setting up the equipment and facilities required to supply LNG in the quantities and delivery rates needed by the railroads.

77
A.6.2 Natural Gas Engines Engine technology options for using natural gas can be grouped into the following three groups:
• Spark ignition natural gas (SING), Otto cycle
• Direct injection natural gas (DING), Diesel cycle
• Dual fuel natural gas (DFNG), Diesel cycle SING engines could be of lean-burn or stoichiometric type. The latter can use the three-way catalyst (TWC) emission technology and, therefore, provides the greatest emission potential. Stoichiometric combustion is used in most light-duty SING engines. Problems with thermal stress and low-power density have favored the use of the lean-burn combustion system in heavy-duty engines. The use of cooled EGR provides further potential to increase the engine output and, at the same time, decreases NOx emissions (Nellen, 2000).
A specific advantage of SING engines is low particulate emissions in comparison to diesel engines without particulate filters. The NOx emissions are generally lower (lean-burn type) or significantly lower (TWC type) than from conventional diesel engines.
DING and DFNG engines use late-cycle direct injection, and therefore, they are characterized as engines using the Diesel cycle. Both engine types need some kind of ignition source, because methane has a very low cetane number. Furthermore, engine knock has to be avoided if premixing of air and methane is used.
The DING engine uses a small quantity of diesel fuel (pilot injection) or a glow plug as ignition sources. Because the injection system for the diesel fuel does not have the capability of greater injection quantities, this option has no dual-fuel properties. In contrast, an optimization of the pilot injection can be made to achieve lower emissions. An injection system combining the injection of both diesel fuel and natural gas has been developed by Westport (Ouellette, 1998, 2002). Another example is the so-called micropilot injection, which has been developed by FEV (Umierski, 2000). Using a glow plug for ignition of the fuel is another possibility. The German development company GVH, now part of Westport, pursued this idea (Bartunek, 2000).
In a DFNG engine, natural gas is mixed (fumigated) with intake air before induction to the cylinder, and diesel fuel is used as ignition source. Because conventional diesel injection is used in this case, this engine has dual-fuel properties. A kind of hybrid version of both systems, often referred to as PING, uses pilot injection of diesel fuel and premixing of natural gas. The diesel fuel injection for PING engines is typically optimized for low fuel flows to improve emissions with CNG. Therefore, contrary to DFNG, these engines cannot be run in diesel fuel-only mode. Because the combustion in DING and DFNG engines is not completely premixed combustion, soot formation can occur. Thus, stringent future PM emission standards may necessitate the use of a particulate filter.
An overview of the technology used in natural gas engines has been provided in two International Association for Natural Gas Vehicles (IANGV) reports (Nylund, 2000, 2002). The latter report is mostly focused on light-duty vehicles and advanced drivetrains such as fuel cells. An overview of the worldwide use of natural gas fueled buses is provided in another report by IANGV (Watt, 2001).

78
Natural gas engine technology for railroad locomotives was reviewed by Payne (1999), and a comprehensive review was performed by BNSF and UP (2007) as part of its technology survey for the 2005 California MOU.
A conversion kit to convert diesel line-haul locomotives to dual-fuel diesel/natural gas operation has been developed by Energy Conversions, Inc. (ECI), of Tacoma, WA (ECI 2008). The kit is applicable to the EMD 645 two-stroke diesel engine. With the ECI system, the LNG is vaporized and injected as a gaseous fuel; the fuel and air mix during compression. A small portion of diesel pilot fuel is then injected into the cylinder at the top of the stroke to facilitate combustion. The locomotive engine can also operate in a 100-percent diesel mode, if needed.
The ECI kit provides 90-percent natural gas fuel replacement rate at high loads. At low engine loads, including idle, the engine is operated in the diesel mode, which has an effect on emissions. The ECI kit has been recognized by the railroad industry as the only one “commercially available, proven, and tested natural gas-fueled line-haul locomotive product available for the North American locomotive market” (BNSF, 2007). However, this kit has not been EPA emission certified.
A.6.3 Natural Gas Emissions The trends in regulated emissions from diesel and natural gas engines can be summarized as follows (Ahlvik, 2003):
• NOx emissions are generally lower for natural gas than for diesel. However, a great variability was seen for natural gas in many tests, resulting in higher average NOx emissions for the fleet. Using EGR and other advanced engine technologies, diesel NOx emissions can be reduced, thus reducing the apparent advantage of natural gas. Test cycles could also have a significant impact on NOx emissions.
• HC and NMHC emissions are generally lower for diesel than for natural gas. This is usually also the case for CO emissions, but very low CO emissions could be achieved with an oxidation catalyst on natural gas as well.
• PM mass emissions from uncontrolled diesel engines are higher than from natural gas. If particulate filters are used, diesel PM emission can be reduced to the same or lower level than natural gas. Ultralow sulfur diesel fuel is essential for the use of some types of particulate filters.
Emissions with natural gas depend not only on the fuel but also on the engine technology. Therefore, direct comparisons with the diesel engine are not always straightforward.
Table A7 provides an emission comparison of the ECI LNG kit as applied to an approximately 25-year-old, EMD 16-645-E3 3,000-horsepower diesel locomotive with two EPA Tier 2 diesel locomotives (BNSF, 2007).

79
Table A7. Emissions from LNG and Diesel Locomotives, G/BHP-HR
Mode THC NMHC CO NOx PM ECI Natural Gas Conversion 7.55 1.17 10.0 5.2 0.38 Diesel Tier 2 compliant EMD 0.22 0.22 1.0 5.1 0.07 Diesel Tier 2 compliant GETS 0.16 0.16 0.4 5.3 0.10
The data shows that the LNG locomotive has no emission advantage over the Tier 2 diesels. It may be possible to design a natural gas locomotive engine that would have cleaner emissions than a Tier 2 diesel.
Fuel consumption is generally lower for diesel fuel than for natural gas. However, because natural gas contains more hydrogen than diesel fuel, the CO2 emissions are sometimes lower for natural gas.
A.6.4 Future Trends The authors believe that future emission standards can be met using both clean diesel and natural gas technology. Thus, the choice of fuel will largely depend on the economics and fuel availability and infrastructure factors. According to the experience of U.S. railroad operators, natural gas-fueled locomotives are more expensive to operate than diesel equipment (BNSF, 2007). The economics, however, may change in favor of natural gas, because the price ratio of crude oil to natural gas has been increasing and has already reached twice the historical level.
With the improving natural gas economics, manufacturers are evaluating natural gas large bore engine programs for a wider range of applications including rail. In 2011, development of natural gas fueling for large engines was announced by Westport Innovations of Vancouver, BC, Canada—a developer and manufacturer of natural gas fuel systems and natural gas engines including heavy-duty highway truck engines. In a project partially funded by Sustainable Development Technology Canada, Westport will design high-performance LNG technology for high-horsepower applications such as mining, rail, and marine. A prototype fuel system will be tested and demonstrated in service using a Canadian National Railways locomotive. In a separate project, Westport will cooperate with Caterpillar to evaluate direct injection, natural gas, fuel system technologies for use on Caterpillar’s large engines in various applications, potentially including rail. The evaluation is expected to be completed in 2012.
Support of natural gas-fueled locomotives would also require significant investments in new fueling infrastructure that are duplicative to establish diesel-based infrastructure. These infrastructure investments and their associated operating costs must be accounted for in any evaluation of cost-effectiveness.
A.7 Propane LPG, most often referred to as propane, is typically a mixture containing at least 90-percent propane, approximately 2.5-percent butane, and higher HCs, and a balance of ethane and propylene. LPG is a byproduct of natural gas processing and petroleum refining. LPG is a well-

80
established commercial fuel with existing fuel quality specifications. Special requirements exist for storage and handling of LPG, but the technology is well understood.
Propane has been one of the earliest alternative fuel considered for locomotive use. Already in 1936, the Plymouth Locomotive Company built a propane locomotive for the Joplin-Pittsburg Railroad in Missouri (BNSF, 2007). The fuel was stored in three cylinders under the carbody. A spark ignited engine, rated at 450 hp, was used. The locomotive was retired around 1980.
Considerable interest in LPG locomotives existed among railroads during the late 1950s and early 1960s (SwRI, 1961). The interest was driven by the perceived cost savings from converting from diesel to propane.
Liquid propane is stored under moderate pressures in special tanks. The liquid propane is typically vaporized and supplied to the engine as a gaseous fuel. Compared with natural gas, the saturated vapor pressure of LPG is lower, which makes it possible to store LPG at lower pressures and at ambient temperatures (as opposed to the cryogenic temperatures of LNG). In many other respects, including the engine technology as well as emission issues, similarities exist between natural gas and LPG.
As in the case with natural gas, LPG engine technologies include dual-fuel, diesel pilot injection and 100-percent LPG spark-ignited combustion. In 1953, an LPG gas-turbine-electric locomotive was also tested by UP, but the idea was ultimately abandoned because of poor fuel economy (BNSF, 2007).
Some renewed interest in the possibility of using propane as locomotive fuel has been sparked by the availability of NOx emission credits and incentive programs in NOx emission sensitive areas, such as parts of Texas. A study by the SwRI evaluated the feasibility of using LPG-fueled switcher locomotives in the Port of Houston, TX—a nonattainment area in regards to ozone/NOx (Bourn, 2003). The results of NOx emission modeling in the study showed that NOX emission savings of 5.3–14.9 tons of NOx per year per locomotive were possible with LPG compared to the current diesel equipment available at that time (NOx reductions varying from 55 to 85 percent for the LPG compared with diesel were assumed). The propane engines will generally have a 10- to 15-percent disadvantage in thermal efficiency compared with the diesel counterparts, depending on the combustion technology selected. On the basis of the fuel prices gathered in the study, the use of propane would increase the operational costs unless incentives are used.
A.8 DME
A.8.1 DME Properties DME (CH3OCH3) is the simplest ether, consisting of two methyl groups bonded to a central oxygen atom. DME, most commonly produced from natural gas, provides a possible avenue for the utilization of natural gas reserves, especially those that are inaccessible by pipelines. Because DME can be produced from coal, via gasification and synthesis gas, it receives increasing attention as potential automotive fuel in countries with coal resources. Renewable DME could be produced via gasification of biomass.
DME has replaced freon as an environmentally friendly and safe aerosol propellant, which is one of its major current applications. In the 1990s, a worldwide quantity of 100,000–150,000 tons per annum DME was produced (Verbeek, 1997).

81
DME is a colorless gas at room temperature with an ethereal odor, a vapor pressure of 0.593 megapascals (MPa) (4450 mm Hg) at 25 °C, and is highly flammable in air (3.4–18 percent) (DuPont, 2000). Because of its vapor pressure, it is handled and stored as liquefied gas, in the form of a colorless clear liquid, similar to LPG. DME has no corrosive effect on metals, but it is an excellent solvent that can dissolve a number of elastomers (including those used in conventional diesel fuel systems).
Because of its low autoignition temperature, DME can be used as a fuel for diesel (compression ignition) engines. DME is characterized by a relatively high cetane number of 55–60 but an inferior heating value compared with diesel fuel. Physical and chemical properties of DME are compared with those of other fuels in Table A8 (Basu, 1995; Ogawa, 2003; Ohno, 2003).
Table A8. Comparison of DME with Other Fuels
Property Fuel
DME Diesel Methane Propane Methanol
Formula CH3OCH3 - CH4 C3H8 CH3OH
Boiling temperature, °C -25 ~150–380 -162 -42 65
Vapor pressure @293 K, kPa 618 - - 942 -
Explosion limit, % in air 3.4–17 0.6–6.5 5-15 2.1-9.4 5.5–36
Liquid density @20 °C, kg/m3 660 800–840 420 490 790
Liquid viscosity @25 °C, kg/ms 0.12–0.15 2–4 - 0.2 -
Gas specific gravity (vs air) 1.59 - 0.55 1.52 -
Lower heating value, MJ/kg 28.4 42.5 49.4 46.3 19.5
Gas lower heating value, MJ/Nm3 59.3 - 35.9 91.0 -
Cetane number 55–60 40–55 0 ~5 ~5
Autoignition temperature*, °C 350 206a 632 504 470 * with air at 0.1 MPa. a – n-Cetane. kg, kilogram.
No standard specifications exist for DME as automotive fuel. Proposed DME fuel specifications have been suggested by IEA and Japan (RENEW, 2008).
A.8.2 DME Engines Because of the different fuel handling and properties, the use of DME requires dedicated DME engines, with fuel systems resembling those for LPG fuel. DME engine developments have been taking place mostly in Japan and Europe. The world’s first DME vehicle was reportedly a 2-ton light-duty truck converted from diesel to DME by NKK Corporation in 1998 (Ohno, 2001).
82
In Europe, Volvo has developed DME engines and vehicles in cooperation with other partners. In 1999, the first-generation Volvo DME vehicle prototype was built. In 2005, a second-generation Volvo DME truck—the FM model powered by a 9-liter, 300-horsepower DME engine—was unveiled. The vehicle met Euro V emission standards through the use of EGR and an oxidation catalyst.
Figure A8 shows a prototype DME storage and injection system developed for a prototype DME-fueled bus (Hansen, 2001). The fuel system consists of the following main components:
• Fuel tanks with level indicators, integrated submerged fuel pumps for low-pressure supply of liquid DME
• Valves, connectors, and fuel lines, including safety enhancing devices (pressure relief valves)
• Purge tank for storage of gaseous DME
• Pneumatic control unit for the purge system
• Air-driven purge compressor
• Electrical control unit and driver interface
• Wiring harness Because DME provides insufficient lubrication in the injection system, a lubrication additive must be added.

83
Figure A8. DME Fuel System Layout (Volvo)
The performance of engines converted to DME fuel was reported to be roughly equivalent to that of the diesel engine before conversion. This is illustrated in Figure A9, which shows similar thermal efficiency (BSFC) of diesel and DME. (Ohno, 2001). An improvement in engine noise was also recorded with DME.

84
Figure A9. DME and Diesel Engine Performance Comparison (Constant Speed 2000 RPM)
A.8.3 Emissions with DME DME is characterized by a low autoignition temperature and by an instantaneous evaporation when injected into the cylinder. Because of the fast fuel evaporation, DME engines can achieve low PM emissions without the need for diesel particulate filters.
NOx emissions can be controlled to a degree through the injection rate shaping. However, controlling NOx emissions to Euro V levels (2 g/kWh) requires the additional use of EGR. Meeting the U.S. 2010 NOx limit (0.2 g/bhp-h) in DME engines may require the use of both EGR and NOx aftertreatment.
DME fuel may cause a significant increase of CO emissions. An increase of gas-phase HC is also possible. These emissions are easy to control with the use of a diesel oxidation catalyst. Figure A10 illustrates NOx and smoke (PM) emission benefits from the use of DME (Ohno, 2001). As evident from the chart, the potential of DME for smoke (PM) reduction is higher than that for NOx reduction.
Figure A10. Smoke and NOx Emissions with DME (Constant speed 2000 rpm, 2-ton diesel
truck converted to DME)

85
Although there are few published reports about the use of DME, engines using it may also produce negative emission effects. For instance, formation of methyl nitrite, CH3ONO, an asthma causing gas, has been suspected with ester-based fuels including DME (Joseph, 2007).
The CO2 efficiency of diesel and DME was reported to be very similar. In a heavy-duty engine application, if the well-to-wheel CO2 emissions of the diesel engine equal 1.00, the emissions of DME are 1.02 (Verbeek, 1997). According to other sources, CO2 emissions with DME, relative to diesel, would range between 0.96 and 1.14 (Basu, 1995).
A.8.3 Experience with Large Bore Engines A 1.25-megawatt DME engine was developed (Masuda, 2007) on the basis of a Daihatsu DK series medium-speed diesel engine for power generation. The development of the engine was intended to promote earlier commercialization of decentralized DME power generation systems. The developed DME diesel engine of 1.25-megawatt class had a cylinder bore of 260 millimeters (mm), a stroke of 380 mm, and an engine speed of 750 min–1. A modified jerk fuel injection pump was installed in the FIE system to supply the increased (1.8 times) volumetric fueling rate. The feeding pressure in the fuel circulation line was set to a high level to ensure that the DME fuel remained liquid.
A trial test demonstrated that the DME engine had a thermal efficiency comparable to conventional diesel engines. No black smoke was observed from the stack when the engine was started or during low load operation. The authors confirmed that the engine could be operated with DME in a stable condition from low to high load.
To control NOx emissions to very low levels, the same DME engine was operated with EGR as well as with SCR using DME as a reducing agent (Shimizu, 2007). With EGR ratios over 40 percent, NOx was reduced to below 30 parts per million (ppm) (O2 = 13 percent). With a combination of EGR and DME-SCR, NOx was further reduced to 15 ppm, a 99-percent reduction from the original engine-out emissions.
In a more theoretical study, two laboratory engines (a one-cylinder engine of 102 mm bore, 105 mm stroke, 12.5-kilowatt power, and a four cylinder engine) were operated using natural gas, with a small amount of DME as an ignition source (Ishida, 2007). The authors operated the engines in homogeneous charge compression ignition (HCCI) mode. The minimum DME amount to achieve stable ignition was determined depending on engine operating parameters.
A.9 Ethanol-Diesel Blends Some suppliers offer blends of ethanol with diesel fuel, often referred to as “e-diesel,” for use in unmodified diesel engines. Typically, standard diesel fuel (such as No. 2) is blended with up to 15 percent (by volume) of ethanol using an additive package that may comprise from 0.2 to 5.0 percent of the blend. There is currently no specification for e-diesel in the United States, and the fuel must be considered experimental.
Relative to diesel, e-diesel blends without additives are typically characterized by poor stability, low flash point, high volatility, low cetane number, and low lubricity. Cold flow properties tend to improve even though cloud point can be significantly higher. E-diesel additive packages are

86
designed to improve the blend stability, cetane number, and the lubricity in the final blended product. Low flash point and high volatility persist. The exact properties depend on the ethanol content and on the additive.
Ethanol has a flashpoint of approximately 17 °C, while that of diesel fuel, depending on grade and the jurisdiction, is 38 °C and higher. Blends of 10- to 20-percent ethanol with diesel have flashpoints almost identical to that of neat ethanol. Adding ethanol to diesel makes the resulting blend a Class I liquid (flashpoint < 37.8 °C) according to the U.S. NFPA ratings. Diesel fuel is a Class II liquid. Class I liquids have more stringent storage requirements including more distant location of storage tanks from property lines, buildings, other tanks, and vent terminals as well as the requirement of flame arrestors on all vents and in the fill necks (Waterland, 2003; Weyandt, 2003). This means that e-diesel must be stored and handled like gasoline.
E-diesel can produce reductions in some regulated emissions. Most studies find decreased PM emissions with e-diesel. PM emission reductions up to 30 percent and higher have been reported. Results with CO, HC, and NOx tend to be mixed, including increases and decreases (Corkwell, 2003).
A number of potential operational issues exist with e-diesel, mainly related to two properties: the high volatility and low viscosity of e-diesel blends. In some FIE systems, the high volatility of e-diesel may lead to cavitation, resulting in damage to fuel injectors, the injection pump, and/or the transfer pump (Waterland, 2003). Cavitation may be especially significant in engines with fuel systems that produce increased fuel temperatures. Therefore, the effect of e-diesel on injection equipment must be tested before wider deployment on each type/model of the diesel engine.
The lower viscosity of e-diesel can increase pump and injector leakage, resulting in reduced maximum fuel delivery and lower peak power. Hot restart problems may be encountered as well because of insufficient fuel being injected at cranking speed (Hansen, 2005).
As it is the case with fuel additive-based technologies, the e-diesel additive package may contribute to fuel injector fouling. Considering the high-additive content in e-diesel, up to approximately 5 percent, the quality of the additive package is of critical importance.
A.10 Coal Slurry Fuels Coal slurry fuels are obtained typically by mixing finely dispersed coal particles with conventional diesel fuel or with water. The mixture is then combusted in the diesel engine. Stimulated by high oil prices, the technology of coal slurry fuel was developed in the 1980s (Nydick, 1987; Flynn, 1990; Caton, 1994). After the oil price returned to a low level, studies and commercial projects on coal slurry fuel were practically suspended for several years. The recent increase in oil prices caused a renewed interest in the technology, especially in countries with abundant coal resources such as China.
In a newer Chinese study (Cui, 2008), a new process was presented for the preparation of superfine coal–oil slurry intended as fuel for high-speed diesel engines. The process uses high-pressure jet mills to reduce coal particle size and to mix the coal with diesel fuel. The coal content in the slurry was 50 percent, and the mean diameter of coal particles was 2.71 micrometers.
There are no comprehensive literature reports on the effect of coal slurries on the performance and emissions in modern diesel engines, and the technology must be considered experimental.

87
Several potential issues exist, including the effect on slurry properties (stability, heat value, and rheological behavior with potentially high viscosity), on combustion and emissions, and on fuel injection components and engine wear.
A.11 Hydrogen Technology for Locomotive Applications
A.11.1 Hydrogen Powertrains Fuel Cells Fuel cells are electrochemical devices that convert the energy of a chemical reaction directly into electricity, with heat and water as byproducts. They differ from batteries in that the fuel and oxidant are stored externally. This enables them to continue operating as long as fuel and oxidant are supplied. The main types of fuel cell being developed are the following (DOE, 2008):
• Polymer electrolyte or proton exchange membrane fuel cells (PEMFCs), also known as solid polymer fuel cells (SPFCs). PEMFCs/SPFCs operate at relatively low temperatures between 80 and 120 °C and are fueled by high-purity hydrogen. Because of their fast startup time, low sensitivity to orientation, and favorable power-to-weight ratio, PEMFCs are particularly suitable for use in passenger vehicles such as cars and buses.
• Direct methanol fuel cells (DMFCs) are similar to PEMFCs except that DMFCs operate directly on methanol without the need to reform it to hydrogen first.
• Molten carbonate fuel cells (MCFCs) operating at about 650 °C are being developed for combined heat and power (CHP) and distributed generation applications. They are typically fueled by natural gas. MCFCs take a long time to reach operating temperatures and are slow to respond to changes in power demand. This makes them unsuitable for transport applications.
• Solid oxide fuel cells (SOFCs) are also being developed for CHPs and distributed generation applications. Their high temperature of operation (800–1000 °C) provides the opportunity to combine them with gas turbines to give electrical efficiencies as high as 70 percent. Lower temperature SOFCs operating at 650–750 °C are also being developed for vehicle auxiliary power units (APUs) and stationary power applications. As with MCFCs, SOFCs are slow to respond to changes in power demand and are unsuitable for many transport motive power applications. The high temperature of operation allows SOFCs to be fueled by HC fuels. This eliminates the fuel storage and distribution issues currently facing other fuel types (such as PEMFCs).
• Phosphoric acid fuel cells (PAFCs) are one of the most mature types of fuel cell and were the first to be used commercially. They are typically used for stationary power generation, but some have been used in early fuel cell bus demonstration projects running on methanol. PAFCs have much lower power densities than PEMFCs, and they are also expensive.
• Alkaline fuel cells (AFCs) were one of the first fuel cell technologies developed and widely used in the early U.S. space program. AFCs have high efficiency but are very easily poisoned by CO2. They require high-purity hydrogen and oxygen.

88
Fuel cells offer a number of benefits over internal combustion engines including higher efficiencies, quiet operation, much lower or no local emissions, and a modular construction that is scalable to meet higher power requirements. The different fuel cell technologies all face similar development challenges. Fuel cell performance depends fundamentally on the electrochemical reactions that occur within the core fuel cell stack itself. Fuel cell systems are complex and currently costly because of the expensive materials required for catalysts, electrodes, and membranes, and because of the additional peripheral equipment (e.g. cooling systems, complex fuel storage requirements, power conditioners, and fuel processor/reformer) required.
PEMFCs are the type of fuel cell predominantly being considered for transport applications and are closest to market commercialization.
Hydrogen Internal Combustion Engines Although not as widely discussed as fuel cells, hydrogen internal combustion engines could allow rapid deployment of hydrogen-fueled vehicles and enable a hydrogen refueling infrastructure to become more economically viable. Hydrogen internal combustion engines are much closer to commercial deployment for transport applications than fuel cells.
Hydrogen internal combustion engines can currently be manufactured more cheaply than fuel cell powertrains. They are only approximately 15 percent more expensive than conventional gasoline engines (DOE, 2008) used in road vehicles. They also have the additional advantage of running on pure hydrogen or a blend of hydrogen and CNG.
Hydrogen Storage Main methods of hydrogen storage include the following (DOE, 2008):
• Compressed hydrogen. The storage of hydrogen in pressurized tanks is the most commonly used technology for large-scale storage. The limitations of compressed hydrogen storage relate to the tank materials’ permeability to hydrogen and to their mechanical stability under pressure. Storage at 5,000 pounds per square inch (psi) is common, but high-pressure storage tanks capable of up to 10,000 psi are being developed to improve storage density.
• Liquid hydrogen. The storage of hydrogen as a cryogenic liquid offers higher storage densities than compressed gas. The low temperature, however, requires cryogenic cooling equipment capable of cooling the hydrogen to approximately 20 K (–253 °C) at 1 bar. Extremely effective insulation is required to maintain this low temperature.
• Metal hydrides. Metal hydrides have the potential to provide reversible onboard hydrogen storage and release at low temperatures (25–120 °C) and pressures (1–10 atmosphere) ideally suitable for the fuel temperature and pressure requirements of PEMFCs. The release of hydrogen from metal hydrides is an endothermic process (heat must be supplied) and, in some cases, could use waste heat from the fuel cell.
Research and development priorities are in the development of new materials and systems to enhance storage density and to reduce costs. Figure A11 summarizes volumetric and gravimetric storage densities and costs for some fuel storage options for mobile applications (DOE, 2008).

89
Figure A11. Comparison of Gravimetric and Volumetric Storage Capacities of Some
Hydrogen Storage Options
Figure A12 compares the storage capacity and storage cost (£) of several hydrogen storage options with diesel fuel (Butterworth, 2005). It is clear that none of the options compare very favorably with diesel fuel storage.
Figure A12. Comparison of Some Hydrogen Storage Options to Diesel Fuel Storage
A.11.2 Rail Applications Scott (1993) and coworkers (Steinberg, 1984; Jones, 1985) carried out some of the earlier research work looking at fuel cell locomotives. An economic analysis of applying a 2,345-

90
kilowatt alkaline fuel cell by using liquid hydrogen to a commuter train suggested that fuel savings from the increased efficiency of the fuel cell locomotive could offset increased capital costs and make it cost-competitive with conventional diesel locomotives (Steinberg, 1984).
An examination of conceptual designs of an alkaline fuel cell-powered locomotive for long-haul passenger and freight service was also carried out. An analysis based solely on fuel costs that assumed that electricity prices would remain static at approximately $7.30 GJ–1 (U.S. dollars in 1984) and diesel fuel costs would rise to as high as $20 GJ–1 (U.S. dollars in 1984) predicted that by the year 2000, a fuel cell locomotive could be competitive with one using diesel (Jones, 1985).
However, in a more comprehensive study that included an estimate of capital costs, Scott concluded that fuel cell locomotives miss feasibility by approximately 1 order of magnitude. Although, hydrogen fuel cell locomotives could break even with diesels if targets were met for fuel cell performance and cost and fuel production cost. If CO2 emissions were to be included into life-cycle costing, hydrogen fuel cell locomotives could show a significant advantage over diesel (Scott, 1993).
More recently, work has been presented on the development of a fuel cell switching locomotive (Miller, 2006, 2007a, 2007b; Barnes, 2007; Lustig, 2008). Led by Vehicle Projects LLC, an industry–government partnership is developing a prototype fuel cell-hybrid switcher locomotive for demonstration of rail yard applications in the Los Angeles basin and a power-to-grid application at Hill Air Force Base (Utah).
Early work on the project was based on a preliminary design of 1.2 megawatts of gross fuel cell power coupled with 250 kg of metal-hydride hydrogen storage. The first fuel cell considered was a PEMFC type for stationary application. A number of problems were encountered early in the project. Testing of one of the eight fuel cell modules that would eventually make up the 1.2-megawatt fuel cell stack resulted in multiple stack failures and significant anode flooding. The costs of the metal hydride storage system, at about $10,000/kg hydrogen, also proved to be excessive, and the absence of any previous experience with the feasibility of such a large scale metal hydride storage system proved to present too many uncertainties. Overall, the design was overweight, excessively large, and too costly (Barnes, 2007).
As a result of these problems, the preliminary design was re-evaluated, and a hybrid design that uses a smaller fuel cell pack coupled to a battery bank was selected. It had the potential to reduce the cost significantly, because it minimized the use of fuel cells, and it prolonged fuel cell life because its operation was closer to steady state. Although battery hybrids are not a good choice for line-haul operation, they can be well suited to a switcher locomotive.
The final design used a commercially available RailPower Corporation Green Goat hybrid switcher locomotive. These locomotives used a 205-kilowatt diesel generator set and a bank of lead-acid batteries. In the fuel cell version, the diesel generator was replaced with 250 kW of Ballard Power Systems’ Mark 902 P5 fuel cells. Instead of the 250 kg of metal hybrid storage, 70 kg of gaseous compressed hydrogen was stored in 14 Dynetek 350 bar (5,000 psi) composite cylinders mounted on the roof of the locomotive (Figure A13). The final drive train was able to provide over 1 megawatt of peak power. Final demonstration occurred in 2008. Additional design details are outlined by Miller (2007a).

91
Figure A13. Final Design of Fuel Cell/Battery Hybrid Switching Locomotive
The Rail Safety and Standards Board (RSSB) in the UK carried out a feasibility study for hydrogen trains (Butterworth 2005). They concluded that the current state of development of fuel cell technology is not mature enough, and demonstration projects for mainstream rail applications are not justified at this time. Technical concerns related to current fuel cell technology included durability, heat dissipation, and maximum fuel cell power output.
Automotive PEMFC applications are being developed with a 5,000-hour lifetime in mind. For rail applications, much longer lifetimes would be required. Butterworth (2005) estimated that lifetimes of approximately 16,000–18,000 h would be needed for fuel cells to be competitive with diesel multiple unit (DMU) engines, and lifetimes of 30,000–40,000 h would be needed for fuel cells to be competitive with diesel locomotive engines.
Heat dissipation is a particularly important issue. Although fuel cell powertrains produce similar levels of waste heat as internal combustion engines, 80 percent of the heat generated must be dissipated via the radiator. For diesel engines, waste heat dissipation is split between the radiator and the exhaust stack.
Currently, the most powerful fuel cells for transport applications have an output of approximately 200 kW. Rail applications will need higher power outputs if traction power requirements are to be met. This is likely to be possible in future years, but there may still be issues regarding the ability to package such a fuel cell powertrain in a rail vehicle.
It was suggested, however, that SOFC APUs using diesel fuel could be used on diesel locomotives and DMUs and could provide some real air quality and noise benefits in the near term and such demonstrations should be pursued. Such APUs could also be used for maintenance vehicles for enclosed spaces, signaling applications, track circuits/point machines at semirural locations, and point heating.
One rail fuel cell application that may warrant consideration with the current state of fuel cell development is diesel fueled SOFCs for APUs.

92
A.12 Diesel Combustion Technology
A.12.1 Advanced Combustion Concepts
Low-Temperature Combustion The recent evolution of the diesel combustion process has been significant. Advanced combustion strategies currently under development attempt to decrease the combustion temperature to lower NOx emissions and, in some cases, PM emissions. These approaches carry numerous names such as HCCI and PCCI that may or may not accurately reflect the combustion process.
HCCI was one of the early diesel combustion concepts that differed from the conventional diesel process to attract attention. As the name implies, a homogeneous premixed mixture is formed much the same way as in a spark ignition engine. This can be achieved either by injecting fuel into the intake port or directly into the cylinder early enough to allow complete mixing of air and fuel. The charge then ignites as it is heated during the compression stroke.
To address many of the challenges, such as limited load range, controllability, and knocking posed by HCCI, several other concepts have evolved from this homogeneous charge approach, and in many cases, charge stratification was introduced. Although these concepts carry names such as Toyota’s UNIBUS and Nissan’s MK concepts, there has unfortunately been a tendency to refer to them generally as HCCI. This is slowly evolving, and LTC is slowly gaining acceptance as a general term for these advanced combustion concepts.
Early work with HCCI demonstrated that engine-out NOx and PM emissions could be lowered to approximately 1–10 percent of current diesel engine technology through changes to the combustion process, possibly eliminating the need for aftertreatment devices to meet regulated emission limits.
One characteristic that HCCI and other LTC concepts share is that either all or a significant amount of fuel is premixed with air before ignition occurs. The combustion rate of such premixed LTC concepts is controlled by the chemical kinetics of the mixture. This greatly complicates the control of the combustion process as well as making it sensitive to fuel properties. Many premixed LTC concepts benefit from low cetane number fuels.
Premixing of air and fuel can also be a major factor in conventional diesel combustion. However, in conventional diesel combustion, the rate of combustion is mainly determined by the rate of mixing of air and unburned/partially burned fuel. The conventional diesel combustion process is thus often referred to as mixing-controlled combustion. This mixing control characteristic greatly simplifies the control of the heat release process.
Although much of the work with LTC has focused on premixed LTC concepts, it has been demonstrated that mixing-controlled diesel combustion can also be adopted to produce NOx emissions in the 0.2 g/kWh range—comparable to those achievable with premixed LTC concepts (Haugen, 2004; Gray, 2005; Eismark, 2006; EPA 2008). Although such mixing-controlled approaches could be considered to be conventional diesel combustion, they do require lower combustion temperatures to control NOx and unconventional hardware to manage PM emissions. These engines require such features as advanced fuel injection systems that provide injection pressures as high as 3,000 bar and air management systems producing levels of boost pressures that require multistage turbochargers. Such approaches could be referred to as mixing-controlled

93
LTC concepts. Unlike premixed LTC approaches, it has been shown that mixing-controlled LTC can operate over the entire speed and load range of the engine (Haugen, 2004; Gray, 2005; EPA, 2008).
Although significant resources have been spent studying HCCI and other LTC concepts, successful commercial applications to date have been limited. Although Toyota’s UNIBUS (Hasegawa, 2003) and Nissan’s MK (Kimura, 1999) concepts have been introduced commercially in some markets, they are unable to operate over the entire engine speed and load range, conventional diesel combustion must still be used at high load conditions, and aftertreatment devices are still needed.
In the North American market, Navistar (2007) and Cummins (2007) both announced that they would be able to meet 2010 U.S. EPA on-road heavy-duty emission requirements with engines that use only PM aftertreatment and no NOx aftertreatment. Although the actual approach is not entirely clear, the 2010 engines by Navistar—currently certified to NOx levels of 0.5 g/bhp-h and below without NOx aftertreatment—do require reductions in combustion temperatures and are believed to use some form of premixed LTC approach. Fuel economy is one of the key issues in developing LTC engines. Cummins (2008) eventually decided to change its technology approach for 2010 and introduced urea-SCR Nox aftertreatment in all engines to improve fuel efficiency.
Regardless of whether an LTC approach is mixing-controlled or premixed, large amounts of cooled EGR are almost always required to keep combustion temperatures low enough to achieve low NOx and/or to control heat release rates and combustion phasing.
Miller Cycle The Miller cycle (or the Miller valve timing) involves an early closure of the inlet valve. It produces reduced compression temperatures, which in turn result in NOx emission reductions. This strategy also allows for increased engine efficiency, but careful optimization of the combustion process is required to control such issues as pumping losses, transient load acceptance, or increased engine noise.
The Miller cycle is believed to have been used in the Caterpillar ACERT truck engines introduced in 2003. It is also an NOx control option for four-stroke medium-speed diesel engines, including locomotive engines (Nerheim, 2007).
The use of a highly efficient (often a two-stage) turbocharger is required with the Miller cycle to ensure that sufficient airflow is retained in spite of the reduced intake period. PM emissions tend to be increased with Miller timing, necessitating the use of injection equipment with significantly increased pressures as well as improved turbochargers.
Because of engine performance issues, it may not be possible to use the Miller cycle throughout the entire engine map. If the use of the Miller cycle is limited to some engine operating conditions, an intake valve actuator may be necessary to switch between the Miller and the conventional diesel cycle valve timing.
A.12.2 Medium-Speed Engine Trends The application of advanced combustion strategies to medium-speed diesels requires the use of cooled EGR. Cooled EGR with a conventional diesel combustion system, such as used in most

94
2007 and later North American heavy-duty trucks, has seen little or no commercial application in medium-speed diesel engines. Challenges to applying EGR to commercial medium-speed locomotive engines include the following:
• Cooling system demands. Substantial increase in the cooling system demands are difficult to accommodate in already crowded locomotives.
• Lube oil compatibility. A new lube oil formulation would likely be needed to accommodate increased soot levels.
• Possible fouling concerns. Locomotive test cycles have a high weighting for idle operation where application of EGR can be challenging.
• Fuel sulfur levels. Corrosion of engine components by sulfuric acid may be a concern.
Notwithstanding the above issues, in-cylinder NOx control (as opposed to urea-SCR aftertreatment) has been chosen by most locomotive engine manufacturers for meeting the Tier 3/Stage IIIB emission standards.
The new MTU Series 4000 R44 engine, meeting EU Stage IIIB emissions, will cover a power range from 1,000 to 3,000 kW for the line-haul and switcher applications (Wintruff, 2010). In 2012, 12V and 16V versions will be available, to be followed by 8V and 20V engines. The Stage IIIB NOx limit (NOx + HC = 4 g/kWh) is achieved without aftertreatment, whereas a DPF will be used to meet the 0.025 g/kWh PM limit. The engine features cooled EGR, Miller valve timing, the MTU two-stage turbocharger, and the LEAD common rail injection system by L’Orange. The DPF system—which includes an upstream oxidation catalyst (DOC) and a catalyzed DPF—has been designed to rely on passive NO2-based regeneration starting from 260°C. At light loads, the exhaust temperature is increased through an active engine management strategy. The engine matches the fuel consumption of its R43 predecessor.
GETS presented a Tier 3 version of its Evolution locomotive engine (Blythe, 2010). The Tier 3 (2012) PM standard of 0.10 g/bhp-h requires a nearly 50-percent PM emission reduction from the Tier 2 levels. This has been achieved by reduced lube oil consumption (by 50 percent), the use of reduced ash lube oil, and replacement of the legacy unit pump injection system by a 180-megapascal Bosch common rail system with multiple injection capabilities. A moderate level of Miller valve timing was adopted to maintain the fuel consumption of Tier 2 engines.
Although no reports are published on emission systems in Tier 4 locomotives, both GETS and EMD are believed to favor in-cylinder NOx control, without the use of urea-SCR.
A growing number of medium-speed engines (both diesel and natural gas) in marine and power generation applications are also adopting the Miller cycle in conjunction with two-stage turbocharging. The first commercial application of two-stage turbocharging on a medium-speed diesel engine is the Wärtsilä W20V32 engine (Raikio, 2010), featuring a twin low-pressure/twin high-pressure turbo configuration that can provide a pressure ratio of approximately 8.
A.12.3 Existing Rail Engines Emission reductions and efficiency improvements can be achieved in existing locomotive engines through repowering with more advanced combustion and control technologies. An example repower product is the 710ECOTM launched in 2007 by EMD.

95
The 710ECO repower engine is emission certified to the EPA Tier 2 locomotive standards. It is designed for use with 2,000- to 3,150-horsepower switching locomotives and features a 90-percent parts commonality with existing EMD 710 engine equipped locomotives. The engine is electronically controlled and includes an integrated automatic engine start stop system for idle reduction.
According to the manufacturer, the 710ECO repower product provides a 25-percent reduction in fuel consumption and greater than 50-percent lube oil savings.
A.13 Energy Recovery Technologies
A.13.1 Hybrid Locomotives Hybrid locomotives allow the recovery of some of the braking energy, which can be used to provide power resulting in improved fuel economy and reduced GHG emissions. Figure A14 is a schematic of a hybrid locomotive (GE, 2007).
Figure A14. Hybrid Locomotive
In a conventional locomotive, energy generated by the traction motors (A in Figure A14) during braking is dissipated entirely as heat through resistor grids (B). In contrast, in a hybrid locomotive, some of that energy is captured in a series of rechargeable batteries (C). The captured energy can then be used to provide power in one of three ways:
• Hybrid power mode—In combination with diesel-electric power (provided by the engine (D) and the electric system (E)) to consistently deliver the required horsepower
• Power boost—As an addition to full diesel-electric power for quick acceleration from a full stop
• Primary power—As the primary power source (full battery power) One of the major challenges in the development of hybrid technologies is the high-energy storage requirement and the battery technology.

96
GETS is developing the 4,400-horsepower Evolution Hybrid diesel-electric locomotive, with a target fuel consumption reduction of 10 percent compared with conventional locomotives. GETS unveiled a prototype unit during its Ecomagination Event in Los Angeles in 2007. The hybrid locomotive used a new sodium-based (lead-free) type of rechargeable batteries.
A.13.2 Waste Heat Recovery Future powertrains will likely include exhaust gas energy recovery systems. In the diesel engine, the exhaust gas enthalpy represents a significant fraction of the chemical energy of the fuel—up to over 30 percent—which is one of the most significant sources of thermal efficiency loss. Exhaust heat recovery systems may range from simple heat exchangers to such technologies as turbocompounding, thermodynamic cycles converting heat into work (e.g., Rankine), or thermoelectrics.
There are two major types of turbocompounding systems: (1) mechanical turbocompounding and (2) electric turbocompounding.
The mechanical turbocompounding system, schematically represented in Figure A15, is based on the premise that exhaust from the first turbine (T1) has enough energy left to turn a second turbine wheel (T2). This excess energy is high enough to give T2 power that is adequate to lend the crankshaft some assistance. This additional power provided to the crankshaft by T2 is considered part of the exhaust heat recovery and results in real fuel economy benefits. For the same power output, BSFC for a turbo-compounded engine is lower than a turbocharged-intercooled engine.
Figure A15. Schematic Representation of Turbocompounding
Turbocompounding systems have been commercialized by Garrett. Sweden’s Scania claims the credit for the first truck engine with turbocompounding, which entered series production in 1991 (turbocompounding was later dropped, then re-introduced in 2001, and also used in the first Scania Euro IV truck engine in 2004). Mechanical turbocompounding is generally more suitable for large engine installations such as power generation or bulk fluid pumping stations. The

97
reason for this is the expense involved in gearing down from high turbine rotational speeds to crankshaft speeds.
Exhaust gas heat energy can be also recovered in the form of electrical power through the addition of an alternator/motor unit to the turbocharger, Figure A16 (Algrain, 2003). In this configuration, referred to as electric turbocompounding, the mechanical connection between the turbine and the crankshaft and the second turbine itself is eliminated.
Figure A16. Electric Turbocompounding
A high-speed electrical generator is incorporated directly into the turbocharger assembly and placed on a common shaft between the compressor and the turbine. The generated electricity can be used to run engine auxiliaries (starter, oil pump, water pump, air compressor, HVAC, etc.), thus providing a fuel economy benefit. Ongoing development projects for heavy-duty engines target a fuel economy improvement on the order of 5 percent (Algrain, 2003). Electric turbocompounding also provides high flexibility in turbocharger control, including the capability to operate the generator as a motor to provide assistance to the turbocharger at moments when increased boost is required (i.e., to operate the device as a supercharger).
Thermodynamic cycles are being developed where a number of waste heat streams can be recovered in the form of electricity. Engine thermal efficiency improvement of about 10 percent, from approximately 42 to 46 percent, is typically targeted.
Figure A17 illustrates the waste heat recovery concept by Cummins (Nelson, 2007). A 10-percent thermal efficiency improvement is targeted—6 percent from EGR energy, 2-percent exhaust energy, 2-percent electric accessories—through the implementation of the organic Rankine cycle. In this thermodynamic cycle, a working liquid is evaporated in a boiler using the heat being recovered to drive a turbine. The energy is ultimately recovered as electricity via a generator.

98
Figure A17. Cummins Waste Heat Recovery Concept
Thermoelectrics are solid-state devices capable of converting heat into electricity for such uses as cooling, heating, and power generation (Majumdar, 2004). Research aimed at using thermoelectric generators to produce electricity from waste exhaust heat in light- and heavy-duty diesel engines has been sponsored by the U.S. DOE (Fairbanks, 2007).
Thermoelectric modules can be operated as (1) refrigeration units and/or (2) power generation units, as Figure A18 illustrates. In the refrigeration mode, the thermoelectric unit consumes electricity to provide cooling. In the power generation mode, the unit generates electricity from heat energy.

99
Figure A18. Thermoelectric Modules
Significant progress in the efficiency of thermoelectrics has been achieved in the recent years. Although today’s materials still have insufficient efficiency for exhaust gas recovery, thermoelectrics have been commercially used since 2000 for climate control seat systems (heating/cooling) in high-end automobiles. The goal of the DOE-sponsored research is to introduce thermoelectric exhaust heat recovery systems in production personal vehicles in the 2011–2014 timeframe to improve fuel economy by a nominal 10 percent. The technology may be nearing commercialization, because BMW intends to introduce thermoelectric generators in the 5 Series cars in 2010–2014 (Fairbanks, 2008). The system currently tested by BMW can generate 750 watts during highway driving, equivalent to an 8.3-percent improvement in fuel economy and about half of that amount in city driving.
Because of their ability to operate without moving parts and without a refrigerant gas or a heating medium, thermoelectrics are potentially attractive for a wide range of future applications. The U.S. Navy conducted thermoelectric air-conditioning tests on a submarine (USS Dolphin AGSS 555) for silent running. Assuming further technology progress, long-term applications could include thermoelectric generators replacing propulsion engines or a plug-in solid-state hybrid with multifuel capability.
A.13.3 Flywheel Energy Storage The application of flywheel energy storage has been considered for a variety of rail applications.
In one study examining the practicality and viability of a flywheel energy storage system to a switching locomotive, it was noted that the attractiveness of the system is very dependent on the operational scenario of the locomotive. On the basis of the operation of locomotives at different flat yards and a large amount of data on the operating environment of switching locomotives, it was concluded that a boxcar was required to carry the energy storage unit, because no room existed on the locomotive. No difference in locomotive energy consumption was apparent with the flywheel energy storage system for a typical flat-yard operation. The duty cycle of the

100
switching operations did not provide enough energy recovery. Brake maintenance savings, although significant, were not sufficient to give an attractive return on investment (Cook, 1979).
The case of a Class I railroad operating over a major mountain pass with a long downhill, and thus a much better duty cycle for dynamic braking, has also been examined (Painter, 2006). On the basis of simulation results, despite the fuel savings and emission reductions, no economic incentive was sufficient to warrant implementation of dynamic brake energy recovery at 2005 fuel prices. When environmental benefits were weighed, a likely return on investment of approximately 5 years was found.
Another application for which flywheel energy storage has been studied is for high-speed locomotives using gas turbines. Although gas turbines offer a significant weight savings for high-speed locomotives, these turbines have two important disadvantages compared with diesel engines: (1) gas turbines produce a greater number of thermal cycles than diesel engines, which negatively affects maintenance requirements and (2) the energy efficiency of gas turbines is lower. A flywheel energy storage system would provide some load leveling to potentially reduce the number of thermal cycles and recover braking energy to increase overall energy efficiency. Although work on this project seems to be continuing at the University of Texas Center for Electromechanics, a Transportation Review Board Committee Review of Federal Railroad Administration Research, Development, and Demonstration Programs recommended in 2003 that Federal funding for this program be phased out, because of technical, schedule, and budget risks (Thompson, 2003).

101
A.14 Bibliography
Ahlvik, P. 2003. “Natural Gas,” Revision 2003.05, DieselNet.com.
Algrain, M., and Hopmann, U. August 2003. “Diesel Engine Waste Heat Recovery Utilizing Electric Turbocompound Technology,” U.S. DOE, 9th Diesel Engine Emissions Reduction Conference (DEER), Newport, RI.
Alleman, T. L., and McCormick, R. L. 2007. “2006 B100 Quality Survey Results Milestone Report,” National Renewable Energy Laboratory, Golden, CO, USA, NREL/TP-540-41549.
Alleman, T. L., and McCormick, R. L. 2008. “Results of the 2007 B100 Quality Survey,” Technical Report NREL/TP-540-42787.
Arons, S. M., et al. 2007. “A Low-Carbon Fuel Standard for California, Part 1: Technical Analysis,” California Air Resources Board, Sacramento, CA, USA.
Association of American Railroads. 2011. Railroad Facts. Washington, DC.
Barnes, D. L. 2007. “Fuelcell Prototype Locomotive,” Final Technical Report, U.S. Department of Energy, Office of Energy Efficiency and Renewable Energy, Golden Field Office, Hydrogen, Fuel Cells, and Infrastructure Technologies Program, Grant Award No. DE-FG36-05GO85049.
Bartunek, B., and Hilger, U. 2000. “Direct Induction Natural Gas (DING): A Diesel-Derived Combustion System for Low Emissions and High Fuel Economy,” SAE Technical Paper 2000-01-2827.
Basu, A., et al. 1995 July. “Dimethyl Ether: Amoco’s New Clean Diesel Option,” U.S. DOE, 1st Diesel Engine Emissions Reduction Workshop (DEER), San Diego, CA.
Besee, G. B., and Fay, J. P. 1997. “Compatibility of Elastomers and Metals in Biodiesel Fuel Blends,” SAE Technical Paper 971690.
Blythe, N. X., and Glenn, W. D. 2010. “Design and Development of the GE Tier 3 Locomotive Diesel Engine,” CIMAC Congress 2010, Bergen, Norway, Paper #43.
BNSF. 2007. “An Evaluation of Natural Gas-Fueled Locomotives,” a report by BNSF Railway Company, Union Pacific Railroad Company, The Association of American Railroads, and California Environmental Associates.
Bourn, G. D. 2003. LPG Switcher Locomotive Technical Feasibility Study, Final Report, Project No. 03-06234, Southwest Research Institute, San Antonio, TX.
Bourn, G. D. 2004. Army Fuel Cell Locomotive—Trade Study of Using JP-8 and LNG as Base Fuel, Final Report, Project No. 03-07556, Southwest Research Institute, San Antonio, TX.
BQ-9000. 2008. “The National Biodiesel Accreditation Program,” Jefferson City, MO, United States, Internet, accessed July 21, 2008.
Brewer, M. 2007. “A Winter Experience with FAME in Sweden,” Biodiesel Technical Workshop, Chicago, October 17–18, 2007.
102
Butterworth, S., et al. 2005. “Feasibility Study into the Use of Hydrogen Fuel,” Railway Safety and Standards Board T531-Final Report.
Caprotti, R., et al. 2007. “RME behaviour in current and future diesel fuel FIEs,” SAE Technical Paper 2007-01-3982.
Caton, J. A., and Hsu, B. D. 1994. General electric coal-fueled diesel engine program (1982–1993): a technical review. Journal of Engineering for Gas Turbines and Power, Transaction of ASME, 116(4),749–757.
Cheng, A. S., Upatnieks, A., and Mueller, C. J. 2006. “Investigation of the impact of biodiesel fuelling on NOx emissions using an optical direct injection diesel engine. International Journal of Engine Research, 7, 297–318.
Clark, R. H., 2002. “An Evaluation of Shell Gas-to-Liquids Diesels -- The Environmental Benefits,” U.S. DOE, 8th Diesel Emissions Reduction Conference (DEER), San Diego, CA.
Cook, L. M., et al. 1979. “Flywheel energy storage switcher. Volume 1. Study summary and detailed description of analysis. Final report.” U.S. Department of Energy, Report PB-80-121478.
Corkwell, K. C., Jackson, M. M., and Daly, D. T. 2003. “Review of Exhaust Emissions of Compression Ignition Engines Operating on E Diesel Blends,” SAE Technical Paper 2003-01-3283.
Crutzen, P. J., et al. 2007. N2O release from agro-biofuel production negates global warming reduction by replacing fossil fuels. Atmos. Chem. Phys. Discuss. 7, 11191–11205.
Cui, L., An, L., and Jiang, H. 2008. A novel process for preparation of an ultra-clean superfine coal–oil slurry. Fuel, 87, 2296–2303.
Cummins. 2007. “Cummins Announces Right Technology for 2010,” Cummins press release, September 2007.
Cummins. 2008. “Cummins Announces Recent Technology Development Achieves Significant Fuel Economy Benefits,” Cummins press release, August 13, 2008.
Delucchi, M. A. 2003 Dec. “A Lifecycle Emissions Model (LEM): Lifecycle Emissions From Transportation Fuels, Motor Vehicles, Transportation Modes, Electricity Use, Heating and Cooking Fuels, And Materials,” University of California-Davis, Report UCD-ITS-RR-03-17.
DOE. 2008. “Hydrogen, Fuel Cells and Infrastructure Technologies Program: Technologies,” U.S. Department of Energy.
DuPont. 2000. “Robust Summary For Dimethyl Ether,” DuPont submission to the U.S. EPA, October 11, 2000.
Dunn, R. 2003. “Biodiesel as a locomotive fuel in Canada,” Transport Canada Report TP 14106E.
ECI. 2008. Energy Conversions, Inc., Tacoma, WA, USA, Web site.
Eckerle, W. 2007. “Innovative Approaches to Improving Engine Efficiency,” U.S. DOE, 13th Diesel Engine-Efficiency and Emissions Research (DEER) Conference, Detroit, MI.

103
Edwards, D. 2007. “Cleaner power for a greener future,” Workshop on Railways and Biofuel, July 5, 2007, UIC Paris.
EIA. 2011. “World Shale Gas Resources: An Initial Assessment of 14 Regions Outside the United States,” U.S. Energy Information Administration, April 2011.
Eismark, E. 2006. “Method for controlling a combustion process in a combustion engine,” European Patent Application EP 1 674 690 A1.
EPA. 2002. “A Comprehensive Analysis of Biodiesel Impacts on Exhaust Emissions,” U.S. Environmental Protection Agency, Draft Technical Report EPA420-P-02-001.
EPA. 2008. U.S. Environmental Protection Agency, web site, accessed July 30, 2008.
Fairbanks, J. W. 2007. “Vehicular Thermoelectrics Applications Overview,” U.S. DOE, 13th Diesel Engine-Efficiency and Emissions Research (DEER) Conference, Detroit, MI.
Fairbanks, J. W. 2008. “Potential of Thermoelectrics for Vehicular Applications,” U.S. DOE, 14th Diesel Engine-Efficiency and Emissions Research (DEER) Conference, Detroit, MI.
Fang, H., et al. 2003. “Interaction Between Fuel Additive and Oil Contaminant: (II) Its Impact on Fuel Stability and Filter Plugging Mechanism,” SAE Technical Paper 2003-01-3140.
Flynn P. L., Hsu, B. D., and Leonard, G .L. 1990. Coal fueled diesel engine progress at GE transportation systems. Internal Combustion Engine Division, ASME, 12, 1–9.
Fritz, S. G. 1997. “The Potential for LNG as a Railroad Fuel in the U.S.,” ASME Paper ICE-Vol. 28-2, Spring Technical Conference, pp. 1–8.
Fritz, S. G. 2004. “Evaluation of Biodiesel Fuel in an EMD GP38-2 Locomotive,” NREL Report NREL/SR-510-33416.
GE. 2006. “Position statement regarding the use of alternative fuels in GE locomotives,” GE Transportation, Erie, PA, August 8, 2006.
GE. 2007. “Hybrid: On the main line,” GE Transportation, Presentation to California Air Resources Board, November 28, 2007.
Gray, C.L., and Haugen, D. J. 2005. “Low emission diesel combustion system with low charge-air oxygen concentration levels and high fuel injection pressures,” U.S. Patent 6,857,263.
Hansen, J. B., and Mikkelsen, S. E. 2001 July. “DME as a Transportation Fuel,” Danish Road Safety & Transport Agency (Færdselsstyrelsen).
Hansen, A. C., Zhang, Q., and Lyne, P. W. L. 2005. Ethanol-diesel fuel blends—a review. Bioresource Technology, 96, 277–285.
Hasegawa, R., and Yanagihara, H. 2003. “HCCI combustion in DI diesel engine,” SAE Technical Paper 2003-01-0745.
Haugen, D. 2004. “A Path to More Sustainable Transportation,” 2004 Diesel Engine Emissions Reduction (DEER) Conference, U.S. Department of Energy.
Hofeldt, D. L. 1993 “Alternative Fuel Technologies for Heavy Duty Vehicles: Performance, Emissions, Economics, Safety, and Development Status,” SAE Technical Paper 930731.
Howarth, R. W., et al. 2011. “Methane and the greenhouse-gas footprint of natural gas from shale

104
formations,” Climatic Change 106:679-690, DOI 10.1007/s10584-011-0061-5.
Howell, S. 1997. “U.S. Biodiesel Standards—An Update of Current Activities,” SAE Technical Paper 971687.
IEA. 2004. “Biofuels for Transport - An International Perspective,” International Energy Agency, Paris, France.
IEA. 2011. “Are We Entering a Golden Age of Gas?” Special Report, International Energy Agency, Paris, France.
Ishida, M., et al. 2007. “Combustion Characteristics of HCCI Engines Fuelled with Natural Gas and DME,” CIMAC Paper No 171.
ISO 8178 International Standard for Emission Test Cycles http://www.dieselnet.com/standards/cycles/iso8178.html. Johnson, E., and Heinen, R. 2007. The race is on. Chemistry and Industry, April 23, 2007.
Jones, L. E., et al. 1985. Fuel cell alternative for locomotive propulsion. International Journal of Hydrogen Energy, 10(7, 8), 505–516.
Joseph, P. M. 2007. Paradoxical ozone associations could be due to methyl nitrite from combustion of methyl ethers or esters in engine fuels. Environment International, 33, 1090–1106.
Kimura, S., et al. 1999. “New combustion concept for ultra-clean and high-efficiency small DI diesel engines.” SAE Technical Paper 1999-01-3681.
Krahl, J. 2006. “Influence of the Phosphorus Content in Rapeseed Oil Methyl Esters During a 1000 Hours Endurance Test on the Function of a SCR-system Measured by Exhaust Gas Emissions and Health Effects,” SAE Technical Paper 2006-01-3282.
Kuronen, M., et al. 2007. “Hydrotreated Vegetable Oil as a Fuel for Heavy Duty Diesel Engines,” SAE Technical Paper 2007-01-4031.
Lawson, P. 2008 Feb. 26. “Approaching the next regulatory level,” Faster Freight Cleaner Air - 2008, Los Angeles Convention Center.
Lustig, D. 2008 May. BNSF experiments with fuel cells. TRAINS, pg. 20.
Majewski, W. A., and Jääskeläinen, H. 2008. Biodiesel—Mono Alkyl Esters, Revision 2008.01c, DieselNet.com.
Majumdar, A. 2004. “Challenges and Opportunities in Thermoelectric Energy Conversion,” 2004 Diesel Engine Emissions Reduction (DEER) Conference, U.S. Department of Energy.
Masuda, K., et al. 2007. “Development of 1.25MW DME Diesel Engine,” CIMAC Paper No. 96.
McCormick, R. L. 2002. “Renewable Diesel Fuels: Status of Technology and R&D Needs,” U.S. DOE, 8th Diesel Emissions Reduction Conference (DEER), San Diego, CA.
McCormick, R. L., et al. 2005. “Survey of the quality and stability of biodiesel and biodiesel blends in the United States in 2004,” National Renewable Energy Laboratory, Golden, Colorado, NREL/TP-540-38836.
McCormick, R. L., et al. 2006. “Effects of Biodiesel Blends on Vehicle Emissions,” National Renewable Energy Laboratory, Golden, CO, USA, Report NREL/MP-540-40554.

105
Miller, A. R., Peters, J., Smith, B. E., and Velev, O. A. 2006. Analysis of fuel cell hybrid locomotives. Journal of Power Sources, 157, 855–861.
Miller A. R., et al. 2007a. System design of a large fuel cell hybrid locomotive. Journal of Power Sources, 173, 935–942.
Miller, A. R. 2007b Sept. 13–14. “Fuel cell hybrid switcher locomotive: Engineering design,” Locomotive Maintenance Officers Association, Proceedings of the 69th Annual Meeting, Chicago IL, pg. 120–138.
Navistar. 2007. “International Trucks and Engines Will Comply with 2010 Emissions Standards without SCR,” Navistar press release, October 31, 2007.
Nellen, C., and Boulouchos, K. 2000. “Natural Gas Engines for Cogeneration: Highest Efficiency and Near-Zero-Emissions through Turbocharging, EGR and 3-Way Catalytic Converter,” SAE Technical Paper 2000-01-2825.
Nelson, C. 2007 Aug. “Cummins Waste Heat Recovery,” U.S. DOE, 13th Diesel Engine-Efficiency and Emissions Research (DEER) Conference, Detroit, MI.
Nerheim, L. M., et al. 2007. “Development of the DLoco DL240ZJ engine to comply with current and future emissions regulations,” CIMAC Congress 2007, Vienna, Paper #53.
Norton, P., et al. 1998. “Emissions from Trucks using Fischer-Tropsch Diesel Fuel,” SAE Technical Paper 982526.
NRC. 2010. “Report on the Technical Feasibility of Integrating an Annual Average 2% Renewable Diesel in the Canadian Distillate Pool by 2011,” Natural Resources Canada, October 2010.
NY. 2011. “A.G. Schneiderman to sue federal government today for failure to study “fracking,” State of New York Attorney General, Press release, May 31, 2011.
Nydick, S. E., Porchet, F., and Steiger, H. A. 1987. Continued development of a coal/water slurry-fired slow-speed diesel engine: a review of recent test results. Journal of Engineering for Gas Turbines and Power, Transactions of ASME, 109(4), 465–476.
Nylund, N. O., and Lawson, A. 2000. “Exhaust Emissions from Natural Gas Vehicles: Issues related to engine performance, exhaust emissions and environmental impacts,” International Association of Natural Gas Vehicles (IANGV), Auckland, New Zealand.
Nylund, N. O., et al. 2002. “Pathways for Natural Gas into Advanced Vehicles,” International Association of Natural Gas Vehicles (IANGV), Auckland, New Zealand.
Ohno, Y., et al. 2001. “Slurry Phase Synthesis and Utilization of Dimethyl Ether,” NKK Technical Review No.85, pg. 23-28.
Ohno, Y., and Omiya, M. 2003 Nov. “Coal Conversion into Dimethyl Ether as an Innovative Clean Fuel,” 12th International Conference on Coal Science, Cairns, Queensland, Australia.
Ogawa, T., et al. 2003. “Direct Dimethyl Ether Synthesis,” Journal of Natural Gas Chemistry, 12(2003), pg. 219-227.
Ouellette, P., et al. 1998. “Performance and Emissions of a Two-Stroke Engine Fueled Using High-Pressure Direct Injection of Natural Gas,” SAE Technical Paper 981160.

106
Ouellette, P., et al. 2002 Aug. 27. “Gaseous and liquid fuel injection valve with concentric needles,” U.S. Patent #6,439,192 (Westport).
Owens, E. C. 1994. “Natural Gas Fuelling,” Southwest Research Institute, San Antonio, TX, Report No. 03-5285.
Painter, T. D. 2006. “Recovering Railroad Diesel-Electric Locomotive Dynamic Brake Energy,” M.Sc. Thesis, Graduate College, University of Illinois at Urbana-Champaign.
Payne, M., and Taghizadeh, A. 1999. Review of Natural Gas Fuelled Locomotive Technology, Transport Canada, Report #TP 13470E.
Pimentel, D., and Patzek, T. W. 2005. Ethanol production using corn, switchgrass, and wood; biodiesel production using soybean and sunflower. Natural Resources Research, 14, 65–76.
Raikio, T., et al. 2010. “Design and first application of a 2-stage turbocharging system for a medium-speed diesel engine,” CIMAC Congress 2010, Bergen, Norway, Paper #82.
Reijnders, L., and Huijbregts, M. A. J. 2008. Palm oil and the emission of carbon-based greenhouse gases. Journal of Cleaner Production, 16(4), 477–482.
RENEW. 2008. A tentative fuel specification of engine grade DME, Renewable fuels for advanced powertrains (RENEW), European Commission, Sixth Framework Programme, SES6-CT-2003-502705.
Reuters. 2011. “Climate impact threatens biodiesel future in EU,” Reuters, July 8, 2011.
Roberson, J. A. 2006 July. Climbing the Andes with dual-fuel power, Railway Gazette International.
RSSB Energy. 2011 April. A guide to RSSB research in Energy. London, UK.
Ryan, T. 2008. U.S. DOE, 14th Diesel Engine-Efficiency and Emissions Research (DEER) Conference, Dearborn, MI, August 4–7, 2008.
Scott, D. S., Rogner, H. H., and Scott, M.B. 1993. Fuel cell locomotives in Canada. International Journal of Hydrogen Energy, 18(3), 253–263.
Selvidge, C., et al. 2007 October 5–11. “Effect of biodiesel impurities on filterability and phase separation from biodiesel and biodiesel blends,” IASH 2007, 10th International Conference on Stability, Handling and Use of Liquid Fuels, Tucson, AZ.
Sharp, C. A., Howell, S. A., and Jobe, J. 2000. “The Effect of Biodiesel Fuels on Transient Emissions from Modern Diesel Engines-Part I: Regulated Emissions and Performance,” SAE Technical Paper 2000-01-1967.
Sheehan, J., et al. 1998. “An Overview of Biodiesel and Petroleum Diesel Life Cycles,” National Renewable Energy Laboratory, Golden, CO, NREL/TP-580-24772.
Shimizu, A., et al. 2007. “Development of large scale DME diesel power generation plant, NOx reduction technology by large amount of EGR and DME use SCR,” CIMAC Paper No. 62.
Simmons Boardman. 1997. The Car and Locomotive Cyclopedia. Omaha, NE.
Skinner, I., et al. 2007. “Railways and biofuel First UIC report.”

107
Stanton, D. 2008. “Advanced Combustion Technology to Enable High Efficiency Clean Combustion,” U.S. DOE, 14th Diesel Engine-Efficiency and Emissions Research (DEER) Conference, Detroit, MI, August 2008.
Steinberg, B. A., and Scott, D. S. 1984. Hydrogen vs. diesel fuelled locomotives: a techno-economic appraisal. International Journal of Hydrogen Energy, 9(1,2), 101–107.
Su, F., et al. 2005 Sept. 11–14. “Evaluation of biodiesel blends in a single-cylinder medium-speed diesel engine,” Proceedings of ICEF2005 ASME Internal Combustion Engine Division, Fall Technical Conference, Ottawa, Canada. ICEF2005-1266.
SwRI. 1961. Proceedings of Conference on Combustion of Propane in Railroad Diesels, Southwest Research Institute, San Antonio, TX, December 8, 1961.
Sze, C., et al. 2007. “Impact of test cycle and biodiesel concentration on emissions,” SAE Technical Paper 2007-01-4040.
Thompson, L.S. 2003. Letter to The Honorable Allan Rutter, Administrator, Federal Railroad Administration.
UIC. 2007 July. Railways and Biofuel. First UIC Report produced in cooperation with Association of Train Operating Companies (ATOC).
Umierski, M., and Stommel, P. 2000. “Fuel Efficient Natural Gas Engine with Common-Rail Micro-Pilot Injection,” SAE Technical Paper 2000-01-3080.
Verbeek, R., and Vander Weide, J. V. 1997. “Global Assessment of Dimethyl-Ether: Comparison with Other Fuels,” SAE Technical Paper 971607.
Waterland, L. R., Venkatesh, S., and Unnash, S. 2003. “Safety and Performance Assessment of Ethanol/Diesel Blends (E-Diesel),” Report NREL/SR-540-34817, National Renewable Energy Laboratory, Golden, CO.
Watt, G. M. 2001. “Natural Gas Vehicle Transit Bus Fleets: The Current International Experience,” International Association of Natural Gas Vehicles (IANGV), Auckland, New Zealand.
Weyandt, N., and Janssens, M. L. 2003 June. “Flame Arrester Evaluation for E-Diesel Fuel Tanks,” National Renewable Energy Laboratory, Golden, CO, Report NREL/SR-540-34301.
Williams, A., et al. 2011. “Impact of Biodiesel Impurities on the Performance and Durability of DOC, DPF and SCR Technologies,” SAE Technical Paper 2011-01-1136.
Wintruff, I., et al. 2010. “The next generation of MTU series 4000 rail engines to comply with EUIIIB emission legislation,” CIMAC Congress, Bergen, Norway, Paper #211.
Xin, Z., et al. 1998. “A Study of Natural Gas Fuelling of Locomotive Engines,” SAE Technical Paper 981396.
Zeman, N. 2006 Oct. Remember December. Biodiesel Magazine.

108
Appendix B. International — Europe
Excerpts from this section are from the Rail Safety Standards Board (RSSB) research and development program report “RSSB Energy April 2011” ( and from a joint study by International Union of Railways (UIC) and Association of Train Operating Companies (ATOC) titled “First UIC Report on Railways and Biofuels.” An overview of initiatives and strategies for using alternatives to fossil-fuel-based rail technology in Europe is presented.
B.1 RSSB RSSB facilitates the resolution of difficult cross-industry issues and builds consensus. This section provides a guide into energy research conducted by RSSB. The program is funded by the Department for Transport in the UK and aims to assist the industry and its stakeholder in achieving key objectives. The primary area of engineering research in Europe is on further electrification. However, the purpose of this FRA study is to research energy sources other than electrification. The following projects provide a synopsis of ongoing and some concluded RSSB research activities (RSSB Energy Report April 2011).
“Feasibility study into the use of hydrogen fuel (T515)—This project studied the viability of hydrogen as a fuel for the rail industry. It explored the technology, how it can be developed, and whether or not there is a business case for development. The research led to the formation of a Future Fuels Technology Group (FFTG) to consider the carious fuels and storage technologies that might be applied to the UK railway over a 30-year horizon. The findings of the research project indicated that hydrogen is a conceptually viable fuel and informed research project T711 Hydrogen fuel cell trial.
Hydrogen fuel cell trial (T722)—The purpose of this research was to develop the UK position with respect to hydrogen fuelled rail vehicles. The FFTG was keen to participate in the European project to develop a hydrogen powered train, however, the development funding priorities in Europe were focused on automotive applications and it was not practical for UK to develop a project alone.
Regenerative braking on AC and DC electrified lines (T580)—The project investigated the extent to which regenerative braking is used currently on the UK mainline railways. It examined the scope for further use and established the anticipated scale of energy efficiency and CO2 emissions benefits which might be realized over future years.
The research demonstrated the benefits of regenerative braking and is being used by the industry-wide Regenerative Braking Steering Group, which is actively championing the introduction of regenerative braking. On the AC railway, the majority of vehicles that can use regenerative braking are now doing so, and on the DC railway, steady progress is being made toward full implementation.
Investigation into the use of sulfur-free diesel fuel on UK railways (T536)—This project investigated the impact of moving to the use of reduced sulphur

109
diesel by performing trials on representative train fleets. This research project has provide an insight into understanding the problems associated with introducing a new type of diesel fuel onto the UK railway and has also informed the train operating companies’ strategic decision regarding which new diesel fuels can be safely implemented.
Further research has been undertaken in research project T697 Investigation into use the use of biodiesel fuel on the UK railway, which also looked at alternative diesel fuels, particular biodiesel, for use on the UK railway.
Investigation into the use of biodiesel fuel on UK railways (T697)—This research project has assessed the impact of biodiesel in the diesel engines of railway locomotives and DMUs in the UK. From this research project, the Diesel Metering Group has concluded the following are two important barriers to biodiesel usage:
• The sustainability of the fuel source is a political/ environmental decision and requires verification of the source of the fuel.
• Economics, not engineering, is the concern for biodiesel blends up to B20. ATOC and key members of the Diesel Metering Group will continue to promote the findings and results of the research to other industry members including presentations at sustainability conferences and engineering forums. Already the emerging findings have been used by ATOC in support of discussions with HM Treasury and more specifically by parties involved in franchise bidding as the tradeoff between cost of operating and other government targets. The Department for Transport has started consultation on the Renewable Transport Fuel Obligation.
Review of potential rail vehicle fuels and “energy carriers” (T721)—This project considered the potential of more radical and long-term solutions for energy such as biogas, methanol, ammonia, battery technology, and flywheels. This project was initiated by the FFTG to establish what potential there was for the application of novel fuels in the rail industry. The report did not find any further suitable fuels that had not been previously identified, and it concluded that improved diesel fuels, whether from mineral or bio sources, were among the most suitable for rail application. Of the novel fuels, only hydrogen could be considered to be a contender in the future.”
B.2 UIC and ATOC—Railway and Biofuels Because of the initiatives currently under investigation in Europe, as they relate to the uses of biofuels, and the conclusions from RSSB that improved diesel fuels were among the most suitable for rail from other potential fuel sources, an overview of information as it relates to biofuels are included in this section. According to the report, “First UIC Report on Railways and Biofuels” (July 2007),
“…biofuels have the potential to reduce emissions of GHG, gases that contribute to climate change. They can also increase energy security, reducing a country’s reliance on imported energy products.

110
The principal forms of biofuel are biodiesel, which can be blended with, or replace diesel, and bioethanol, which can be blended with, or replace petrol. In the EU, an indicative target of 5.75 percent (by energy content), set in the Biofuels Directive (2003/30/EC), is stimulating the increased use of biofuels, in particular biodiesel, for EU road transport. There are also discussions on increasing the proportion beyond 5.75 percent to say 10-20 percent (Source: EC 8/9 March Presidency conclusions).
Many countries are responding to this directive by introducing tax incentives and obligations on manufacturers to produce biofuel and add it to conventional transport fuels. Outside of the EU, many countries are taking similar policy actions. There is also the possibility of using one of the so-called flexible mechanisms of the Kyoto Protocol, the Clean Development Mechanism, to stimulate the development of biofuel technology in developing countries.
Railways already have an environmental advantage over other forms of air and road transport as seen in various reports (Source: ATOC Baseline Statement, April 2007). This is diminishing, due to rapid progress in the other transport sectors. Biofuels offer an opportunity to help rail to maintain or improve its green credentials and promote modal shift, as an environment conscious society may choose rail over other modes of transport. This should increase rail usage and indeed, transport market share. Biofuels can also provide an alternative source of transportable energy, which may help to increase the security of supply for the rail industry.
There is also scope for potential cost savings if sufficient tax exemptions and incentives could be applied by Member States to railways. Finally, these items all contribute to meeting the requirement of the EEA TERM paper: “a shift to more environmentally friendly modes should be sought where appropriate,” and the Kyoto Protocol which pledges to: “cut EU-15 GHG emissions by an 8 percent reduction on 1990 levels by 2012.” Although there are significant advantages to be realized, there are important issues and risks that need to be considered and addressed such as the following:
Supply—The Biofuels Directive has resulted in an increased use of biofuel from virtually nothing in the 1990s to an estimated 3500 million litres in 2005. Planned or recent increases in production capacity suggest that earlier predictions of biodiesel supply in 2012 of 14,000 million litres (Source: IEA 2004) might be an underestimate.
Demand—Compliance with the EU target on increasing transport biofuel using biodiesel alone will potentially require 16,000 million liters by 2012. However, given the likely increased demand resulting from the various policy initiatives around the world, the railway sector is likely to face global competition for biodiesel. Biomass to liquid or second generation biofuel will offer a higher yield and can help increase supply to help meet the rising demand. However, the processes and technologies for the production of second generation biodiesel are still being developed and are uncertain.

111
Costs—Currently, biodiesel costs significantly more than diesel and this is a disincentive to using biodiesel. The costs and prices are volatile, being related to the biofuel source and supply and demand market forces.
• Governments could subsidize biodiesel production, but a complication is that currently it is difficult to guarantee that the fuel being subsidized is not coming from an unsustainable source, which may be worse in terms of GHG emissions than the substituted fossil fuels.
• A worldwide/EU (See Section A.3) certification scheme could give governments the confidence to offer discounts to reduce costs to the end user. A potential alternative is for governments to legislate and consumers pick up the costs.
Technical—Initial engine results from desk top analysis and test bench work shows that biodiesel is feasible for use in railway traction unit engines in lower percentage blends. However, there are potential disadvantages such as increased fuel consumption and decreased power. Blends in excess of B30 (30 percent biodiesel content) may increase maintenance costs, although it is expected that second generation biofuels will be of a higher specification and may prove to be better than fossil fuels.
• Biodiesel can influence the emissions from engines, and this needs to be considered in light of EU Directive on NonRoad Mobile Machinery stage IIIB or equal legislation. For example, using biodiesel is likely to increase NOx emissions, but lower PM emissions, even if tests results vary from railway to railway.
• In Germany and the UK, some road transport is currently using biodiesel blends of up to 50 percent. To meet the expected rail demand, MTU have already developed an engine that is capable of running on B100, (Source: MTU, section 6.2) and undoubtedly, others are under development.
Global Sustainability—Information in this report shows biofuels are able to reduce GHG emissions by up to 80 percent considering the whole life cycle of production, transport and combustion. But there are still some uncertainties about the sustainability of biofuels, and it is still difficult for customers to be sure of the environmental credentials of the biofuels they are buying and to be certain of the benefits they provide. With certification schemes in place that are supported by the nongovernment organizations, it would be possible for customers to be confident that their biodiesel was produced in a sustainable manner and know what GHG savings the fuel actually delivers.”
B.3 Emissions Standards in Europe
B.3.1 Background Emission standards for railway locomotives have been established by the UIC, a Paris-based association of European railway companies. UIC issues technical leaflets on railway equipment and components, which are termed “standards” and are binding to member railways. Emission

112
standards for rail locomotives are specified in UIC Leaflet 624, published in April 2002 and titled “Exhaust emission tests for diesel traction engines.”
The UIC emission standards apply to diesel engines for railway traction, with the exception of engines for special locomotives (e.g., refinery or mine locomotives) and traction engines with an output of less than 100 kW. The standards apply to all new engines used in new vehicles or for repowering of existing locomotives.
B.3.2 Emission Standards Table B1 lists the UIC locomotive emission standards. The test method is ISO 8178, cycle F.
Table B1. UIC Locomotive Emission Standards
Stage Date Power, P Speed, n CO HC NOx PM Smoke
kW rpm g/kWh BSN
UIC I up to 2002.12.31 3 0.8 12 - 1.6-2.5a
UIC II 2003.1.1
P ≤ 560 2.5 0.6 6.0 0.25
P > 560 n > 1000 3 0.8 9.5 0.25b
n ≤ 1000 3 0.8 9.9 0.25b
a - Bosch smoke number (BSN) = 1.6 for engines with an air throughput of above 1 kg/s; BSN = 2.5 for engines below 0.2 kg/s; linear BSN interpolation applies between these two values.
b - For engines above 2200 kW, a PM emission of 0.5 g/kWh is accepted on an exceptional basis until 2004.12.31.
The UIC Stage III standards are harmonized with the EU Stage IIIA standards for nonroad engines [Directive 97/68/EC]. ISO 8178 International Standard (http://www.dieselnet.com/standards/cycles/iso8178.html) The ISO 8178 is an international standard designed for a number of nonroad engine applications. It is used for emission certification and/or type approval in many countries worldwide, including the United States, EU, and Japan. Depending on the legislation, the cycle can be defined by reference to the ISO 8178 standard, or else by specifying a test cycle equivalent to ISO 8178 in the national legislation (as is the case with the U.S. EPA regulations).
The ISO 8178 is actually a collection of many steady-state test cycles (types C1, C2, D1, etc.) designed for different classes of engines and equipment. Each of these cycles represents a sequence of several steady-state modes with different weighting factors.
The ISO 8178 test cycle—or its 8-mode schedule C1 in particular—can be also referred to as the “NonRoad Steady Cycle.”

113
Appendix C. U.S. National Fire Protection Association Diamond Placard Designations
Health (Blue) Flammability (Red) 0 Poses no health hazard, no precautions
necessary (e.g., water) 0 Will not burn (e.g., argon)
1 Exposure would cause irritation with only minor residual injury (e.g., acetone) 1 Must be heated before ignition can occur (e.g.,
mineral oil). Flash point over 93°C (200°F)
2 Intense or continued but not chronic exposure could cause temporary incapacitation or possible residual injury (e.g., ethyl ether)
2
Must be moderately heated or exposed to relatively high ambient temperature before ignition can occur (e.g., diesel fuel). Flash point between 38°C (100°F) and 93°C (200°F)
3 Short exposure could cause serious temporary or moderate residual injury (e.g., chlorine gas)
3
Liquids and solids that can be ignited under almost all ambient temperature conditions (e.g., gasoline). Liquids having a Flash point below 23°C (73°F) and having a Boiling point at or above 38°C (100°F) or having a Flash point between 23°C (73°F) and 38°C (100°F)
4 Very short exposure could cause death or major residual injury (e.g., hydrogen cyanide, phosphine, carbon monoxide)
4
Will rapidly or completely vaporize at normal atmospheric pressure and temperature, or is readily dispersed in air and will burn readily (e.g., propane, hydrogen). Flash point below 23°C (73°F) Instability/Reactivity (Yellow) Special (White)
Instability/Reactivity (Yellow) Special (White)
0 Normally stable, even under fire exposure conditions, and is not reactive with water (e.g., helium)
0 The white "special notice" area can contain several symbols. The following symbols are defined by the NFPA 704 standard.
1 Normally stable, but can become unstable at elevated temperatures and pressures (e.g., propane)
2
Undergoes violent chemical change at elevated temperatures and pressures, reacts violently with water, or may form explosive mixtures with water (e.g., phosphorus, potassium, sodium)
OX
Oxidizer (e.g., potassium perchlorate, ammonium nitrate, hydrogen peroxide)
3
Capable of detonation or explosive decomposition but requires a strong initiating source, must be heated under confinement before initiation, reacts explosively with water, or will detonate if severely shocked (e.g., ammonium nitrate)
W Reacts with water in an unusual or dangerous manner (e.g., cesium, sodium, sulfuric acid)
4
Readily capable of detonation or explosive decomposition at normal temperatures and pressures (e.g., nitroglycerine, Trinitrotoluene)

114
Abbreviations and Acronyms
AFC alkaline fuel cell
APU auxiliary power unit
ASTM American Society for Testing and Materials
ATOC Association of Train Operating Companies
bcm billion cubic meters
BNSF BNSF Railway
BSFC brake-specific fuel consumption
Btu British thermal unit
CAFE Corporate Average Fuel Economy
CBA Cost-benefit analysis
CFR U.S. Code of Federal Regulations
CHP combined heat and power
CNG compressed natural gas
CO2 carbon dioxide
CO carbon monoxide
CTL coal-to-liquid
CSFT cold soak filtration test
DDC Detroit Diesel Corporation
DFNG dual fuel natural gas
DGE diesel gallon equivalent
DING direct injection natural gas
DME dimethyl ether
DMFC direct methanol fuel cell
DMU diesel multiple unit
DOD U.S. Department of Defense
DOE U.S. Department of Energy
DOT Department of Transportation
DPF diesel particulate filter
ECI Energy Conversions, Inc.
EGR exhaust gas recirculation

115
EIA Energy Information Administration
EMD Electro-Motive Diesel, Inc.
EN European Committee for Standardization
EPA U.S. Environmental Protection Agency
EPAct Energy Policy Act of 1992
EU European Union
FAME fatty-acid methyl ester
FEL family emission limit
FFTG Future Fuels Technology Group
FIE fuel injection equipment
FRA Federal Railroad Administration
FT Fischer-Tropsch
FTC U.S. Federal Trade Commission
FTP Federal Test Procedure
g/bhp-h grams per brake horsepower hour
GenSet generator set technology = sets of engines turning a generator
GETS General Electric Transportation Systems
GHG greenhouse gases
g/km grams per kilometer
GREET Greenhouse gases, Regulated Emissions, and Energy use in Transportation
GTL gas-to-liquid
H2 hydrogen
HC hydrocarbons
HCCI homogeneous charge compression ignition
HIRC Hydrogen Innovation Research Center
h hour
HVO hydrotreated vegetable oil
IANGV International Association for Natural Gas Vehicles
IEA International Energy Agency
IRS U.S. Internal Revenue Service
kg kilogram
kWh kilowatt hour
LaCHIP late-cycle high injection pressure technology
116
LEM Life-cyle Emission Model
LNG liquefied natural gas
LPG liquefied petroleum gas (propane)
LTC low temperature combustion
MCFC molten carbonate fuel cell
MJ megajoule
MK Morrison Knudsen Corporation
mm millimeter
MMbd million barrels per day
MOU memorandum of understanding
MPa megapascal
NBB National Biodiesel Board
NFPA National Fire Protection Association
NMHC nonmethane hydrocarbon
NOx oxides of nitrogen
NREL National Renewable Energy Laboratory
OEM original equipment manufacturer
PAFC phosphoric acid fuel cell
PCCI premixed charge compression ignition
PEMFC polymer electrolyte or proton exchange membrane fuel cell
PING pilot injection of diesel fuel and premixing natural gas
PM particulate matter
PM FEL particulate matter family emission limit
ppm part per million
psi pound per square inch
RFS Renewable Fuel Standard
RSSB Rail Safety Standards Board
SCR selective catalytic reduction
SING spark ignited natural gas
SOFC solid oxide fuel cell
SPFC solid polymer fuel cells
SwRI Southwest Research Institute
t/a metric tons per annum

117
THC total hydrocarbons
TRB Transportation Research Board
TTCI Transportation Technology Center, Inc.
TWC Three way catalysts
UIC Union Internationale des Chemins de fer/International Union of Railways
UK United Kingdom
UP Union Pacific Railroad Company