Cost & Performance Requirements for Flexible Advanced ...
99
Cost & Performance Requirements for Flexible Advanced Nuclear Plants in Future U.S. Power Markets
Transcript of Cost & Performance Requirements for Flexible Advanced ...

Cost amp Performance Requirements for Flexible Advanced Nuclear Plants in Future US Power Markets
Acknowledgements
lucidcatalystcom
Cost and Performance Requirements for Flexible Advanced Nuclear Plants in Future US Power Markets
Report for the ORNL Resource team supporting ARPA-Ersquos MEITNER Program July 2020
Authors Eric Ingersoll Kirsty Gogan John Herter Andrew FossWith assistance from Jane Pickering and Romana Vysatova
We are grateful to our reviewers and advisorsSteve Brick Senior Fellow The Chicago Council on Global AffairsCharles Forsberg Principal Research Scientist and Executive Director MIT Nuclear Fuel Cycle ProjectJesse Jenkins Assistant Professor Princeton UniversityAbram Klein Managing Partner Appian Way Energy PartnersMike Middleton Practice Manager Nuclear UK Energy Systems CatapultDavid Mohler Former CTO and SVP Duke Energy Former Deputy Assistant Secretary for Clean Coal and Carbon Management Office of Fossil Energy US Department of EnergyBruce Phillips Director The NorthBridge GroupDave Rogers Former Head of Global Project Development amp Finance Practice Latham amp Watkins LLP
Copyright copy 2020 LucidCatalyst LLC This work was funded through a DoEARPA-E award under ARPA-Ersquos MEITNER Program The Government has certain rights in the work including the right to reproduce the work prepare derivative works distribute copies to the public and perform publicly and display publicly by or on behalf of the Government All remaining rights reserved No part of this report may be reproduced in any form or by any electronic or mechanical means including information storage and retrieval systems without permission in writing from LucidCatalyst except by a reviewer who may quote brief passages in a review
Cost amp Performance Requirements for Flexible Advanced Nuclear Plants in Future US Power Markets
Contents 1 Executive Summary 1
2 Introduction 6
3 Revenue Generation in Deregulated and Regulated Power Markets 9
4 Current Revenue Potential and VRE Effects on Nuclear Projects 14
5 PLEXOS and Financial Modeling Methodology and Assumptions 19
6 Illustrative Cash Flow Analysis 31
7 Plexos Modeling Results for 2034 36
8 Additional Modeling Analyses 45
9 Conclusions 53
A Appendix ndash Historical Revenues by Market Product in Select ISOs 57
B Appendix ndash New Market Mechanisms that Capture the Value of Resource Flexibility 61
C Appendix ndash Desirable Performance Attributes and Market Participation Requirements 65
D Appendix ndash Alternative Ways of Providing System Flexibility 75
E Appendix ndash High-Level Cost Analysis of Energy Storage System 79
F Appendix ndash High-Level Estimate of Non-Nuclear Island Costs 81
Endnotes 84
Cost amp Performance Requirements for Flexible Advanced Nuclear Plants in Future US Power Markets
Executive Summary Table 1 Maximum Allowable CapEx by ISO and Scenario ($kW) 2
Executive Summary Table 2 Annual Average Market Prices for ISO-NE PJM MISO and CAISO 3
Table 1 Relevance of Available Revenue Streams for Flexible Advanced Reactors 9
Table 2 Average Wholesale Prices by Revenue Stream in Select ISOs (2009 ndash 2018) 14
Table 3 Modeled Scenarios in PLEXOS 22
Table 4 Total Capacity and Power Demand in the Four Markets in 2018 and 2034 24
Table 5 Assumed Capacity and Operating Specifications for Illustrative Advanced Nuclear Plant 26
Table 6 Assumed Specifications for Energy Storage 27
Table 7 OampM and Fuel Assumptions 29
Table 8 PLEXOS Input and Result Categories 30
Table 9 Energy Revenue for Each Plant Configuration 32
Table 10 Advanced Nuclear Plant OampM Expenditures 33
Table 11 Estimated Annual Plant Revenue Expenditures and Operating Profits for CapEx Recovery ndash Without ESS and With ESS 34
Table 12 Resource Capacity and Generation in ISO-NE for the Modeled Scenarios 36
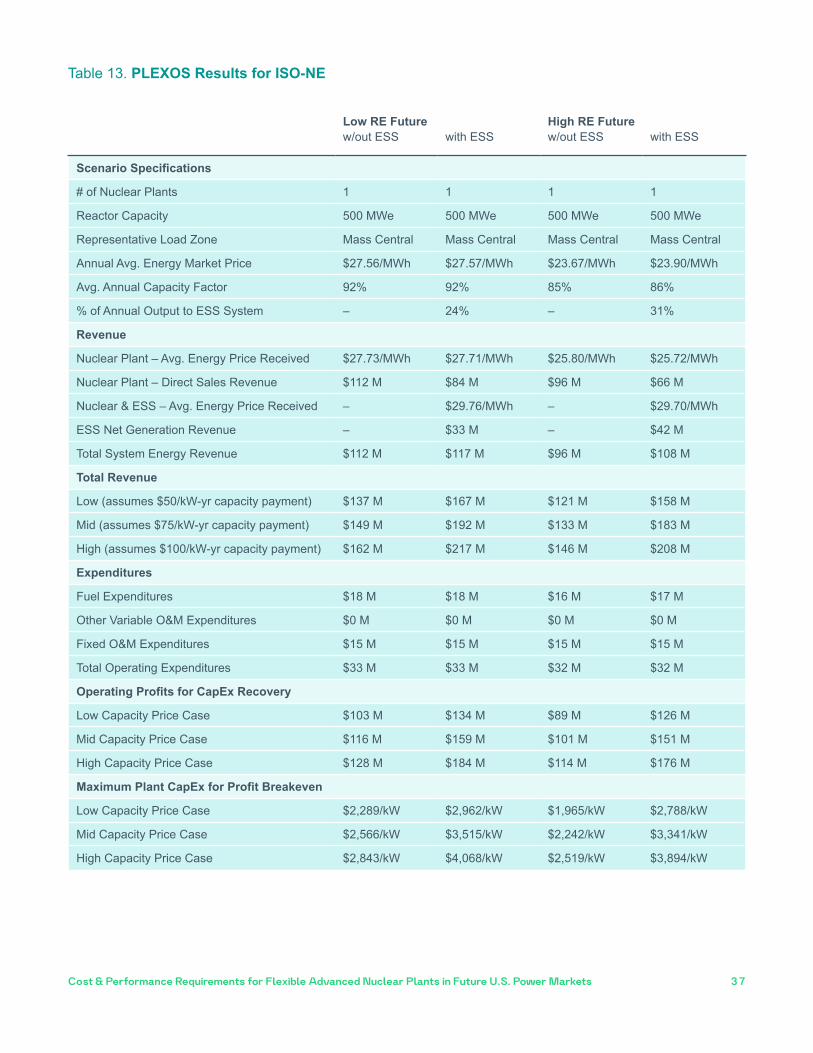
Table 13 PLEXOS Results for ISO-NE 37
Table 14 Resource Capacity and Generation in PJM for the Modeled Scenarios 38
Table 15 PLEXOS Results for PJM 39
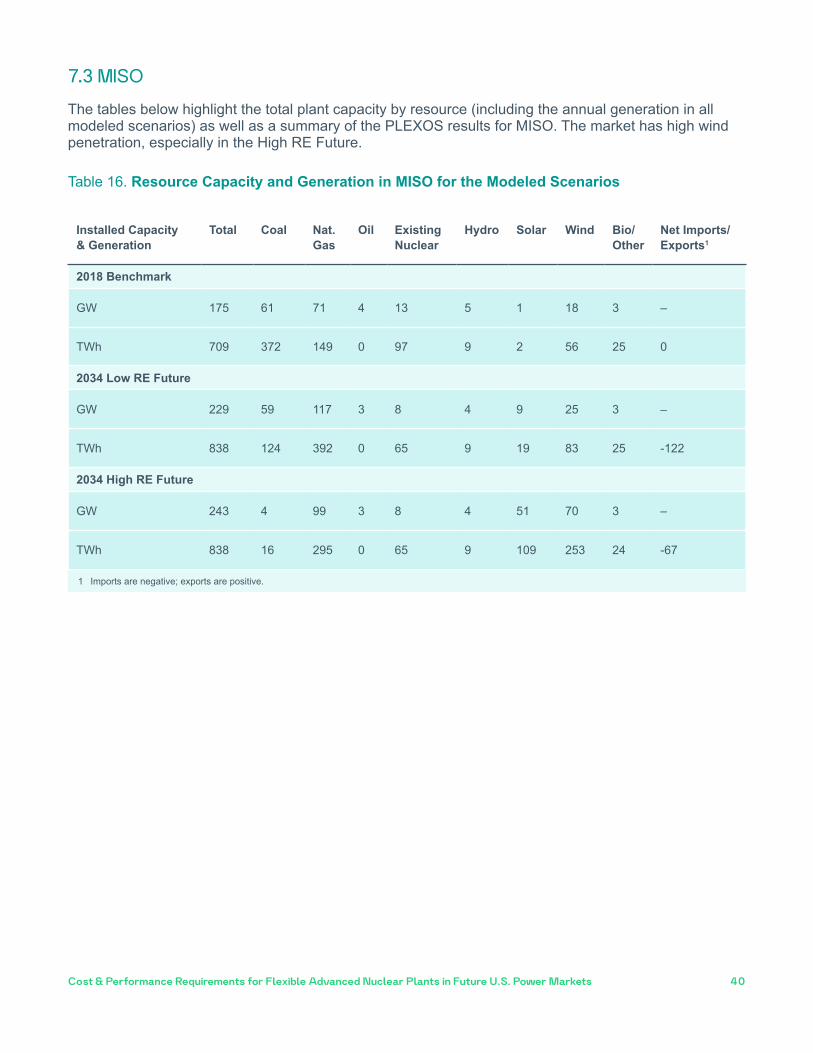
Table 16 Resource Capacity and Generation in MISO for the Modeled Scenarios 40
Table 17 PLEXOS Results for MISO 41
Table 18 Resource Capacity and Generation in CAISO for the Modeled Scenarios 42
Tables
Cost amp Performance Requirements for Flexible Advanced Nuclear Plants in Future US Power Markets
Table 19 PLEXOS results for CAISO 42
Table 20 CO2 Price Scenarios for PJM without Energy Storage 46
Table 21 CO2 Price Scenarios for PJM with Energy Storage 46
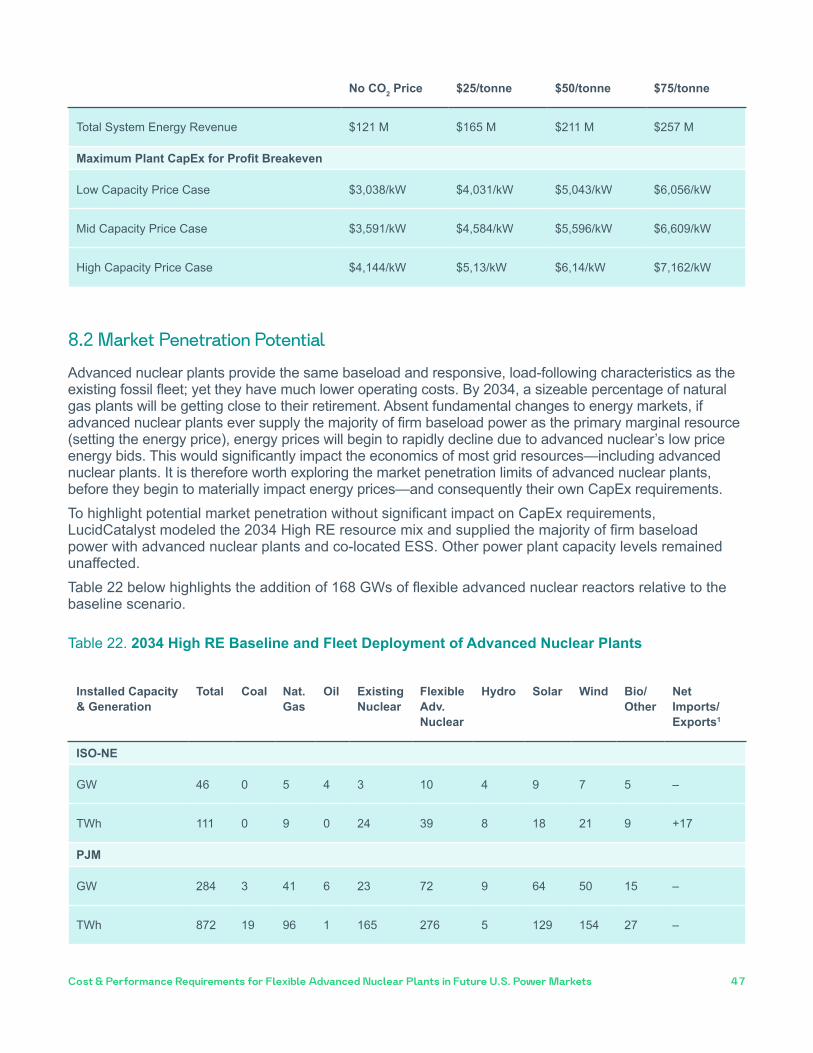
Table 22 2034 High RE Baseline and Fleet Deployment of Advanced Nuclear Plants 47
Table 23 Annual Average Market Prices for ISO-NE PJM MISO and CAISO 48
Table 24 Maximum Allowable CapEx by ISO and Scenario ($kW) with Higher OampM Cost Input 51
Table 25 Summary of Maximum Allowable CapEx ($kW) by ISO Configuration and RE Scenario 53
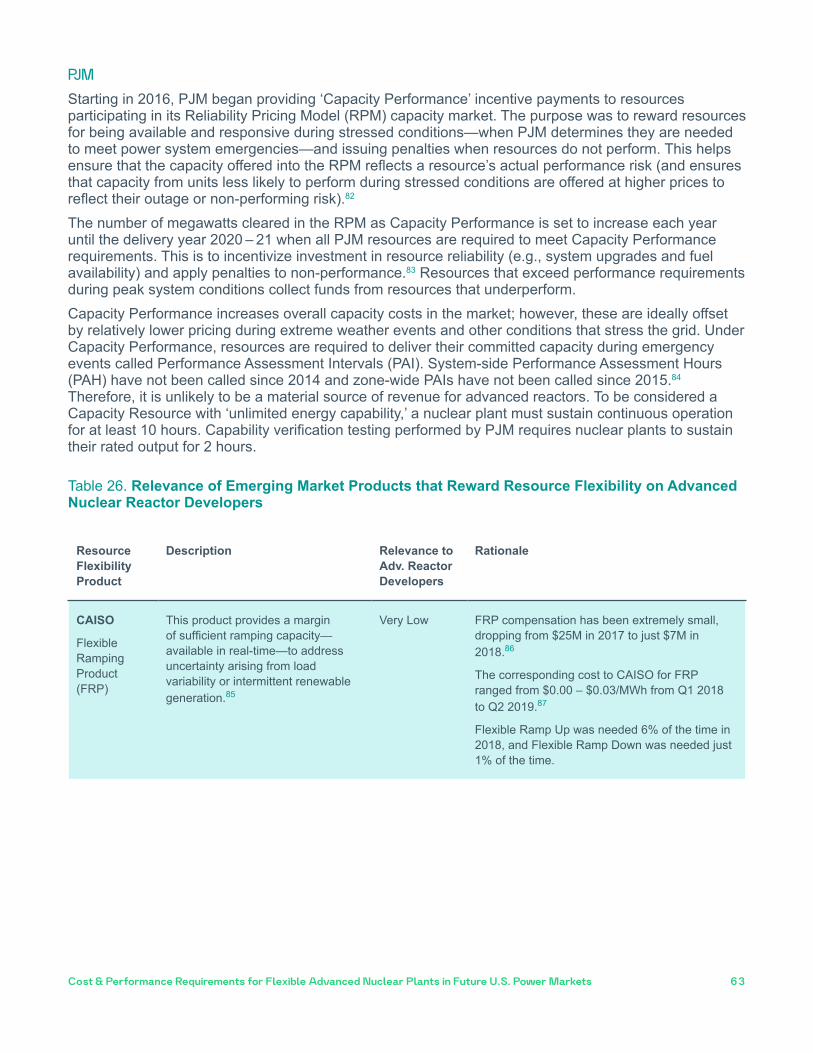
Table 26 Relevance of Emerging Market Products that Reward Resource Flexibility on Advanced Nuclear Reactor Developers 63
Table 27 Selected Performance Criteria for lsquoBest-in-Classrsquo CCGTs 66
Table 28 Minimum Operating Requirements for Large Generators 68
Table 29 Capacity Performance and Base Capacity Resource Minimum Unit-Specific Operating Parameters in PJM (Select Technologies) 70
Table 30 Categories of Must-Offer Obligations for Flexible RA Capacity Resources in CAISO 71
Table 31 FERCrsquos Existing Operating Requirements for RTOISOs to Receive lsquoFast-Startrsquo Pricing 72
Table 32 Summary of Ancillary Service Operating Requirements 73
Table 33 Select Energy Storage Applications 75
Table 34 Non-Nuclear Island Costs for 500 MW Plant without ESS 82
Table 35 Additional Non-Nuclear Costs for a Plant with a 500 MW ESS 83
Cost amp Performance Requirements for Flexible Advanced Nuclear Plants in Future US Power Markets
Figures
Figure 1 Stylized Supply Stack Demand Curve and Price 11
Figure 2 Stylized Power Market Supply Demand and Price with Flexible Advanced Nuclear Plants 12
Figure 3 Market Price Declines When Renewables Dominate the Supply Stack 15
Figure 4 Net Load Curve in CAISO for April 9 2017 16
Figure 5 Wind and Solar ELCC Curves as a Function of Installed Capacity in MISO 17
Figure 6 High-Level Methodology Diagram for Calculating Maximum Allowable CapEx 20
Figure 7 US Regional Power Markets 23
Figure 8 Charging and Discharging Configuration of Advanced Nuclear Plant with Thermal ESS 25
Figure 9 Ranges of Maximum Allowable CapEx ($kW) ndash With ESS and Without ESS 35
Figure 10 Frequency of Different Discharge Durations 44
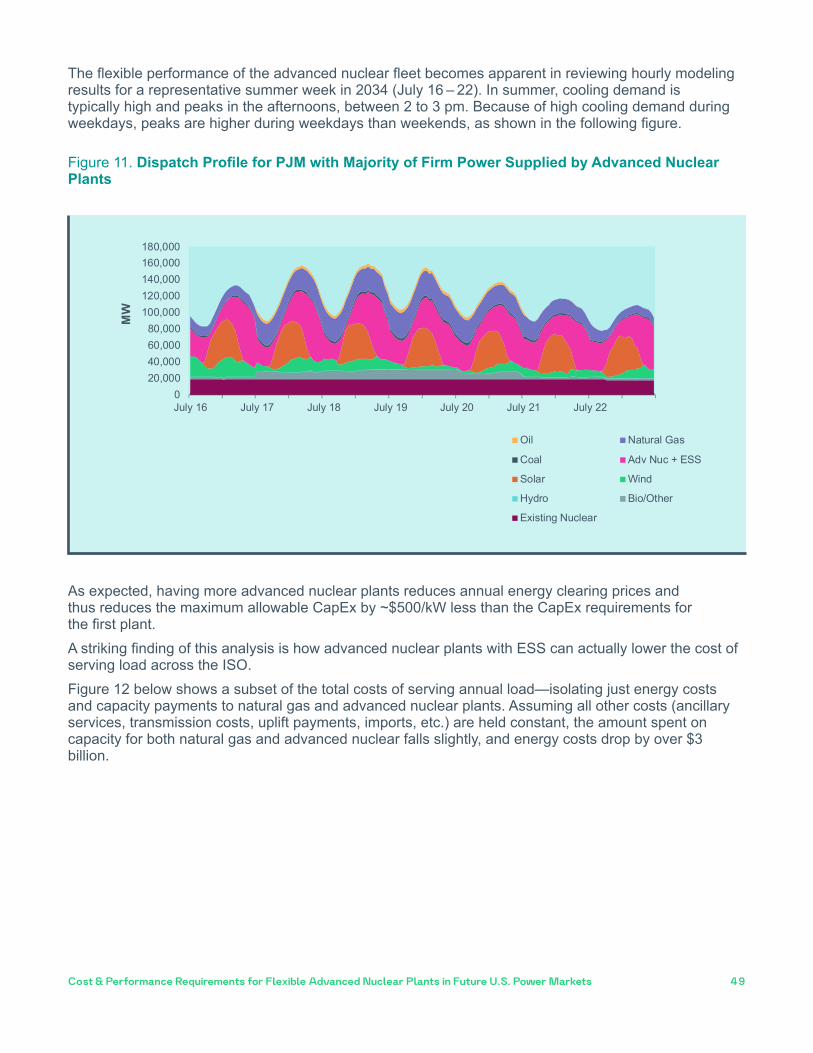
Figure 11 Dispatch Profile for PJM with Majority of Firm Power Supplied by Advanced Nuclear Plants 49
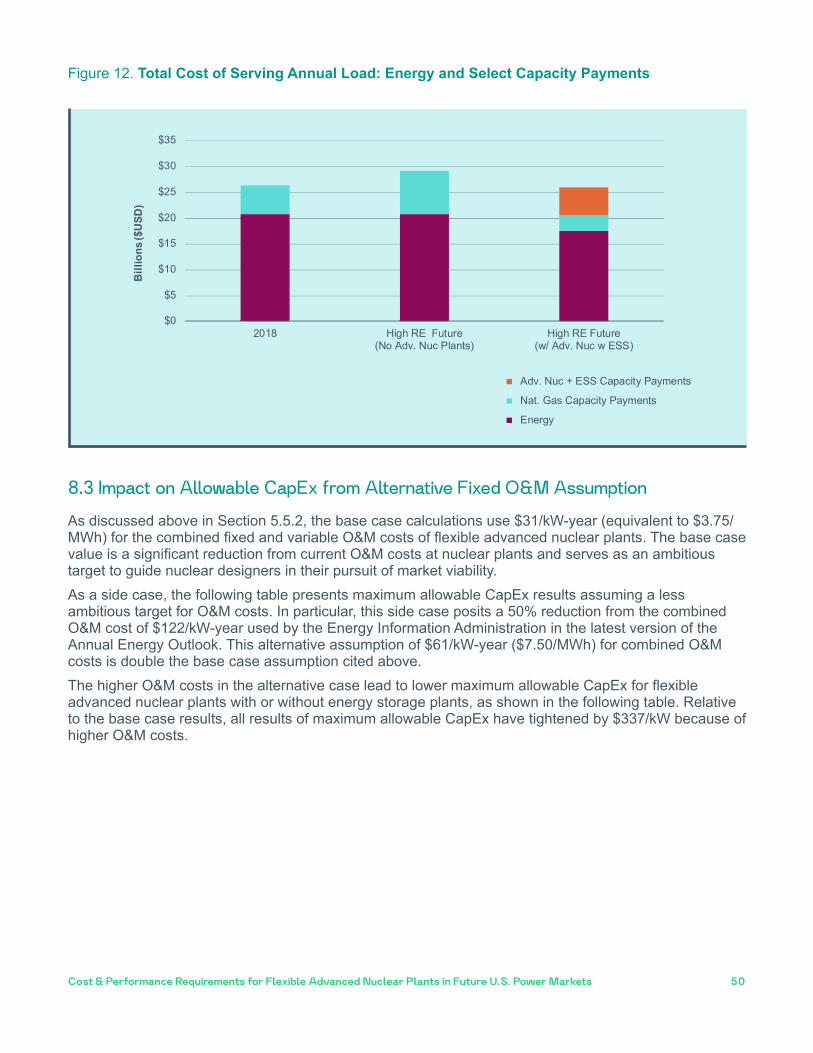
Figure 12 Total Cost of Serving Annual Load Energy and Select Capacity Payments 50
Figure 13 Average Annual Clearing Price by Market Product in ISO-NE ($MWh) 57
Figure 14 Average Price by Component of Wholesale Power Price in PJM ($MWh) 58
Figure 15 Average Price by Component of Wholesale Power Price in MISO ($MWh) 59
Figure 16 Average Price by Component of Wholesale Power Price in CAISO ($MWh) 60
Figure 17 US Annual Energy Storage Deployment Forecast 2012-2024E (MW) 76
Figure 18 Lithium-Ion Battery Price Historical and Forecast 77
Cost amp Performance Requirements for Flexible Advanced Nuclear Plants in Future US Power Markets
List of Abbreviations amp Acronyms
ARPA-E Advanced Research Projects AgencyndashEnergy (US Dept of Energy)CAISO California Independent System OperatorCapEx Capital ExpendituresCCGT Combined Cycle Natural Gas PlantCP Capacity PerformanceDAM Day-Ahead MarketDER Distributed Energy ResourcesDR Demand ResponseESIG Energy Systems Integration Group (Berkeley National Laboratory)ESS Energy Storage SystemFRAC-MOO Flexible Resource Adequacy Criteria and Must-Offer ObligationFRP Flexible Ramping ProductHALU High-Assay Low-Enriched UraniumISO Independent System OperatorISO-NE Independent System Operator New EnglandLC LucidCatalyst LLCLEU Low-Enriched UraniumLSE Load Serving EntityMEITNER Modeling-Enhanced Innovations Trailblazing Nuclear Energy Reinvigoration (a program of ARPA-E)MISO Midcontinent Independent System OperatorNGCC Natural Gas Combined Cycle power plantNOPR Notice of Proposed Rule MakingNREL National Renewable Energy Laboratory (US Dept of Energy)OampM Operations and MaintenancePAI Performance Assessment IntervalPAH Performance Assessment HoursPFP Pay for PerformancePJM Pennsylvania-Jersey-Maryland Power Pool (now larger area ISO)PPA Power Purchase AgreementRCP Ramp Capability ProductReEDS Regional Energy Deployment System (NREL model)RFP Request for ProposalRGGI Regional Greenhouse Gas InitiativeRPM Reliability Pricing ModelRPS Renewable Portfolio Standard RTM Real-Time MarketRTO Regional Transmission OperatorTRISO Tristructural-Isotropic nuclear fuel pelletsUCM Unit Control ModeVRE Variable Renewable EnergyWACC Weighted Average Cost of Capital
Executive Summary
Cost amp Performance Requirements for Flexible Advanced Nuclear Plants in Future US Power Markets 1
This is an unusual time Competitive power markets are experiencing extended periods of very low power prices driven primarily by large supplies of low-cost natural gas At the same growth in demand for electricity has stagnated in many areas of the US driven by deindustrialization and efficiency improvements These power market conditions would normally discourage new entrants However federal incentives state policies and corporate purchases of renewable energy are driving significant deployment of wind and solar further depressing wholesale power prices Remarkably in spite of these conditions there are now more companies developing advanced reactors than at any other time in history However reactor developers today must design for very different future market conditions as described in this report than nuclear plants have seen in the past In this new environment it is critical for advanced reactor design teams to have clear signals from the market about what plants need to cost to be attractive investments and what performance characteristics will create the most value for plant owners Many advanced reactor designs are still in the conceptual design stage and therefore have large scope for reducing capital expenditures (CapEx) through design choices and applying target cost design methods Designers face critical questions such as How flexible should the reactor be How much is that flexibility worth How much effort andor cost should be expended to deliver flexible performance and how much value can that create for the plant ownerThis report summarizes a modeling effort to estimate the highest allowable CapEx for advanced nuclear plants in future power market environments while still achieving a market rate of return for their owners The goal is to define target cost and performance parameters determined by future market conditions to guide design choices and tradeoffs in the early stage of the reactor and power plant development process
1 Executive SummaryAdvanced reactor developers are at various stages of commercializing new products and must design for future market environments that will exist when their plants are available It is therefore critical to have a clear understanding about what plants will need to cost to be attractive investments and what performance characteristics will create the most value for plant owners
This study is among the first to model the substantial contribution that flexible advanced reactors can make towards reliable responsive affordable and clean future energy systems by supplying clean dispatchable generating capacity
Advanced reactor technologies could make a major contribution to lowering the overall system cost while reducing emissions and improving the performance of future energy systems Depending on specific market conditions it may also be beneficial to co-locate thermal energy storage systems (ESS)
Cost amp Performance Requirements for Flexible Advanced Nuclear Plants in Future US Power Markets 2
This work was funded by the US Department of Energyrsquos (DoE) Advanced Research Projects Agency-Energyrsquos (ARPA-E) Modeling-Enhanced Innovations Trailblazing Nuclear Energy Reinvigoration (MEITNER) program thorough a Work Authorization to DoErsquos Oak Ridge National Laboratory The intent was to provide guidance to Design Teams developing advanced reactorsLucidCatalyst performed the grid modeling and underlying financial analyses summarized in this report We used PLEXOSreg electricity production cost modeling software to estimate the revenues earned by a generic high-temperature advanced nuclear plant in deregulated power markets in the mid-2030s These revenues were then analyzed in a power plant financial model to determine the maximum allowable CapEx for which a plant must be delivered to achieve a market rate of returnLucidCatalyst modeled two different future scenarios each containing different resource mixes The first was a baseline lsquolow renewablesrsquo (Low RE) scenario which presumes a continuation (and eventual expiration) of existing renewables policy The second was a lsquohigh renewablesrsquo (High RE) scenario that has the same resource mix as an NREL1 Regional Energy Deployment System (ReEDS) scenario The ReEDS scenario assumes low renewables costs and low natural gas prices (and thus high penetration of both resource types)2 Both scenarios were modeled across the four principal deregulated US power markets for the year 2034 (1) ISO-New England (ISO-NE) (2) the Pennsylvania Jersey Maryland Power Pool (PJM)3 (3) the Midcontinent Independent System Operator (MISO) and (4) the California ISO (CAISO)Assuming capacity payments seen in todayrsquos capacity markets the PLEXOS modeling revealed that the average maximum allowable CapEx across all scenarios is $3234kW This reflects a range from a minimum of $1965kW to a maximum of $4503kW depending on the power market resource mix and capacity payment amount Each modeled scenario also includes a run with a 12-hour integrated thermal energy storage system (ESS) The additional revenues from the lsquonuclear + storagersquo plant justified extra allowable CapEx ranging from $613kW to $1891kW across the modeled scenarios and ISOs The table below provides the maximum allowable CapEx for each modeled scenario and power market
Executive Summary Table 1 Maximum Allowable CapEx by ISO and Scenario ($kW)
Low Renewables wo ESS with ESS
High Renewables wo ESS with ESS
ISO-NE
Low Capacity Price Case ($50kW-yr)
Mid Capacity Price Case ($75kW-yr)
High Capacity Price Case ($100kW-yr)
$2289 $2962
$2566 $3515
$2843 $4068
$1965 $2788
$2242 $3341
$2519 $3894
PJM Low Capacity Price Case ($50kW-yr)
Mid Capacity Price Case ($75kW-yr)
High Capacity Price Case ($100kW-yr)
$2358 $2988
$2634 $3541
$2911 $4095
$2186 $3038
$2462 $3591
$2739 $4144
MISO Low Capacity Price Case ($50kW-yr)
Mid Capacity Price Case ($75kW-yr)
High Capacity Price Case ($100kW-yr)
$2244 $2857
$2521 $3410
$2797 $3963
$2000 $2654
$2276 $3207
$2553 $3760
Cost amp Performance Requirements for Flexible Advanced Nuclear Plants in Future US Power Markets 3
Low Renewables wo ESS with ESS
High Renewables wo ESS with ESS
CAISO Low Capacity Price Case ($50kW-yr)
Mid Capacity Price Case ($75kW-yr)
High Capacity Price Case ($100kW-yr)
$2187 $3397
$2464 $3950
$2740 $4503
$1968 $3306
$2244 $3859
$2521 $4412
LucidCatalyst performed additional sensitivity analyses to assess the impact of other factors on maximum allowable CapEx One scenario included a large fleet of advanced nuclear plants with ESS Due to relatively low operating costs advanced nuclear plants set lower energy clearing prices and thus decreased the allowable CapEx thresholds Importantly the lower average energy prices led to a small decrease in the total cost of energy delivery for the ISO as shown in the following table
Executive Summary Table 2 Annual Average Market Prices for ISO-NE PJM MISO and CAISO
Average Annual Energy Price
ISO-NE High RE Future (Without Flexible Adv Nuclear)
Fleet Deployment of Flexible Adv Nuclear
$2632MWh
$2264MWh
PJM High RE Future (Without Flexible Adv Nuclear)
Fleet Deployment of Flexible Adv Nuclear
$2703MWh
$2267MWh
MISO High RE Future (Without Flexible Adv Nuclear)
Fleet Deployment of Flexible Adv Nuclear
$2613MWh
$2470MWh
CAISO High RE Future (Without Flexible Adv Nuclear)
Fleet Deployment of Flexible Adv Nuclear
$3806MWh
$2961MWh
A second scenario explored the influence of operations and maintenance (OampM) costs on maximum allowable CapEx Each $1kW-year in OampM cost reduction resulted in an increase in the allowable CapEx of approximately $11kW The difference between the low OampM case and the high case ($61kW-year) is $337kW of CapEx To put this in perspective for plants without the ESS this has more impact on CapEx than a reduction of $25kW-year in capacity paymentsmdashfor no additional value (energy or capacity) delivered to the market The generic high-temperature reactor modeled in this study potentially enables cost-effective thermal ESS Conceptually this operates by diverting heat from making steam for the turbine to a thermal store In the same way that LucidCatalyst did not model a specific reactor technology the modeling did not reflect any specific thermal storage technology4 Rather it was intended to determine the allowable cost of and value created by the thermal energy storage systemThe integrated thermal energy storage system always increased the allowable CapEx however the PLEXOS modeling revealed that the scale of such an improvement depended on several factors The plant with ESS stops making steam for the primary turbine during the lowest priced hours storing heat
Cost amp Performance Requirements for Flexible Advanced Nuclear Plants in Future US Power Markets 4
from the reactor in the thermal storage facility and then sells from both the primary and the storage facility turbine during the highest priced hours This allows the 500 MW plant to sell no electricity for 12 hours and produce at 1000 MWe for the other 12 hours while the nuclear island operates continuously at full power The amount of CapEx that can be budgeted for thermal storage depends on the grid resource mix (eg Low RE vs High RE scenario) and importantly the prevailing capacity payment The PLEXOS modeling revealed that co-locating a thermal energy storage system makes economic sense if the system can be built for less than $1126kW on average5 This finding should motivate further research and development in innovative cost-effective thermal energy storage systems for integration with advanced reactors It is also important to note that without the thermal ESS (or an alternative revenue source such as hydrogen production process heat for industry etc) the modeled plantsrsquo capacity factors suffer significantly in areas with high renewable penetration Most market mechanisms designed to compensate flexible and dispatchable generators are still too early-stage to be able to gauge their significance in the mid-2030s The grid will undoubtedly demand large amounts of flexible resources by that time however it is currently unclear how much energy will be transacted through these new products Nonetheless developers should track how these products evolve Further they should track the development of competitive technologies such as energy storage distributed energy resources (DERs) demand-side solutions like flexible loads (eg EVs electric hot water heaters smart thermostats etc) and demand response programs These resources help lsquotime shiftrsquo demand smooth power flows across the grid and enhance grid flexibility overall They are less effective however in serving increases in overall electricity demand (absent DER generators) With the electrification of the transportation sector (as well as other sectors) expected to increase overall demand advanced nuclear plants with thermal energy storage are uniquely suited to meet that demandmdashparticularly in markets with high penetration of renewables where ramping is needed Although regulated electricity markets were outside the modeling scope advanced nuclear developers may find it favorable to focus on these markets for their initial sales efforts Regulated utilities can utilize all the benefits of highly rampable and dispatchable output without requiring complex often contested and relatively slow-moving market reforms to reveal the value of certain grid services For these reasons regulated markets have been in practical terms the first markets for Gen III and III+ nuclear plants as well as other innovative power projects (see NuScale Powerrsquos current development efforts in Utah or the Kemper carbon capture and sequestration project in Mississippi)Considering advanced nuclear plants can operate as baseload resources as well as following load they can supply a large fraction of firm power without raising the overall cost of electricity This conclusion should motivate ISO operators public utility commissioners policymakers utilities and other stakeholders to investigate the role that these products could play in the grids of the future and to continue supporting advanced nuclear commercialization efforts This should also motivate organizations responsible for national and international energy modeling to include flexible advanced nuclear with thermal energy storage in their projections for future energy systems The CapEx thresholds highlighted in this report are relatively low compared to conventional nuclear new-build plants in North America and Europe However they are well within the range of those reported by third-party cost studies6 and advanced nuclear developers themselves This range is also well within the costs being achieved in countries with continuous new build nuclear programs7 Designers should integrate these cost requirements into their plant designs and consider whether adding thermal storage makes sense in their target markets
Main Report
Cost amp Performance Requirements for Flexible Advanced Nuclear Plants in Future US Power Markets 6
ARPA-E arranged several meetings with utilities policymakers and other organizations involved in the commercialization process for advanced nuclear technology The goal was to solicit input on the conditions that would lead to increased support Discussions covered a range of topics and high-level feedback largely fell into the following criteria
n Low overnight construction cost n Fast ramp rate without steam bypass (power capacitymin) n Short onsite construction time n Reduced staffing levels (onsite and offsite) n Smaller emergency planning zone limited to site boundary n Longer time before human response required for an accident n Reliable onsite backup power n High process heat temperature
These criteria offer useful guiding principles for advanced reactor designers as they derive from organizations that influence oversee and ultimately make power plant investment decisions They also formed the basis for eligibility requirements for ARPA-Ersquos MEITNER (Modeling-Enhanced Innovations Trailblazing Nuclear Energy Reinvigoration) program The MEITNER program supports a collection of projects that ldquoseek to identify and develop innovative technologies that can enable designs for lower cost safer advanced nuclear reactorshellip [and] establish the basis for a modern domestic supply chain supporting nuclear technologyrdquo 8 This report focuses on the first two criteria from the list above and examines the potential for advanced nuclear plants to meet the growing need for grid flexibility Specifically it uses PLEXOSreg production cost modeling software to estimate revenues earned by a generic advanced nuclear plant in deregulated power markets with low-renewables or high-renewables scenarios in the mid-2030s Revenues are used to estimate the maximum allowable CapEx or the maximum cost for which a plant must be delivered The intent is to provide advanced reactor developers including the MEITNER programrsquos Design Teams with information regarding the value of lsquoflexiblersquo operation (ie highly-rampable and capable of load following) and the CapEx targets they need to achieve by the time their reactors are commercially available This information also allows developers to assess design trade-offs inform interim technical targets evaluate projected system performance and articulate the need and impact of further investments to public and private fundersThis analysis was conducted with funding provided through an ARPA-E Work Authorization to DoErsquos Oak Ridge National Laboratory which subcontracted to LucidCatalyst
2 Introduction Several advanced nuclear plants are being designed to have similar ramping and load-following capabilities as combined-cycle natural gas plants (CCGTs) Because they also provide 247 emissions-free baseload generation the US Department of Energyrsquos Advanced Research Projects Agency-Energy (ARPA-E) approached a variety of stakeholders to better understand the factors that could potentially increase their procurement appeal
Cost amp Performance Requirements for Flexible Advanced Nuclear Plants in Future US Power Markets 7
21 Estimating Maximum Allowable Capex in Future Markets Using Plexos Software
LucidCatalyst modeled flexible (ie highly-rampable) advanced nuclear plants in the four principal deregulated US power markets (1) ISO-New England (ISO-NE) (2) Pennsylvania Jersey Maryland Power Pool (PJM) (3) Midcontinent Independent System Operator (MISO) and (4) California ISO (CAISO) The modeling runs were set in the year 20349 under the assumption that advanced nuclear plants will be commercially available by then LucidCatalyst modeled two potential 2034 scenarios based on different variable renewable energy10 (VRE) penetration assumptions
n Baseline Renewables Future This conservative renewables case reflects built-in values in the PLEXOS software which are the result of a capacity expansionoptimization model run performed by Energy Exemplar (makers of PLEXOS) for 2034 and beyond This assumes that all current state Renewable Portfolio Standard (RPS) targets tax credits and other existing legislation that supports renewables deploymentmdashcurrent as of January 1 2019mdashtake effect It does not include any non- binding targets or assume any future policy that could stimulate further renewables deployment
n Higher Renewables Future This scenario is based on the lsquoLow Natural Gas PriceLow Renewables Costrsquo scenario included in NRELrsquos Regional Energy Deployment System (ReEDS) model (described in Section 522)11 This assumes a higher renewables build-out and that natural gas prices do not significantly differ from todayrsquos prices (~$3MMBtu) This implies that advanced nuclear plants need to compete with highly flexible new-build combined-cycle gas plants in a low-cost natural gas environment
Assuming the current spectrum of capacity payments seen in todayrsquos capacity markets LucidCatalyst concluded that flexible advanced nuclear plants have an allowable CapEx threshold of between $1965kW and $4503kW depending on ISO VRE scenario and assumptions related to capacity payments (see Section 7) LucidCatalyst also modeled a parallel scenario that includes a 12-hour co-located energy storage system (ESS) The additional revenues from the lsquonuclear + ESSrsquo plant justified extra allowable CapEx ranging from $613kW to $1891kW This range is also driven by different scenario assumptions but the key finding is that higher renewables penetration leads to higher ESS revenues LucidCatalyst modeled three additional 2034 scenarios Each examined the impact on maximum allowable CapEx from (1) a hypothetical range of CO2 prices (2) a large fleet of advanced reactors operating in the same market and (3) an alternative assumption for annual fixed OampM cost
22 Report Structure
This report is primarily intended for advanced reactor developers with relatively little knowledge andor experience with wholesale electricity markets The report is divided into the following sections
1 Executive Summary2 Introduction3 Revenue Generation in Deregulated and Regulated Power Markets
This section provides advanced reactor developers with a brief high-level overview of how energy prices are set in wholesale power markets in the US and highlights the most relevant revenue streams for advanced nuclear plants It is not an exhaustive review of all aspects of market operations and settlements rather it focuses on the basics of price formation in deregulated markets and procurement in regulated markets
4 Current Revenue Potential and VRE Effects on Nuclear Projects Flexible dispatchable resources are increasingly important as VRE deployment continues to rise This section explains how VREs depress average wholesale energy prices and present fundamental challenges to grid management and current power market design It also describes how increasing
Cost amp Performance Requirements for Flexible Advanced Nuclear Plants in Future US Power Markets 8
quantities of VRE pose an existential threat to the economic viability of lsquomust-runrsquo baseload assets such as conventional nuclear plants The goal is to provide a brief survey of the US energy landscape such that advanced reactor developers have a baseline understanding from which to view the 2034 scenarios
5 PLEXOS and Financial Modeling Methodology and Assumptions LucidCatalyst developed an illustrative advanced nuclear plant for PLEXOS modeling runs This section includes the cost and performance assumptions for this illustrative plant and describes the methodology for preparing the 2034 low- and high-renewables scenarios in PLEXOS
6 Illustrative Cash Flow Analysis With the reportrsquos focus on allowable CapEx it is important to walk through how this figure is calculated This section describes the sequence of steps taken to arrive at this figure under a set of prescribed market conditions This provides the basis for understanding the PLEXOS modeling results
7 PLEXOS Modeling Results for 2034 All 2034 modeling results are presented in this section Specifically it highlights the maximum allowable CapEx for flexible advanced nuclear plants in four deregulated power markets (ISO-NE PJM MISO and CAISO) in the baseline- and high-renewable environments and under a range of related input assumptions
8 Additional Modeling Analyses Several factors can influence a plantrsquos maximum allowable CapEx This section presents the CapEx implications of CO2 pricing and market penetration potential Additional modeling scenarios in this section examine the impact of a CO2 price on CapEx the potential to deploy significant quantity of advanced nuclear capacity without affecting energy prices (and therefore allowable CapEx) and the relationship between expected fixed OampM costs and allowable CapEx
9 Conclusions The PLEXOS modeling reveals several takeaways for MEITNER participants as they consider their plant designs This section summarizes the findings from the modeling analysis and provides commentary on how flexible advanced nuclear plants can be delivered for less than the maximum allowable CapEx such that they can play a vital role in delivering a clean reliable flexible and low-cost electric power system
10 Appendices This report also contains useful reference information for advanced reactor developers including the MEITNER Design Teams in the following appendices
A Historical revenues by market product in select ISOs B New market mechanisms that capture the value of resource flexibility C Desirable performance attributes and market participation requirements D Alternative ways of providing system flexibility E High-level cost analysis of energy storage system F High-level estimate of non-nuclear island costs
Cost amp Performance Requirements for Flexible Advanced Nuclear Plants in Future US Power Markets 9
3 Price data included in this section are from the ISOs modeled in this analysis (ISO-NE PJM MISO and CAISO)
31 Available Revenue Streams for Advanced Nuclear Plants in Deregulated Markets
The majority of electricity bought and sold on the electric power grid is transacted through bilateral Power Purchase Agreements (PPAs) PPAs involve two parties agreeing to a price quantity of electricity to be supplied and period over which that electricity is to be delivered In deregulated markets while most energy sales are still transacted through PPAs there is a competitive marketplace where energy capacity and ancillary services (used to balance the grid) are bought and sold Table 1 below lists the various revenue opportunities for flexible advanced nuclear power plants and qualifies their relevance
Table 1 Relevance of Available Revenue Streams for Flexible Advanced Reactors
Market Revenue Mechanism
Description Relevance
Energy
Day-Ahead Market
Real-Time Market
The Day-Ahead Market (DAM) allows supply and demand bids to be set a day before electricity is actually generated or consumed It allows power plants to prepare to deliver their commitment and provides the Regional Transmission Operator (RTO) an understanding of which units will be operating to meet the following dayrsquos demand on an hourly basis Most energy sales are still transacted through Power Purchase Agreements however the vast majority of electricity transacted through power markets is through the DAM Relevance Revenues from the Day-Ahead Market will constitute the majority of advanced nuclear plant revenues (gt60)
The Real-Time Market (RTM) is primarily used to resolve deviations between forecasted supply and demand and address other contingences (eg unplannedunforeseen availability and or operational issues at power plants) Relevance An advanced nuclear plant will sell far less energy in the Real Time market (and prices do not differ significantly from DA market)
Very High
Medium
Revenue Generation in Deregulated and Regulated Power MarketsIt is important that advanced reactor developers have a basic understanding of the relevant revenue streams how energy prices are set and relative advantages and disadvantages of deploying in deregulated and regulated power markets
Cost amp Performance Requirements for Flexible Advanced Nuclear Plants in Future US Power Markets 10
Market Revenue Mechanism
Description Relevance
Capacity
Capacity
Forward Capacity
Vertically integrated utilities and load-serving entities (LSEs or local utility companies) in deregulated markets provide capacity payments to resources that help ensure sufficient capacity to meet mandated reliability requirements or meet extraordinarily high electricity demands These payments are designed to replace gaps in revenue resulting from energy sales that are insufficient to maintain the plantsrsquo financial viability Relevance This price will be negotiated with the LSE and represent a substantial percentage of annual revenues for advanced nuclear plants (~20 ndash 30)
Forward capacity markets are used to incentivize the deployment of new energy resources Developing large energy resources takes time and capital and this market helps ensure that these resources are constructed and synchronized to the grid in time to adequately meet forecasted future demand Relevance Based on a historical analysis of capacity auction results capacity payments make up 20 ndash 30 of advanced nuclear revenues
Very High
Very High
Ancillary Services
Frequency Regulation
Spinning Reserves
Non-Spinning Reserves
Voltage Control
Black Start
Resources participating in frequency regulation markets adjust their output or consumption in response to an automated signal from grid operators These adjustments help correct short-term changes in energy demand that affect system stability and keeps the grid frequency at (or very close to) 60 Hertz Relevance Relatively small market and probably best suited for grid-tied electrochemical storage (eg batteries) by the mid-2030s
The spinning reserve market compensates grid-synchronized resources that have available capacity to inject into the grid when called upon Resources must inject this capacity within a relatively short time usually less than 10 minutes While these reserves have conventionally been used to respond to unexpected contingencies such as a generator unexpectedly falling offline it is likely that more spinning reserves will be needed as more VREs are deployed Relevance Grid operators will need more synchronized resources to help maintain stability when large amounts of VRE go offline While this market is likely to grow in size increased participation will likely mitigate an increase in profitability Therefore while this may be a revenue source for advanced nuclear plants it is not expected to be significant
The non-spinning reserve market compensates resources that are not synchronized to the grid but can be within a short period (usually within 10 ndash 30 minutes) As with spinning reserves these resources are called upon during unexpected losses in generation Relevance Relatively small market with little revenue
Generating resources can be compensated for providing reactive power to compensate for drops in system voltage Relevance Insignificant revenue opportunities for advanced nuclear
If the grid loses power Black Start designated generators are committed to restoring electricity to the grid and do not require an outside electrical supply to do so Relevance Insignificant revenue opportunities for advanced nuclear
Very Low
Low
Very Low
Very Low
Very Low
Other
Flexible Ramping Product
Flexible ramping products are relatively new and currently only available in CAISO and MISO They reward resources that can quickly adjust outputmdashbeyond what has been obligatedmdashwithin a certain time period to correct forecasting uncertainties and other anomalies It is possible that these flexible ramping products will transact more energy as VRE deployment rises Relevance These products are very new and currently do not transact significant quantities of energy These may (or may not) become significant revenue opportunities for advanced nuclear plants going forward
Low
Power plants with low marginal costs (solar wind hydro existing nuclear)
Mar
gina
l Cos
t and
Po
wer
(Ene
rgy)
Pric
e in
$M
Wh
Demand
Market Price
Power (Energy) Supply and Demand in MWh
Fossil plants with higher marginal costs (coal natural gas oil)
Figure 1
Cost amp Performance Requirements for Flexible Advanced Nuclear Plants in Future US Power Markets 11
32 Energy Market Price Formation in Deregulated Markets
As in other competitive markets energy prices in power markets are set by the lsquomarginal costsrsquo of the marginal energy producer as shown in Figure 1 below The lsquomarginal costrsquo typically reflects a resourcersquos cost of producing each MWh of electricity which includes fuel costs the efficiency with which they are converted to electricity and any other costs associated with operating such as labor and maintenance The marginal cost guides what a resource will bid into the energy market for a given time period The grid operator will then arrange all energy supply bids in ascending order of price (often called the lsquomerit order) for each moment in time This supply stack (or lsquobid stackrsquo) begins with plants with lowest marginal costs (eg solar wind hydro and nuclear) and proceeds upward to those with higher marginal costs in (eg coal natural gas and oil plants) The supply stack is then compared to electricity demand for a given moment in time and the highest bid that intersects with the demand curve sets the clearing price for all lsquoinfra-marginalrsquo plants (ie with bids lower than the marginal producer)
Figure 1 Stylized Supply Stack Demand Curve and Price
For illustrative purposes Figure 2 below shows the stylized electricity market with the addition of flexible advanced nuclear plants Their assumed low marginal costs have the effect of pushing plants with higher marginal costs beyond the intersection of the supply and demand curve As a result fossil plants which would otherwise set the market price no longer operate as much Displacement of high-marginal-cost plants lowers overall clearing prices
Demand
Market Price
Advanced flexible nuclear plants
Higher-cost fossil plants arepushed out of the marketby advanced flexible nuclear
Power (Energy) Supply and Demand in MWh
Figure 2
Mar
gina
l Cos
t and
Po
wer
(Ene
rgy)
Pric
e in
$M
Wh
Cost amp Performance Requirements for Flexible Advanced Nuclear Plants in Future US Power Markets 12
Figure 2 Stylized Power Market Supply Demand and Price with Flexible Advanced Nuclear Plants
33 New Efforts to Compensate and Promote Flexible Resources
Rewarding resources that can be available and quickly ramp up and down during periods of grid stress (either on an hourly minute second or sub-second basis) has been the focus of several recent regulatory initiatives relating to market design12 Creating new revenue lsquoproductsrsquo often takes years to formalize and implement however They require several rounds of stakeholder input and are often implemented on a trial basis with subsequent revisions In MISO for example it typically takes 5 ndash 7 years between opening a new docket and market implementation13 Upon surveying the markets included in this study (ISO-NE PJM MISO and CAISO) mechanisms designed to reward resource flexibility are relatively nascent and do not transact large quantities of power or capital throughout the year None currently provide the compensation necessary to stimulate investment in new nuclear capacity While these revenue streams will likely become more relevant it is unclear whether they will ever be a material source of revenue for flexible nuclear plants Developers should therefore track the evolution of these products but not consider them as material revenue sources until they prove themselves as such Appendix B provides a longer description of these products and their relevance to advanced nuclear developers
34 Regulated Market Overview
Regulated markets offer an alternative development pathway for advanced nuclear developers In US regulated electricity markets vertically integrated utilities own control andor manage the generation delivery and customer-sited infrastructure for electricity delivery They are monopolies with the obligation to serve retail customers within their service territories and follow rules14 set forth by federal state and local agencies These utilities are overseen by a public regulator usually a state public utilities commission Regulated utilities supply electricity at cost plus an approved rate of return on their investments for delivering electricity (including generation transmission and other grid resources) This structure replaces competitive markets in determining prices set for energy generation capacity ancillary services (and other services)
Cost amp Performance Requirements for Flexible Advanced Nuclear Plants in Future US Power Markets 13
Regulated markets are largely dominant in the Southeast Northwest and much of the West outside California Under this arrangement consumers are limited in their choice of electricity provider however prices are generally more stable and certain over time than in deregulated markets
341 Resource Procurement Regulated utilities typically conduct open and competitive solicitations to procure new resources These are either mandated or strongly encouraged by regulators to assure the lowest-cost supply for retail customers Utilities are often allowed to participate in the bidding process however they are forced to accept the lowest-cost option where equivalent products and services are offered15 Some regulatory commissions will direct utilities to procure certain types of resources like renewables to meet state mandates or Renewable Portfolio Standard (RPS) goals Resource procurement begins with the utility typically issuing a public Request for Proposal (RFP) that describes the type of resources it seeks to procure Based on the bidrsquos content (including price technology maturitybankability OampM contract terms project financing terms developerrsquos reputation etc) and oversight and approval from the overseeing regulatory authority a winner is selected Typically these contract terms are not made public
342 Benefits and Drawbacks of Developing Flexible Advanced Nuclear Plants in a Regulated MarketThe regulated environment is less transparent than a deregulated market environment resulting in advantages and disadvantages for flexible advanced nuclear projects The primary advantage is that developers are not limited to a defined suite of revenue streams which may or may not be well designed to compensate for the values a flexible nuclear plant can provide Developers also get the opportunity to make the case for flexibility directly to the utility or articulate the benefits of flexibility through their RFP response Further when a plant becomes lsquomerchantrsquo (after a PPA expires for example) in a deregulated market it is subject to market conditions which are more dynamic less predictable and more competitive (generally lowering overall revenue potential) Two recent nuclear plant projects in the United StatesmdashVC Summer in South Carolina and Vogtle in Georgiamdashare located in regulated markets The only current advanced nuclear development effort (NuScale Power in Utah Associated Municipal Power Systems) is taking place in a regulated market as wellThe primary disadvantage of a regulated market is the lack of price transparency and the reduced freedom of participating without necessarily winning an RFP Furthermore revenue is fixed and power projects are not able to access high price conditions during scarcity events Deregulated markets have less barriers to entry however even in such markets the capital intensity of nuclear plants will undoubtedly require developers to sign a long-term PPA with a credit-worthy utility or a long-term capacity contract before the project can be financed (or the nuclear plant may be owned directly by the utility)
Cost amp Performance Requirements for Flexible Advanced Nuclear Plants in Future US Power Markets 14
41 Wholesale Market Clearing Prices Have Been in Decline
Average clearing prices in most ISOs have been in decline over the past ten years mostly due to falling natural gas prices Low-cost gas reduces the marginal cost of running natural gas plants which typically operate lsquoon the marginrsquo and therefore set energy prices Table 2 provides the average Day-Ahead energy capacity and ancillary services prices in four ISOs over the past decade (Appendix A presents additional detail on these prices)
Table 2 Average Wholesale Prices by Revenue Stream in Select ISOs (2009 ndash 2018)
ISO-NE PJM MISO CAISO
Average Energy Price ($MWh)
(Trendline growth over 10 years)
$4498
(-21)
$3950
(-27)
$3134
(-09)
$3886
(11)
Average Capacity Price ($MWh)
(Trendline growth over 10 years)
$1301
(67)
$1030
(17)
$0671
(152)
$0181
(180)
Average Ancillary Service Price ($MWh) $146 $089 $014 $046
1 MISO and CAISO have a Resource Adequacy Construct where capacity is procured via bilateral contracts which are not made public These figures represent the voluntary capacity market where utilities can procure remaining capacity needed to fulfill their capacity obligations These prices should not be used as a proxy for capacity payments Also most new-build energy projects require multi-year capacity contracts
4 Current Revenue Potential and VRE Effects on Nuclear ProjectsWhile it is difficult to predict what the 2030s power markets will look like it will inevitably be influenced by the policy technology and cost trends of today As such it is useful to characterize current market conditions and highlight the relevant issues and developments that advanced reactor developers should track This section highlights the current revenue potential for advanced nuclear plants as well as some of the key challenges for participation in future markets
Demand
Market Price
(Out of the Market)
Power (Energy) Supply and Demand in MWh
Lower marginal cost resources push higher marginal cost resources out of the bid stack lowering the overall clearing price
SolarWind
Figure 3
Mar
gina
l Cos
t and
Po
wer
(Ene
rgy)
Pric
e in
$M
Wh
Cost amp Performance Requirements for Flexible Advanced Nuclear Plants in Future US Power Markets 15
While low natural gas prices have largely driven the decline in energy prices other factors are also at work Research at the Lawrence Berkeley National Laboratoryrsquos Energy Systems Integration Group (ESIG) has shown that while solar PV and wind have historically had relatively little impact on energy price they ldquohave [now] begun to meaningfully influence temporal and geographic pricing trendsrdquo 16 Periods of exceptional sun and wind are now driving a higher frequency in the number of hours where market clearing prices are negative17
Figure 3 Market Price Declines When Renewables Dominate the Supply Stack
The increase in VRE deployment and more importantly the anticipation of continued VRE deployment is forcing the power grid to become more flexible and resilient Falling energy prices are a threat to advanced nuclearrsquos economics However the need for more flexible dispatchable resources may be an opportunity
42 The Rise of Variable Renewable Energy and Need for Grid Flexibility
To ensure a reliable supply of electricity in uncertain conditions system operators dynamically alter generation andor load to keep the grid at a stable frequency of 60 Hz Maintaining this frequency was historically furnished by large centralized generators In fact the entire electric power grid was initially designed and built around large centralized generators (eg coal nuclear and hydroelectric plants)18
They were the basis for all grid planning decisions and their startup times fuel availability and operating characteristics informed the design of competitive power markets19 However maintaining a balanced grid frequency has become a growing concern as more VREs are deployed They are also disrupting the way power markets are currently designed Largely driven by rapidly falling costs and supportive policies wind and solar PV deployment has increased 500 in the last 10 years20 Between 2009 ndash 2017 costs dropped 76 for solar PV and 34 for wind and it is expected that deployment rates will continue to rise21 To continue accommodating these resources power systems must maintain sufficient operating reserves and have generators
Figure 4
Cost amp Performance Requirements for Flexible Advanced Nuclear Plants in Future US Power Markets 16
that can quickly inject power when VREmdasheither expectedly or unexpectedlymdashgoes offline Beyond backfilling when the wind and sun are unavailable the grid needs resources that can ramp down as VRE generation comes online in the morning and ramp up as the sun goes down in the evening Figure 4 below presents the net load curve 22 for a spring day in California in 2017 As more VRE is built the net load curversquos lsquobellyrsquo will drop even further making it more difficult to meet demand during morning and evening ramps This provides a useful reference case for other markets that will ultimately encounter steepening net load curves
Figure 4 Net Load Curve in CAISO for April 9 2017 23
Increasing VRE not only requires increasing grid flexibility it also triggers more renewables curtailment and transmission congestion (affecting locational marginal prices) Further VRErsquos capacity to reduce expected reliability problems or outage events (measured by their Effective Load Carrying Capability or ELCC) diminishes as more VRE is deployed (see Figure 5) This helps explain why most lsquohigh renewablesrsquo scenarios in the mid-2030s still include a large amount of fossil generationmdashparticularly natural gas24
Figure 5
Cost amp Performance Requirements for Flexible Advanced Nuclear Plants in Future US Power Markets 17
Figure 5 Wind and Solar ELCC Curves as a Function of Installed Capacity in MISO25
In summary the grid was not designed around the irregular and unscheduled generation inherent to VREs More lsquoflexible resourcesrsquo such as energy storage fast ramping gas plants and demand side resources will be needed to accommodate more VRE while maintaining a high level of grid stability Advanced nuclear reactors if designed to be flexible could play a meaningful role in enabling more VRE deployment To do so they will need to be compensated for the inherent value of being flexible and dispatchable Current market mechanisms do not incentivize nuclear plants to operate flexibly nor reward them for supporting grid stability This has created extremely challenging conditions and made it difficult for conventional nuclear projects to be profitable
43 Conventional Nuclear Plants Face Fundamental Headwinds
Conventional nuclear plants typically operate as lsquomust-runrsquo baseload resources While they are capable of a moderate degree of ramping the economics of doing so in most cases are poor Conventional nuclear plants were initially designed to ramp (up and down) load follow and provide several ancillary services products26 Current reactor designs with best-in-class ramping capabilities such as EDFrsquos EPR and Westinghousersquos AP1000 can safely ramp to a maximum of approximately 5minute2728 However due to high capital costs and low marginal costs of nuclear plantsmdashparticularly in deregulated marketsmdashthey seek to operate at their maximum rated capacity for as long as possible When market prices fall below a nuclear plantrsquos operating costs the plant operates at a financial loss While they may forgo energy sales and provide operating reserves under these conditions it is only economical to do so in highly specific scenarios29 Operating at a loss or at declining profit marginsmdashespecially over a long period of timemdashcan materially impact a plantrsquos economics In markets with significant VRE penetration (eg CAISO) clearing prices can approach zero or below30 during periods of exceptional sun or wind and relatively low demand These pricing events force nuclear and other lsquomust-runrsquo resources to operate at a loss or go offline Low natural gas prices and the anticipation that VRE will continue to push prices downward has motivated several utilities to retire
Cost amp Performance Requirements for Flexible Advanced Nuclear Plants in Future US Power Markets 18
nuclear plants or not renew their operating licenses31 In fact these difficult economic conditions have forced six nuclear plants to close in the past five years with nine more planning to retire in the next 10 years (representing more than 18 GW of generation capacity)32 Further the average age of US nuclear plants is approximately 37 years Plants become more expensive to operate as they age33 Absent significant changes to nuclearrsquos CapEx operating profile or revenue opportunities (particularly capacity payments) it is difficult to see how conventional nuclear will successfully navigate a market environment with low energy prices going forward It is important to note that nuclear plants are not the only generators experiencing difficult economics due to low energy prices Natural gas plants are seeing a higher percentage of their revenues coming from non-energy sales (mostly capacity and reserve payments) Low energy price environments affect all resources
431 Non-Market Payments Keep Some Conventional Nuclear Plants OperationalSeveral states have been passing legislation to provide nuclear plants with payments to ensure they continue to run even as power market conditions worsen Illinois New Jersey Connecticut New York and Ohio have all authorized payments to keep nuclear plants online Pennsylvania has proposed legislation to do the same34 Maryland is currently analyzing whether nuclear should be eligible for clean-energy credits35 Proponents of legislative measures see preserving existing nuclear plants as a cost-effective means (on a $MWh basis) of achieving their emissions-reduction goalsWhile some form of lsquonon-market paymentsrsquo may be available to advanced nuclear developers in the mid-2030s it is neither likely nor clear how they would be structured Therefore the possibility of such payments should not influence design decisions being made today If markets begin to offer compensation to dispatchable resources that provide grid stability and dependability or for emissions-free generation these out-of-market payments will become less important or entirely unnecessary Several plant owners are also looking into potential non-power market revenue streams such as hydrogen production36 to improve economic performance Until these changes occur low natural gas prices (which according to natural gas price futures are not expected to rise substantially in the coming years) and increasing VRE deployment will challenge nuclear plant economics in several markets
Cost amp Performance Requirements for Flexible Advanced Nuclear Plants in Future US Power Markets 19
5 To calculate the maximum allowable CapEx LucidCatalyst transferred PLEXOS outputsmdashwhich included energy revenues and plant outputcapacity factors for both the plant and if necessary the ESS systemmdashinto a lsquopost-PLEXOSrsquo financial model Here capacity payments and various financial assumptions are applied to determine the final allowable CapEx Figure 6 on the following page provides a high-level diagram of the methodology which is described in detail in this section
51 Overview of PLEXOS Electricity Market Modeling Software
PLEXOS is a production cost model for electricity markets in the US (with other international versions available) that can simulate future market conditions Production cost models predict the economic dispatch of power plants in a given service territory or market and across a defined timeframe PLEXOS has been widely used since 1999 by grid operators utilities and electricity market analysts For this analysis data on expected hourly demand for each service territory comes with the software package and the program determines the optimal mix of power plants to meet demand in each hour at the lowest cost Results include plant power operational details market price forecasts and CO2 emissions from fuel consumption at fossil plants PLEXOS determines the optimal production patterns from power plants based on marginal cost pricing as illustrated in the stylized power market diagrams in Section 3 PLEXOS contains detailed data on existing power plants (including their capacity outage requirements energy conversion efficiencies etc) solar and wind availability by location demand forecasts fuel price forecasts transmission line limits emissions rates and all other necessary inputs for performing market simulations LucidCatalyst adjusted some of the built-in data for the future baseline scenario and entered new inputs to represent flexible advanced nuclear plants with energy storage as discussed in the next two subsections
PLEXOS and Financial Modeling Methodology and AssumptionsLucidCatalyst used PLEXOSreg electricity market modeling software from Energy Exemplar to model the revenue potential of flexible advanced nuclear technology (and thus an implied maximum CapEx) in four US future power markets ISO-NE PJM MISO and CAISO The modeling exercise examines a hypothetical plantrsquos annual revenue profile as it responds to fluctuations in demandmdasheither through ramping up and down or through a combination of ramping and co-located energy storage systems PLEXOS provides empirical precision for a projectrsquos annual capacity factor and the optimal output in response to changing market conditions LucidCatalyst also ran additional modeling scenarios to observe the effect of CO2 prices and the aggregate impact of multiple flexible advanced nuclear plants on market prices
Figure 6
Cost amp Performance Requirements for Flexible Advanced Nuclear Plants in Future US Power Markets 20
Figure 6 High-Level Methodology Diagram for Calculating Maximum Allowable CapEx
52 Modeling Methodology
521 Modeling HorizonLucidCatalyst used PLEXOS to model electricity markets in 2018 (to show recent data) and 2034 The year 2034 was selected as a baseline year to model for two reasons First it is far enough in the future (halfway to 2050) when advanced reactors are expected to be commercially available This is supported by several advanced nuclear companies claiming they will have a commercially available reactor in the late 2020s37 Second this date also provides more time for ISOs to transition beyond what is currently being modeled in each ISOrsquos current forward-looking plans Developing credible grid scenarios for 2034 presents obvious challenges State and regional policymakers are developing ambitious emissions-reduction targets as the cost of wind solar and energy storage all continue to fall Demand-side technologies are becoming more relevant and the electrification of transportation and heat continue to be key areas of policy focus As these trends
Cost amp Performance Requirements for Flexible Advanced Nuclear Plants in Future US Power Markets 21
develop ISOs are experimenting with new market products as discussed in Appendix B to reward resource flexibility (which may change the capacity mix and dispatch order of a future grid) Modeling the operation of flexible advanced nuclear plants (with and without energy storage) in 2034 did not require making assumptions about construction time in PLEXOS Construction is assumed to have finished by 2034 so that hypothetical plants are ready for operation in that year Importantly the scenarios are not being run to determine the timing of capacity additions by one or more advanced nuclear plants The modeling largely focuses on the cost of the first advanced nuclear plant in a given ISO
522 Modeling ScenariosThe LucidCatalyst team modeled two main scenarios in 2034 a baseline lsquolow renewablesrsquo (low RE) scenario based on PLEXOSrsquo built-in resource mix for 2034 and a lsquohigh renewablesrsquo (high RE) scenario based on the lsquoLow natural gasLow RE costrsquo scwenario in NRELrsquos ReEDS model which has a significantly higher proportion of renewables These scenarios were selected to define the range of potential likely outcomes and allow for a comparative analysis of the impacts of flexible advanced nuclear plants on generation mix market prices and other modeling variablesThe 2034 lsquolow RErsquo grid mix was consistent with the mix produced by Energy Exemplar (developers of the PLEXOS software) It reflects a long-term capacity expansion outlook38 that reflects expected plant retirements plants under construction and plant announcements Additionally it reflects an optimized build out of generators considering Renewable Portfolio Standards (RPS) the impacts of other emissions-based regulations and expected resource cost curves39 The output assumes relatively higher penetrations of natural gas capacity with relatively modest additions to renewable energy capacity (ie just enough to meet existing RPS standards) For the higher renewables scenario the team adopted the 2034 NREL ReEDS lsquoLow natural gas Low RE costrsquo scenario40 NREL developed their ReEDS model to forecast power plant capacity changes generation mixes and related electricity market impacts from a range of policy and economic assumptions The assumptions underlying the lsquoLow natural gas Low RE costrsquo lead to high capacities and generation levels for natural gas plants and renewable energy facilities such as solar and wind LucidCatalyst calibrated the 2034 baseline scenario in PLEXOS by matching the power plant type and location to the ReEDS scenario Under the lsquolow RErsquo and lsquohigh RErsquo scenario umbrellas a total of nine cases were modeled (see Table 3 below) The lsquolow RErsquo cases include a 2034 baseline without any advanced nuclear plants and individual runs for one plant with and without co-located energy storage system (ESS) The idea is to estimate the maximum allowable CapEx for the first plant in the marketplace Importantly initial modeling showed little difference between the allowable CapEx for the first and fifth plant in smaller markets like ISO-NE In larger markets like PJM it takes dozens of advanced nuclear plants to affect energy prices to the point that the maximum allowable CapEx is significantly different The same cases are run for the lsquohigh RErsquo scenario with two additional cases that examine the impact of hypothetical CO2 pricing a large fleet of advanced nuclear plants operating in the same market and different OampM assumptions on allowable CapEx
Cost amp Performance Requirements for Flexible Advanced Nuclear Plants in Future US Power Markets 22
Table 3 Modeled Scenarios in PLEXOS
of Adv Nuclear Plants
ISO-NE PJM MISO CAISO
2034 Low RE
1 Low RE Baseline 0 n n n n
2 Low RE wout Thermal ES 1 n n n n
3 Low RE with Thermal ES 1 n n n n
2034 High RE
4 High RE Baseline 0 n n n n
5 High RE wout Thermal ES 1 n n n n
6 High RE with Thermal ES 1 n n n n
7 High RE Fleet Advanced Nuclear + ESS varies by ISO n n n n
2034 High RE w Carbon Price
8 High RE Baseline with CO2 Price ($25 $50 $75tonne) with and without ESS
1 n
2034 Alternative OampM Costs (Low amp High RE)
9 Higher OampM Costs Relative to Baseline Assumption (for both Low and High RE scenarios)
1 n n n n
Figure 7
Cost amp Performance Requirements for Flexible Advanced Nuclear Plants in Future US Power Markets 23
523 Modeling RegionsModeling four markets provides insights into the variety of contexts in which flexible advanced nuclear plants may be deployed It leads to different results for wholesale energy prices advanced nuclear plant operational expectations and financial calculations such as maximum allowable CapEx The following map and table show the geographic extents of the four competitive wholesale markets and total power plant capacity and power demand in 2018 and 2034
Figure 7 US Regional Power Markets
Source Federal Energy Regulatory Commission
Cost amp Performance Requirements for Flexible Advanced Nuclear Plants in Future US Power Markets 24
Table 4 Total Capacity and Power Demand in the Four Markets in 2018 and 2034
Market 2018
Total Capacity
2034 Low Renewables
2034 High Renewables1
Total Demand
2018 2034 Low or Higher RE2
ISO New England 35 GW 44 GW 47 GW 124 TWh 110 TWh
PJM 203 GW 239 GW 281 GW 806 TWh 869 TWh
MISO 175 GW 229 GW 243 GW 709 TWh 838 TWh
CAISO 74 GW 86 GW 88 GW 261 TWh 272 TWh
1 In the flexible advanced nuclear scenario for 2034 a fleet of flexible advanced nuclear plants with energy storage are added while maintaining capacity between the 2034 scenarios
2 The 2034 scenario and 2034 flexible advanced nuclear scenario have the same total demand but net imports or exports differ between them for markets modeled with neighboring areas leading to changes in generation between the two scenarios
PLEXOS models these ISOs as aggregations of their component service territories (also called load zones) ISO-NE has 13 service territories PJM has 20 MISO has 10 and CAISO has 9 Results tables for the flexible advanced nuclear scenarios shown below in Section 7 identify the service territories in which flexible nuclear plants were assumed to operateThe four electricity markets differ in several key respects regarding power plant capacity and generation mix Under 2034 baseline conditions ISO New England has high levels of natural gas and wind (mostly offshore) PJM stands out among the regions for its higher reliance on conventional nuclear plants and coal plants MISO has the most wind capacity and generation (onshore) among the regions and CAISO has the most solar (as well as significant amounts of wind)Monetary inputs and outputs for the PLEXOS modeling are expressed in constant 2019 dollars This analysis uses the PLEXOS modelrsquos built-in data for demand projections within each service territory It also uses the modelrsquos built-in transmission constraints between service territories parameters for the thousands of existing plants plants under construction and those that are expected to be built according to Energy Exemplarrsquos capacity expansion model The analysis uses a consistent natural gas price of $300MMBtu in constant dollars for 2018 and 2034 to avoid introducing differences in market prices or plant dispatch arising from underlying fuel price differences The PLEXOS modelrsquos built-in price projections for other fuel prices are maintained The analysis also maintains the built-in price projections for CO2 emission fees in the Northeast Regional Greenhouse Gas Initiative ($17tonne in 2034) and California ($22tonne in 2034) and there is no national CO2 emission fee because such a program has not been enacted by Congress and the Clean Power Plan is being reconsidered In accordance with the most recent federal energy legislation which phases out the Production Tax Credit (PTC) for renewables the modeling does not include these support mechanisms
0
Cost amp Performance Requirements for Flexible Advanced Nuclear Plants in Future US Power Markets 25
524 Modeling Inputs for Flexible Advanced Nuclear Plants with Energy StorageThe modeling software treats the nuclear plant and energy storage system as two facilities whereby the storage facility charge at a rate no greater than the amount of power being produced at the nuclear plant Setting this model constraint (ie defining the relationship between the two facilities) in PLEXOS is equivalent to envisioning the energy storage system at the same site as the nuclear power plant charging from the nuclear plantrsquos production at certain times and discharging at other times LucidCatalyst assumed the ESS was a thermal storage system which stores energy as heat and subsequently uses the heat to make steam which is sent through a dedicated steam turbine A high-level schematic of such a thermal storage system charging and discharging is provided in Figure 8 below
Figure 8 Charging and Discharging Configuration of Advanced Nuclear Plant with Thermal ESS
It is important to note that PLEXOS does not require CapEx estimates for the advanced nuclear plant energy storage system or any other addition to the electricity grid in order to model dispatch (such as the solar and wind additions for alignment with the NREL ReEDS scenario) It economically dispatches resources based on their marginal cost and revenue maximization opportunities For ESS configurations if future market prices are expected to be higher than current prices PLEXOS assumes the operator sends energy to storage (assuming the system is not yet full) The LucidCatalyst team entered the proceeding operating parameters for plants into PLEXOS and allowed it to determine the optimal mix of resources to meet demand based on their marginal costs as discussed above without reliance on CapEx estimates in the model
Cost amp Performance Requirements for Flexible Advanced Nuclear Plants in Future US Power Markets 26
53 Illustrative Advanced Nuclear Plant and Energy Storage System Assumptions
For modeling purposes LucidCatalyst developed an illustrative advanced nuclear plant that assumes a uniform design and does not reflect a specific reactor technology Physical specifications for this illustrative plant as well as the thermal ESS are listed in the tables below41 42
Table 5 Assumed Capacity and Operating Specifications for Illustrative Advanced Nuclear Plant
Advanced Nuclear Specifications
Assumption Rationale
Net Electric Capacity (MWe)
500 This reflects the typical size of what the flexible nuclear plant would likely replace a combined cycle gas plant (CCGT) MEITNER Design Teams are developing reactors across a broad range of scales from 02 MWe to 1200 MWe The smaller reactors are being designed for niche markets whereas this study looks at those looking to compete in power markets
Thermal Efficiency 40 This roughly represents the midpoint within the range of thermal efficiencies for advanced nuclear concepts1 and includes some losses from the energy storage system
Heat Rate (BtukWh) 8530 Btu content of a kWh is 3412 Btu2 This figure is divided by the thermal efficiency
Maximum Potential Capacity Factor
92 The advanced nuclear plants are assumed to take a four-week outage each year (8 of annual hours) for refueling and other maintenance Their capacity factors may be lower to avoid operating at a loss during low-price periods from the PLEXOS modeling
Outlet Temperature 600 ndash 700degC While there are a range of outlet temperatures for advanced reactors (480 ndash 1000degC)3 an outlet temperature of 600 ndash 700degC is assumed This is the same rated inlet temperature for most heat steam recovery generators (HSRG) used for CCGTsmdashallowing the application of HSRG cost assumptions for the energy storage system
Minimum Stable Factor
0 This implies that the plant can ramp all the way down to 0 operating capacity which is a significant departure from conventional nuclear plants that typically have a minimum stable factor of 70
Maximum Ramp Rate
5minute (25 MWmin)
EDFrsquos EPR and Westinghousersquos AP1000 both have max ramp rates of ~5minute4
1 WNA Advanced Nuclear Power Reactors 2019
2 US Energy Information Administration (2019) What is the efficiency of different types of power plants
3 Congressional Research Service (2019) Advanced Nuclear Reactors Technology Overview and Current Issues
4 OECD-NEA Technical and Economic Aspects of Load Following with Nuclear Power Plants 2011 p 8
Cost amp Performance Requirements for Flexible Advanced Nuclear Plants in Future US Power Markets 27
Table 6 Assumed Specifications for Energy Storage
Energy Storage Specifications
Assumption Rationale Used in CapEx Analysis (YN)
Rated Output (MW) 500 Advanced reactor capacities range significantly Y
Hours of Storage (MWh) 12 Assumes 12 hours of 500 MW output Y
Energy Storage Roundtrip Efficiency
90 Assumes a charge efficiency of 90 and discharge efficiency of 100 (implying a round-trip efficiency of 90)
Y
Outlet Temperature 600 ndash 700degC This assumes that the outlet temperature is sufficiently high to be used in a lsquooff-the-shelfrsquo steam turbine
N
Assumed Energy Storage Capacity
6000 MWh Assumes 12 hours of storage (rated at maximum output) Y
Maximum State of Charge 100 The energy storage system can charge to full capacity at any point (no governor)
Y
Minimum State of Charge 0 The energy storage system can discharge completely at any point (no governor)
Y
PLEXOS does not require CapEx inputs for the ESS just a marginal cost of operation The ESSrsquo marginal cost will differ depending on system type however because it does not use fuel and requires extremely small amount of OampM it is rarely if ever a marginal resource (and therefore never sets the energy clearing price) For these reasons LucidCatalyst assumed $0MWh for the ESSrsquo marginal cost Even if LucidCatalyst assumed a high-end marginal cost of say $5MWh the systemsrsquo dispatch would not change (nor would its revenues) as natural gas plants almost always set the clearing price and their marginal costs are 5 ndash 6x higher on average43 For the benefit of advanced reactor developers LucidCatalyst conducted a high-level CapEx review for three types of storage systems that would be complementary to advanced nuclear plants firebricks molten salt and flow batteries44 This review is included in Appendix E
54 Revenue Assumptions
LucidCatalyst assumed that advanced nuclear plant revenues were limited to energy sales and capacity payments While LucidCatalyst recognizes that increasing VRE deployment will likely stimulate an increase in demand for ancillary servicesmdashparticularly spinning reservesmdashLucidCatalyst expects that the increase in demand will be met by an increase in ancillary service market participation thus mitigating any significant increase in clearing prices Energy revenues are calculated by the plantrsquos output operating hours and clearing price LucidCatalyst assumes a range of potential capacity payments ($50 $75 $100kW per year) Importantly because the energy storage system is sized for 12 hours of rated output LucidCatalyst assumes that it also qualifies for a capacity payment45
Cost amp Performance Requirements for Flexible Advanced Nuclear Plants in Future US Power Markets 28
55 Fuel Costs and OampM Assumptions
551 Fuel CostsIn PLEXOS fuel costs for nuclear plants depend on two inputs (1) the price of uranium expressed in dollars per million British thermal units (MMBtu) and (2) the heat rate of each plant expressed in Btu per kWh which reflects the plantrsquos efficiency in converting fuel into electricity Preparing the fuel cost inputs for flexible advanced nuclear plants in PLEXOS therefore involves specifying these two inputsThe built-in dataset for PLEXOS contains a 2034 uranium price projection of $052MMBtu Analysts at Energy Exemplar (the company that licenses PLEXOS) develop price projections for uranium and other fuels to align with expectations from the US Energy Information Administration and other authoritative sources 46 The uranium price in PLEXOS represents the form of fuel currently used in US nuclear plants namely low-enriched uranium (LEU) with U-235 content between 3 to 5This modeling exercise aims to remain agnostic and neutral regarding reactor technologies and fuel sources for flexible advanced nuclear plants Some reactors would use LEU in a similar manner to current nuclear plants Other reactor technologies would encase the uranium in a tristructural-isotropic (TRISO) fuel pellet The use of high-assay low-enriched uranium (HALU) which rises above the typical enrichment for civil purposes toward levels for military applications is another option for advanced nuclear concepts The current lack of supply chains and mature markets for these novel fuels makes it difficult to forecast their prices into the modeling time horizon For these reasons LucidCatalyst assigned the built-in uranium price projection of $052MMBtu to flexible advanced nuclear plants for this analysisMost current nuclear plants in the United States have conversion efficiencies between 31 and 34 percent which equate to heat rates between 11000 and 10000 BtukWh47 As a result of engineering innovations and optimizations over time most of the recently constructed plants have higher efficiencies and lower heat rates than older plantsWhile this analysis refrains from specifying any particular reactor technology for the flexible advanced plants the assumed reactor outlet temperature stated above (600 to 700degC) allows for higher efficiency than conventional designs with lower outlet temperatures (around 325degC for pressurized water reactors and 290degC for boiling water reactors) Based on the target reactor temperature range historical improvements in efficiency and the strong incentive among developers to minimize fuel costs this analysis uses an efficiency of 40 and equivalent heat rate of 8530 BtukWh for flexible advanced nuclear plants in the PLEXOS modelingBy combining the uranium price projection and assumed heat rate flexible advanced nuclear plants have a fuel cost of $052MMBtu x 8530 BtukWh = $444kWh
552 Operating and Maintenance CostsConventional nuclear plants incur high operating and maintenance (OampM) costs because of the need for large site crews and extensive upkeep requirements for complex systems The typical headcount for a full-sized nuclear plant (around 1000 MW) is 800 people48 Many of the personnel positions relate to system monitoring accident preparedness security and maintenance activities The plants require frequent supplies such as makeup materials chemicals and gasesThe average OampM cost for US nuclear plants in 2018 was $1969MWh49 With an average capacity factor of 93 across the nuclear fleet this is equivalent to $160kW per year (combining fixed and variable OampM) Another data source for nuclear plants similar to the current fleet the US Energy Information Administration uses a fixed OampM cost of $103kW per year (equivalent to $1246MWh) and variable OampM cost of $237MWh in the latest version of their 2019 Annual Energy Outlook50 The variable OampM cost equates to $19kW after accounting for the average capacity factor leading to a combined fixed and variable OampM estimate of $122kW per year from this government source
Cost amp Performance Requirements for Flexible Advanced Nuclear Plants in Future US Power Markets 29
The flexible advanced nuclear plants in this modeling analysis are designed for more efficient operation than conventional nuclear plants They reflect the goal of utilizing concepts with superior safety and streamlined processes to reduce the need for complicated backup systems and large crews for monitoring accident preparedness etc Automation robotics and offsite controlresponse centers serving multiple units will also likely reduce staffing needs at advanced nuclear plants deployed in the 2030s As an example of staffing efficiencies at a new plant concept GE Hitachi anticipates a crew of 75 for its 300 MWe BWRX51
Staffing levels at natural gas and coal plants provide useful reference points for target operations at flexible advanced nuclear plants The US Department of Energy uses baseline crew counts of 5 people per shift (20 in total with 4 shifts) for a 630 MW natural gas combined-cycle plant and 14 people per shift (56 in total) for a 550 MW coal plant52 These staffing levels are highly relevant to the current context because the flexible advanced nuclear plants would have their turbine-generator system on a separate fluid loop from the reactor loop (a significant simplification in terms of safety and monitoring relative to conventional nuclear plants because no fluid in the turbine building would pass through the reactor)When Idaho National Laboratory assessed the potential costs of the Next Generation Nuclear Plant concept in 2010 the estimated crew headcount was 28 people for this High Temperature Gas Reactor with capacity of 274 MWe based on operational similarities with natural gas and coal plants53 The annual cost of staff insurance and taxes in this study is $11 million or $27kW-year After adjusting for currency inflation this value becomes $31kW-year in 2019 dollars (equivalent to $375MWh based on the capacity factor above)For this modeling analysis LucidCatalyst used the OampM estimate of $31kW-year from Idaho National Laboratoryrsquos 2010 study as the target level for flexible advanced nuclear plants in the 2030s The energy storage system is assumed to add no OampM costs to the plant because the potential medium such as firebrick or molten salt would simply charge and discharge energy by movements of air or other straightforward physical processes without the need for operators or maintenance activities The OampM parameter for the flexible advanced plants sets a clear goal for MEITNER Design Teams in their efforts to ensure the economic viability of their advanced nuclear concepts Subsequent sections of this report show the maximum allowable CapEx for flexible advanced nuclear plants based on this OampM parameter among other calculation inputs The maximum allowable CapEx would be lower (tighter constraint) in each market simulation if OampM costs were higher
Table 7 OampM and Fuel Assumptions
Category Value
OampM Cost $31kW-yr ($375 MWh)
Fuel Expenditures $444MWh ($37 kW-yr)
The OampM costs for the ESS system are assumed to be minimal54 and effectively immaterial as the ESS does not require fuel or significant operational expenses
Cost amp Performance Requirements for Flexible Advanced Nuclear Plants in Future US Power Markets 30
56 Modeling Result Categories
The following table summarizes the different PLEXOS model inputs and results
Table 8 PLEXOS Input and Result Categories
Inputs
Plant Capacities Plant capacities are inputs to PLEXOS (with adjustments by LucidCatalyst for baseline scenario calibration and flexible advanced nuclear additions) summed by plant type (natural gas solar wind etc) for regional total
Demand (load) Demand in each service territory is an input to PLEXOS summed across service territories for regional total
Results
Plant Operational Dispatch
PLEXOS determines the optimal combinations of plant production across the grid including output from the advanced nuclear plants to meet demand in each hour of the modeling period hourly dispatch is summed over year to calculate total generation by plant in 2034
Market Price PLEXOS calculates market price in each hour of the modeling period in each service territory based on the marginal costs of the marginal producer to meet demand market prices are averaged across service territories and hours in year to calculate average market price in 2034
CO2 Emissions PLEXOS uses plant operational dispatch fuel consumption per MWh and CO2 emission rate per unit of fuel consumption to calculate CO2 emissions from plant operation results are summed across plants and hours in year to calculate total CO2 emissions in each region in 2034
Advanced Nuclear Operational Dispatch
This is part of the broader plant dispatch results by hour described above
Energy Storage Charging and Discharging
PLEXOS optimizes the charging and discharging by hour for each energy storage system in the modeled region subject to the constraint limiting their hourly charging amount to the coupled nuclear plantrsquos production in the same hour
LucidCatalyst calculates maximum allowable CapEx by using operating profits which derives from a combination of PLEXOS results and supplemental assumptions (eg annual capacity payments)
Cost amp Performance Requirements for Flexible Advanced Nuclear Plants in Future US Power Markets 31
6 Illustrative Cash Flow AnalysisThis section presents a high-level cash flow analysis for an advanced nuclear plant with and without ESS This type of analysis is used to calculate maximum allowable CapEx and highlights key profitability drivers It also lays the foundation for understanding how different future market conditions can either threaten or enhance these drivers
As capital-intensive investments power plants recover CapEx over time from the difference between their annual revenue and operating expenditures In this section operating profits are calculated in this manner and presumed to be available for CapEx recovery Annual profits along with industry standard assumptions regarding payback period and interest rate are used to estimate maximum allowable CapEx expressed in $kWCalculating maximum allowable CapEx involves the following steps
1 Identify plant capacity and performance characteristics This involves specifying assumptions regarding plant capacity annual capacity factor and for the ESS round-trip efficiency (the total efficiency of one charge and discharge cycle)
2 Calculate wholesale energy revenue This step occurs in PLEXOS but simply includes a calculation whereby the clearing price is multiplied by the plantrsquos output (MW) in each hour This reflects scheduled down time for plant maintenance and other things (eg refueling) that might affect the plantrsquos annual capacity factor
3 Add capacity payments In addition to wholesale energy revenue LucidCatalyst assumes that the advanced nuclear plant receives capacity payments This step applies a range of potential capacity prices in $kW per year and shows the calculated payments
4 Calculate operating expenditures The three components of operating expenditures for the flexible advanced nuclear plantmdashfuel variable OampM and fixed OampMmdashare summed in this step
5 Calculate operating profit for CapEx recovery The difference between annual revenue (summing wholesale energy revenue with capacity payments) and annual operating expenditures (summing fuel fixed OampM and variable OampM) represents the operating profit per year for CapEx recovery The implied maximum allowable CapEx is derived from the annual operating profit which is based on additional financial parameters such as financing rates and the allowed length of time to pay back the lender
61 Estimating Annual Revenue for a 500 MW Illustrative Plant
Estimating annual revenue includes only two components energy revenue and capacity payments
611 Energy RevenueEnergy revenue is driven by market prices and how many hours each system is operating at its maximum output For the purposes of this illustrative cash flow analysis the average clearing price over the year is $22MWh which is within the range of modeled prices in 2034 For plants with ESS the
Cost amp Performance Requirements for Flexible Advanced Nuclear Plants in Future US Power Markets 32
amount of energy sent to storage will be different for each market due to pricing conditions However for the purposes of this analysis it is assumed that 25 of the nuclear plant output is to go toward charging the ESS system (which is similar to what bears out in PLEXOS) Because the ESS system is optimized to discharge when prices are at their highest the average clearing prices at which the ESS sells power is $25MWh (as opposed to $22MWh) Also because the nuclear plant charges the ESS when prices are at their lowest the average clearing price for the rest of the energy sent to the grid is slightly higher than the annual average For this analysis this is assumed to be $2250MWh The following table represents the energy revenue for each plant configuration
Table 9 Energy Revenue for Each Plant Configuration
Dispatch from Adv Nuclear Plant Total MWh Average Clearing Price (MWh)
Total Energy Revenue
Without ESS
500 MW Nuclear Plant Capacity 500 MW x
Capacity Factor 92 x
8760 hoursyear
403 million $22 $886 million
With ESS
500 MW Nuclear Plant Capacity 500 MW x
Capacity Factor 92 x
75 of output sent to grid 6570 hoursyear
302 million $2250 $68 million
500 MW
ESS System
Capacity 500 MW x
Capacity Factor 92 x
Roundtrip Efficiency 90 x
12-hours avg daily output 4380 hoursyear
907660 $25 $227 million
Total $907 million
The difference in energy revenue between the two configurations is largely driven by the delta between the two average clearing prices and roundtrip efficiency It is also important to note that revenues are sensitive to the input assumptions regarding capacity factor roundtrip efficiency and the systemrsquos power rating and discharge capacity (duration) Making significant modifications to these parameters can materially impact revenues Other thermal storage characteristics (ie thermal stability heat conductivity response time etc) are excluded from the example and assumed to have immaterial consequences on the systemsrsquo operation
Cost amp Performance Requirements for Flexible Advanced Nuclear Plants in Future US Power Markets 33
612 Capacity Revenue In addition to energy sales nuclear plants also typically receive some form of capacity payment Capacity programs encourage resources to be built andor made available during periods with high demand This analysis uses three hypothetical capacity prices $50 $75 or $100kW per year (the middle value of $75kW per year reflects the approximate average of capacity prices in ISO New England recently and a higher-end capacity price seen in recent PJM auctions) There is inherent uncertainty regarding future price levels as capacity programs continue to evolve however if energy prices continue to fall one could argue that stimulating new project investment in such an environment would warrant higher capacity pricesA $75kW-year capacity payment translates to $375 million for the plant without co-located energy storage Plants with 12 hours of energy storage can effectively supply 1000 MW of power through two 500 MW turbine-generators As mentioned in the previous section LucidCatalyst assumes that the ESS receives a full capacity payment as well This translates to an annual capacity payment of $75 million for the plant with storage
62 OampM Expenditures
The following table highlights the OampM expenses for the illustrative plant OampM for the ESS is assumed to be de minimis and because the advanced nuclear plant operates at the same output under both configurations the OampM expenditures are assumed to be the same under both configurations
Table 10 Advanced Nuclear Plant OampM Expenditures
Cost Category Calculation Estimated Value
OampM $31kW-yr ($375MWh) X 500 MW $15 million
Fuel $444MWh X 4073400 MWhs $18 million
Total $33 million
63 Maximum CapEx
Calculating maximum allowable CapEx involves calculating the total annual revenue (energy revenue and capacity payments) and subtracting the total annual operating expenditures (fixed and variable OampM) The result is the annual operating profit which along with a capital recovery period (eg 22 years) and cost of capital (reflected here as the interest rate) is used to calculated maximum allowable CapEx for a breakeven profit The table below estimates this for both plant configurations
Cost amp Performance Requirements for Flexible Advanced Nuclear Plants in Future US Power Markets 34
Table 11 Estimated Annual Plant Revenue Expenditures and Operating Profits for CapEx Recovery ndash Without ESS and With ESS
Illustrative Analysis Without ESS With ESS
Scenario Specifications
of Nuclear Plants 1 1
Reactor Capacity 500 MWe 500 MWe
Avg Annual Capacity Factor 92 92
of Annual Output to ESS System ndash 50
Revenue
Nuclear Plant ndash Avg Energy Price Received $22MWh $22MWh
Nuclear Plant ndash Direct Sales Revenue $90 M $45 M
Nuclear amp ESS ndash Avg Energy Price Received ndash $28MWh
ESS Net Generation Revenue ndash $51 M
Total System Energy Revenue $90 M $96 M
Total Revenue
Low (assumes $50kW-yr capacity payment) $115 M $146 M
Mid (assumes $75kW-yr capacity payment) $127 M $171 M
High (assumes $100kW-yr capacity payment) $140 M $196 M
Expenditures
Fuel Expenditures $18 M $18 M
Other Variable OampM Expenditures $0 M $0 M
Fixed OampM Expenditures $15 M $15 M
Total Operating Expenditures $33 M $33 M
Operating Profits for CapEx Recovery
Low Capacity Price Case $81 M $113 M
Mid Capacity Price Case $94 M $138 M
High Capacity Price Case $106 M $163 M
Maximum Plant CapEx for Profit Breakeven
Low Capacity Price Case $1798kW $2496kW
Mid Capacity Price Case $2075kW $3049kW
High Capacity Price Case $2351kW $3602kW
The following figure shows the ranges of maximum allowable CapEx with or without energy storage based on the parameter assumptions described above Pink cells indicate unfavorable combinations of low energy and capacity prices leading to tight limits on CapEx while green cells indicate favorable combinations of high prices leading to higher allowable CapEx The lower pane for the case without energy storage has tighter limits on CapEx than the upper pane with energy storage because of foregone capacity payments
With ES $50kW-yr $60kW-yr $70kW-yr $75kW-yr $80 kW-yr $90kW-yr $100kW-yr
$10MWh $1225 $1446 $1667 $1778 $1888 $2110 $2331
$15MWh $1653 $1874 $2095 $2206 $2317 $2538 $2759
$20MWh $2081 $2302 $2523 $2634 $2745 $2966 $3187
$22MWh $2252 $2473 $2695 $2805 $2916 $3137 $3358
$24MWh $2423 $2645 $2866 $2976 $3087 $3308 $3529
$26MWh $2595 $2816 $3037 $3148 $3258 $3479 $3701
$28MWh $2766 $2987 $3208 $3319 $3429 $3651 $3872
$30MWh $2937 $3158 $3379 $3490 $3601 $3822 $4043
$35MWh $3365 $3586 $3807 $3918 $4029 $4250 $4471
$40MWh $3793 $4014 $4235 $4346 $4457 $4678 $4899
Without ES $50 kW-yr $60kW-yr $70kW-yr $75kW-yr $80kW-yr $90kW-yr $100kW-yr
$10MWh $717 $827 $938 $993 $1049 $1159 $1270
$15MWh $1167 $1278 $1389 $1444 $1499 $1610 $1720
$20MWh $1618 $1729 $1839 $1894 $1950 $2060 $2171
$22MWh $1798 $1909 $2019 $2075 $2130 $2241 $2351
$24MWh $1978 $2089 $2200 $2255 $2310 $2421 $2531
$26MWh $2159 $2269 $2380 $2435 $2490 $2601 $2712
$28MWh $2339 $2449 $2560 $2615 $2671 $2781 $2892
$30MWh $2519 $2630 $2740 $2796 $2851 $2962 $3072
$35MWh $2970 $3080 $3191 $3246 $3301 $3412 $3523
$40MWh $3420 $3531 $3641 $3697 $3752 $3863 $3973
$1225 $1446 $1667 $1778 $1888 $2110 $2331
$1653 $1874 $2095 $2206 $2317 $2538 $2759
$2081 $2302 $2523 $2634 $2745 $2966 $3187
$2252 $2473 $2695 $2805 $2916 $3137 $3358
$2423 $2645 $2866 $2976 $3087 $3308 $3529
$2595 $2816 $3037 $3148 $3258 $3479 $3701
$2766 $2987 $3208 $3319 $3429 $3651 $3872
$2937 $3158 $3379 $3490 $3601 $3822 $4043
$3365 $3586 $3807 $3918 $4029 $4250 $4471
$3793 $4014 $4235 $4346 $4457 $4678 $4899
$717 $827 $938 $993 $1049 $1159 $1270
$1167 $1278 $1389 $1444 $1499 $1610 $1720
$1618 $1729 $1839 $1894 $1950 $2060 $2171
$1798 $1909 $2019 $2075 $2130 $2241 $2351
$1978 $2089 $2200 $2255 $2310 $2421 $2531
$2159 $2269 $2380 $2435 $2490 $2601 $2712
$2339 $2449 $2560 $2615 $2671 $2781 $2892
$2519 $2630 $2740 $2796 $2851 $2962 $3072
$2970 $3080 $3191 $3246 $3301 $3412 $3523
$3420 $3531 $3641 $3697 $3752 $3863 $3973
Cost amp Performance Requirements for Flexible Advanced Nuclear Plants in Future US Power Markets 35
Figure 9 Ranges of Maximum Allowable CapEx ($kW) ndash With ESS and Without ESS
Cost amp Performance Requirements for Flexible Advanced Nuclear Plants in Future US Power Markets 36
7 PLEXOS Modeling Results for 2034This section presents results from modeling flexible advanced nuclear plants with and without energy storage in the four identified markets (ISO New England PJM MISO and CAISO) Each subsection presents the baseline 2034 resource mix and then the CapEx for the first plant entering the market (with and without storage)
71 ISO New England
The table below highlights the total plant capacity by resource as well as the annual generation in all modeled scenarios in ISO-NE Most of the capacity and generation in this market comes from natural gas Most of the wind capacity in this market is offshore
Table 12 Resource Capacity and Generation in ISO-NE for the Modeled Scenarios
Installed Capacity amp Generation
Total Coal Nat Gas
Oil Existing Nuclear
Hydro Solar Wind BioOther
Net Imports Exports1
2018 Benchmark
GW 35 1 15 6 3 4 1 1 4 ndash
TWh 124 1 67 0 25 8 1 3 10 -10
2034 Low RE Future
GW 44 1 19 6 3 4 4 3 5 ndash
TWh 110 0 43 0 25 8 7 8 10 -9
2034 High RE Future
GW 47 0 16 4 3 4 9 7 5 ndash
TWh 110 0 28 0 25 8 18 21 10 -2
1 Imports are negative exports are positive
A separate table below summarizes PLEXOS results for annual average market prices revenue and operating expenditures for ISO-NE in the various scenarios It also presents the maximum allowable CapEx which for all four ISO modeling results reflects the financial assumptions of a 22-year CapEx recovery period55 and a 50-50 split of debt and equity financing with a weighted average cost of capital (WACC) of 756
Cost amp Performance Requirements for Flexible Advanced Nuclear Plants in Future US Power Markets 37
Table 13 PLEXOS Results for ISO-NE
Low RE Future wout ESS
with ESS
High RE Future wout ESS
with ESS
Scenario Specifications
of Nuclear Plants 1 1 1 1
Reactor Capacity 500 MWe 500 MWe 500 MWe 500 MWe
Representative Load Zone Mass Central Mass Central Mass Central Mass Central
Annual Avg Energy Market Price $2756MWh $2757MWh $2367MWh $2390MWh
Avg Annual Capacity Factor 92 92 85 86
of Annual Output to ESS System ndash 24 ndash 31
Revenue
Nuclear Plant ndash Avg Energy Price Received $2773MWh $2771MWh $2580MWh $2572MWh
Nuclear Plant ndash Direct Sales Revenue $112 M $84 M $96 M $66 M
Nuclear amp ESS ndash Avg Energy Price Received ndash $2976MWh ndash $2970MWh
ESS Net Generation Revenue ndash $33 M ndash $42 M
Total System Energy Revenue $112 M $117 M $96 M $108 M
Total Revenue
Low (assumes $50kW-yr capacity payment) $137 M $167 M $121 M $158 M
Mid (assumes $75kW-yr capacity payment) $149 M $192 M $133 M $183 M
High (assumes $100kW-yr capacity payment) $162 M $217 M $146 M $208 M
Expenditures
Fuel Expenditures $18 M $18 M $16 M $17 M
Other Variable OampM Expenditures $0 M $0 M $0 M $0 M
Fixed OampM Expenditures $15 M $15 M $15 M $15 M
Total Operating Expenditures $33 M $33 M $32 M $32 M
Operating Profits for CapEx Recovery
Low Capacity Price Case $103 M $134 M $89 M $126 M
Mid Capacity Price Case $116 M $159 M $101 M $151 M
High Capacity Price Case $128 M $184 M $114 M $176 M
Maximum Plant CapEx for Profit Breakeven
Low Capacity Price Case $2289kW $2962kW $1965kW $2788kW
Mid Capacity Price Case $2566kW $3515kW $2242kW $3341kW
High Capacity Price Case $2843kW $4068kW $2519kW $3894kW
Cost amp Performance Requirements for Flexible Advanced Nuclear Plants in Future US Power Markets 38
72 PJM
The tables below highlight the total plant capacity by resource (including the annual generation in all modeled scenarios) as well as a summary of the PLEXOS results for PJM This market has the most coal capacity and generation of the four markets modeled in this analysis The High RE Future has several times more solar and wind capacity and generation than the Low RE Future This market is modeled without neighboring zones (no imports or exports) because of its large geographic breadth
Table 14 Resource Capacity and Generation in PJM for the Modeled Scenarios
Installed Capacity amp Generation
Total Coal Nat Gas
Oil Existing Nuclear
Hydro Solar Wind BioOther
Net Imports Exports1
2018 Benchmark
GW 203 57 75 6 32 9 1 7 15 ndash
TWh 806 364 140 0 247 5 2 20 28 ndash
2034 Low RE Future
GW 239 55 111 6 25 9 7 11 15 ndash
TWh 869 253 351 0 186 5 15 32 27 ndash
2034 High RE Future
GW 281 3 111 6 23 9 64 50 15 ndash
TWh 869 22 361 0 170 5 129 154 27 ndash
1 PJM is modeled without neighboring zones (no imports or exports)
Cost amp Performance Requirements for Flexible Advanced Nuclear Plants in Future US Power Markets 39
Table 15 PLEXOS Results for PJM
Low RE Future wout ESS
with ESS
High RE Future wout ESS
with ESS
Scenario Specifications
of Nuclear Plants 1 1 1 1
Reactor Capacity 500 MWe 500 MWe 500 MWe 500 MWe
Representative Load Zone PEPCO PEPCO PEPCO PEPCO
Annual Avg Energy Market Price $2839MWh $2847MWh $2646MWh $2644MWh
Avg Annual Capacity Factor 92 92 91 92
of Annual Output to ESS System ndash 20 ndash 20
Revenue
Nuclear Plant ndash Avg Energy Price Received $2834MWh $2844MWh $2669MWh $2639MWh
Nuclear Plant ndash Direct Sales Revenue $115 M $92 M $107 M $72 M
Nuclear amp ESS ndash Avg Energy Price Received ndash $2981MWh ndash $3076MWh
ESS Net Generation Revenue ndash $26 M ndash $48 M
Total System Energy Revenue $115 M $118 M $107 M $121 M
Total Revenue
Low (assumes $50kW-yr capacity payment) $140 M $168 M $132 M $171 M
Mid (assumes $75kW-yr capacity payment) $152 M $193 M $144 M $196 M
High (assumes $100kW-yr capacity payment) $165 M $218 M $157 M $221 M
Expenditures
Fuel Expenditures $18 M $18 M $18 M $18 M
Other Variable OampM Expenditures $0 M $0 M $0 M $0 M
Fixed OampM Expenditures $15 M $15 M $15 M $15 M
Total Operating Expenditures $33 M $33 M $33 M $33 M
Operating Profits for CapEx Recovery
Low Capacity Price Case $107 M $135 M $99 M $137 M
Mid Capacity Price Case $119 M $160 M $111 M $162 M
High Capacity Price Case $132 M $185 M $124 M $187 M
Maximum Plant CapEx for Profit Breakeven
Low Capacity Price Case $2358kW $2988kW $2186kW $3038kW
Mid Capacity Price Case $2634kW $3541kW $2462kW $3591kW
High Capacity Price Case $2911 kW $4095kW $2739kW $4144kW
Cost amp Performance Requirements for Flexible Advanced Nuclear Plants in Future US Power Markets 40
73 MISO
The tables below highlight the total plant capacity by resource (including the annual generation in all modeled scenarios) as well as a summary of the PLEXOS results for MISO The market has high wind penetration especially in the High RE Future
Table 16 Resource Capacity and Generation in MISO for the Modeled Scenarios
Installed Capacity amp Generation
Total Coal Nat Gas
Oil Existing Nuclear
Hydro Solar Wind BioOther
Net Imports Exports1
2018 Benchmark
GW 175 61 71 4 13 5 1 18 3 ndash
TWh 709 372 149 0 97 9 2 56 25 0
2034 Low RE Future
GW 229 59 117 3 8 4 9 25 3 ndash
TWh 838 124 392 0 65 9 19 83 25 -122
2034 High RE Future
GW 243 4 99 3 8 4 51 70 3 ndash
TWh 838 16 295 0 65 9 109 253 24 -67
1 Imports are negative exports are positive
Cost amp Performance Requirements for Flexible Advanced Nuclear Plants in Future US Power Markets 41
Table 17 PLEXOS Results for MISO
Low RE Future wout ESS
with ESS
High RE Future wout ESS
with ESS
Scenario Specifications
of Nuclear Plants 1 1 1 1
Reactor Capacity 500 MWe 500 MWe 500 MWe 500 MWe
Representative Load Zone S Illinois S Illinois S Illinois S Illinois
Annual Avg Energy Market Price $2717MWh $2717MWh $2416MWh $2416MWh
Avg Annual Capacity Factor 92 92 92 92
of Annual Output to ESS System ndash 20 ndash 26
Revenue
Nuclear Plant ndash Avg Energy Price Received $2721MWh $2721MWh $2452MWh $2447MWh
Nuclear Plant ndash Direct Sales Revenue $110 M $88 M $98 M $73 M
Nuclear amp ESS ndash Avg Energy Price Received ndash $2844MWh ndash $2628MWh
ESS Net Generation Revenue ndash $24 M ndash $30 M
Total System Energy Revenue $110 M $112 M $98 M $103 M
Total Revenue
Low (assumes $50kW-yr capacity payment) $135 M $162 M $123 M $153 M
Mid (assumes $75kW-yr capacity payment) $147 M $187 M $136 M $178 M
High (assumes $100kW-yr capacity payment) $160 M $212 M $148 M $203 M
Expenditures
Fuel expenditures $18 M $18 M $18 M $18 M
Other Variable OampM Expenditures $0 M $0 M $0 M $0 M
Fixed OampM Expenditures $15 M $15 M $15 M $15 M
Total Operating Expenditures $33 M $33 M $33 M $33 M
Operating Profits for CapEx Recovery
Low Capacity Price Case $101 M $129 M $90 M $120 M
Mid Capacity Price Case $114 M $154 M $103 M $145 M
High Capacity Price Case $126 M $179 M $115 M $170 M
Maximum plant CapEx for Profit Breakeven
Low Capacity Price Case $2244kW $2857kW $2000kW $2654kW
Mid Capacity Price Case $2521kW $3410kW $2276kW $3207kW
High Capacity Price Case $2797kW $3963kW $2553kW $3760kW
Cost amp Performance Requirements for Flexible Advanced Nuclear Plants in Future US Power Markets 42
74 CAISO
The tables below highlight the total plant capacity by resource (including the annual generation in all modeled scenarios) as well as a summary of the PLEXOS results for CAISO This market has high solar and wind penetration especially in the High RE Future
Table 18 Resource Capacity and Generation in CAISO for the Modeled Scenarios
Installed Capacity amp Generation
Total Coal Nat Gas
Oil Existing Nuclear
Hydro Solar Wind BioOther
Net Imports Exports1
2018 Benchmark
GW 74 0 39 0 2 14 9 6 3 ndash
TWh 261 0 116 0 16 37 24 15 10 -42
2034 Low RE Future
GW 86 0 35 0 0 14 23 10 3 ndash
TWh 272 0 61 0 0 37 65 28 10 -70
2034 High RE Future
GW 88 0 30 0 0 11 34 10 3 ndash
TWh 272 0 49 0 0 28 97 28 10 -61
1 Imports are negative exports are positive
Table 19 PLEXOS results for CAISO
Low RE Future wout ESS
with ESS
High RE Future wout ESS
with ESS
Scenario Specifications
of Nuclear Plants 1 1 1 1
Reactor Capacity 500 MWe 500 MWe 500 MWe 500 MWe
Representative Load Zone San Diego San Diego San Diego San Diego
Annual Avg Energy Market Price $2579MWh $2595MWh $2273MWh $2266MWh
Avg Annual Capacity Factor 79 92 67 91
of Annual Output to ESS System ndash 33 ndash 34
Revenue
Nuclear Plant ndash Avg Energy Price Received $3021MWh $2632MWh $3150MWh $2326MWh
Cost amp Performance Requirements for Flexible Advanced Nuclear Plants in Future US Power Markets 43
Low RE Future wout ESS
with ESS
High RE Future wout ESS
with ESS
Nuclear Plant ndash Direct Sales Revenue $104 M $71 M $92 M $61 M
Nuclear amp ESS ndash Avg Energy Price Received ndash $3507MWh ndash $3448MWh
ESS Net Generation Revenue ndash $65 M ndash $71 M
Total System Energy Revenue $104 M $137 M $92 M $132 M
Total Revenue
Low (assumes $50kW-yr capacity payment) $129 M $187 M $117 M $182 M
Mid (assumes $75kW-yr capacity payment) $142 M $212 M $130 M $207 M
High (assumes $100kW-yr capacity payment) $154 M $237 M $142 M $232 M
Expenditures
Fuel Expenditures $15 M $18 M $13 M $18 M
Other Variable OampM Expenditures $0 M $0 M $0 M $0 M
Fixed OampM Expenditures $15 M $15 M $15 M $15 M
Total Operating Expenditures $31 M $33 M $28 M $33 M
Operating Profits for CapEx Recovery
Low Capacity Price Case $99 M $154 M $89 M $149 M
Mid Capacity Price Case $111 M $179 M $101 M $174 M
High Capacity Price Case $124 M $204 M $114 M $199 M
Maximum plant CapEx for Profit Breakeven
Low Capacity Price Case $2187kW $3397kW $1968kW $3306kW
Mid Capacity Price Case $2464kW $3950kW $2244kW $3859kW
High Capacity Price Case $2740kW $4503kW $2521kW $4412kW
75 Summary and Modeling Result Implications
The PLEXOS and financial modeling results in a range of maximum allowable CapEx As shown in the preceding tables this range is largely driven by capacity payments the addition of ESS and the average energy price which is driven by the assumption of continued low natural gas prices and the two different renewables scenarios in 2034 These highlight several implications for advanced reactor developers
n The addition of energy storage may improve a projectrsquos economics but this is dependent on several factors The ESS captures higher average energy prices as it is optimized to charge during the lowest priced hours and sells during the highest priced hours However the amount of CapEx that can be budgeted for the ESS depends on the Low RE vs High RE scenario and importantly the available capacity payment For example the CapEx threshold for ESS in MISO in the Low RE scenario and $25kW-year capacity payment is only $613kW At present there are no commercially available ESS options at this price Conversely assuming the High RE scenario in CAISO and a $100kW-year capacity payment the allowable CapEx for the ESS is $1891kW LucidCatalystrsquos high-level cost analysis for thermal ESS in Appendix E suggests that this is possible using todayrsquos technologies and costs especially for reactor designs with higher outlet temperatures It is highly likely that these will be
Figure 18
0
2
4
6
8
10
12
14
16
18
20
1 2 3 4 5 6 7 8 9 10 11 12
Perc
enta
ge o
f Dis
char
ge E
vent
s
Length of Discharge (Hours)
Cost amp Performance Requirements for Flexible Advanced Nuclear Plants in Future US Power Markets 44
significantly cheaper by 2034 Also as shown in Appendix D projections for electrochemical storage systems (ie batteries) are expected to be well below that cost (even for a 12-hour system) by 2034 Therefore developers should be aware of the potential for storage to impact a projectrsquos bottom line and will want to consider it based on specific market conditions
n It is important to note that capacity payments are a major source of assumed revenue For plants without ESS each additional $50kW-year adds $277kW to a plantrsquos maximum allowable CapEx For plants with ESS this amount is doubled to $553kW One a related note while LucidCatalyst assumed a 12-hour ESS on average the system typically discharged for only 4 hours exceeding an 8-hour discharge only 12 of the time (see Figure 18) Developers should therefore track ifhow performance requirements for capacity payments change over time and weigh the savings of a smaller ESS with the probability of paying non-performance penalties
n Advanced reactor developers should note that higher RE penetrations reduce average energy prices (and thus allowable CapEx) If the assumed VRE penetration is too conservative in these scenarios the effective maximum allowable CapEx will likely be lower Higher VRE penetration will trigger more aggressive ramping and potentially higher prices during critical peak demand periods While this may benefit highly flexible and dispatchable resources like advanced nuclear plants this will also lead to lower capacity factors and a likely decline in average energy prices To the extent these factors affect revenues maximum allowable CapEx may be lower
Figure 10 Frequency of Different Discharge Durations
Cost amp Performance Requirements for Flexible Advanced Nuclear Plants in Future US Power Markets 45
8 Additional Modeling Analyses The Results section above highlights the 2034 CapEx requirements under a highly specific set of assumptions Several different scenarios may play out and it is worth exploring other future outcomes to understand their impact on CapEx requirements
This section examines three additional modeling analyses 1 Effect of CO2 Prices 2 Market Penetration Potential 3 Impact on Allowable CapEx from Alternative Fixed OampM Assumption
1 Effect of CO2 Prices There are six bills in the 116th US Congress that establish a CO2 price with escalators that increase the price over time57 Further seventeen states have introduced some form of carbon pricing legislation including the California and the ten states that makes up the Regional Greenhouse Gas Initiative (RGGI) which already have a variable CO2 price58 One could reasonably argue that there is a non-zero probability of a carbon pricing scheme going into effect by 2034 While current proposals differ in carbon price and rate of escalation the most conservative proposals set a CO2 price of around $50tonne by 2034 This modeling analysis examines how a $50tonne CO2 price with side cases of $25 and $75tonne would affect revenue and the maximum allowable CapEx for advanced nuclear plants
2 Market Penetration Potential Assuming the operational characteristics of a flexible advanced nuclear plant are similar to a CCGT it is worth estimating the extent to which these resources can be deployed without significantly reducing energy prices (due to their low-price energy bids) Advanced reactor developers may want to simultaneously develop more than one project in the same ISO and it is valuable to understand how many plants each market can accommodate and how that might affect the overall cost of electricity delivery
3 Impact on Allowable CapEx from Alternative Fixed OampM Assumption This study considers a relatively low fixed OampM assumption of $31kW-year which is ~70 lower than the fixed OampM assumed for todayrsquos conventional nuclear fleet (~$103kW-year) While LucidCatalyst recognizes that this a realistic goal for advanced reactor developers to target it is also worth exploring how higher fixed OampM might impact maximum allowable CapEx This analysis considers a fixed OampM of $61kW-year a halving of todayrsquos fixed OampM cost estimate
81 Effect of CO2 Prices
To measure the impact of a CO2 price on allowable CapEx LucidCatalyst ran three additional scenarios for PJM $25 $50 and $75tonne CO2 prices do not cause fossil plants to retire in the PLEXOS simulations (ie capacity levels are the same between these simulations and the High Renewables Future described above) because this analysis uses a consistent methodology of considering plant capacity as a deterministic modeling input for each simulation Based on their CO2 emission rates (approximately 1 tonne per MWh for coal plants and 04 tonnes for combined-cycle natural gas plants) applying the CO2 price of $50tonne inflates fossil generatorsrsquo marginal costs by approximately $50MWh
Cost amp Performance Requirements for Flexible Advanced Nuclear Plants in Future US Power Markets 46
for coal plants and $20MWh for combined-cycle natural gas plants which significantly raises market prices and impacts the allowable CapEx for the first flexible advanced nuclear plant that wishes to enter the market The following tables show the PLEXOS modeling resultsmdashwithout and with energy storage
Table 20 CO2 Price Scenarios for PJM without Energy Storage
No CO2 Price $25tonne $50tonne $75tonne
Scenario Specifications
of Nuclear Plants 1 1 1 1
Reactor Capacity 500 MWe 500 MWe 500 MWe 500 MWe
Representative Load Zone PEPCO PEPCO PEPCO PEPCO
Annual Avg Energy Market Price $2646MWh $3706MWh $4757MWh $5788MWh
Nuclear amp ESS Annual Capacity Factor 91 92 92 92
Total System Energy Revenue $107 M $150 M $192 M $234 M
Maximum Plant CapEx for Profit Breakeven
Low Capacity Price Case $2186kW $3132kW $4074kW $4999kW
Mid Capacity Price Case $2462kW $3409kW $4351kW $5276kW
High Capacity Price Case $2739kW $3685kW $4627kW $5552 kW
Table 21 CO2 Price Scenarios for PJM with Energy Storage
No CO2 Price $25tonne $50tonne $75tonne
Scenario Specifications
of Nuclear Plants 1 1 1 1
Reactor Capacity 500 MWe 500 MWe 500 MWe 500 MWe
Representative Load Zone PEPCO (DC) PEPCO PEPCO PEPCO
Annual Avg Energy Market Price $2644MWh $3703MWh $4754MWh $5786MWh
Nuclear amp ESS Annual Capacity Factor 92 92 92 92
Cost amp Performance Requirements for Flexible Advanced Nuclear Plants in Future US Power Markets 47
No CO2 Price $25tonne $50tonne $75tonne
Total System Energy Revenue $121 M $165 M $211 M $257 M
Maximum Plant CapEx for Profit Breakeven
Low Capacity Price Case $3038kW $4031kW $5043kW $6056kW
Mid Capacity Price Case $3591kW $4584kW $5596kW $6609kW
High Capacity Price Case $4144kW $513kW $614kW $7162kW
82 Market Penetration Potential
Advanced nuclear plants provide the same baseload and responsive load-following characteristics as the existing fossil fleet yet they have much lower operating costs By 2034 a sizeable percentage of natural gas plants will be getting close to their retirement Absent fundamental changes to energy markets if advanced nuclear plants ever supply the majority of firm baseload power as the primary marginal resource (setting the energy price) energy prices will begin to rapidly decline due to advanced nuclearrsquos low price energy bids This would significantly impact the economics of most grid resourcesmdashincluding advanced nuclear plants It is therefore worth exploring the market penetration limits of advanced nuclear plants before they begin to materially impact energy pricesmdashand consequently their own CapEx requirements To highlight potential market penetration without significant impact on CapEx requirements LucidCatalyst modeled the 2034 High RE resource mix and supplied the majority of firm baseload power with advanced nuclear plants and co-located ESS Other power plant capacity levels remained unaffected Table 22 below highlights the addition of 168 GWs of flexible advanced nuclear reactors relative to the baseline scenario
Table 22 2034 High RE Baseline and Fleet Deployment of Advanced Nuclear Plants
Installed Capacity amp Generation
Total Coal Nat Gas
Oil Existing Nuclear
Flexible Adv Nuclear
Hydro Solar Wind BioOther
Net Imports Exports1
ISO-NE
GW 46 0 5 4 3 10 4 9 7 5 ndash
TWh 111 0 9 0 24 39 8 18 21 9 +17
PJM
GW 284 3 41 6 23 72 9 64 50 15 ndash
TWh 872 19 96 1 165 276 5 129 154 27 ndash
Cost amp Performance Requirements for Flexible Advanced Nuclear Plants in Future US Power Markets 48
Installed Capacity amp Generation
Total Coal Nat Gas
Oil Existing Nuclear
Flexible Adv Nuclear
Hydro Solar Wind BioOther
Net Imports Exports1
MISO
GW 245 4 35 3 8 66 4 51 70 3 ndash
TWh 840 12 94 0 65 247 9 109 253 24 -26
CAISO
GW 91 0 13 0 0 20 11 34 10 3 ndash
TWh 272 0 3 0 0 75 27 97 28 9 -33
1 Imports are negative exports are positive
In this lsquofleet deployment scenariorsquo annual average market prices drop in all four ISOs due to nuclear plants operating lsquoon the marginrsquo for more hours as shown in Table 23 below
Table 23 Annual Average Market Prices for ISO-NE PJM MISO and CAISO
Average Annual Energy Price
ISO NE
High RE Future (Without Flexible Adv Nuc) $2632MWh
Fleet Deployment of Flex Adv Nuc $2264MWh
PJM
High RE Future (Without Flexible Adv Nuc) $2703MWh
Fleet Deployment of Flex Adv Nuc $2267MWh
MISO
High RE Future (Without Flexible Adv Nuc) $2613MWh
Fleet Deployment of Flex Adv Nuc $2470MWh
CAISO
High RE Future (Without Flexible Adv Nuc) $3806MWh
Fleet Deployment of Flex Adv Nuc $2961MWh
020000400006000080000
100000120000140000160000180000
July 16 July 17 July 18 July 19 July 20 July 21 July 22
MW
Oil Natural Gas
Coal Adv Nuc + ESS
Solar Wind
Hydro BioOther
Existing Nuclear
Cost amp Performance Requirements for Flexible Advanced Nuclear Plants in Future US Power Markets 49
The flexible performance of the advanced nuclear fleet becomes apparent in reviewing hourly modeling results for a representative summer week in 2034 (July 16 ndash 22) In summer cooling demand is typically high and peaks in the afternoons between 2 to 3 pm Because of high cooling demand during weekdays peaks are higher during weekdays than weekends as shown in the following figure
Figure 11 Dispatch Profile for PJM with Majority of Firm Power Supplied by Advanced Nuclear Plants
As expected having more advanced nuclear plants reduces annual energy clearing prices and thus reduces the maximum allowable CapEx by ~$500kW less than the CapEx requirements for the first plant A striking finding of this analysis is how advanced nuclear plants with ESS can actually lower the cost of serving load across the ISO Figure 12 below shows a subset of the total costs of serving annual loadmdashisolating just energy costs and capacity payments to natural gas and advanced nuclear plants Assuming all other costs (ancillary services transmission costs uplift payments imports etc) are held constant the amount spent on capacity for both natural gas and advanced nuclear falls slightly and energy costs drop by over $3 billion
Figure 20
$0
$5
$10
$15
$20
$25
$30
$35
2018 High RE Future(No Adv Nuc Plants)
High RE Future(w Adv Nuc w ESS)
Bill
ions
($U
SD)
Adv Nuc + ESS Capacity Payments
Nat Gas Capacity Payments
Energy
Cost amp Performance Requirements for Flexible Advanced Nuclear Plants in Future US Power Markets 50
Figure 12 Total Cost of Serving Annual Load Energy and Select Capacity Payments
83 Impact on Allowable CapEx from Alternative Fixed OampM Assumption
As discussed above in Section 552 the base case calculations use $31kW-year (equivalent to $375MWh) for the combined fixed and variable OampM costs of flexible advanced nuclear plants The base case value is a significant reduction from current OampM costs at nuclear plants and serves as an ambitious target to guide nuclear designers in their pursuit of market viabilityAs a side case the following table presents maximum allowable CapEx results assuming a less ambitious target for OampM costs In particular this side case posits a 50 reduction from the combined OampM cost of $122kW-year used by the Energy Information Administration in the latest version of the Annual Energy Outlook This alternative assumption of $61kW-year ($750MWh) for combined OampM costs is double the base case assumption cited aboveThe higher OampM costs in the alternative case lead to lower maximum allowable CapEx for flexible advanced nuclear plants with or without energy storage plants as shown in the following table Relative to the base case results all results of maximum allowable CapEx have tightened by $337kW because of higher OampM costs
Cost amp Performance Requirements for Flexible Advanced Nuclear Plants in Future US Power Markets 51
Table 24 Maximum Allowable CapEx by ISO and Scenario ($kW) with Higher OampM Cost Input
Low RE wout ESS
with ESS
High RE wout ESS
with ESS
ISO-NE
Low Capacity Price Case ($50kW-yr) $1952 $2625 $1628 $2450
Mid Capacity Price Case ($75kW-yr) $2229 $3178 $1905 $3003
High Capacity Price Case ($100kW-yr) $2505 $3731 $2181 $3557
Difference from Base Case ($kW) -$337
PJM
Low Capacity Price Case ($50kW-yr) $2021 $2651 $1848 $2701
Mid Capacity Price Case ($75kW-yr) $2297 $3204 $2125 $3254
High Capacity Price Case ($100kW-yr) $2574 $3757 $2401 $3807
Difference from Base Case ($kW) -$337
MISO
Low Capacity Price Case ($50kW-yr) $1907 $2520 $1663 $2316
Mid Capacity Price Case ($75kW-yr) $2184 $3073 $1939 $2869
High Capacity Price Case ($100kW-yr) $2460 $3626 $2216 $3422
Difference from Base Case ($kW) -$337
CAISO
Low Capacity Price Case ($50kW-yr) $1850 $3060 $1630 $2968
Mid Capacity Price Case ($75kW-yr) $2127 $3613 $1907 $3521
High Capacity Price Case ($100kW-yr) $2403 $4166 $2183 $4075
Difference from Base Case ($kW) -$337
Cost amp Performance Requirements for Flexible Advanced Nuclear Plants in Future US Power Markets 52
High-Level CapEx Estimation Exercise for lsquoNuclear-Specificrsquo Costs Several advanced reactor developers are still working on their nuclear reactor designs and the other components that make up the lsquonuclear-relatedrsquo portion of the plant This typically includes the lsquonuclear islandrsquo consisting of the steam supply system (ie nuclear reactor reactor pressure vessel coolants pumps piping controls etc) the containment and auxiliary building and the fuel handling area Other lsquonuclear-relatedrsquo costs include reactor licensing nuclear permitting fuel commissioning and testing related land acquisition offsite design and civil works These lsquonuclear-relatedrsquo costs represent the majority of overall plant costs Designers will likely find it easier to reduce costs by limiting the size and scope of the nuclear heat source design and its relationship to the rest of the plant (ie lsquoconventional islandrsquo) For example if the design allows safety events to propagate into the steam turbine the steam turbine must be designed to handle such events and therefore will be relatively bespoke and more expensive If the nuclear heat source can be effectively isolated more of the plant can be designed with commercially available lsquooff-the-shelfrsquo components which are less expensive Using government cost studies for coal and natural gas power projects LucidCatalyst derived a high-level indicative estimate for all components downstream of the nuclear heat source Having already estimated the maximum allowable CapEx for an entire nuclear plant the goal was to indicatively estimate the remaining CapEx available for the nuclear-related costs Appendix F highlights the costs included in this calculation which should be treated as indicative not exhaustive Added together non-nuclear costs are roughly $1043kW for a plant without energy storage and $1453kW with energy storage Developers can subtract these figures from the allowable CapEx thresholds for the various ISOs
Cost amp Performance Requirements for Flexible Advanced Nuclear Plants in Future US Power Markets 53
9 ConclusionsProvided that advanced nuclear developers can design their reactors to be sufficiently low-cost they can complement production from higher VRE penetration and lower the overall cost of serving load mdash all without power delivery disruptions or sharp market price swings Providing cost-effective flexible capacity these plants offer an emissions-free load following option that can perform similar to CCGTs
This study examined the maximum allowable CapEx for flexible advanced nuclear plants in 2034 in low- and high-renewable market environments Using PLEXOS production cost modeling software LucidCatalyst estimated the maximum allowable CapEx for flexible advanced nuclear plants in two configurationsmdashwith and without energy storagemdashin four deregulated power markets ISO-NE PJM MISO and CAISO The modeling and post-modeling financial analysis revealed that the maximum allowable CapEx for the first plant entering the market is driven by energy and capacity payment revenues The average maximum allowable CapEx across all scenarios is $3234kW This reflects a minimum of $1965kW (High RE in ISO-NE no ESS and $50kW-yr capacity payment) and $4503kW (Low RE in CAISO with ESS and $100kW-yr capacity payment)
Table 25 Summary of Maximum Allowable CapEx ($kW) by ISO Configuration and RE Scenario
Low RE wout ESS
with ESS
High RE wout ESS
with ESS
ISO-NE
Low Capacity Price Case ($50kW-yr) $2289 $2962 $1965 $2788
Mid Capacity Price Case ($75kW-yr) $2566 $3515 $2242 $3341
High Capacity Price Case ($100kW-yr) $2843 $4068 $2519 $3894
PJM
Low Capacity Price Case ($50kW-yr) $2358 $2988 $2186 $3038
Mid Capacity Price Case ($75kW-yr) $2634 $3541 $2462 $3591
High Capacity Price Case ($100kW-yr) $2911 $4095 $2739 $4144
MISO
Low Capacity Price Case ($50kW-yr) $2244 $2857 $2000 $2654
Mid Capacity Price Case ($75kW-yr) $2521 $3410 $2276 $3207
High Capacity Price Case ($100kW-yr) $2797 $3963 $2553 $3760
CAISO
Low Capacity Price Case ($50kW-yr) $2187 $3397 $1968 $3306
Mid Capacity Price Case ($75kW-yr) $2464 $3950 $2244 $3859
High Capacity Price Case ($100kW-yr) $2740 $4503 $2521 $4412
Cost amp Performance Requirements for Flexible Advanced Nuclear Plants in Future US Power Markets 54
Advanced reactor developers should be aware that while there are emerging market mechanisms to reward resources for enhancing grid flexibility and resiliency (and the operating reserve market is likely to expand) the primary revenue sources are energy sales and capacity payments Average annual energy prices are also expected to fall due to increasing quantities of zero-marginal cost VRE Absent a CO2 price or premiums paid for emissions-free generation and capacity advanced nuclear developers will need to design their plants to an average cost of below $2989kW Advanced reactor designers should also recognize that most of the emerging market mechanisms compensating for flexible dispatchable output are too early-stage to gauge their significance in the mid-2030s While the grid will undoubtedly demand large amounts of flexible resources by that time it is currently unclear how much energy will be transacted through these new products The decision to add a thermal energy storage system to a plant design must be informed by the specific market context in which a plant is sited Across the four ISOs modeled co-locating a storage system makes economic sense on average for less than $1126kW Such a system will enable the reactor to run at its rated capacity for more hours and provide the opportunity to sell power from the ESS when prices are at their highest Also without an ESS (or an alternative revenue source such as hydrogen production process heat for industry etc) the plantrsquos capacity factor suffers significantly in high VRE zones For example in the 2034 high RE scenario the capacity factor for nuclear plants in southern California is 67 Given that these plants are being designed to operate for a minimum of 40 years it is worth considering what market conditions (particularly VRE penetration) will exist beyond 2034 A CO2 price or capacity payment premium for emissions-free generation resources could significantly change the maximum allowable CapEx As shown (and specific to the PEPCO load zone in PJM) a $25 $50 or $75tonne CO2 price significantly improves the economics for advanced nuclear plants raising the maximum allowable CapEx by $993kW $2005kW or $3018kW respectively Similarly capacity markets could increase payments to stimulate deployment of emissions-free generation which could significantly improve project economics Advanced nuclear developers should understand the advantages and disadvantages of developing projects in regulated markets Depending on how deregulated markets evolve it may be favorable to focus on regulated markets for initial development efforts Regulated utilities can utilize all the benefits of highly rampable and dispatchable output without requiring complex and relatively slow-moving market reforms to reveal the value of certain grid services For these reasons regulated markets have been in practical terms the first markets for Gen III and III+ nuclear plants (as well as other innovative power projects like the carbon capture and sequestration project at Kemper)The PLEXOS modeling revealed that deploying advanced nuclear power at scale can actually reduce the overall cost of serving electrical load Nearly all national and international energy modeling efforts either do not include advanced nuclear in their projections or assume an insignificant level of capacity Because these plants can operate as baseload resources and load follow like a combined-cycle gas turbine they can supply a large fraction of the firm power without raising the overall cost of electricity This conclusion should motivate policymakers utilities climate advocates and other stakeholders to continue supporting advanced nuclear commercialization efforts In addition to tracking how markets evolve advanced nuclear developers should also track the evolution of competitive technologies that will play an increasing role in grid flexibility and emissions-free generation Technologies to enhance grid flexibility primarily include energy storage Distributed Energy Resources demand-side solutions like flexible loads (eg EVs electric hot water heaters smart thermostats etc) and demand response programs These are effective in lsquotime shiftingrsquo demand and smoothing power flows across the grid However they are less effective in serving the expected increase in overall electricity demand resulting from the electrification of transportation and other sectors Supplying emissions-free energy for multiple days or even weeks (when VREs are not generating) currently cannot be met without extremely low-cost bulk energy storage (which is not yet an economical scalable option) or thermal generation with carbon capture or the use of clean synthetic fuels (eg hydrogen ammonia ethanol DME etc) in converted natural gas plants
Cost amp Performance Requirements for Flexible Advanced Nuclear Plants in Future US Power Markets 55
An important precondition for advanced nuclear plants to play a meaningful role in future resources mixes is their ability to be built at sufficiently low cost While the CapEx thresholds highlighted in this report are relatively low in comparison to conventional nuclear new-build plants in North America and Europe they are well within the range of those reported by third-party cost studies59 and advanced nuclear developers themselves This range is also well within the costs being achieved in countries with continuous new-build nuclear programs60 Designers should integrate these cost requirements into their plant designs and consider whether adding thermal storage makes sense in their target markets
Appendices
Figure 21
$000
$1000
$2000
$3000
$4000
$5000
$6000
$7000
2009 2010 2011 2012 2013 2014 2015 2016 2017 2018
$M
Wh
Day-Ahead
Capacity ($MWh Est)
Ancillary Services
Cost amp Performance Requirements for Flexible Advanced Nuclear Plants in Future US Power Markets 57
A Appendix ndash Historical Revenues by Market Product in Select ISOsIt is useful to examine todayrsquos wholesale market prices to understand the relative revenue potential for flexible nuclear plants By the mid-2030s market rules and prices are bound to be different however revenue breakdown by product and price trends provide a useful benchmark for looking into the future
ISO-NE (New England)
Despite the recent increase in day-ahead clearing prices in 2017 and 2018 average clearing prices for energy have been in decline for the past 10 years61 Overall demand for electricity ISO-NE has been in general decline year since 2013 and demand in 2017 hit an 18-year low62 Figure 13 presents ten years (2009 ndash 2018) of revenue potential for Day-Ahead energy63 capacity (estimated in $MWh) and ancillary services Energy prices were an average of $4598MWh across the ten-year period the highest of the four ISOs analyzed64
Figure 13 Average Annual Clearing Price by Market Product in ISO-NE ($MWh)
Figure 22
$000
$1000
$2000
$3000
$4000
$5000
$6000
2009 2010 2011 2012 2013 2014 2015 2016 2017 2018
$M
Wh
Load-Weighted Energy
Capacity
Ancillary Services
Cost amp Performance Requirements for Flexible Advanced Nuclear Plants in Future US Power Markets 58
PJM (Pennsylvania-Jersey-Maryland)
PJM energy prices have been declining for the past decade on average (see Figure 14) Twelve thousand MW of coal and three nuclear plants having filed for deactivation may close by 2021 (Davis-Besse Perry and Three Mile Island) Nonetheless projected excess capacity (based on the interconnection queue) suggests that ignoring local reliability issues these retirements will not affect energy prices or reliability Most revenues come from energy (~78) with about 20 coming from capacity revenues Depending on capacity requirements in various PJM zones capacity payments could be higher65 Ancillary services as is the case in each power market represent a small fraction of total potential revenue
Figure 14 Average Price by Component of Wholesale Power Price in PJM ($MWh)
MISO (Midcontinent)
MISO has the lowest average clearing price for energy of the four ISOs under consideration ($3134MWh from 2009 ndash 2018) This is partially driven by already depreciated coal and nuclear plants as well as 17GW of wind which makes up 8 of MISOrsquos generating portfolio66 Unlike ISO-NE and PJM MISO does not have a capacity market Instead it has a lsquoResource Adequacyrsquo construct which places the burden on Load Serving Entities (LSEs) and Independent Power Producers (IPPs) to procure a sufficient resource capacity to provide energy during times of forecast (and unexpected) scarcity Typically this means either qualifying capacity through LSE-owned resources or procuring it through bilateral arrangements with other resource owners MISO has a 17 lsquoreserve marginrsquo which means there is 17 surplus generation capacity on average at any given time There is a voluntary capacity auction where LSEs and IPPs can procure capacity that they have not already procured Therefore the capacity payments listed in Figure 15 only reflect the clearing prices of the voluntary capacity auctions As with the other ISOs MISOrsquos ancillary service market is relatively small and would likely represent an insignificant revenue stream for advanced nuclear projects
Figure 23
$000
$500
$1000
$1500
$2000
$2500
$3000
$3500
$4000
$4500
2009 2010 2011 2012 2013 2014 2015 2016 2017 2018
$M
Wh
Load-Weighted Energy
Capacity (RA Construct)
Ancillary Services
Cost amp Performance Requirements for Flexible Advanced Nuclear Plants in Future US Power Markets 59
Figure 15 Average Price by Component of Wholesale Power Price in MISO ($MWh)
CAISO (California)
CAISO is the only ISO that experienced a (mild) increase in energy clearing prices from 2009 ndash 2018 as shown in Figure 16 Day-Ahead clearing prices averaged $3886 over this period with prices reaching $4606 in 2018 CAISO has more non-hydro renewables than any other ISO as a percentage of total energy generation (26 in 2018)67 and installed capacity (23331 MW)68 When Governor Jerry Brown signed SB 100 into law in September 2018 California adopted a 100 RPS by 2045 (50 renewables by 2026 60 renewables by 2030 and 100 CO2-free energy by 2045) The increase in solar and wind will likely depress the average clearing price for energy (certainly during daylight hours) but will undoubted drive up the value for flexible dispatchable resources This will be especially true for the morning and evening ramp With demand expected to grow between 10 and 15 annually until 203069 this will be a revenue opportunity for flexible dispatchable generation Californiarsquos decision not to renew the operating licenses for the Diablo Canyon units 1 and 2 which are set to expire in 2024 and 2025 respectively suggests that the state is perhaps not a priority market for nuclear However because the CAISO energy imbalance market has expanded well beyond the borders of Californiamdashto as far as Wyoming Idaho and Utahmdashthere may be opportunities to supply CAISO while not being physically located within the state
Figure 24
$000
$1000
$2000
$3000
$4000
$5000
$6000
2009 2010 2011 2012 2013 2014 2015 2016 2017 2018
$M
Wh
DA Energy Costs
Ancillary Services (and RUC)
Resource Adequacy Costs
Cost amp Performance Requirements for Flexible Advanced Nuclear Plants in Future US Power Markets 60
Figure 16 Average Price by Component of Wholesale Power Price in CAISO ($MWh)
Cost amp Performance Requirements for Flexible Advanced Nuclear Plants in Future US Power Markets 61
B Appendix ndash New Market Mechanisms that Capture the Value of Resource FlexibilityMost of the new revenue streams aimed at improving grid stability by rewarding resource flexibility and dispatchability are too new and undeveloped to determine whether they will be meaningful revenues So far none provide the compensation necessary to stimulate investment in new capacity However it would serve advanced reactor developers to understand these products and track them going forward
Ramping Products
CAISO Flexible Ramping Product CAISO introduced its Flexible Ramping Product (FRP) in November of 2016 The FRP was designed to provide a margin of sufficient ramping capacitymdashavailable in real-timemdashto address uncertainty arising from load variability or intermittent renewable generation70 This helps maintain power balance during deviations in real-time net load71 reflecting potential renewable forecasting errors and other uncertainties related to ramping needs The FRP includes two products in the 5- and 15-minute real time markets (1) Flexible Ramp Up and (2) Flexible Ramp Down FRP compensation has been extremely small dropping from $25M in 2017 to just $7M in 201872 Flexible Ramp Up was needed for 6 of the time in 2018 whereas Flexible Ramp Down was needed just 1 of the time To participate in FRP resources submit bids to provide the forecasted demand plus the ability to ramp upward or downward to meet a predetermined uncertainty band They receive revenue from selling energy plus an uncertainty award (for either ramping up or down)Currently the ISO is working to incorporate flexible ramping capability in the Day-Ahead markets and procure FRP in smaller regions such that transmission constraints are not a material issue to getting energy on (and off) the grid73
Fast ramping advanced nuclear plants could certainly compete in this market However they will encounter competition from several other resources including battery storage systems which have exceptional charge and discharge rates As the amount of energy transacted through this market increases so too will the number of participating resources which will likely mitigate revenue potential
MISO Ramp Capability ProductMISO implemented their voluntary Ramp Capability Product in the spring of 2016 It consists of a lsquoup ramp capabilityrsquo and lsquodown ramp capabilityrsquo product As with CAISO MISO is interested in increasing ramping capacity to better respond to uncertainties in forecasted net load74 especially during short-term scarcity events or other deviations from the expected dispatch horizon Ramping resources are required
Cost amp Performance Requirements for Flexible Advanced Nuclear Plants in Future US Power Markets 62
to ramp up or down to meet specified uncertainty bands within ten minutes75 The Ramp Capability Product is co-optimized with the energy and ancillary service markets and allows resources that can ramp faster to displace slower resources Slower resources are compensated for their forgone profit to provide such services and faster resources get greater dispatch opportunities The program is completely voluntary and any dispatchable resource is eligible to participate To date there have been few hours where Ramp Capacity Product clearing prices are above zero (from 3 ndash 9 on average)76 and the Day-Ahead and Real-Time hourly price for ramp up capability averaged $058MWh and $021MWh respectively from May 2016 to June 201977 Both Day-Ahead and Real-Time ramp down capability products have been $000MWh since the beginning Given the low clearing prices which have incidentally fallen significantly since January 2019 and the dearth of hours during which the product clears at non-zero prices the MISO Ramp Capability project does not present a significant revenue stream for advanced nuclear plants
ISO-NE and PJMISO-NE and PJM do not currently have ramping products
Other Compensation Mechanisms for Fast Available and Flexible Generators
Fast Start GenerationEach of the ISOs have market pricing rules to reward resources that can more rapidly respond to dispatch instructions Enabling a faster response is typically more costly for a resource and these rules allow them to run more often and receive compensation for their start up and fixed operating costs In some ISOs rules also compensate lsquoslowerrsquo resources that have been moved out of the merit order to make room for lsquofast-startrsquo78 resources It is unlikely that advanced nuclear plants will be the marginal generator very often therefore significant revenue generation from this rule change should not be expected
Pay-for-PerformanceISO-NE and PJM have a lsquopay-for-performancersquo (PFP) model for capacity resources This increases financial incentives for resources able to quickly provide additional capacity or operating reserves during periods of generation scarcity
ISO-NEISO-NErsquos Forward Capacity Market Pay-for-Performance (FCM PFP) Project began in June 2018 Its purpose is to increase financial incentives for resources that can quickly provide additional capacity or operating reserves during periods of generation scarcity During Capacity Scarcity Conditions (CSC)79 resources can be eligible for additional revenue payments based on actual capacity provided (above what was already required and contracted for in the marketplace) PFP prices are cleared on a 5-minute basis until the CSC is resolved Capacity prices are determined on how deficient the grid is in meeting its capacity and operating reserves requirements The amount of capacity provided is multiplied by a predetermined lsquoperformance payment ratersquo80 which dictates the final payment amount In short if a resource can quickly provide additional grid capacity (either by ramping up or decreasing its real-time energy output to provide additional capacity or operating reserves) it is eligible for significant above-market payments From January 1 2015 to August 15 2019 there was only one CSC event declared (on September 3 2018) and it lasted just under 3 hours81
Cost amp Performance Requirements for Flexible Advanced Nuclear Plants in Future US Power Markets 63
PJMStarting in 2016 PJM began providing lsquoCapacity Performancersquo incentive payments to resources participating in its Reliability Pricing Model (RPM) capacity market The purpose was to reward resources for being available and responsive during stressed conditionsmdashwhen PJM determines they are needed to meet power system emergenciesmdashand issuing penalties when resources do not perform This helps ensure that the capacity offered into the RPM reflects a resourcersquos actual performance risk (and ensures that capacity from units less likely to perform during stressed conditions are offered at higher prices to reflect their outage or non-performing risk)82 The number of megawatts cleared in the RPM as Capacity Performance is set to increase each year until the delivery year 2020 ndash 21 when all PJM resources are required to meet Capacity Performance requirements This is to incentivize investment in resource reliability (eg system upgrades and fuel availability) and apply penalties to non-performance83 Resources that exceed performance requirements during peak system conditions collect funds from resources that underperformCapacity Performance increases overall capacity costs in the market however these are ideally offset by relatively lower pricing during extreme weather events and other conditions that stress the grid Under Capacity Performance resources are required to deliver their committed capacity during emergency events called Performance Assessment Intervals (PAI) System-side Performance Assessment Hours (PAH) have not been called since 2014 and zone-wide PAIs have not been called since 201584 Therefore it is unlikely to be a material source of revenue for advanced reactors To be considered a Capacity Resource with lsquounlimited energy capabilityrsquo a nuclear plant must sustain continuous operation for at least 10 hours Capability verification testing performed by PJM requires nuclear plants to sustain their rated output for 2 hours
Table 26 Relevance of Emerging Market Products that Reward Resource Flexibility on Advanced Nuclear Reactor Developers
Resource Flexibility Product
Description Relevance to Adv Reactor Developers
Rationale
CAISO
Flexible Ramping Product (FRP)
This product provides a margin of sufficient ramping capacitymdashavailable in real-timemdashto address uncertainty arising from load variability or intermittent renewable generation85
Very Low FRP compensation has been extremely small dropping from $25M in 2017 to just $7M in 201886
The corresponding cost to CAISO for FRP ranged from $000 ndash $003MWh from Q1 2018 to Q2 201987
Flexible Ramp Up was needed 6 of the time in 2018 and Flexible Ramp Down was needed just 1 of the time
Cost amp Performance Requirements for Flexible Advanced Nuclear Plants in Future US Power Markets 64
Resource Flexibility Product
Description Relevance to Adv Reactor Developers
Rationale
MISO
Ramp Capability Product (RCP)
The RCP is co-optimized with the energy and ancillary service markets and allows resources that can ramp faster to displace slower resources Ramping resources are required to ramp up or down to meet specified uncertainty bands within ten minutes88
Very Low To date there have been few hours where Ramp Capacity Product clearing prices are above zero (from 3 ndash 9 on average)89 and the day-ahead and real-time hourly price for ramp up capability averaged $058MWh and $021MWh respectively from May 2016 to June 201990
Both day-ahead and real-time ramp down capability products have been $000MWh since the beginning
ISO-NE
Pay for Performance (PFP)
The purpose of PFP is to increase financial incentives for resources that can quickly provide additional capacity or operating reserves during periods of generation scarcity In short if a resource can quickly provide additional grid capacity (either by ramping up or decreasing energy output to provide additional capacity or operating reserves) it is eligible for significant above-market payments
Very Low From January 1 2015 to August 15 2019 there was only one occasion (on September 3 2018) when a scarcity event was declared and it lasted just under 3 hours91
PJM
Capacity Performance (CP)
The purpose of CP is to reward resources for being available and responsive during stressed conditionsmdashwhen PJM determines they are needed to meet power system emergenciesmdashalong with penalties when resources do not perform
Very Low Under Capacity Performance resources are required to deliver their committed capacity during emergency events called Performance Assessment Intervals (PAI) System-side PAIs have not been called since 201492 and very rarely have zonal PAIs been called
Cost amp Performance Requirements for Flexible Advanced Nuclear Plants in Future US Power Markets 65
C Appendix ndash Desirable Performance Attributes and Market Participation Requirements In general resource lsquoflexibilityrsquo includes the ability to start up and shut down over short periods of time or rapidly change generation output to support system reliability The primary value of lsquoflexiblersquo advanced reactors is their ability to load follow when renewables go offline Currently this is supplied by natural gas plants (both CCGTs and CTs) To be competitive with natural gas (which may have integrated affordable carbon capture technologies by the mid-2030s) flexible advanced nuclear plants will need to have certain performance characteristics
This appendix highlights the desired performance attributes for advanced nuclear plants which follows the attributes of best-in-class CCGTs For reference generic market participation requirements for energy capacity and ancillary services markets are also included
Competing with Best-In-Class Gas Turbines
Advanced nuclear plants with energy storage will primarily compete with gas turbines in a combined-cycle configuration New lsquobest-in-classrsquo CCGTs have extremely fast start times and can achieve maximum capacity in 30 minutes from a lsquohot startrsquo (ie generator is running and electrically synchronized to the grid)93 This is important for quickly meeting the morning or evening ramp or quickly backfilling for renewables As shown in Table 27 ramp rates are also extremely high For example the GE 7HA02 can ramp up to 60 MWminute It can also ramp down to a minimum operating capacity of 33 (which can be reduced to 15 in a two-plant configuration)94 Under idealized operating conditions (where ambient temperature pressure and humidity affects efficiency) best-in-class CCGTs are extremely flexible and valuable resources
Cost amp Performance Requirements for Flexible Advanced Nuclear Plants in Future US Power Markets 66
Table 27 Selected Performance Criteria for lsquoBest-in-Classrsquo CCGTs
Siemens SGT-9000HL Series GE 7HA-Class 7HA02 MHPS M501J Series
Capacity (MW 1-unit Configuration) 595 573 614
Net Efficiency gt63 gt63 gt64
Ramp Rate (MWmin) 85 60 42
Turndown ndash Minimum Load () 40 33 50
Startup Time to Full Load lt30 minutes lt30 minutes 30 minutes
Simple cycle configuration Based on 8000HL series
Sources
Siemens SGT-9000HL | 405 MW | 60 Hz GE Power 9HA POWER PLANTS Fact Sheet MHPS M501J Series GE Power gas power systems offerings I 2019
Another competitive feature of best-in-class CCGTs is minimal outage risk Some of the major turbine manufacturers have claimed based on field operation hours that fleet uptime or availability (reflecting unscheduled maintenance) consistently exceeds 9995 Further manufacturers continue to push efficiency and believe combined-cycle net efficiency could reach 65 by the early 2020s96 This will continue to improve operating costs Grid operators also benefit from a CCGTrsquos rotational inertia During changes in demand the inertia of the spinning turbines opposes frequency changes and thereby gives system operators more time to correct the frequency deviation (by adjusting generation or load) and maintain a 60 Hz grid frequency While there is currently no market for inertia there are frequency response products97 and the service is undoubtedly valued by vertically integrated utilitiesAdvanced reactor developers should consider how their reactor and energy storage system should perform to meet these performance characteristics Notably without storage a reactor that can achieve these operating characteristics would be extremely valuable for grid stability however economics would be an issue As previously stated without significantly inflated capacity payments other out-of-market payments unprecedentedly high reserve prices or other revenue streams the economics are challenging
Cost amp Performance Requirements for Flexible Advanced Nuclear Plants in Future US Power Markets 67
General Market Participation Requirements
Performance Requirements for Energy RevenuesGenerators participating in wholesale electricity markets must meet several well-established technical and operating performance requirements During project development and through operations (until retirement) the ISOrsquos interconnection commissioning and on-going testing procedures and protocols ensure that resources can perform as stated once ready for commercial operations For grid operators to effectively and efficiently carry out their responsibilities resources need to operate as expected At a high level the ISO makes exhaustive assurances that all eligible energy resources are dependable market participants It is essential that resources be capable of receiving and responding to electronic dispatch instructions and communicate when they are (or will be) downmdashso system operators can balance the grid accordingly Therefore both wireless and lsquohardlinersquo communications equipment are setup between the ISO and energy resource The ISO also maintains a power system model that has all the lsquovital statisticsrsquo for each resource Knowing what each resource is capable ofmdashplus the operating condition of each resource in any given momentmdashallows the operators to optimize economic dispatch
Communication ProtocolsThere is a suite of digital and analog channels through which generators and demand resources communicate with the ISO (and vice versa) These include a mix of telemetry solutions which include wireless technologies (eg cellular systems unlicensed ration frequencies etc) and supervisory control and data acquisition (SCADA) technology It also includes hard-wired fiber optic ethernet cables and establishing dedicated lsquohard-linersquo telephone cables between the plant and ISO control room All required communications equipment is tested prior to any generator being available for dispatchVerbal and electronic communications are performed by a registered entity (which may be the energy resource itself or a third party) responsible for scheduling compliance dispatching administrative functions (information requirements market monitoring etc) and authorized to submit market and technical information
Information Provided to the ISOThere are several different types of generator-specific information that is submitted to the ISO and ultimately incorporated into its power system model This includes static information related to voltage and reactive control the unitrsquos one-line diagram transmission line information and associated equipment and certain technical data for physical components It also includes different types of dynamic information Using ISO-NE as an example such information includes
n Desired Dispatch Point (DDP) is the control signal expressed in megawatts transmitted to direct the output consumption or demand reduction level of each grid-tied resource dispatched by the ISO in accordance with the assetrsquos Offer Data
n Actual Generation is the actual generation being produced by the generating asset n Economic Minimum Limit is the lowest sustainable output level as specified by physical design characteristics environmental regulations or licensing limits
n Economic Maximum Limit is the maximum available output in MW of a Generator Asset that a Market Participant offers to supply in the Day-Ahead Energy Market or Real-Time Energy Market as reflected in the Generator Assetrsquos Offer Data This represents the highest MW output a Market Participant has offered for a Generator Asset for economic dispatch
n Emergency Minimum Limit means the minimum output in MWs that a Generator Asset can deliver for a limited period of time without exceeding specified limits of equipment stability and operating permits
Cost amp Performance Requirements for Flexible Advanced Nuclear Plants in Future US Power Markets 68
n Response Rate is the response rate in MWMinute at which a Market Participant is willing to change its output or consumption
n Regulation High Limit (applicable to Frequency Regulation offers) is an offer parameter that establishes the upper bound for AGC SetPoints and is used in the determination of a Resourcersquos Regulation Capacity
n Regulation Low Limit (applicable to Frequency Regulation offers) is an offer parameter that establishes the lower bound for AGC SetPoints and is used in the determination of a Resourcersquos Regulation Capacity
n Unit Control Mode98 describes the current operational state of an energy resource n Heartbeat describes the active digital connection between computers at the ISO and grid resource and confirms that related energy Data Acquisition and Concentration device are properly scanning and exchanging data as required
These types of information are indicative of the information that all ISOs need in order to properly dispatch a resource Beyond the minimum operating requirements which are highlighted in the table below99 the desired operating requirements to realize energy revenue simply requires that there be consistency between the plantrsquos scheduled output and actual output
Table 28 Minimum Operating Requirements for Large Generators
Category Description of Technical Requirement
Reactive Power Generators must maintain a composite power delivery at continuous rated power output at the Point of Interconnection with dynamic reactive capability over the power factor range of 095 leading to 095 lagging
Voltage Control All generators must keep and maintain an automatic voltage regulator (AVR) in service (and keep it in automatic operation)
Governor Control Generators over 10 MW must provide and maintain a functioning governor which includes the hardware or software that provides autonomous frequency-responsive power control It must have a speed droop set between 4 ndash 5 a frequency response deadband of no greater than 59964 ndash 60036 Hz and a real power response that does not override the governorrsquos response
Power Quality A generatorrsquos facility shall not cause excessive voltage flicker nor introduce excessive distortion to the sinusoidal voltage or current waves
Source ISO-NE Appendix 6 Large Generator Interconnection Agreement
Cost amp Performance Requirements for Flexible Advanced Nuclear Plants in Future US Power Markets 69
The requirements above are sourced from ISO-NE and while PJM MISO and CAISO have similar requirements they also have additional participation requirements that are important to note
n PJM To be considered a resource with lsquounlimited energy capabilityrsquo a resource must sustain continuous operation ldquocommensurate with PJM load requirements specified as 10 hoursrdquo100 If there is insufficient historical operating data to pull from PJM will verify the plants capability by testing whether it can sustain output for 2 hours101
n MISO To participate as a Resource Adequacy resource in MISO an advanced nuclear plant will need to sustain its maximum output for a minimum of four hours across the expected peak hour for each operating day102
n CAISO To qualify for Resource Adequacy like MISO advanced nuclear plants must meet a lsquominimum availability thresholdrsquo whereby they are capable of generating for four continuous hours To participate in lsquoflexiblersquo Resource Adequacy advanced nuclear plants would have to place bids in the Day-Ahead market from one of the following options103
ndash Base Ramping 5am ndash 10pm (all days) ndash Peak Ramping 2 ndash 7pm or 3 ndash 8pm (all days) ndash Super-Peak Ramping 2 ndash 7pm or 3 ndash 8pm (non-holiday weekdays)
Performance Requirements for Capacity Resources
ISO-NEISO-NE capacity resources are compensated based on their Capacity Supply Obligation (CSO) measured in MW and associated payment rate for a given time period (Capacity Commitment Period)104 During shortage events (or lsquoCapacity Scarcity Conditionsrsquo) capacity resources with a CSO are rewarded for being available and operating until the scarcity event has passed During these events the lsquoPay-for-Performancersquo mechanism is active and both capacity and non-capacity resources are rewarded for their availability and ability to meet system needs Capacity resources are required to demonstrate their ability to respond to ISO Dispatch Instructions and to maintain performance at a specified output level for a specified duration For new nuclear and combined-cycle capacity resources these occur within five business days of commercial operations and projects must operate for 4 continuous hours at the capacity level bid in the Forward Capacity Auction105 Existing resources are audited annually as a requirement of fulfilling capacity supply obligations (CSO) during summer and winter Capacity Commitment Periods and nuclear and combined-cycle plants are required to run for 2 hours continuously106
PJMIn PJM resources with capacity contracts are obligated to be available during periods of grid stress when PJM declares that emergency actions are necessary These periods are called lsquoPerformance Assessment Intervalsrsquo (PAIs) and have historically occurred during critical peak periods in the winter The Capacity Performance construct was initiated after the 2014 polar vortex where 22 of generation capacity was out of service which nearly tripled the number of forced outages across the region In fact eight of the ten highest critical peak periods in history were experienced during January 2014107
Cost amp Performance Requirements for Flexible Advanced Nuclear Plants in Future US Power Markets 70
During PAIs resources receiving capacity payments must be available to inject energy onto the grid (at the capacity for which they are receiving capacity payments) PAIs at the RTO level have not occurred since 2014 however it is important to note that when contracted capacity resources are not available during PAIs they are penalized Of the 30 PAHs in 2014 the average interval was 43 hours and the longest was 13 hours (during the height of the polar vortex) In addition to being available lsquoperformingrsquo resources must achieve pre-defined and approved ramp rates during a scarcity event Acceptable rates have historically been defined as being between the historic average and maximum over a defined period (up to 3 months) They ultimately require approval by PJM Table 29 highlights the required operating parameters for eligible capacity resources Currently nuclear plantsmdashpresumably because they are only used as baseload resourcesmdashare not subject to capacity performance operating requirements108 109
Table 29 Capacity Performance and Base Capacity Resource Minimum Unit-Specific Operating Parameters in PJM (Select Technologies)
Generator Technology
Min Down Time Hrs
Min Run Time Hrs
Max Daily Starts
Max Weekly Starts
Start-up Time Hot Hrs
Warm Hrs
Cold Hrs
NotTime1
Turn Down Ratio
Reciprocating ICE 06 1 12 84 01 01 01 01 gt1
Aero CT 11 1 6 42 01 01 01 01 gt1
Frame CT 125 3 4 28 025 025 025 01 gt15
CCGT 35 4 3 21 05 05 05 1 gt15
Storage lt1 TBD TBD TBD Start Time + Notification lt1 TBD
Source Slide 14 in PJM (2016) Capacity Performance Performance Assessment Hour Education
1 Notification Time Time to Start (ColdWarmHot Hours)
MISO Capacity PerformanceIn MISO non-intermittent capacity resources (ie nuclear) must offer all its claimed capacity into the Day-Ahead market for all hours it is scheduled to be available Intermittent capacity resources (for which co-located energy storage may be categorized) must submit bids into the Day-Ahead energy market and offer at least four continuous hours daily across the MISO forecasted daily peak110
CAISO Flexible Resource AdequacyEach CAISO LSE must procure sufficient flexible RA resources Flexible RA resources must submit economic bids depending on one of three Flexible Capacity Categories (listed in the table below)111 112
Cost amp Performance Requirements for Flexible Advanced Nuclear Plants in Future US Power Markets 71
Table 30 Categories of Must-Offer Obligations for Flexible RA Capacity Resources in CAISO
Category 1 Category 2 Category 3
Must-Offer Obligation
17 Hours 5 Hours 5 Hours
5am ndash 10pm Daily for the whole year
3pm ndash 8pm for May ndash September
3pm ndash 8pm for May ndash September
5pm ndash 10pm Daily for the whole year
2pm ndash 7pm for January ndash April and October ndash December
2pm ndash 7pm for January ndash April and October ndash December
Daily Daily Non-holiday weekdays
Energy Limitation
At least 6 Hours At least 3 Hours At least 3 Hours
Starts The minimum of two starts per day or the number of starts feasible with minimum up and down time
At least one start per day Minimum 5 starts a month
Source California Public Utility Commission 2019 Filing Guide for System Local and Flexible Resource Adequacy (RA) Compliance Filings
Start-up time is not an eligibility requirement however resources that can start within 90 minutes can qualify all capacity from zero up to their lsquoEffective Flexible Capacityrsquo113 (EFC)114 If a resource requires more than 90 minutes the capacity eligible for Flexible RA is the difference between its Pmin and EFC CAISO has an open docket to revise Flexible RA requirements which include reducing start-up time to 60 minutes or less for RT (5-minute or 15-minute) products115
CAISO FRAC-MOOThe Flexible Resource Adequacy Criteria and Must-Offer Obligation (FRAC-MOO) is an initiative related to flexible resource adequacy It requires LSEs to procure sufficient flexible resources based on each monthrsquos maximum 3-hour ramp and peak demand Qualifying resources are obligated through a lsquoMust-Offer Obligationrsquo to submit bids into CAISOrsquos day-ahead markets (as opposed to self-schedule)Some analysts view the flexible ramping product and FRAC-MOO as being less for attracting new flexible resources and more as a lsquoretirement prevention toolrsquo for existing flexible capacity resources considering solar-induced decline in energy revenues116 It is likely that existing flexible resources in CAISO can serve as adequate flexible RA capacity until there is a 50 renewables mix (or higher)117
Cost amp Performance Requirements for Flexible Advanced Nuclear Plants in Future US Power Markets 72
Operating Requirements for Fast-Start Generation
Resources that are relatively fast to start up and ramp are typically more expensive than other marginal resources and therefore do not set the price as often During tight system conditions fast-start generators may be too expensive to get dispatched In response fast-starting pricing regimes have been proposed to allow these resources to set the price more often This usually requires relaxing a resourcersquos Economic Minimum118 to zero so it is available for dispatch and then separately compensating it for its start-upno-load119 costs FERC issued a Notice of Proposed Rule Making (NOPR) in 2016 regarding fast-start pricing which directed the RTOISOs to ldquohellipapply fast-start pricing to any resource committed that can start up within 10 minutes or less has a minimum run time of one hour or less and submits economic energy offers to the marketrdquo120 The RTOISOs are still implementing the NOPR existing operating requirements121 122 123 124
Table 31 FERCrsquos Existing Operating Requirements for RTOISOs to Receive lsquoFast-Startrsquo Pricing
ISO Description of Technical Requirements
ISO-NE1 Minimum Run Time does not exceed one hour
Minimum Down Time does not exceed one hour
Time to Start does not exceed 30 minutes after receiving a Dispatch Instruction from ISO
Available for dispatch and manned or has automatic remote dispatch capability
Capable of receiving and acknowledging a start-up or shut-down dispatch instruction electronically within 60 seconds
PJM2 lt=1 hour for start-up and minimum run time
MISO3 Online resource lt=1 hour for starting synchronizing and injecting energy to the grid (online resource) minimum run time of lt=1 hour
Offline resource lt=10 minutes for starting synchronizing and injecting energy to the grid minimum run time of lt=1 hour
CAISO4 Start-up time of less than two hours
1 ISO-NE Appendix 6 Large Generator Interconnection Agreement
2 PJM (2019) Fast-Start Summary August 7 2019
3 MISO (2013) MISO Module AmdashCommon Tariff Provisions 3000 November 19 2013
4 CAISO (2019) Fifth Replacement FERC Electric Tariff Effective as of January 1 2019
Cost amp Performance Requirements for Flexible Advanced Nuclear Plants in Future US Power Markets 73
Operating Requirements for Ancillary Services
As shown in Table 32 below operating requirements for regulation operating reserves and supplemental reserves are largely similar across all four RTOs125
Table 32 Summary of Ancillary Service Operating Requirements
Ancillary Service Product ISO-NE PJM MISO CAISO Performance Requirements
Regulation
Regulation n n n Must immediately increase or decrease output in response to automated signals (typically 2 ndash 4 seconds depending on market)Regulation ndash Up n
Regulation ndash Down n
Regulation Mileage ndash Up n Must minimize the absolute change in output between four-second set points
Regulation Mileage ndash Down n
Spinning Reserves
10-minute Synchronized Reserves n Synchronized to the grid and must respond within 10 minutes
Synchronized or Reserves n n
Spinning Reserves n1
Non-Spinning Reserves
30-minute Operating Reserves n Must respond within 30 minutes
10-minute Non-Sync Reserves n Must respond within 10 minutes
Primary Reserves2 n
Supplemental Reserves n
Non-Spinning Reserves n1
1 Must run for at least two hours
2 Synchronized and non-synchronized
Source Summarized data collected from Zhou et al (2016) Survey of US Ancillary Services Markets Center for Energy Environmental and Economic Systems Analysis Energy Systems Division Argonne National Laboratory
Cost amp Performance Requirements for Flexible Advanced Nuclear Plants in Future US Power Markets 74
Other ancillary services in addition to being minor revenue sources require less generation modification and therefore would not influence design considerations for advanced reactor developers Supplying voltage support typically requires having automatic voltage regulating (AVR) equipment (and telemetered communication with the ISO) Because flexible nuclear plants are motivated to run as much as possible they will likely not supply black start services However if they do they must be capable of starting without support from offsite power and operate at full capacity for 12 ndash 16 hours (depending on the ISO)126
Cost amp Performance Requirements for Flexible Advanced Nuclear Plants in Future US Power Markets 75
D Appendix ndash Alternative Ways of Providing System Flexibility Non-generation resources are becoming increasingly relevant in the competitive landscape of lsquoflexiblersquo technologies against which advanced nuclear will need to compete This section briefly summarizes the applications and market adoption potential for energy storage and demand-side technologies and applications
Energy Storage
Much has already been written about the grid benefits of energy storage127 128 Energy storage systems take up energy store it and make it available for use at a later time They are extremely useful for grid balancing and have become a cost-competitive alternative for a growing number of applications in recent years ESS is now regularly procured by utilities and increasingly required to be co-located with new renewable projects Table 33 below highlights the range of applications including services that directly support integration of variable renewables129
Table 33 Select Energy Storage Applications
Category Storage Services Supporting Renewable Integration
Bulk Energy Services Electric Energy Time-Shift (Arbitrage) n
Electric Supply Capacity n
Ancillary Services Regulation n
Spinning Non-Spinning and Supplemental Reserves n
Voltage SupportBlack StartOther Related Uses (load following frequency response flexible ramping power smoothing of renewable output)
n
Transmission Infrastructure Services
Transmission Upgrade DeferralTransmission Congestion Relief
Distribution Infrastructure Services
Distribution Upgrade DeferralVoltage Support
Customer Energy Management Services
Power QualityPower Reliability n
Retail Electric Energy Time-Shift n
Demand Charge ManagementIncreased Self-Consumption of Solar PV n
Figure 25
Cost amp Performance Requirements for Flexible Advanced Nuclear Plants in Future US Power Markets 76
Category Storage Services Supporting Renewable Integration
Off-grid Solar Home Systems n
Micro-Grids System Stability Services n
Micro-Grids Facilitating High Shares of VRE n
Transportation Electric Vehicles n
Source The US DOEEPRI 2015 Electricity Storage Handbook Sandia National Laboratories
Figure 17 below shows the annual growth trajectory for storage with an estimated 44 GWs deployed in 2024mdashrepresenting a more than 14-times increase over 2018 Cumulatively this assumes over 18 GWs of deployed capacity At the same time Wood Mackenzie and ESA (2019) predict that the US energy storage market will be valued at approximately $47 billion130 Outside the US the market is expected to keep growing at a rapid pace which will undoubtedly drive further cost reductions
Figure 17 US Annual Energy Storage Deployment Forecast 2012-2024E (MW)131
With electrochemical storage (inclusive of battery storage) taking up an increasingly larger share of new storage installations in the US it is useful to examine cost reduction curves for battery storage over time The price of lithium ion batteries fell 80 between 2010 and 2017 ($kWh) and Bloomberg New Energy Finance (BNEF) believes storage costs will continue to drop by 52 between 2018 and 2030 (see Figure 18)132 This forecast is supported by the International Renewable Energy Agency (IRENA) which predicts a of drop between 54 ndash 61133 These predictions suggest an installed cost of $70kWh by 2030 Significant improvements in round rip efficiency the number of full charge-discharge cycles and calendar life are expected to be accompany these cost declines By 2040 BNEF expects storage will represent 7 of the total installed power capacity globally reaching nearly 1000 GW134 Other experts see more modest growth (600 GW by 2040)135 however a positive trajectory is clear136
Figure 26
Cost amp Performance Requirements for Flexible Advanced Nuclear Plants in Future US Power Markets 77
Figure 18 Lithium-Ion Battery Price Historical and Forecast
As more projects are deployed financiers developers utilities operators and regulators are getting more comfortable with the technology137 Market rules are evolving (albeit at different rates across the ISOs) to compensate storage for the values it providesInitially energy storage entered the market by providing high power-short duration services (ie ancillary services) As costs have come down storage is expanding to include more energy time-shifting (as opposed to power-relatedbalancing) values Currently there are no commercially available138 bulk storage technologies (beyond pumped hydropower) that are cheap enough to store and dispatch energy on a weekly monthly or seasonal basis
Demand-Side Flexibility Demand Response and Distributed Energy Resources
A new generation of communication and control technologies is emerging to time shift electricity use across hours of the day Several utility-led programs are allowing utilities to control customer-sited loads that have grid-interactive hardware and software (eg EVs air conditioning electric water heaters thermostats smart solar inverters139 etc) As more of these resources are deployed and if possible aggregated they are expected to help peak shave and provide another grid-balancing tool to grid operatorsISOs have Demand Response (DR) programs where the utility pays electricity customers to reduce their consumption relative to a measurable baseline level of consumption The ability to reduce load on demand reduces the requirement to procure expensive peaking generation which can be valuable during critical peak periods of demand Distributed energy resources (DERs) are typically small-scale physical and virtual assets are connected to and interact with the grid at the local distribution level (oftentimes located behind-the-meter) DERs encompass a range of technologies that include solar PV energy storage combined heat and power plants fuel cells energy efficiency and controllable loads Through various communication and control platforms these resources can be used individually or in aggregate to provide value to customers the
Cost amp Performance Requirements for Flexible Advanced Nuclear Plants in Future US Power Markets 78
local distribution network or the larger transmission network The orchestrated use of multiple DER technologies has given rise to the concept of the lsquovirtual power plantrsquo (VPP) or the optimized use of heterogenous DERs (using control monitoring and management software) to provide retail or wholesale market services VPPs can provide flexible grid services for applications such as frequency regulations demand response operational reserves or peak demand management to maintain or improves the grid reliability efficiency and overall performanceIn aggregate flexible loads DR and DERs are expected to play a material role in helping grid operators manage variable renewable integration While they show great promise it is important to be aware of several issues that could limit their effectiveness Namely leveraging flexible loads requires aggregating several thousand systems which involve customer acquisition costs the prospect of installing additional hardware and potential technical challenges related to aggregation and responding to grid signals DR programs have been in operation for over a decade but are rarely required to modify their load140 DER aggregation and wholesale market performance like flexible loads is still far from where it will ultimately be It will be important for MEITNER Design Teams to follow how these flexible resources evolvemdashboth technically and as they are supported by policymdashas they will undoubtedly be valuable grid reliability tools
Cost amp Performance Requirements for Flexible Advanced Nuclear Plants in Future US Power Markets 79
E Appendix ndash High-Level Cost Analysis of Energy Storage SystemThe analysis described in this report includes scenarios in which advanced nuclear plants would use co-located energy storage systems (ESS) to increase revenue by charging from the reactorrsquos energy when market prices are low and discharging to the grid for energy sales when market prices are high LucidCatalyst and project advisors developed the following high-level information on three potential ESS approaches to assess the financial feasibility of this concept relative to the extra allowable CapEx for advanced nuclear plants with ESS calculated from the PLEXOS results The three potential ESS approaches in this preliminary assessment are firebricks (thermal ESS) molten salt (thermal ESS) and flow batteries
The financial feasibility assessment accounts not only for the ESS medium but also for the heat recovery steam generators (HRSG) and additional turbine-generator capacity when the reactor and ESS release energy to the grid at the same time The assessment below indicates that the cost estimates for these approaches based on currently available data could be financially feasible as components of flexible advanced nuclear plants This is because their CapEx levels are near the extra allowable CapEx values enabled by ESS from many of the PLEXOS simulations Moreover the cost estimates shown below are well within the CapEx thresholds for simulations with high revenue to advanced nuclear plants through high capacity payments ($100kW case) or a CO2 program that lifts electricity market prices
Firebricks
Forsberg et al describe the possible use of firebricks for storing and releasing thermal energy from nuclear plants to provide load-following services to the grid and increase nuclear plant revenue141 Firebrick or refractory brick is designed for higher temperatures than typical masonry brick Firebrick is already produced at large scale and low cost for many applications Forsberg et al estimate the cost for firebrick in this application as less than $10kWh of thermal energy This excludes the additional equipment necessary for coupling the medium to the nuclear plantAs a high-level assessment of firebrick configurations and costs LucidCatalyst and project advisors performed the following calculations The density of brick is approximately 2200 kgm^3142 Packing brick in the system would reduce the density by approximately 25 leading to a packed density of 1650 kgm^3 The specific heat of brick is approximately 105 kJkg-K143 Multiplying the packed density by the specific heat leads to an effective volumetric specific heat of 1732 kJm^3-K
Cost amp Performance Requirements for Flexible Advanced Nuclear Plants in Future US Power Markets 80
Assuming a temperature of 500 C (773 K) from the reactor into the storage system the bricks store 0866 GJ per m^3 or 0525 GJ per metric tonneThe maximum output for each storage system is 500 MWe which effectively doubles the production capacity of the flexible advanced nuclear plant when added with the 500 MWe of direct power production from the reactor The storage system can discharge at maximum output for 12 hours implying a capacity of 6000 MWh in terms of electric energy Assuming a conversion efficiency of 40 this capacity is equivalent to 15000 MWh of thermal energy or 54000 GJ (using the conversion ratio of 36 GJ per MWth) From the energy storage parameters for brick specified above a system at each plant to store this amount of energy would have a volume of 62000 m^3 and weight of 103000 metric tonnesThe typical price for large orders of ordinary brick is approximately $300tonne144 The total raw materials cost for the necessary weight of brick is $31 million If labor costs for installation are approximately equal to the raw materials cost then installation adds another $31 million to the system cost and the subtotal is $62 million (~$10kW installed)As another cost estimation approach for brick thermal energy storage Storasol indicates the cost of its storage system as approximately $20kWh145 A system for this thermal capacity with 12 hours of discharge capability would cost $300 million The estimated cost of the HRSG is $89 million and the supplemental steam turbine is $112 million For the other necessary equipment the cooling system for the steam turbine is estimated to cost $33 million the water system $59 million and the transformers and grid connections $54 million146 The estimated cost for the total package is $646 million which equates to $1292kWe and $269kWhe with 80 round-trip efficiency
Molten Salt
NREL indicates that an oil-to-salt heat exchanger would cost approximately $30kWh of thermal energy147 The cost of a salt-to-steam apparatus for the application in this analysis would presumably be similar For a nuclear reactor with 500 MWe of electric capacity and thermal conversion efficiency of 40 the equivalent thermal capacity is 1250 MWth A molten salt system for this thermal capacity with 12 hours of discharge capability would cost $450 million As discussed above the estimated cost of the supplemental steam turbine is $112 million For the other necessary equipment the cooling system for the steam turbine is estimated to cost $33 million the water system $59 million and the transformers and grid connections $54 million The estimated cost for the total package is $707 million which equates to $1414kWe and $262kWh with 90 round-trip efficiency
Flow Batteries
As an indicative example of flow battery economics StorTera has designed a single liquid flow battery with a lifetime up to 20 years that costs $150kW148 The cost per unit of energy is $94kWh For a 12-hour system the energy component would cost $1125kW leading to a total cost of $1275kW
Cost amp Performance Requirements for Flexible Advanced Nuclear Plants in Future US Power Markets 81
F Appendix ndash High-Level Estimate of Non-Nuclear Island CostsThe following table includes the cost estimates (with their associated sources) for all costs downstream of the nuclear heat source This primarily consists of costs related to power conversion and balance of plant
The estimates below are largely sourced from a 2015 US DOE detailed cost study for natural gas and coal plants149 with other supporting data The figures exclude contingency costs and all costs were bought to 2019 USD by using the Federal Reserve Bank of St Louisrsquo Producer Price Index for Electrical Machinery and Equipment150 Importantly these estimates are from NGCC and coal plants that are 630 MW and 500 MW respectively (similar to the size of the 500 MW illustrative advanced nuclear plant) Costs are rounded to the nearest hundred thousand This costing exercise assumes that the power conversion system and all other downstream components are effectively off-the-shelf components that are otherwise used by other thermal power plants For conventional nuclear plants these components have traditionally had higher costs due to the lsquonuclear premiumrsquo for things such as steam turbines that due to the plant design had to meet higher nuclear-grade standards This costing exercise assumes that advanced reactor developers are able to separate these downstream components from their nuclear heat source design There are two tables below The first estimates the non-nuclear costs for a plant without thermal storage or $880kW The second table outlines the additional non-nuclear costs for a plant with a co-located ESS which is $1100kW (or $9167kWh for a 12-hour system)
Cost amp Performance Requirements for Flexible Advanced Nuclear Plants in Future US Power Markets 82
Table 34 Non-Nuclear Island Costs for 500 MW Plant without ESS
Non-nuclear Component1 Cost $kW Cost Base Year
$kW (2019 USD)
Relevant Assumptions Reference Plant
Feedwater and Misc BOP Systems (a)
$541 M $108 2011 $11126 Assumes costs (expressed in $kW) relate only to 219 MW steam turbine (not 422 MW gas turbine)
NGCC
Coolant to Steam Hx (a) $288 M $58 2011 $5922 NGCC
Ducting (b) $1214 M $243 2019 $24287 NGCC
Steam Turbine Generator (a) $40 M $80 2011 $8233 LC received an indicative quote from Mitsubishi Heavy Industries for a 600 MW steam turbine generator of $80kW The turbine plant auxiliaries condenser amp auxiliaries steam piping and foundations are sourced from 2015 DOE study1
Coal
Cooling Water System (b) $322 M $64 2011 $6620 NGCC
Accessory Electric Plant (a) $118 M $24 2011 $2428 NGCC
Instrumentation and Control (a) $77 M $15 2011 $1575 NGCC
Improvements to Site (a) $20 M $40 2011 $4119 NGCC
Buildings and Structures (excludes ESS or NSSS) (a)
$541 M $108 2011 $11126 NGCC
Land (c) $09 M $2 2011 $2 Assumes 300 acres Coal
Financing Costs (d) $265 M $53 2011 $55 Coal
Ownerrsquos Costs (e) $675 M $135 2011 $139 Includes Pre-production costs Inventory Capital and Other Ownerrsquos Costs
NGCC
Totals $4309 M $880
1 Information labeled (a) (b) (c) (d) and (e) are respectively sourced from Exhibit 4 ndash 14 Case B31A Exhibit 3 ndash 49 Case B31A Exhibit 2 ndash 1 Exhibit 3 ndash 19 and Exhibit 4 ndash 15 from US DOE (2015) Cost and Performance Baseline for Fossil Energy Plants Volume 1a Bituminous Coal (PC) and Natural Gas to Electricity Revision 3 National Energy Technology Laboratory Office of Fossil Energy
Cost amp Performance Requirements for Flexible Advanced Nuclear Plants in Future US Power Markets 83
Table 35 Additional Non-Nuclear Costs for a Plant with a 500 MW ESS
Component1 Cost $kW Cost Base Year
$kW (2019 USD)
Relevant Assumptions Reference Plant
Coolant to Air HX (a) $288 M $58 2011 $59 NGCC
Fans2 $148 M $30 2016 $30 Calculations based on $5MMBtu J Class gas turbine
NGCC
Thermal Energy Storage Facility $978 M $196 2019 $201 Internal LucidCatalyst Analysis
Assumes refractory brick
Cooling Water System (a) $40 M $80 2011 $111 Excludes contingency costs and assumes costs (expressed in $kW) relate only to 219 MW steam turbine (not 422 MW gas turbine)
NGCC
Accessory Electric Plant (a) $322 M $64 2011 $59 NGCC
Instrumentation and Control (b) $118 M $24 2011 $41 $0 Coal
Extra HRSG (hot air to steam) (a)
$575 M $115 2011 $118 NGCC
Buildings and Structures (conventional plant) (a)
$20 M $40 2011 $41 $0 Coal
Financing Costs ndash prorated by CapEx basis (d)
$265 M $53 2011 $55 Coal
Ownerrsquos Costs (d) $675 M $135 2011 $139 Coal
Land (c) $09 M $2 2011 $2 Assumes 300 acres Coal
Steam Turbine Generator (a MHI quote)
$1214 M $243 2019 $243 Indicative quote from Mitsubishi Heavy Industries (see Table 34 entry)
NGCC
Storage Totals $5192 M $1038 $1100
Cost of Storage ($kWhe) $9167
1 Source Info in this column labeled (a) (b) (c) (d) and (e) are respectively sourced from Exhibit 4 ndash 14 Case B31A Exhibit 3 ndash 49 Case B31A Exhibit 2 ndash1 Exhibit 3 ndash 19 and Exhibit 4 ndash15 from US DOE (2015) Cost and Performance Baseline for Fossil Energy Plants Volume 1a Bituminous Coal (PC) and Natural Gas to Electricity Revision 3 National Energy Technology Laboratory Office of Fossil Energy
2 Source Gulen S Can et al (2017) ldquoA Cheaper HRSG with Advanced Gas Turbinesrdquo Power Engineering Issue 3 and Volume 121
Cost amp Performance Requirements for Flexible Advanced Nuclear Plants in Future US Power Markets 84
1 National Renewable Energy Laboratory (NREL) is part of the US Department of Energyrsquos Office of Energy Efficiency amp Renewable Energy
2 This is the ldquoLow Natural Gas Price Low Renewables Costrdquo scenario included in NRELrsquos ReEDS model which is described in further detail in Section 522
3 Note that the PJM ISO now covers a broader area than when it was originally named4 We do include however a conceptual cost buildup for a firebrick thermal storage facility in Appendix
E which suggests that a thermal storage system as modeled can be built for less than is allowable capital cost in most of the scenarios The sources used for this are published reports on the cost of fossil power plants not optimized for this application and hence there is large scope for further cost reduction in this system
5 This figure represents the average across the four ISOs6 Energy Innovations Reform Project (2017) What will advanced nuclear power plants cost July 25
20177 Energy Technologies Institute (2018) The ETI Nuclear Cost Drivers Project Summary Report April
20 20188 ARPA-Ersquos MEITNER program website9 Section 5 includes the complete rationale for selecting the year 203410 Variable renewable energy sources are those that are non-dispatchable (ie intermittent) including
solar PV wind run-of-river hydropower tidal and wave energy11 The NREL ReEDS model is a capacity planning and dispatch model for the North American
electricity system12 Hsieh Eric and Anderson Robert (2017) Grid Flexibility The Quiet Revolution US Department of
Energy Office of Scientific and Technical Information13 MISO (2018) Review Ranking Input from the 2018 Market Roadmap Stakeholder Prioritization
Survey August 9 201814 These rules govern everything from resource procurement billing rates and incentive programs to
terms of service15 Lazar J (2016) Electricity Regulation in the US A Guide Second Edition Montpelier VT The
Regulatory Assistance Project16 Wiser Ryan (2019) The Impact of Variable Renewable Energy on Wholesale Power Pricesmdash
Implications for the Merchant Market Value of Wind and Solar Lawrence Berkeley National Laboratory
17 Bajwa et al (2017) Growing Evidence of Increased Frequency of Negative Electricity Prices in US Wholesale Electricity Markets IAEE Energy Forum Fourth Quarter 2017 Bloomberg (2018) Power Worth Less Than Zero Spreads as Green Energy Floods the Grid August 6 2018
18 It was cheaper on a $MW basis to build large centralized power plants rather than smaller distributed plants Borberly A and Kreider J F (2001) Distributed Generation The Power Paradigm for the New Millennium CRC Press Boca Raton FL
19 Wind Solar Alliance (2018) Customer Focused and Clean Power Markets for the Future Nov 201820 Wind Solar Alliance (2018) Outdated Electricity Market Rules Prevent Full Renewable Energy
Participation21 International Monetary Fund (2019) Falling Costs Make Wind Solar More Affordable April 26 2019
EndnotesFurther information references and hyperlinks
Cost amp Performance Requirements for Flexible Advanced Nuclear Plants in Future US Power Markets 85
22 lsquoNet loadrsquo refers to the difference between forecasted demand and expected generation from variable renewables
23 California ISO (2017) Renewables WatchmdashFor Operating Day Sunday April 09 201724 See NREL ReEDS model (any scenario including ldquo80 National RPSrdquo) US EIAmdashAnnual
Energy Outlook 2019 (natural gas increases in absolute and relative terms beyond 2050) and BloombergNEF New Energy Outlook (2019)
25 MISO (2018) Renewable Integration Impact Assessment (RIIA)26 This is done by providing operating reserves and frequency regulation services when wholesale
energy prices drop below marginal operating costs27 Patel Sonia (2019) Flexible Operation of Nuclear Power Plant Ramps Up Power Magazine28 Jenkins et al (2018) The benefits of nuclear flexibility in power system operations with renewable
energy Applied Energy Vol 2222 July 15 2018 Pgs 872 ndash 88429 Jenkins et al (2018) concluded that flexibly operating a nuclear plant could actually increase its
gross operating margins by providing operating reserves and frequency regulation services when wholesale energy prices drop below marginal operating costs They also concluded that it could reduce solar and wind curtailment and lower overall operating costs for the entire power system Their analysis however considered only one plant in a stylized high renewable power system A fleet of plants would quickly depress these ancillary services revenues leaving the fundamental economic dilemma of operating below a plantrsquos rated output
30 The wind production tax credit pays wind projects for each MWh of generation Therefore wind projects can bid negative prices and still theoretically make positive cash flow
31 Union of Concerned Scientists (2018) The Nuclear Power Dilemma Declining Profits Plant Closures and the Threat of Rising Carbon Emissions November 2018
32 ClimateNexus (2019) Nuclear Energy in the US Recent plant closures and policy decisions April 4 2019
33 US Energy Information Administration (2018) Frequently Asked Questions How old are US nuclear power plants and when was the newest one built
34 Reuters (2019) Pennsylvania state lawmaker offers bill to save nuclear power plants March 11 2019 and NEI (2019) Ohio policymakers support nuclear plants and the 23 million tons of CO2 they prevent June 13 2019
35 Baltimore Sun (2019) Maryland bill mandating 50 renewable energy by 2030 to become law but without Gov Larry Hoganrsquos signature May 22 2019
36 In August 2019 the DOE announced funding for a project with Exelon mdashwhich has the countryrsquos largest nuclear fleetmdashto produce store and use hydrogen produced from an existing nuclear plant Shortly thereafter ARPA-E provided funding to FirstEnergy Solutions Xcel Energy and Arizona Public Service to demonstrate hydrogen production from existing nuclear facilities as well
37 Bloomberg Environment (2019) Advanced Nuclear Reactors Targets for Late 2020s Companies Say February 13 2019
38 The capacity expansion is performed by Energy Exemplar using their Aurorareg software through 2046
39 Energy Exemplar (2018) North American Datasets Data Documentation August 201840 National Renewable Energy Laboratory (NREL) 2019 Regional Energy Deployment Systems
(ReEDS) Model Standard Scenarios Results Viewer41 US Energy Information Administration (2019) What is the efficiency of different types of power
plants Last updated August 8 201942 Congressional Research Service (2019) Advanced Nuclear Reactors Technology Overview and
Current Issues April 18 201943 NREL (2019) Annual Technology Baseline Electricity Natural Gas Plants
Cost amp Performance Requirements for Flexible Advanced Nuclear Plants in Future US Power Markets 86
44 LucidCatalyst did not perform nor reference detailed engineering studies to confirm the claims made about thermal storage performance characteristics It assumes that the claims made in either the published literature or by the companies themselves are true
45 This assumption is supported by several of the project advisors as the 12-hour capacity exceeds contiguous dispatch requirements for capacity resources for all four ISOs (PJMrsquos 10-hour contiguous dispatch being the longest)
46 US Energy Information Administration (2019) Table S1b Weighted-average price of uranium purchased by owners and operators of US civilian nuclear power reactors 1995ndash2018 dollars per pound U3O8 equivalent Nuclear amp Uranium
47 With perfect energy conversion 1 kWh could be produced from 3412 Btu Heat rate calculations scale up the necessary Btu per kWh by dividing 3412 by the efficiency percentage
48 Bowers H I Fuller L C and Myers M L Cost Estimating Relationships for Nuclear Power Plant Operations and Maintenance Oak Ridge National Laboratory 1987 Web doi1021725431729 Table 31
49 Nuclear Energy Institute Nuclear Costs in Context September 2019 p 250 US Energy Information Administration Cost and Performance Characteristics of New Generating
Technologies Annual Energy Outlook 2019 Table 251 Nuclear Energy Insider GE Hitachi chases gas plant displacement with new 300 MW reactor April
18 201852 US Department of Energy Cost and Performance Baseline for Fossil Energy Plants Volume 1
Version 3 2015 Exhibits 4 ndash16 and 3 ndash 5153 Idaho National Laboratory Power Cycles for the Generation of Electricity from a Next Generation
Nuclear Plant 2010 p 33 INL and the plant designer (General Atomics) provided further estimates of staffing levels and OampM costs in 2012 but these estimates do not account for the staffing efficiencies envisioned for flexible advanced nuclear plants in the 2030s For instance the 2012 study includes 7 telecommunications staffers 5 storekeepers 89 security personnel and 16 organizational effectiveness staffers
54 LucidCatalyst did not have detailed information regarding ESS maintenance costs however peer-reviewed literature (see following references) suggests that it is ~1 ndash 2 of total CapEx over a year Black amp Veatch (2016) Molten Salt Concept Definition amp Capital Cost Estimate Prepared for US DOE SunShot June 30 2016 IEA (2010) Technology Roadmap Concentrating Solar Power Purohit Ishan (2010) Techno-economic evaluation of concentrating solar power generation in India Energy Policy 2010 p38
55 The 22-year CapEx recovery assumption was provided under the guidance of project advisors who had brokered several large PPA negotiations for large power projects This is on the higher end of the typical recovery periods considered by debt and equity investors
56 Assumes a 55 interest rate on debt and an 85 return for equity investors Naturally the WACC is a material assumption in calculating maximum allowable CapEx Increasing or decreasing the WACC by a percentage point changes the maximum allowable CapEx by about 8 ndash 9
57 Ye Jason (2019) Carbon Pricing Proposal in the 116th Congress Center for Climate and Energy Solutions
58 Climate XChange Education and Research Inc (2020) State Carbon Pricing Network59 Energy Innovations Reform Project (2017) What will advanced nuclear power plants cost60 Energy Technologies Institute (2018) ldquoThe ETI Nuclear Cost Drivers Project Summary Reportrdquo
April 20 201861 Per analysis of ISO-NE Annual Market Reports from 2008-201862 2017 Annual Markets Report ISO New England Inc Internal Market Monitor May 17 201863 Over 95 of energy is transacted in the Day-Ahead market
Cost amp Performance Requirements for Flexible Advanced Nuclear Plants in Future US Power Markets 87
64 $MWh figures are taken directly from ISO-NE annual market reports with the exception of $MWh of capacity for years 2014 ndash 2017 These data points were estimated based on the reported total spend on fulfilling capacity contracts as a percentage of total spend on energy (which on a proportional basis is translated to $MWh)
65 See PJMrsquos Capacity Market Auction Results66 Potomac Economics (2019) 2018 State of the Market Reports for the MISO Electricity Markets
June 201967 CAISO (2019) 2018 Annual Report on Market Issuesamp Performance May 201968 California ISO (2019) What are we doing to green the grid As of October 23rd 201969 California Energy Commission (2018) The California Energy Demand 2018-2030 Revised Forecast
See Table ES-1 Comparison of CED 2017 Revised and CEDU 2016 Mid Case Demand Baseline Forecasts of Statewide Electricity Demand 1 ndash 15
70 CAISO (2018) Day-Ahead Market Enhancements Updates to Revised Straw Proposal71 Net Load reflects the total system demand not being met by variable renewable resources like solar
PV and wind72 CAISO (2018) 2018 Annual Report on Market Issues amp Performance73 CAISO (2018) Day-Ahead Market Enhancements Updates to Revised Straw Proposal74 As the grid resource mix includes more variable renewable generation it becomes increasingly
challenging to forecast load using historical averages75 Wang et al (2016) Ramp capability Modeling in MISO Dispatch and Pricing FERC Technical
Conference on Increasing Realtime and Day-Ahead Market Efficiency through Improved Software76 Cavicchi Joseph Harvey Scott (2018) Ramp Capability Dispatch and Uncertain Intermittent
Resource Output (Table VI-7mdashMISO Ramp Up Shadow Prices) Advanced Workshop in Regulation and Competition 31st Annual Western Conference Monterey California June 27 ndash 29 2018 Revised July 17 2018
77 See MISO Informational Forums (July 2019 April 2918 October 2017 and November 2016)78 A resource must meet the following criteria to be considered a lsquoFast Start Generatorrsquo (1) Minimum
Run Time does not exceed one hour (2) Minimum Down Time does not exceed one hour (3) cold Notification Time plus cold Start-Up Time does not exceed 30 minutes (4) available for dispatch and manned or has automatic remote dispatch capability and (5) capable of receiving and acknowledging a start-up or shut-down dispatch instruction electronically
79 Capacity Scarcity Conditions (CSC) are conditions when the grid cannot redispatch resources to create more operating reserves (which at the time will be dispatching at a capped price) to help maintain grid stability Pay-for-Performance is triggered and prices are cleared on a 5-minute basis until the CSC is resolved
80 ISO-NErsquos performance payment rates 612018 ndash 5312021 ($2000MWh) 612021 ndash 5312024 ($3500MWh) 612024 ndash 5312025 ($5455MWh) These need to get converted 5-minute rates by dividing by 12
81 ISO-NE (2019) Capacity Scarcity Condition Report (includes ability to search historical data)82 PJM (2018) Strengthening Reliability An Analysis of Capacity Performance June 20 201883 Ibid84 PJM (2019) Historical Emergency Procedures triggering Performance Assessment Hours MS Excel
spreadsheet85 CAISO (2018) Day-ahead Market Enhancements Updates to Revised Straw Proposal86 CAISO (2018) 2018 Annual Report on Market Issues amp Performance87 CAISO (2019) Q1 Report on Market Issues and Performance June 28 201988 Wang et al (2016) Ramp capability Modeling in MISO Dispatch and Pricing FERC Technical
Conference on Increasing Realtime and Day-Ahead Market Efficiency through Improved Software
Cost amp Performance Requirements for Flexible Advanced Nuclear Plants in Future US Power Markets 88
89 Cavicchi Joseph Harvey Scott (2018) Ramp Capability Dispatch and Uncertain Intermittent Resource Output (Table VI-7mdashMISO Ramp Up Shadow Prices) Advanced Workshop in Regulation and Competition 31st Annual Western Conference Monterey California June 27 ndash 29 2018
90 See MISO Informational Forums (July 2019 April 2918 October 2017 November 2016) 91 ISO-NE (2019) Capacity Scarcity Condition Report (includes ability to search historical data)92 PJM (2019) Historical Emergency Procedures triggering Performance Assessment Hours93 Waumlrtsillarsquos Flexicycle plants can ramp to full capacity in 5 minutes in a simple cycle configuration and
then convert to combined-cycle operations within the hour Other large turbines in a simple cycle configuration can achieve maximum capacity in less than 10 minutes from a cold start
94 GE (2017) 7HA Power Plants95 Siemens (2016) Siemens gas turbine portfolio96 General Electric (2018) Powering Forward GErsquos Record Setting HA Gas Turbine Ignites a New Era
of Power Generation September 201897 See ERCOTrsquos Fast Responding Regulation Service Up and Down (FRRS) market and CAISOrsquos
stakeholder initiative98 The following are Unit Control Modes (UCM) UCM 1 ndash Off-line and unavailable for dispatch UCM 2
ndash Off-line and available for dispatch UCM 3 ndash Generator on-line not dispatchable UCM 4 ndash On-line and available for dispatch UCM 5 ndash Posture generator to maintain reliability or provide VAR support UCM 6 ndash Generator regulating
99 ISO-NE Appendix 6 Large Generator Interconnection Agreement100 PJM Manual 21 (2019) Rules and Procedures for Determination of Generating Capability Rev 14101 Ibid102 MISO (2018) Resource Adequacy Business Practice Manual Manual No 011103 CAISO (2019) Final Availability Assessment Hours May 15 2019104 ISO-NE (2018) Lesson 6B1 Supplier-Side SettlementmdashFCM Credit and Peak Energy Rent (PER)105 ISO-NE (2014) Market Rule 1mdashStandard Market Design106 Ibid107 PJM Interconnection (2018) Strengthening Reliability An Analysis of Capacity Performance108 PJM (2018) Capacity Performance Unit Specific Parameter Adjustment FAQs109 Table based on slide 14 from PJM (2016) Capacity Performance Performance Assessment Hour
Education110 MISO (2018) Resource Adequacy Business Practice Manual Manual No 011 Effective Date Nov-
01 ndash 2018111 The determination of operational need for the three Flexible RA Categories are as follows Category
1) Based on the magnitude of the largest 3-hour secondary net load ramp Category 2) Based on the difference between 95 of the maximum 3-hour net load ramp and the largest 3-hour secondary net load ramp Category 3) Determined by 5 of the maximum 3-hour net load ramp of the month
112 Table source California Public Utility Commission (2019) 2019 Filing Guide for System Local and Flexible Resource Adequacy (RA) Compliance Filings Issued October 3 2018
113 Effective Flexible Capacity (EFC) is the capacity that is available to be used to meet a LSErsquos Annual Flexible Resource Adequacy requirement EFC calculation is currently under review by CAISO
114 Effective Flexible Capacity values are required and determined based on a resources Pmin and weighted average ramp rate CAISO Tariff (2019) California Independent System Operator Corporation Fifth replacement Electronic Tariff
115 CAISO (2018) Flexible Resource Adequacy Criteria and Must Offer ObligationmdashPhase 2 Revised Draft Framework Proposal Presented at February 7 2018 Stakeholder Meeting
116 Singleton Chad (2017) Can California Conquer the Next Phase of Renewables Integration
Cost amp Performance Requirements for Flexible Advanced Nuclear Plants in Future US Power Markets 89
Greentech Media June 9 2017117 Ibid118 A resourcersquos lsquoEconomic Minimumrsquo (or lsquoEcoMinrsquo) is the minimum amount of energy (MW) that it must
be allowed to produce while under economic dispatch 119 lsquoNo-load Costrsquo encompasses the fixed cost of operation It includes the cost of starting up the plant
getting it synchronized to the grid and standing by to increase power out Effectively it represents the costs outside generating energy to serve load
120 FERC (2016) FERC Proposes Minimum Pricing Requirements for Fast-Start Resources 121 ISO-NE Appendix 6 Large Generator Interconnection Agreement122 PJM (2019) Fast-Start Summary August 7 2019123 MISO (2013) MISO Module AmdashCommon Tariff Provisions 3000 November 19 2013124 CAISO (2019) Fifth Replacement FERC Electric Tariff Effective as of January 1 2019125 Table reflects summarized data collected from Zhou et al (2016) Survey of US Ancillary Services
Markets Center for Energy Environmental and Economic Systems Analysis Energy Systems Division Argonne National Laboratory January 2016
126 ISO-NE (2019) ISO New England Operating Procedure No 11 Blackstart Resource Administration (OP-11) PJM (2015) Black Start Definitions amp Procurement Process MISO (2018) Business Practices Manual Outage Operations CAISO (2017) CAISO Fifth Replacement TariffmdashAppendix D Black Start Generating Units
127 The US DOEEPRI 2015 Electricity Storage Handbook provides an excellent overview on energy storage technologies and grid applications Akhil et al (2015) DOEEPRI Electricity Storage Handbook in collaboration with NRECA February 2015 Prepared by Sandia National Laboratories
128 Energy Storage Association (2019) Energy Storage Benefits Breeze P (2018) An Introduction to Energy Storage Technologies Power System Energy Storage Technologies 1ndash11 Union of Concerned Scientists (2019) How Energy Storage Works
129 Adapted from the 2015 DOEEPRI Handbookmdashsee footnote 128130 Wood MacKenzie Power amp Renewables Energy Storage Association (2019) US energy storage
monitormdash2018 Year in review and Q1 2019 executive summary131 Figure source Wood Mackenzie Power amp Renewables Energy Storage Association (2019) US
Energy Storage Monitor 2018 Year in review and Q1 2019 Executive Summary March 2019132 Bloomberg New Energy Finance (2018) Long-Term Energy Storage Outlook 133 IRENA (2017) Electricity Storage and Renewables Costs and Markets to 2030 International
Renewable Energy Agency Abu Dhabi134 Walton Robert (2018) BNEF raises forecast for global battery deployment to $12T by 2040 Utility
Dive November 8 2018135 Deign Jason (2019) The Safety Question Persists as Energy Storage Prepares for Huge Growth
Greentech Media July 24 2019 136 Figure source Bloomberg New Energy Financersquos New Energy Outlook 2018137 In May 2020 the company Form Energy announced a 1 MW x 150 MWh pilot project with Great
River Energy This is a major achievement for the storage industry and if costs get low enough this could trigger a significant change in the types of applications in which energy storage can participate This would have profound impacts on shoulder and baseload resources
138 US Energy Information Agency (2018) US Battery Storage Market Trends May 2018139 Smart inverters like traditional inverters convert DC to AC current (which can be used on the
grid) but they can also support renewable integration by providing voltage regulation ride through capabilities (helps solar stay grid connected during periods of low voltage) frequency support They can ensure that renewables can either go offline when the grid goes down or avoid overloading local transformers or circuits
Cost amp Performance Requirements for Flexible Advanced Nuclear Plants in Future US Power Markets 90
140 PJM has not called a Load Management Events since 2013 MISO called its first emergency DR event in 10 years in 2017 and has since called 5 events Kolo Elta (2019) Defining System Flexibility Supply is Only Half of the Equation
141 Forsberg C Brick S amp Haratyk G (2018) Coupling heat storage to nuclear reactors for variable electricity output with baseload reactor operation The Electricity Journal 31(3) 23ndash31
142 See simetriccouk143 See the specific heat of solids at engineeringtoolboxcom144 See Remodeling Calculator (2019) 2020 Brick PricesmdashComplete Brick Buying Guide (using
approximate average price of $600 per thousand bricks and average weight of 45 lb per brick)145 Epp Baerbel (2018) Molten salt storage 33 times cheaper than lithium-ion batteries Global Solar
Thermal Energy Council146 Analysis of typical power plant component costs from US Department of Energy Cost and
Performance Baseline for Fossil Energy Plants Vol 1 Bituminous Coal and Natural Gas to Electricity July 6 2015 Page 189
147 National Renewable Energy Laboratory G Glatzmaier Developing a Cost Model and Methodology to Estimate Capital Costs for Thermal Energy Storage NRELTP-5500-53066 September 2011 P 7 See also NREL Craig S Turchi and Garvin A Heath Molten Salt Power Tower Cost Model for the System Advisor Model (SAM) NRELTP-5500-57625 February 2013 Page 6
148 StorTera (2019) SLIQmdashThe Single Liquid Flow Battery The original cost estimates of pound120kW and pound75kWh have been converted to dollars using an exchange rate of 125 US dollars per British pound (pound)
149 US DOE (2015) Cost and Performance Baseline for Fossil Energy Plants Volume 1a Bituminous Coal (PC) and Natural Gas to Electricity Revision 3 National Energy Technology Laboratory Office of Fossil Energy
150 Federal Reserve Bank of St Louis (2019) Producer Price Index by Commodity for Machinery and Equipment Electrical Machinery and Equipment
LucidCatalyst delivers strategic thought leadership to enable rapid decarbonization and prosperity for alllucidcatalystcom

Acknowledgements
lucidcatalystcom
Cost and Performance Requirements for Flexible Advanced Nuclear Plants in Future US Power Markets
Report for the ORNL Resource team supporting ARPA-Ersquos MEITNER Program July 2020
Authors Eric Ingersoll Kirsty Gogan John Herter Andrew FossWith assistance from Jane Pickering and Romana Vysatova
We are grateful to our reviewers and advisorsSteve Brick Senior Fellow The Chicago Council on Global AffairsCharles Forsberg Principal Research Scientist and Executive Director MIT Nuclear Fuel Cycle ProjectJesse Jenkins Assistant Professor Princeton UniversityAbram Klein Managing Partner Appian Way Energy PartnersMike Middleton Practice Manager Nuclear UK Energy Systems CatapultDavid Mohler Former CTO and SVP Duke Energy Former Deputy Assistant Secretary for Clean Coal and Carbon Management Office of Fossil Energy US Department of EnergyBruce Phillips Director The NorthBridge GroupDave Rogers Former Head of Global Project Development amp Finance Practice Latham amp Watkins LLP
Copyright copy 2020 LucidCatalyst LLC This work was funded through a DoEARPA-E award under ARPA-Ersquos MEITNER Program The Government has certain rights in the work including the right to reproduce the work prepare derivative works distribute copies to the public and perform publicly and display publicly by or on behalf of the Government All remaining rights reserved No part of this report may be reproduced in any form or by any electronic or mechanical means including information storage and retrieval systems without permission in writing from LucidCatalyst except by a reviewer who may quote brief passages in a review
Cost amp Performance Requirements for Flexible Advanced Nuclear Plants in Future US Power Markets
Contents 1 Executive Summary 1
2 Introduction 6
3 Revenue Generation in Deregulated and Regulated Power Markets 9
4 Current Revenue Potential and VRE Effects on Nuclear Projects 14
5 PLEXOS and Financial Modeling Methodology and Assumptions 19
6 Illustrative Cash Flow Analysis 31
7 Plexos Modeling Results for 2034 36
8 Additional Modeling Analyses 45
9 Conclusions 53
A Appendix ndash Historical Revenues by Market Product in Select ISOs 57
B Appendix ndash New Market Mechanisms that Capture the Value of Resource Flexibility 61
C Appendix ndash Desirable Performance Attributes and Market Participation Requirements 65
D Appendix ndash Alternative Ways of Providing System Flexibility 75
E Appendix ndash High-Level Cost Analysis of Energy Storage System 79
F Appendix ndash High-Level Estimate of Non-Nuclear Island Costs 81
Endnotes 84
Cost amp Performance Requirements for Flexible Advanced Nuclear Plants in Future US Power Markets
Executive Summary Table 1 Maximum Allowable CapEx by ISO and Scenario ($kW) 2
Executive Summary Table 2 Annual Average Market Prices for ISO-NE PJM MISO and CAISO 3
Table 1 Relevance of Available Revenue Streams for Flexible Advanced Reactors 9
Table 2 Average Wholesale Prices by Revenue Stream in Select ISOs (2009 ndash 2018) 14
Table 3 Modeled Scenarios in PLEXOS 22
Table 4 Total Capacity and Power Demand in the Four Markets in 2018 and 2034 24
Table 5 Assumed Capacity and Operating Specifications for Illustrative Advanced Nuclear Plant 26
Table 6 Assumed Specifications for Energy Storage 27
Table 7 OampM and Fuel Assumptions 29
Table 8 PLEXOS Input and Result Categories 30
Table 9 Energy Revenue for Each Plant Configuration 32
Table 10 Advanced Nuclear Plant OampM Expenditures 33
Table 11 Estimated Annual Plant Revenue Expenditures and Operating Profits for CapEx Recovery ndash Without ESS and With ESS 34
Table 12 Resource Capacity and Generation in ISO-NE for the Modeled Scenarios 36
Table 13 PLEXOS Results for ISO-NE 37
Table 14 Resource Capacity and Generation in PJM for the Modeled Scenarios 38
Table 15 PLEXOS Results for PJM 39
Table 16 Resource Capacity and Generation in MISO for the Modeled Scenarios 40
Table 17 PLEXOS Results for MISO 41
Table 18 Resource Capacity and Generation in CAISO for the Modeled Scenarios 42
Tables
Cost amp Performance Requirements for Flexible Advanced Nuclear Plants in Future US Power Markets
Table 19 PLEXOS results for CAISO 42
Table 20 CO2 Price Scenarios for PJM without Energy Storage 46
Table 21 CO2 Price Scenarios for PJM with Energy Storage 46
Table 22 2034 High RE Baseline and Fleet Deployment of Advanced Nuclear Plants 47
Table 23 Annual Average Market Prices for ISO-NE PJM MISO and CAISO 48
Table 24 Maximum Allowable CapEx by ISO and Scenario ($kW) with Higher OampM Cost Input 51
Table 25 Summary of Maximum Allowable CapEx ($kW) by ISO Configuration and RE Scenario 53
Table 26 Relevance of Emerging Market Products that Reward Resource Flexibility on Advanced Nuclear Reactor Developers 63
Table 27 Selected Performance Criteria for lsquoBest-in-Classrsquo CCGTs 66
Table 28 Minimum Operating Requirements for Large Generators 68
Table 29 Capacity Performance and Base Capacity Resource Minimum Unit-Specific Operating Parameters in PJM (Select Technologies) 70
Table 30 Categories of Must-Offer Obligations for Flexible RA Capacity Resources in CAISO 71
Table 31 FERCrsquos Existing Operating Requirements for RTOISOs to Receive lsquoFast-Startrsquo Pricing 72
Table 32 Summary of Ancillary Service Operating Requirements 73
Table 33 Select Energy Storage Applications 75
Table 34 Non-Nuclear Island Costs for 500 MW Plant without ESS 82
Table 35 Additional Non-Nuclear Costs for a Plant with a 500 MW ESS 83
Cost amp Performance Requirements for Flexible Advanced Nuclear Plants in Future US Power Markets
Figures
Figure 1 Stylized Supply Stack Demand Curve and Price 11
Figure 2 Stylized Power Market Supply Demand and Price with Flexible Advanced Nuclear Plants 12
Figure 3 Market Price Declines When Renewables Dominate the Supply Stack 15
Figure 4 Net Load Curve in CAISO for April 9 2017 16
Figure 5 Wind and Solar ELCC Curves as a Function of Installed Capacity in MISO 17
Figure 6 High-Level Methodology Diagram for Calculating Maximum Allowable CapEx 20
Figure 7 US Regional Power Markets 23
Figure 8 Charging and Discharging Configuration of Advanced Nuclear Plant with Thermal ESS 25
Figure 9 Ranges of Maximum Allowable CapEx ($kW) ndash With ESS and Without ESS 35
Figure 10 Frequency of Different Discharge Durations 44
Figure 11 Dispatch Profile for PJM with Majority of Firm Power Supplied by Advanced Nuclear Plants 49
Figure 12 Total Cost of Serving Annual Load Energy and Select Capacity Payments 50
Figure 13 Average Annual Clearing Price by Market Product in ISO-NE ($MWh) 57
Figure 14 Average Price by Component of Wholesale Power Price in PJM ($MWh) 58
Figure 15 Average Price by Component of Wholesale Power Price in MISO ($MWh) 59
Figure 16 Average Price by Component of Wholesale Power Price in CAISO ($MWh) 60
Figure 17 US Annual Energy Storage Deployment Forecast 2012-2024E (MW) 76
Figure 18 Lithium-Ion Battery Price Historical and Forecast 77
Cost amp Performance Requirements for Flexible Advanced Nuclear Plants in Future US Power Markets
List of Abbreviations amp Acronyms
ARPA-E Advanced Research Projects AgencyndashEnergy (US Dept of Energy)CAISO California Independent System OperatorCapEx Capital ExpendituresCCGT Combined Cycle Natural Gas PlantCP Capacity PerformanceDAM Day-Ahead MarketDER Distributed Energy ResourcesDR Demand ResponseESIG Energy Systems Integration Group (Berkeley National Laboratory)ESS Energy Storage SystemFRAC-MOO Flexible Resource Adequacy Criteria and Must-Offer ObligationFRP Flexible Ramping ProductHALU High-Assay Low-Enriched UraniumISO Independent System OperatorISO-NE Independent System Operator New EnglandLC LucidCatalyst LLCLEU Low-Enriched UraniumLSE Load Serving EntityMEITNER Modeling-Enhanced Innovations Trailblazing Nuclear Energy Reinvigoration (a program of ARPA-E)MISO Midcontinent Independent System OperatorNGCC Natural Gas Combined Cycle power plantNOPR Notice of Proposed Rule MakingNREL National Renewable Energy Laboratory (US Dept of Energy)OampM Operations and MaintenancePAI Performance Assessment IntervalPAH Performance Assessment HoursPFP Pay for PerformancePJM Pennsylvania-Jersey-Maryland Power Pool (now larger area ISO)PPA Power Purchase AgreementRCP Ramp Capability ProductReEDS Regional Energy Deployment System (NREL model)RFP Request for ProposalRGGI Regional Greenhouse Gas InitiativeRPM Reliability Pricing ModelRPS Renewable Portfolio Standard RTM Real-Time MarketRTO Regional Transmission OperatorTRISO Tristructural-Isotropic nuclear fuel pelletsUCM Unit Control ModeVRE Variable Renewable EnergyWACC Weighted Average Cost of Capital
Executive Summary
Cost amp Performance Requirements for Flexible Advanced Nuclear Plants in Future US Power Markets 1
This is an unusual time Competitive power markets are experiencing extended periods of very low power prices driven primarily by large supplies of low-cost natural gas At the same growth in demand for electricity has stagnated in many areas of the US driven by deindustrialization and efficiency improvements These power market conditions would normally discourage new entrants However federal incentives state policies and corporate purchases of renewable energy are driving significant deployment of wind and solar further depressing wholesale power prices Remarkably in spite of these conditions there are now more companies developing advanced reactors than at any other time in history However reactor developers today must design for very different future market conditions as described in this report than nuclear plants have seen in the past In this new environment it is critical for advanced reactor design teams to have clear signals from the market about what plants need to cost to be attractive investments and what performance characteristics will create the most value for plant owners Many advanced reactor designs are still in the conceptual design stage and therefore have large scope for reducing capital expenditures (CapEx) through design choices and applying target cost design methods Designers face critical questions such as How flexible should the reactor be How much is that flexibility worth How much effort andor cost should be expended to deliver flexible performance and how much value can that create for the plant ownerThis report summarizes a modeling effort to estimate the highest allowable CapEx for advanced nuclear plants in future power market environments while still achieving a market rate of return for their owners The goal is to define target cost and performance parameters determined by future market conditions to guide design choices and tradeoffs in the early stage of the reactor and power plant development process
1 Executive SummaryAdvanced reactor developers are at various stages of commercializing new products and must design for future market environments that will exist when their plants are available It is therefore critical to have a clear understanding about what plants will need to cost to be attractive investments and what performance characteristics will create the most value for plant owners
This study is among the first to model the substantial contribution that flexible advanced reactors can make towards reliable responsive affordable and clean future energy systems by supplying clean dispatchable generating capacity
Advanced reactor technologies could make a major contribution to lowering the overall system cost while reducing emissions and improving the performance of future energy systems Depending on specific market conditions it may also be beneficial to co-locate thermal energy storage systems (ESS)
Cost amp Performance Requirements for Flexible Advanced Nuclear Plants in Future US Power Markets 2
This work was funded by the US Department of Energyrsquos (DoE) Advanced Research Projects Agency-Energyrsquos (ARPA-E) Modeling-Enhanced Innovations Trailblazing Nuclear Energy Reinvigoration (MEITNER) program thorough a Work Authorization to DoErsquos Oak Ridge National Laboratory The intent was to provide guidance to Design Teams developing advanced reactorsLucidCatalyst performed the grid modeling and underlying financial analyses summarized in this report We used PLEXOSreg electricity production cost modeling software to estimate the revenues earned by a generic high-temperature advanced nuclear plant in deregulated power markets in the mid-2030s These revenues were then analyzed in a power plant financial model to determine the maximum allowable CapEx for which a plant must be delivered to achieve a market rate of returnLucidCatalyst modeled two different future scenarios each containing different resource mixes The first was a baseline lsquolow renewablesrsquo (Low RE) scenario which presumes a continuation (and eventual expiration) of existing renewables policy The second was a lsquohigh renewablesrsquo (High RE) scenario that has the same resource mix as an NREL1 Regional Energy Deployment System (ReEDS) scenario The ReEDS scenario assumes low renewables costs and low natural gas prices (and thus high penetration of both resource types)2 Both scenarios were modeled across the four principal deregulated US power markets for the year 2034 (1) ISO-New England (ISO-NE) (2) the Pennsylvania Jersey Maryland Power Pool (PJM)3 (3) the Midcontinent Independent System Operator (MISO) and (4) the California ISO (CAISO)Assuming capacity payments seen in todayrsquos capacity markets the PLEXOS modeling revealed that the average maximum allowable CapEx across all scenarios is $3234kW This reflects a range from a minimum of $1965kW to a maximum of $4503kW depending on the power market resource mix and capacity payment amount Each modeled scenario also includes a run with a 12-hour integrated thermal energy storage system (ESS) The additional revenues from the lsquonuclear + storagersquo plant justified extra allowable CapEx ranging from $613kW to $1891kW across the modeled scenarios and ISOs The table below provides the maximum allowable CapEx for each modeled scenario and power market
Executive Summary Table 1 Maximum Allowable CapEx by ISO and Scenario ($kW)
Low Renewables wo ESS with ESS
High Renewables wo ESS with ESS
ISO-NE
Low Capacity Price Case ($50kW-yr)
Mid Capacity Price Case ($75kW-yr)
High Capacity Price Case ($100kW-yr)
$2289 $2962
$2566 $3515
$2843 $4068
$1965 $2788
$2242 $3341
$2519 $3894
PJM Low Capacity Price Case ($50kW-yr)
Mid Capacity Price Case ($75kW-yr)
High Capacity Price Case ($100kW-yr)
$2358 $2988
$2634 $3541
$2911 $4095
$2186 $3038
$2462 $3591
$2739 $4144
MISO Low Capacity Price Case ($50kW-yr)
Mid Capacity Price Case ($75kW-yr)
High Capacity Price Case ($100kW-yr)
$2244 $2857
$2521 $3410
$2797 $3963
$2000 $2654
$2276 $3207
$2553 $3760
Cost amp Performance Requirements for Flexible Advanced Nuclear Plants in Future US Power Markets 3
Low Renewables wo ESS with ESS
High Renewables wo ESS with ESS
CAISO Low Capacity Price Case ($50kW-yr)
Mid Capacity Price Case ($75kW-yr)
High Capacity Price Case ($100kW-yr)
$2187 $3397
$2464 $3950
$2740 $4503
$1968 $3306
$2244 $3859
$2521 $4412
LucidCatalyst performed additional sensitivity analyses to assess the impact of other factors on maximum allowable CapEx One scenario included a large fleet of advanced nuclear plants with ESS Due to relatively low operating costs advanced nuclear plants set lower energy clearing prices and thus decreased the allowable CapEx thresholds Importantly the lower average energy prices led to a small decrease in the total cost of energy delivery for the ISO as shown in the following table
Executive Summary Table 2 Annual Average Market Prices for ISO-NE PJM MISO and CAISO
Average Annual Energy Price
ISO-NE High RE Future (Without Flexible Adv Nuclear)
Fleet Deployment of Flexible Adv Nuclear
$2632MWh
$2264MWh
PJM High RE Future (Without Flexible Adv Nuclear)
Fleet Deployment of Flexible Adv Nuclear
$2703MWh
$2267MWh
MISO High RE Future (Without Flexible Adv Nuclear)
Fleet Deployment of Flexible Adv Nuclear
$2613MWh
$2470MWh
CAISO High RE Future (Without Flexible Adv Nuclear)
Fleet Deployment of Flexible Adv Nuclear
$3806MWh
$2961MWh
A second scenario explored the influence of operations and maintenance (OampM) costs on maximum allowable CapEx Each $1kW-year in OampM cost reduction resulted in an increase in the allowable CapEx of approximately $11kW The difference between the low OampM case and the high case ($61kW-year) is $337kW of CapEx To put this in perspective for plants without the ESS this has more impact on CapEx than a reduction of $25kW-year in capacity paymentsmdashfor no additional value (energy or capacity) delivered to the market The generic high-temperature reactor modeled in this study potentially enables cost-effective thermal ESS Conceptually this operates by diverting heat from making steam for the turbine to a thermal store In the same way that LucidCatalyst did not model a specific reactor technology the modeling did not reflect any specific thermal storage technology4 Rather it was intended to determine the allowable cost of and value created by the thermal energy storage systemThe integrated thermal energy storage system always increased the allowable CapEx however the PLEXOS modeling revealed that the scale of such an improvement depended on several factors The plant with ESS stops making steam for the primary turbine during the lowest priced hours storing heat
Cost amp Performance Requirements for Flexible Advanced Nuclear Plants in Future US Power Markets 4
from the reactor in the thermal storage facility and then sells from both the primary and the storage facility turbine during the highest priced hours This allows the 500 MW plant to sell no electricity for 12 hours and produce at 1000 MWe for the other 12 hours while the nuclear island operates continuously at full power The amount of CapEx that can be budgeted for thermal storage depends on the grid resource mix (eg Low RE vs High RE scenario) and importantly the prevailing capacity payment The PLEXOS modeling revealed that co-locating a thermal energy storage system makes economic sense if the system can be built for less than $1126kW on average5 This finding should motivate further research and development in innovative cost-effective thermal energy storage systems for integration with advanced reactors It is also important to note that without the thermal ESS (or an alternative revenue source such as hydrogen production process heat for industry etc) the modeled plantsrsquo capacity factors suffer significantly in areas with high renewable penetration Most market mechanisms designed to compensate flexible and dispatchable generators are still too early-stage to be able to gauge their significance in the mid-2030s The grid will undoubtedly demand large amounts of flexible resources by that time however it is currently unclear how much energy will be transacted through these new products Nonetheless developers should track how these products evolve Further they should track the development of competitive technologies such as energy storage distributed energy resources (DERs) demand-side solutions like flexible loads (eg EVs electric hot water heaters smart thermostats etc) and demand response programs These resources help lsquotime shiftrsquo demand smooth power flows across the grid and enhance grid flexibility overall They are less effective however in serving increases in overall electricity demand (absent DER generators) With the electrification of the transportation sector (as well as other sectors) expected to increase overall demand advanced nuclear plants with thermal energy storage are uniquely suited to meet that demandmdashparticularly in markets with high penetration of renewables where ramping is needed Although regulated electricity markets were outside the modeling scope advanced nuclear developers may find it favorable to focus on these markets for their initial sales efforts Regulated utilities can utilize all the benefits of highly rampable and dispatchable output without requiring complex often contested and relatively slow-moving market reforms to reveal the value of certain grid services For these reasons regulated markets have been in practical terms the first markets for Gen III and III+ nuclear plants as well as other innovative power projects (see NuScale Powerrsquos current development efforts in Utah or the Kemper carbon capture and sequestration project in Mississippi)Considering advanced nuclear plants can operate as baseload resources as well as following load they can supply a large fraction of firm power without raising the overall cost of electricity This conclusion should motivate ISO operators public utility commissioners policymakers utilities and other stakeholders to investigate the role that these products could play in the grids of the future and to continue supporting advanced nuclear commercialization efforts This should also motivate organizations responsible for national and international energy modeling to include flexible advanced nuclear with thermal energy storage in their projections for future energy systems The CapEx thresholds highlighted in this report are relatively low compared to conventional nuclear new-build plants in North America and Europe However they are well within the range of those reported by third-party cost studies6 and advanced nuclear developers themselves This range is also well within the costs being achieved in countries with continuous new build nuclear programs7 Designers should integrate these cost requirements into their plant designs and consider whether adding thermal storage makes sense in their target markets
Main Report
Cost amp Performance Requirements for Flexible Advanced Nuclear Plants in Future US Power Markets 6
ARPA-E arranged several meetings with utilities policymakers and other organizations involved in the commercialization process for advanced nuclear technology The goal was to solicit input on the conditions that would lead to increased support Discussions covered a range of topics and high-level feedback largely fell into the following criteria
n Low overnight construction cost n Fast ramp rate without steam bypass (power capacitymin) n Short onsite construction time n Reduced staffing levels (onsite and offsite) n Smaller emergency planning zone limited to site boundary n Longer time before human response required for an accident n Reliable onsite backup power n High process heat temperature
These criteria offer useful guiding principles for advanced reactor designers as they derive from organizations that influence oversee and ultimately make power plant investment decisions They also formed the basis for eligibility requirements for ARPA-Ersquos MEITNER (Modeling-Enhanced Innovations Trailblazing Nuclear Energy Reinvigoration) program The MEITNER program supports a collection of projects that ldquoseek to identify and develop innovative technologies that can enable designs for lower cost safer advanced nuclear reactorshellip [and] establish the basis for a modern domestic supply chain supporting nuclear technologyrdquo 8 This report focuses on the first two criteria from the list above and examines the potential for advanced nuclear plants to meet the growing need for grid flexibility Specifically it uses PLEXOSreg production cost modeling software to estimate revenues earned by a generic advanced nuclear plant in deregulated power markets with low-renewables or high-renewables scenarios in the mid-2030s Revenues are used to estimate the maximum allowable CapEx or the maximum cost for which a plant must be delivered The intent is to provide advanced reactor developers including the MEITNER programrsquos Design Teams with information regarding the value of lsquoflexiblersquo operation (ie highly-rampable and capable of load following) and the CapEx targets they need to achieve by the time their reactors are commercially available This information also allows developers to assess design trade-offs inform interim technical targets evaluate projected system performance and articulate the need and impact of further investments to public and private fundersThis analysis was conducted with funding provided through an ARPA-E Work Authorization to DoErsquos Oak Ridge National Laboratory which subcontracted to LucidCatalyst
2 Introduction Several advanced nuclear plants are being designed to have similar ramping and load-following capabilities as combined-cycle natural gas plants (CCGTs) Because they also provide 247 emissions-free baseload generation the US Department of Energyrsquos Advanced Research Projects Agency-Energy (ARPA-E) approached a variety of stakeholders to better understand the factors that could potentially increase their procurement appeal
Cost amp Performance Requirements for Flexible Advanced Nuclear Plants in Future US Power Markets 7
21 Estimating Maximum Allowable Capex in Future Markets Using Plexos Software
LucidCatalyst modeled flexible (ie highly-rampable) advanced nuclear plants in the four principal deregulated US power markets (1) ISO-New England (ISO-NE) (2) Pennsylvania Jersey Maryland Power Pool (PJM) (3) Midcontinent Independent System Operator (MISO) and (4) California ISO (CAISO) The modeling runs were set in the year 20349 under the assumption that advanced nuclear plants will be commercially available by then LucidCatalyst modeled two potential 2034 scenarios based on different variable renewable energy10 (VRE) penetration assumptions
n Baseline Renewables Future This conservative renewables case reflects built-in values in the PLEXOS software which are the result of a capacity expansionoptimization model run performed by Energy Exemplar (makers of PLEXOS) for 2034 and beyond This assumes that all current state Renewable Portfolio Standard (RPS) targets tax credits and other existing legislation that supports renewables deploymentmdashcurrent as of January 1 2019mdashtake effect It does not include any non- binding targets or assume any future policy that could stimulate further renewables deployment
n Higher Renewables Future This scenario is based on the lsquoLow Natural Gas PriceLow Renewables Costrsquo scenario included in NRELrsquos Regional Energy Deployment System (ReEDS) model (described in Section 522)11 This assumes a higher renewables build-out and that natural gas prices do not significantly differ from todayrsquos prices (~$3MMBtu) This implies that advanced nuclear plants need to compete with highly flexible new-build combined-cycle gas plants in a low-cost natural gas environment
Assuming the current spectrum of capacity payments seen in todayrsquos capacity markets LucidCatalyst concluded that flexible advanced nuclear plants have an allowable CapEx threshold of between $1965kW and $4503kW depending on ISO VRE scenario and assumptions related to capacity payments (see Section 7) LucidCatalyst also modeled a parallel scenario that includes a 12-hour co-located energy storage system (ESS) The additional revenues from the lsquonuclear + ESSrsquo plant justified extra allowable CapEx ranging from $613kW to $1891kW This range is also driven by different scenario assumptions but the key finding is that higher renewables penetration leads to higher ESS revenues LucidCatalyst modeled three additional 2034 scenarios Each examined the impact on maximum allowable CapEx from (1) a hypothetical range of CO2 prices (2) a large fleet of advanced reactors operating in the same market and (3) an alternative assumption for annual fixed OampM cost
22 Report Structure
This report is primarily intended for advanced reactor developers with relatively little knowledge andor experience with wholesale electricity markets The report is divided into the following sections
1 Executive Summary2 Introduction3 Revenue Generation in Deregulated and Regulated Power Markets
This section provides advanced reactor developers with a brief high-level overview of how energy prices are set in wholesale power markets in the US and highlights the most relevant revenue streams for advanced nuclear plants It is not an exhaustive review of all aspects of market operations and settlements rather it focuses on the basics of price formation in deregulated markets and procurement in regulated markets
4 Current Revenue Potential and VRE Effects on Nuclear Projects Flexible dispatchable resources are increasingly important as VRE deployment continues to rise This section explains how VREs depress average wholesale energy prices and present fundamental challenges to grid management and current power market design It also describes how increasing
Cost amp Performance Requirements for Flexible Advanced Nuclear Plants in Future US Power Markets 8
quantities of VRE pose an existential threat to the economic viability of lsquomust-runrsquo baseload assets such as conventional nuclear plants The goal is to provide a brief survey of the US energy landscape such that advanced reactor developers have a baseline understanding from which to view the 2034 scenarios
5 PLEXOS and Financial Modeling Methodology and Assumptions LucidCatalyst developed an illustrative advanced nuclear plant for PLEXOS modeling runs This section includes the cost and performance assumptions for this illustrative plant and describes the methodology for preparing the 2034 low- and high-renewables scenarios in PLEXOS
6 Illustrative Cash Flow Analysis With the reportrsquos focus on allowable CapEx it is important to walk through how this figure is calculated This section describes the sequence of steps taken to arrive at this figure under a set of prescribed market conditions This provides the basis for understanding the PLEXOS modeling results
7 PLEXOS Modeling Results for 2034 All 2034 modeling results are presented in this section Specifically it highlights the maximum allowable CapEx for flexible advanced nuclear plants in four deregulated power markets (ISO-NE PJM MISO and CAISO) in the baseline- and high-renewable environments and under a range of related input assumptions
8 Additional Modeling Analyses Several factors can influence a plantrsquos maximum allowable CapEx This section presents the CapEx implications of CO2 pricing and market penetration potential Additional modeling scenarios in this section examine the impact of a CO2 price on CapEx the potential to deploy significant quantity of advanced nuclear capacity without affecting energy prices (and therefore allowable CapEx) and the relationship between expected fixed OampM costs and allowable CapEx
9 Conclusions The PLEXOS modeling reveals several takeaways for MEITNER participants as they consider their plant designs This section summarizes the findings from the modeling analysis and provides commentary on how flexible advanced nuclear plants can be delivered for less than the maximum allowable CapEx such that they can play a vital role in delivering a clean reliable flexible and low-cost electric power system
10 Appendices This report also contains useful reference information for advanced reactor developers including the MEITNER Design Teams in the following appendices
A Historical revenues by market product in select ISOs B New market mechanisms that capture the value of resource flexibility C Desirable performance attributes and market participation requirements D Alternative ways of providing system flexibility E High-level cost analysis of energy storage system F High-level estimate of non-nuclear island costs
Cost amp Performance Requirements for Flexible Advanced Nuclear Plants in Future US Power Markets 9
3 Price data included in this section are from the ISOs modeled in this analysis (ISO-NE PJM MISO and CAISO)
31 Available Revenue Streams for Advanced Nuclear Plants in Deregulated Markets
The majority of electricity bought and sold on the electric power grid is transacted through bilateral Power Purchase Agreements (PPAs) PPAs involve two parties agreeing to a price quantity of electricity to be supplied and period over which that electricity is to be delivered In deregulated markets while most energy sales are still transacted through PPAs there is a competitive marketplace where energy capacity and ancillary services (used to balance the grid) are bought and sold Table 1 below lists the various revenue opportunities for flexible advanced nuclear power plants and qualifies their relevance
Table 1 Relevance of Available Revenue Streams for Flexible Advanced Reactors
Market Revenue Mechanism
Description Relevance
Energy
Day-Ahead Market
Real-Time Market
The Day-Ahead Market (DAM) allows supply and demand bids to be set a day before electricity is actually generated or consumed It allows power plants to prepare to deliver their commitment and provides the Regional Transmission Operator (RTO) an understanding of which units will be operating to meet the following dayrsquos demand on an hourly basis Most energy sales are still transacted through Power Purchase Agreements however the vast majority of electricity transacted through power markets is through the DAM Relevance Revenues from the Day-Ahead Market will constitute the majority of advanced nuclear plant revenues (gt60)
The Real-Time Market (RTM) is primarily used to resolve deviations between forecasted supply and demand and address other contingences (eg unplannedunforeseen availability and or operational issues at power plants) Relevance An advanced nuclear plant will sell far less energy in the Real Time market (and prices do not differ significantly from DA market)
Very High
Medium
Revenue Generation in Deregulated and Regulated Power MarketsIt is important that advanced reactor developers have a basic understanding of the relevant revenue streams how energy prices are set and relative advantages and disadvantages of deploying in deregulated and regulated power markets
Cost amp Performance Requirements for Flexible Advanced Nuclear Plants in Future US Power Markets 10
Market Revenue Mechanism
Description Relevance
Capacity
Capacity
Forward Capacity
Vertically integrated utilities and load-serving entities (LSEs or local utility companies) in deregulated markets provide capacity payments to resources that help ensure sufficient capacity to meet mandated reliability requirements or meet extraordinarily high electricity demands These payments are designed to replace gaps in revenue resulting from energy sales that are insufficient to maintain the plantsrsquo financial viability Relevance This price will be negotiated with the LSE and represent a substantial percentage of annual revenues for advanced nuclear plants (~20 ndash 30)
Forward capacity markets are used to incentivize the deployment of new energy resources Developing large energy resources takes time and capital and this market helps ensure that these resources are constructed and synchronized to the grid in time to adequately meet forecasted future demand Relevance Based on a historical analysis of capacity auction results capacity payments make up 20 ndash 30 of advanced nuclear revenues
Very High
Very High
Ancillary Services
Frequency Regulation
Spinning Reserves
Non-Spinning Reserves
Voltage Control
Black Start
Resources participating in frequency regulation markets adjust their output or consumption in response to an automated signal from grid operators These adjustments help correct short-term changes in energy demand that affect system stability and keeps the grid frequency at (or very close to) 60 Hertz Relevance Relatively small market and probably best suited for grid-tied electrochemical storage (eg batteries) by the mid-2030s
The spinning reserve market compensates grid-synchronized resources that have available capacity to inject into the grid when called upon Resources must inject this capacity within a relatively short time usually less than 10 minutes While these reserves have conventionally been used to respond to unexpected contingencies such as a generator unexpectedly falling offline it is likely that more spinning reserves will be needed as more VREs are deployed Relevance Grid operators will need more synchronized resources to help maintain stability when large amounts of VRE go offline While this market is likely to grow in size increased participation will likely mitigate an increase in profitability Therefore while this may be a revenue source for advanced nuclear plants it is not expected to be significant
The non-spinning reserve market compensates resources that are not synchronized to the grid but can be within a short period (usually within 10 ndash 30 minutes) As with spinning reserves these resources are called upon during unexpected losses in generation Relevance Relatively small market with little revenue
Generating resources can be compensated for providing reactive power to compensate for drops in system voltage Relevance Insignificant revenue opportunities for advanced nuclear
If the grid loses power Black Start designated generators are committed to restoring electricity to the grid and do not require an outside electrical supply to do so Relevance Insignificant revenue opportunities for advanced nuclear
Very Low
Low
Very Low
Very Low
Very Low
Other
Flexible Ramping Product
Flexible ramping products are relatively new and currently only available in CAISO and MISO They reward resources that can quickly adjust outputmdashbeyond what has been obligatedmdashwithin a certain time period to correct forecasting uncertainties and other anomalies It is possible that these flexible ramping products will transact more energy as VRE deployment rises Relevance These products are very new and currently do not transact significant quantities of energy These may (or may not) become significant revenue opportunities for advanced nuclear plants going forward
Low
Power plants with low marginal costs (solar wind hydro existing nuclear)
Mar
gina
l Cos
t and
Po
wer
(Ene
rgy)
Pric
e in
$M
Wh
Demand
Market Price
Power (Energy) Supply and Demand in MWh
Fossil plants with higher marginal costs (coal natural gas oil)
Figure 1
Cost amp Performance Requirements for Flexible Advanced Nuclear Plants in Future US Power Markets 11
32 Energy Market Price Formation in Deregulated Markets
As in other competitive markets energy prices in power markets are set by the lsquomarginal costsrsquo of the marginal energy producer as shown in Figure 1 below The lsquomarginal costrsquo typically reflects a resourcersquos cost of producing each MWh of electricity which includes fuel costs the efficiency with which they are converted to electricity and any other costs associated with operating such as labor and maintenance The marginal cost guides what a resource will bid into the energy market for a given time period The grid operator will then arrange all energy supply bids in ascending order of price (often called the lsquomerit order) for each moment in time This supply stack (or lsquobid stackrsquo) begins with plants with lowest marginal costs (eg solar wind hydro and nuclear) and proceeds upward to those with higher marginal costs in (eg coal natural gas and oil plants) The supply stack is then compared to electricity demand for a given moment in time and the highest bid that intersects with the demand curve sets the clearing price for all lsquoinfra-marginalrsquo plants (ie with bids lower than the marginal producer)
Figure 1 Stylized Supply Stack Demand Curve and Price
For illustrative purposes Figure 2 below shows the stylized electricity market with the addition of flexible advanced nuclear plants Their assumed low marginal costs have the effect of pushing plants with higher marginal costs beyond the intersection of the supply and demand curve As a result fossil plants which would otherwise set the market price no longer operate as much Displacement of high-marginal-cost plants lowers overall clearing prices
Demand
Market Price
Advanced flexible nuclear plants
Higher-cost fossil plants arepushed out of the marketby advanced flexible nuclear
Power (Energy) Supply and Demand in MWh
Figure 2
Mar
gina
l Cos
t and
Po
wer
(Ene
rgy)
Pric
e in
$M
Wh
Cost amp Performance Requirements for Flexible Advanced Nuclear Plants in Future US Power Markets 12
Figure 2 Stylized Power Market Supply Demand and Price with Flexible Advanced Nuclear Plants
33 New Efforts to Compensate and Promote Flexible Resources
Rewarding resources that can be available and quickly ramp up and down during periods of grid stress (either on an hourly minute second or sub-second basis) has been the focus of several recent regulatory initiatives relating to market design12 Creating new revenue lsquoproductsrsquo often takes years to formalize and implement however They require several rounds of stakeholder input and are often implemented on a trial basis with subsequent revisions In MISO for example it typically takes 5 ndash 7 years between opening a new docket and market implementation13 Upon surveying the markets included in this study (ISO-NE PJM MISO and CAISO) mechanisms designed to reward resource flexibility are relatively nascent and do not transact large quantities of power or capital throughout the year None currently provide the compensation necessary to stimulate investment in new nuclear capacity While these revenue streams will likely become more relevant it is unclear whether they will ever be a material source of revenue for flexible nuclear plants Developers should therefore track the evolution of these products but not consider them as material revenue sources until they prove themselves as such Appendix B provides a longer description of these products and their relevance to advanced nuclear developers
34 Regulated Market Overview
Regulated markets offer an alternative development pathway for advanced nuclear developers In US regulated electricity markets vertically integrated utilities own control andor manage the generation delivery and customer-sited infrastructure for electricity delivery They are monopolies with the obligation to serve retail customers within their service territories and follow rules14 set forth by federal state and local agencies These utilities are overseen by a public regulator usually a state public utilities commission Regulated utilities supply electricity at cost plus an approved rate of return on their investments for delivering electricity (including generation transmission and other grid resources) This structure replaces competitive markets in determining prices set for energy generation capacity ancillary services (and other services)
Cost amp Performance Requirements for Flexible Advanced Nuclear Plants in Future US Power Markets 13
Regulated markets are largely dominant in the Southeast Northwest and much of the West outside California Under this arrangement consumers are limited in their choice of electricity provider however prices are generally more stable and certain over time than in deregulated markets
341 Resource Procurement Regulated utilities typically conduct open and competitive solicitations to procure new resources These are either mandated or strongly encouraged by regulators to assure the lowest-cost supply for retail customers Utilities are often allowed to participate in the bidding process however they are forced to accept the lowest-cost option where equivalent products and services are offered15 Some regulatory commissions will direct utilities to procure certain types of resources like renewables to meet state mandates or Renewable Portfolio Standard (RPS) goals Resource procurement begins with the utility typically issuing a public Request for Proposal (RFP) that describes the type of resources it seeks to procure Based on the bidrsquos content (including price technology maturitybankability OampM contract terms project financing terms developerrsquos reputation etc) and oversight and approval from the overseeing regulatory authority a winner is selected Typically these contract terms are not made public
342 Benefits and Drawbacks of Developing Flexible Advanced Nuclear Plants in a Regulated MarketThe regulated environment is less transparent than a deregulated market environment resulting in advantages and disadvantages for flexible advanced nuclear projects The primary advantage is that developers are not limited to a defined suite of revenue streams which may or may not be well designed to compensate for the values a flexible nuclear plant can provide Developers also get the opportunity to make the case for flexibility directly to the utility or articulate the benefits of flexibility through their RFP response Further when a plant becomes lsquomerchantrsquo (after a PPA expires for example) in a deregulated market it is subject to market conditions which are more dynamic less predictable and more competitive (generally lowering overall revenue potential) Two recent nuclear plant projects in the United StatesmdashVC Summer in South Carolina and Vogtle in Georgiamdashare located in regulated markets The only current advanced nuclear development effort (NuScale Power in Utah Associated Municipal Power Systems) is taking place in a regulated market as wellThe primary disadvantage of a regulated market is the lack of price transparency and the reduced freedom of participating without necessarily winning an RFP Furthermore revenue is fixed and power projects are not able to access high price conditions during scarcity events Deregulated markets have less barriers to entry however even in such markets the capital intensity of nuclear plants will undoubtedly require developers to sign a long-term PPA with a credit-worthy utility or a long-term capacity contract before the project can be financed (or the nuclear plant may be owned directly by the utility)
Cost amp Performance Requirements for Flexible Advanced Nuclear Plants in Future US Power Markets 14
41 Wholesale Market Clearing Prices Have Been in Decline
Average clearing prices in most ISOs have been in decline over the past ten years mostly due to falling natural gas prices Low-cost gas reduces the marginal cost of running natural gas plants which typically operate lsquoon the marginrsquo and therefore set energy prices Table 2 provides the average Day-Ahead energy capacity and ancillary services prices in four ISOs over the past decade (Appendix A presents additional detail on these prices)
Table 2 Average Wholesale Prices by Revenue Stream in Select ISOs (2009 ndash 2018)
ISO-NE PJM MISO CAISO
Average Energy Price ($MWh)
(Trendline growth over 10 years)
$4498
(-21)
$3950
(-27)
$3134
(-09)
$3886
(11)
Average Capacity Price ($MWh)
(Trendline growth over 10 years)
$1301
(67)
$1030
(17)
$0671
(152)
$0181
(180)
Average Ancillary Service Price ($MWh) $146 $089 $014 $046
1 MISO and CAISO have a Resource Adequacy Construct where capacity is procured via bilateral contracts which are not made public These figures represent the voluntary capacity market where utilities can procure remaining capacity needed to fulfill their capacity obligations These prices should not be used as a proxy for capacity payments Also most new-build energy projects require multi-year capacity contracts
4 Current Revenue Potential and VRE Effects on Nuclear ProjectsWhile it is difficult to predict what the 2030s power markets will look like it will inevitably be influenced by the policy technology and cost trends of today As such it is useful to characterize current market conditions and highlight the relevant issues and developments that advanced reactor developers should track This section highlights the current revenue potential for advanced nuclear plants as well as some of the key challenges for participation in future markets
Demand
Market Price
(Out of the Market)
Power (Energy) Supply and Demand in MWh
Lower marginal cost resources push higher marginal cost resources out of the bid stack lowering the overall clearing price
SolarWind
Figure 3
Mar
gina
l Cos
t and
Po
wer
(Ene
rgy)
Pric
e in
$M
Wh
Cost amp Performance Requirements for Flexible Advanced Nuclear Plants in Future US Power Markets 15
While low natural gas prices have largely driven the decline in energy prices other factors are also at work Research at the Lawrence Berkeley National Laboratoryrsquos Energy Systems Integration Group (ESIG) has shown that while solar PV and wind have historically had relatively little impact on energy price they ldquohave [now] begun to meaningfully influence temporal and geographic pricing trendsrdquo 16 Periods of exceptional sun and wind are now driving a higher frequency in the number of hours where market clearing prices are negative17
Figure 3 Market Price Declines When Renewables Dominate the Supply Stack
The increase in VRE deployment and more importantly the anticipation of continued VRE deployment is forcing the power grid to become more flexible and resilient Falling energy prices are a threat to advanced nuclearrsquos economics However the need for more flexible dispatchable resources may be an opportunity
42 The Rise of Variable Renewable Energy and Need for Grid Flexibility
To ensure a reliable supply of electricity in uncertain conditions system operators dynamically alter generation andor load to keep the grid at a stable frequency of 60 Hz Maintaining this frequency was historically furnished by large centralized generators In fact the entire electric power grid was initially designed and built around large centralized generators (eg coal nuclear and hydroelectric plants)18
They were the basis for all grid planning decisions and their startup times fuel availability and operating characteristics informed the design of competitive power markets19 However maintaining a balanced grid frequency has become a growing concern as more VREs are deployed They are also disrupting the way power markets are currently designed Largely driven by rapidly falling costs and supportive policies wind and solar PV deployment has increased 500 in the last 10 years20 Between 2009 ndash 2017 costs dropped 76 for solar PV and 34 for wind and it is expected that deployment rates will continue to rise21 To continue accommodating these resources power systems must maintain sufficient operating reserves and have generators
Figure 4
Cost amp Performance Requirements for Flexible Advanced Nuclear Plants in Future US Power Markets 16
that can quickly inject power when VREmdasheither expectedly or unexpectedlymdashgoes offline Beyond backfilling when the wind and sun are unavailable the grid needs resources that can ramp down as VRE generation comes online in the morning and ramp up as the sun goes down in the evening Figure 4 below presents the net load curve 22 for a spring day in California in 2017 As more VRE is built the net load curversquos lsquobellyrsquo will drop even further making it more difficult to meet demand during morning and evening ramps This provides a useful reference case for other markets that will ultimately encounter steepening net load curves
Figure 4 Net Load Curve in CAISO for April 9 2017 23
Increasing VRE not only requires increasing grid flexibility it also triggers more renewables curtailment and transmission congestion (affecting locational marginal prices) Further VRErsquos capacity to reduce expected reliability problems or outage events (measured by their Effective Load Carrying Capability or ELCC) diminishes as more VRE is deployed (see Figure 5) This helps explain why most lsquohigh renewablesrsquo scenarios in the mid-2030s still include a large amount of fossil generationmdashparticularly natural gas24
Figure 5
Cost amp Performance Requirements for Flexible Advanced Nuclear Plants in Future US Power Markets 17
Figure 5 Wind and Solar ELCC Curves as a Function of Installed Capacity in MISO25
In summary the grid was not designed around the irregular and unscheduled generation inherent to VREs More lsquoflexible resourcesrsquo such as energy storage fast ramping gas plants and demand side resources will be needed to accommodate more VRE while maintaining a high level of grid stability Advanced nuclear reactors if designed to be flexible could play a meaningful role in enabling more VRE deployment To do so they will need to be compensated for the inherent value of being flexible and dispatchable Current market mechanisms do not incentivize nuclear plants to operate flexibly nor reward them for supporting grid stability This has created extremely challenging conditions and made it difficult for conventional nuclear projects to be profitable
43 Conventional Nuclear Plants Face Fundamental Headwinds
Conventional nuclear plants typically operate as lsquomust-runrsquo baseload resources While they are capable of a moderate degree of ramping the economics of doing so in most cases are poor Conventional nuclear plants were initially designed to ramp (up and down) load follow and provide several ancillary services products26 Current reactor designs with best-in-class ramping capabilities such as EDFrsquos EPR and Westinghousersquos AP1000 can safely ramp to a maximum of approximately 5minute2728 However due to high capital costs and low marginal costs of nuclear plantsmdashparticularly in deregulated marketsmdashthey seek to operate at their maximum rated capacity for as long as possible When market prices fall below a nuclear plantrsquos operating costs the plant operates at a financial loss While they may forgo energy sales and provide operating reserves under these conditions it is only economical to do so in highly specific scenarios29 Operating at a loss or at declining profit marginsmdashespecially over a long period of timemdashcan materially impact a plantrsquos economics In markets with significant VRE penetration (eg CAISO) clearing prices can approach zero or below30 during periods of exceptional sun or wind and relatively low demand These pricing events force nuclear and other lsquomust-runrsquo resources to operate at a loss or go offline Low natural gas prices and the anticipation that VRE will continue to push prices downward has motivated several utilities to retire
Cost amp Performance Requirements for Flexible Advanced Nuclear Plants in Future US Power Markets 18
nuclear plants or not renew their operating licenses31 In fact these difficult economic conditions have forced six nuclear plants to close in the past five years with nine more planning to retire in the next 10 years (representing more than 18 GW of generation capacity)32 Further the average age of US nuclear plants is approximately 37 years Plants become more expensive to operate as they age33 Absent significant changes to nuclearrsquos CapEx operating profile or revenue opportunities (particularly capacity payments) it is difficult to see how conventional nuclear will successfully navigate a market environment with low energy prices going forward It is important to note that nuclear plants are not the only generators experiencing difficult economics due to low energy prices Natural gas plants are seeing a higher percentage of their revenues coming from non-energy sales (mostly capacity and reserve payments) Low energy price environments affect all resources
431 Non-Market Payments Keep Some Conventional Nuclear Plants OperationalSeveral states have been passing legislation to provide nuclear plants with payments to ensure they continue to run even as power market conditions worsen Illinois New Jersey Connecticut New York and Ohio have all authorized payments to keep nuclear plants online Pennsylvania has proposed legislation to do the same34 Maryland is currently analyzing whether nuclear should be eligible for clean-energy credits35 Proponents of legislative measures see preserving existing nuclear plants as a cost-effective means (on a $MWh basis) of achieving their emissions-reduction goalsWhile some form of lsquonon-market paymentsrsquo may be available to advanced nuclear developers in the mid-2030s it is neither likely nor clear how they would be structured Therefore the possibility of such payments should not influence design decisions being made today If markets begin to offer compensation to dispatchable resources that provide grid stability and dependability or for emissions-free generation these out-of-market payments will become less important or entirely unnecessary Several plant owners are also looking into potential non-power market revenue streams such as hydrogen production36 to improve economic performance Until these changes occur low natural gas prices (which according to natural gas price futures are not expected to rise substantially in the coming years) and increasing VRE deployment will challenge nuclear plant economics in several markets
Cost amp Performance Requirements for Flexible Advanced Nuclear Plants in Future US Power Markets 19
5 To calculate the maximum allowable CapEx LucidCatalyst transferred PLEXOS outputsmdashwhich included energy revenues and plant outputcapacity factors for both the plant and if necessary the ESS systemmdashinto a lsquopost-PLEXOSrsquo financial model Here capacity payments and various financial assumptions are applied to determine the final allowable CapEx Figure 6 on the following page provides a high-level diagram of the methodology which is described in detail in this section
51 Overview of PLEXOS Electricity Market Modeling Software
PLEXOS is a production cost model for electricity markets in the US (with other international versions available) that can simulate future market conditions Production cost models predict the economic dispatch of power plants in a given service territory or market and across a defined timeframe PLEXOS has been widely used since 1999 by grid operators utilities and electricity market analysts For this analysis data on expected hourly demand for each service territory comes with the software package and the program determines the optimal mix of power plants to meet demand in each hour at the lowest cost Results include plant power operational details market price forecasts and CO2 emissions from fuel consumption at fossil plants PLEXOS determines the optimal production patterns from power plants based on marginal cost pricing as illustrated in the stylized power market diagrams in Section 3 PLEXOS contains detailed data on existing power plants (including their capacity outage requirements energy conversion efficiencies etc) solar and wind availability by location demand forecasts fuel price forecasts transmission line limits emissions rates and all other necessary inputs for performing market simulations LucidCatalyst adjusted some of the built-in data for the future baseline scenario and entered new inputs to represent flexible advanced nuclear plants with energy storage as discussed in the next two subsections
PLEXOS and Financial Modeling Methodology and AssumptionsLucidCatalyst used PLEXOSreg electricity market modeling software from Energy Exemplar to model the revenue potential of flexible advanced nuclear technology (and thus an implied maximum CapEx) in four US future power markets ISO-NE PJM MISO and CAISO The modeling exercise examines a hypothetical plantrsquos annual revenue profile as it responds to fluctuations in demandmdasheither through ramping up and down or through a combination of ramping and co-located energy storage systems PLEXOS provides empirical precision for a projectrsquos annual capacity factor and the optimal output in response to changing market conditions LucidCatalyst also ran additional modeling scenarios to observe the effect of CO2 prices and the aggregate impact of multiple flexible advanced nuclear plants on market prices
Figure 6
Cost amp Performance Requirements for Flexible Advanced Nuclear Plants in Future US Power Markets 20
Figure 6 High-Level Methodology Diagram for Calculating Maximum Allowable CapEx
52 Modeling Methodology
521 Modeling HorizonLucidCatalyst used PLEXOS to model electricity markets in 2018 (to show recent data) and 2034 The year 2034 was selected as a baseline year to model for two reasons First it is far enough in the future (halfway to 2050) when advanced reactors are expected to be commercially available This is supported by several advanced nuclear companies claiming they will have a commercially available reactor in the late 2020s37 Second this date also provides more time for ISOs to transition beyond what is currently being modeled in each ISOrsquos current forward-looking plans Developing credible grid scenarios for 2034 presents obvious challenges State and regional policymakers are developing ambitious emissions-reduction targets as the cost of wind solar and energy storage all continue to fall Demand-side technologies are becoming more relevant and the electrification of transportation and heat continue to be key areas of policy focus As these trends
Cost amp Performance Requirements for Flexible Advanced Nuclear Plants in Future US Power Markets 21
develop ISOs are experimenting with new market products as discussed in Appendix B to reward resource flexibility (which may change the capacity mix and dispatch order of a future grid) Modeling the operation of flexible advanced nuclear plants (with and without energy storage) in 2034 did not require making assumptions about construction time in PLEXOS Construction is assumed to have finished by 2034 so that hypothetical plants are ready for operation in that year Importantly the scenarios are not being run to determine the timing of capacity additions by one or more advanced nuclear plants The modeling largely focuses on the cost of the first advanced nuclear plant in a given ISO
522 Modeling ScenariosThe LucidCatalyst team modeled two main scenarios in 2034 a baseline lsquolow renewablesrsquo (low RE) scenario based on PLEXOSrsquo built-in resource mix for 2034 and a lsquohigh renewablesrsquo (high RE) scenario based on the lsquoLow natural gasLow RE costrsquo scwenario in NRELrsquos ReEDS model which has a significantly higher proportion of renewables These scenarios were selected to define the range of potential likely outcomes and allow for a comparative analysis of the impacts of flexible advanced nuclear plants on generation mix market prices and other modeling variablesThe 2034 lsquolow RErsquo grid mix was consistent with the mix produced by Energy Exemplar (developers of the PLEXOS software) It reflects a long-term capacity expansion outlook38 that reflects expected plant retirements plants under construction and plant announcements Additionally it reflects an optimized build out of generators considering Renewable Portfolio Standards (RPS) the impacts of other emissions-based regulations and expected resource cost curves39 The output assumes relatively higher penetrations of natural gas capacity with relatively modest additions to renewable energy capacity (ie just enough to meet existing RPS standards) For the higher renewables scenario the team adopted the 2034 NREL ReEDS lsquoLow natural gas Low RE costrsquo scenario40 NREL developed their ReEDS model to forecast power plant capacity changes generation mixes and related electricity market impacts from a range of policy and economic assumptions The assumptions underlying the lsquoLow natural gas Low RE costrsquo lead to high capacities and generation levels for natural gas plants and renewable energy facilities such as solar and wind LucidCatalyst calibrated the 2034 baseline scenario in PLEXOS by matching the power plant type and location to the ReEDS scenario Under the lsquolow RErsquo and lsquohigh RErsquo scenario umbrellas a total of nine cases were modeled (see Table 3 below) The lsquolow RErsquo cases include a 2034 baseline without any advanced nuclear plants and individual runs for one plant with and without co-located energy storage system (ESS) The idea is to estimate the maximum allowable CapEx for the first plant in the marketplace Importantly initial modeling showed little difference between the allowable CapEx for the first and fifth plant in smaller markets like ISO-NE In larger markets like PJM it takes dozens of advanced nuclear plants to affect energy prices to the point that the maximum allowable CapEx is significantly different The same cases are run for the lsquohigh RErsquo scenario with two additional cases that examine the impact of hypothetical CO2 pricing a large fleet of advanced nuclear plants operating in the same market and different OampM assumptions on allowable CapEx
Cost amp Performance Requirements for Flexible Advanced Nuclear Plants in Future US Power Markets 22
Table 3 Modeled Scenarios in PLEXOS
of Adv Nuclear Plants
ISO-NE PJM MISO CAISO
2034 Low RE
1 Low RE Baseline 0 n n n n
2 Low RE wout Thermal ES 1 n n n n
3 Low RE with Thermal ES 1 n n n n
2034 High RE
4 High RE Baseline 0 n n n n
5 High RE wout Thermal ES 1 n n n n
6 High RE with Thermal ES 1 n n n n
7 High RE Fleet Advanced Nuclear + ESS varies by ISO n n n n
2034 High RE w Carbon Price
8 High RE Baseline with CO2 Price ($25 $50 $75tonne) with and without ESS
1 n
2034 Alternative OampM Costs (Low amp High RE)
9 Higher OampM Costs Relative to Baseline Assumption (for both Low and High RE scenarios)
1 n n n n
Figure 7
Cost amp Performance Requirements for Flexible Advanced Nuclear Plants in Future US Power Markets 23
523 Modeling RegionsModeling four markets provides insights into the variety of contexts in which flexible advanced nuclear plants may be deployed It leads to different results for wholesale energy prices advanced nuclear plant operational expectations and financial calculations such as maximum allowable CapEx The following map and table show the geographic extents of the four competitive wholesale markets and total power plant capacity and power demand in 2018 and 2034
Figure 7 US Regional Power Markets
Source Federal Energy Regulatory Commission
Cost amp Performance Requirements for Flexible Advanced Nuclear Plants in Future US Power Markets 24
Table 4 Total Capacity and Power Demand in the Four Markets in 2018 and 2034
Market 2018
Total Capacity
2034 Low Renewables
2034 High Renewables1
Total Demand
2018 2034 Low or Higher RE2
ISO New England 35 GW 44 GW 47 GW 124 TWh 110 TWh
PJM 203 GW 239 GW 281 GW 806 TWh 869 TWh
MISO 175 GW 229 GW 243 GW 709 TWh 838 TWh
CAISO 74 GW 86 GW 88 GW 261 TWh 272 TWh
1 In the flexible advanced nuclear scenario for 2034 a fleet of flexible advanced nuclear plants with energy storage are added while maintaining capacity between the 2034 scenarios
2 The 2034 scenario and 2034 flexible advanced nuclear scenario have the same total demand but net imports or exports differ between them for markets modeled with neighboring areas leading to changes in generation between the two scenarios
PLEXOS models these ISOs as aggregations of their component service territories (also called load zones) ISO-NE has 13 service territories PJM has 20 MISO has 10 and CAISO has 9 Results tables for the flexible advanced nuclear scenarios shown below in Section 7 identify the service territories in which flexible nuclear plants were assumed to operateThe four electricity markets differ in several key respects regarding power plant capacity and generation mix Under 2034 baseline conditions ISO New England has high levels of natural gas and wind (mostly offshore) PJM stands out among the regions for its higher reliance on conventional nuclear plants and coal plants MISO has the most wind capacity and generation (onshore) among the regions and CAISO has the most solar (as well as significant amounts of wind)Monetary inputs and outputs for the PLEXOS modeling are expressed in constant 2019 dollars This analysis uses the PLEXOS modelrsquos built-in data for demand projections within each service territory It also uses the modelrsquos built-in transmission constraints between service territories parameters for the thousands of existing plants plants under construction and those that are expected to be built according to Energy Exemplarrsquos capacity expansion model The analysis uses a consistent natural gas price of $300MMBtu in constant dollars for 2018 and 2034 to avoid introducing differences in market prices or plant dispatch arising from underlying fuel price differences The PLEXOS modelrsquos built-in price projections for other fuel prices are maintained The analysis also maintains the built-in price projections for CO2 emission fees in the Northeast Regional Greenhouse Gas Initiative ($17tonne in 2034) and California ($22tonne in 2034) and there is no national CO2 emission fee because such a program has not been enacted by Congress and the Clean Power Plan is being reconsidered In accordance with the most recent federal energy legislation which phases out the Production Tax Credit (PTC) for renewables the modeling does not include these support mechanisms
0
Cost amp Performance Requirements for Flexible Advanced Nuclear Plants in Future US Power Markets 25
524 Modeling Inputs for Flexible Advanced Nuclear Plants with Energy StorageThe modeling software treats the nuclear plant and energy storage system as two facilities whereby the storage facility charge at a rate no greater than the amount of power being produced at the nuclear plant Setting this model constraint (ie defining the relationship between the two facilities) in PLEXOS is equivalent to envisioning the energy storage system at the same site as the nuclear power plant charging from the nuclear plantrsquos production at certain times and discharging at other times LucidCatalyst assumed the ESS was a thermal storage system which stores energy as heat and subsequently uses the heat to make steam which is sent through a dedicated steam turbine A high-level schematic of such a thermal storage system charging and discharging is provided in Figure 8 below
Figure 8 Charging and Discharging Configuration of Advanced Nuclear Plant with Thermal ESS
It is important to note that PLEXOS does not require CapEx estimates for the advanced nuclear plant energy storage system or any other addition to the electricity grid in order to model dispatch (such as the solar and wind additions for alignment with the NREL ReEDS scenario) It economically dispatches resources based on their marginal cost and revenue maximization opportunities For ESS configurations if future market prices are expected to be higher than current prices PLEXOS assumes the operator sends energy to storage (assuming the system is not yet full) The LucidCatalyst team entered the proceeding operating parameters for plants into PLEXOS and allowed it to determine the optimal mix of resources to meet demand based on their marginal costs as discussed above without reliance on CapEx estimates in the model
Cost amp Performance Requirements for Flexible Advanced Nuclear Plants in Future US Power Markets 26
53 Illustrative Advanced Nuclear Plant and Energy Storage System Assumptions
For modeling purposes LucidCatalyst developed an illustrative advanced nuclear plant that assumes a uniform design and does not reflect a specific reactor technology Physical specifications for this illustrative plant as well as the thermal ESS are listed in the tables below41 42
Table 5 Assumed Capacity and Operating Specifications for Illustrative Advanced Nuclear Plant
Advanced Nuclear Specifications
Assumption Rationale
Net Electric Capacity (MWe)
500 This reflects the typical size of what the flexible nuclear plant would likely replace a combined cycle gas plant (CCGT) MEITNER Design Teams are developing reactors across a broad range of scales from 02 MWe to 1200 MWe The smaller reactors are being designed for niche markets whereas this study looks at those looking to compete in power markets
Thermal Efficiency 40 This roughly represents the midpoint within the range of thermal efficiencies for advanced nuclear concepts1 and includes some losses from the energy storage system
Heat Rate (BtukWh) 8530 Btu content of a kWh is 3412 Btu2 This figure is divided by the thermal efficiency
Maximum Potential Capacity Factor
92 The advanced nuclear plants are assumed to take a four-week outage each year (8 of annual hours) for refueling and other maintenance Their capacity factors may be lower to avoid operating at a loss during low-price periods from the PLEXOS modeling
Outlet Temperature 600 ndash 700degC While there are a range of outlet temperatures for advanced reactors (480 ndash 1000degC)3 an outlet temperature of 600 ndash 700degC is assumed This is the same rated inlet temperature for most heat steam recovery generators (HSRG) used for CCGTsmdashallowing the application of HSRG cost assumptions for the energy storage system
Minimum Stable Factor
0 This implies that the plant can ramp all the way down to 0 operating capacity which is a significant departure from conventional nuclear plants that typically have a minimum stable factor of 70
Maximum Ramp Rate
5minute (25 MWmin)
EDFrsquos EPR and Westinghousersquos AP1000 both have max ramp rates of ~5minute4
1 WNA Advanced Nuclear Power Reactors 2019
2 US Energy Information Administration (2019) What is the efficiency of different types of power plants
3 Congressional Research Service (2019) Advanced Nuclear Reactors Technology Overview and Current Issues
4 OECD-NEA Technical and Economic Aspects of Load Following with Nuclear Power Plants 2011 p 8
Cost amp Performance Requirements for Flexible Advanced Nuclear Plants in Future US Power Markets 27
Table 6 Assumed Specifications for Energy Storage
Energy Storage Specifications
Assumption Rationale Used in CapEx Analysis (YN)
Rated Output (MW) 500 Advanced reactor capacities range significantly Y
Hours of Storage (MWh) 12 Assumes 12 hours of 500 MW output Y
Energy Storage Roundtrip Efficiency
90 Assumes a charge efficiency of 90 and discharge efficiency of 100 (implying a round-trip efficiency of 90)
Y
Outlet Temperature 600 ndash 700degC This assumes that the outlet temperature is sufficiently high to be used in a lsquooff-the-shelfrsquo steam turbine
N
Assumed Energy Storage Capacity
6000 MWh Assumes 12 hours of storage (rated at maximum output) Y
Maximum State of Charge 100 The energy storage system can charge to full capacity at any point (no governor)
Y
Minimum State of Charge 0 The energy storage system can discharge completely at any point (no governor)
Y
PLEXOS does not require CapEx inputs for the ESS just a marginal cost of operation The ESSrsquo marginal cost will differ depending on system type however because it does not use fuel and requires extremely small amount of OampM it is rarely if ever a marginal resource (and therefore never sets the energy clearing price) For these reasons LucidCatalyst assumed $0MWh for the ESSrsquo marginal cost Even if LucidCatalyst assumed a high-end marginal cost of say $5MWh the systemsrsquo dispatch would not change (nor would its revenues) as natural gas plants almost always set the clearing price and their marginal costs are 5 ndash 6x higher on average43 For the benefit of advanced reactor developers LucidCatalyst conducted a high-level CapEx review for three types of storage systems that would be complementary to advanced nuclear plants firebricks molten salt and flow batteries44 This review is included in Appendix E
54 Revenue Assumptions
LucidCatalyst assumed that advanced nuclear plant revenues were limited to energy sales and capacity payments While LucidCatalyst recognizes that increasing VRE deployment will likely stimulate an increase in demand for ancillary servicesmdashparticularly spinning reservesmdashLucidCatalyst expects that the increase in demand will be met by an increase in ancillary service market participation thus mitigating any significant increase in clearing prices Energy revenues are calculated by the plantrsquos output operating hours and clearing price LucidCatalyst assumes a range of potential capacity payments ($50 $75 $100kW per year) Importantly because the energy storage system is sized for 12 hours of rated output LucidCatalyst assumes that it also qualifies for a capacity payment45
Cost amp Performance Requirements for Flexible Advanced Nuclear Plants in Future US Power Markets 28
55 Fuel Costs and OampM Assumptions
551 Fuel CostsIn PLEXOS fuel costs for nuclear plants depend on two inputs (1) the price of uranium expressed in dollars per million British thermal units (MMBtu) and (2) the heat rate of each plant expressed in Btu per kWh which reflects the plantrsquos efficiency in converting fuel into electricity Preparing the fuel cost inputs for flexible advanced nuclear plants in PLEXOS therefore involves specifying these two inputsThe built-in dataset for PLEXOS contains a 2034 uranium price projection of $052MMBtu Analysts at Energy Exemplar (the company that licenses PLEXOS) develop price projections for uranium and other fuels to align with expectations from the US Energy Information Administration and other authoritative sources 46 The uranium price in PLEXOS represents the form of fuel currently used in US nuclear plants namely low-enriched uranium (LEU) with U-235 content between 3 to 5This modeling exercise aims to remain agnostic and neutral regarding reactor technologies and fuel sources for flexible advanced nuclear plants Some reactors would use LEU in a similar manner to current nuclear plants Other reactor technologies would encase the uranium in a tristructural-isotropic (TRISO) fuel pellet The use of high-assay low-enriched uranium (HALU) which rises above the typical enrichment for civil purposes toward levels for military applications is another option for advanced nuclear concepts The current lack of supply chains and mature markets for these novel fuels makes it difficult to forecast their prices into the modeling time horizon For these reasons LucidCatalyst assigned the built-in uranium price projection of $052MMBtu to flexible advanced nuclear plants for this analysisMost current nuclear plants in the United States have conversion efficiencies between 31 and 34 percent which equate to heat rates between 11000 and 10000 BtukWh47 As a result of engineering innovations and optimizations over time most of the recently constructed plants have higher efficiencies and lower heat rates than older plantsWhile this analysis refrains from specifying any particular reactor technology for the flexible advanced plants the assumed reactor outlet temperature stated above (600 to 700degC) allows for higher efficiency than conventional designs with lower outlet temperatures (around 325degC for pressurized water reactors and 290degC for boiling water reactors) Based on the target reactor temperature range historical improvements in efficiency and the strong incentive among developers to minimize fuel costs this analysis uses an efficiency of 40 and equivalent heat rate of 8530 BtukWh for flexible advanced nuclear plants in the PLEXOS modelingBy combining the uranium price projection and assumed heat rate flexible advanced nuclear plants have a fuel cost of $052MMBtu x 8530 BtukWh = $444kWh
552 Operating and Maintenance CostsConventional nuclear plants incur high operating and maintenance (OampM) costs because of the need for large site crews and extensive upkeep requirements for complex systems The typical headcount for a full-sized nuclear plant (around 1000 MW) is 800 people48 Many of the personnel positions relate to system monitoring accident preparedness security and maintenance activities The plants require frequent supplies such as makeup materials chemicals and gasesThe average OampM cost for US nuclear plants in 2018 was $1969MWh49 With an average capacity factor of 93 across the nuclear fleet this is equivalent to $160kW per year (combining fixed and variable OampM) Another data source for nuclear plants similar to the current fleet the US Energy Information Administration uses a fixed OampM cost of $103kW per year (equivalent to $1246MWh) and variable OampM cost of $237MWh in the latest version of their 2019 Annual Energy Outlook50 The variable OampM cost equates to $19kW after accounting for the average capacity factor leading to a combined fixed and variable OampM estimate of $122kW per year from this government source
Cost amp Performance Requirements for Flexible Advanced Nuclear Plants in Future US Power Markets 29
The flexible advanced nuclear plants in this modeling analysis are designed for more efficient operation than conventional nuclear plants They reflect the goal of utilizing concepts with superior safety and streamlined processes to reduce the need for complicated backup systems and large crews for monitoring accident preparedness etc Automation robotics and offsite controlresponse centers serving multiple units will also likely reduce staffing needs at advanced nuclear plants deployed in the 2030s As an example of staffing efficiencies at a new plant concept GE Hitachi anticipates a crew of 75 for its 300 MWe BWRX51
Staffing levels at natural gas and coal plants provide useful reference points for target operations at flexible advanced nuclear plants The US Department of Energy uses baseline crew counts of 5 people per shift (20 in total with 4 shifts) for a 630 MW natural gas combined-cycle plant and 14 people per shift (56 in total) for a 550 MW coal plant52 These staffing levels are highly relevant to the current context because the flexible advanced nuclear plants would have their turbine-generator system on a separate fluid loop from the reactor loop (a significant simplification in terms of safety and monitoring relative to conventional nuclear plants because no fluid in the turbine building would pass through the reactor)When Idaho National Laboratory assessed the potential costs of the Next Generation Nuclear Plant concept in 2010 the estimated crew headcount was 28 people for this High Temperature Gas Reactor with capacity of 274 MWe based on operational similarities with natural gas and coal plants53 The annual cost of staff insurance and taxes in this study is $11 million or $27kW-year After adjusting for currency inflation this value becomes $31kW-year in 2019 dollars (equivalent to $375MWh based on the capacity factor above)For this modeling analysis LucidCatalyst used the OampM estimate of $31kW-year from Idaho National Laboratoryrsquos 2010 study as the target level for flexible advanced nuclear plants in the 2030s The energy storage system is assumed to add no OampM costs to the plant because the potential medium such as firebrick or molten salt would simply charge and discharge energy by movements of air or other straightforward physical processes without the need for operators or maintenance activities The OampM parameter for the flexible advanced plants sets a clear goal for MEITNER Design Teams in their efforts to ensure the economic viability of their advanced nuclear concepts Subsequent sections of this report show the maximum allowable CapEx for flexible advanced nuclear plants based on this OampM parameter among other calculation inputs The maximum allowable CapEx would be lower (tighter constraint) in each market simulation if OampM costs were higher
Table 7 OampM and Fuel Assumptions
Category Value
OampM Cost $31kW-yr ($375 MWh)
Fuel Expenditures $444MWh ($37 kW-yr)
The OampM costs for the ESS system are assumed to be minimal54 and effectively immaterial as the ESS does not require fuel or significant operational expenses
Cost amp Performance Requirements for Flexible Advanced Nuclear Plants in Future US Power Markets 30
56 Modeling Result Categories
The following table summarizes the different PLEXOS model inputs and results
Table 8 PLEXOS Input and Result Categories
Inputs
Plant Capacities Plant capacities are inputs to PLEXOS (with adjustments by LucidCatalyst for baseline scenario calibration and flexible advanced nuclear additions) summed by plant type (natural gas solar wind etc) for regional total
Demand (load) Demand in each service territory is an input to PLEXOS summed across service territories for regional total
Results
Plant Operational Dispatch
PLEXOS determines the optimal combinations of plant production across the grid including output from the advanced nuclear plants to meet demand in each hour of the modeling period hourly dispatch is summed over year to calculate total generation by plant in 2034
Market Price PLEXOS calculates market price in each hour of the modeling period in each service territory based on the marginal costs of the marginal producer to meet demand market prices are averaged across service territories and hours in year to calculate average market price in 2034
CO2 Emissions PLEXOS uses plant operational dispatch fuel consumption per MWh and CO2 emission rate per unit of fuel consumption to calculate CO2 emissions from plant operation results are summed across plants and hours in year to calculate total CO2 emissions in each region in 2034
Advanced Nuclear Operational Dispatch
This is part of the broader plant dispatch results by hour described above
Energy Storage Charging and Discharging
PLEXOS optimizes the charging and discharging by hour for each energy storage system in the modeled region subject to the constraint limiting their hourly charging amount to the coupled nuclear plantrsquos production in the same hour
LucidCatalyst calculates maximum allowable CapEx by using operating profits which derives from a combination of PLEXOS results and supplemental assumptions (eg annual capacity payments)
Cost amp Performance Requirements for Flexible Advanced Nuclear Plants in Future US Power Markets 31
6 Illustrative Cash Flow AnalysisThis section presents a high-level cash flow analysis for an advanced nuclear plant with and without ESS This type of analysis is used to calculate maximum allowable CapEx and highlights key profitability drivers It also lays the foundation for understanding how different future market conditions can either threaten or enhance these drivers
As capital-intensive investments power plants recover CapEx over time from the difference between their annual revenue and operating expenditures In this section operating profits are calculated in this manner and presumed to be available for CapEx recovery Annual profits along with industry standard assumptions regarding payback period and interest rate are used to estimate maximum allowable CapEx expressed in $kWCalculating maximum allowable CapEx involves the following steps
1 Identify plant capacity and performance characteristics This involves specifying assumptions regarding plant capacity annual capacity factor and for the ESS round-trip efficiency (the total efficiency of one charge and discharge cycle)
2 Calculate wholesale energy revenue This step occurs in PLEXOS but simply includes a calculation whereby the clearing price is multiplied by the plantrsquos output (MW) in each hour This reflects scheduled down time for plant maintenance and other things (eg refueling) that might affect the plantrsquos annual capacity factor
3 Add capacity payments In addition to wholesale energy revenue LucidCatalyst assumes that the advanced nuclear plant receives capacity payments This step applies a range of potential capacity prices in $kW per year and shows the calculated payments
4 Calculate operating expenditures The three components of operating expenditures for the flexible advanced nuclear plantmdashfuel variable OampM and fixed OampMmdashare summed in this step
5 Calculate operating profit for CapEx recovery The difference between annual revenue (summing wholesale energy revenue with capacity payments) and annual operating expenditures (summing fuel fixed OampM and variable OampM) represents the operating profit per year for CapEx recovery The implied maximum allowable CapEx is derived from the annual operating profit which is based on additional financial parameters such as financing rates and the allowed length of time to pay back the lender
61 Estimating Annual Revenue for a 500 MW Illustrative Plant
Estimating annual revenue includes only two components energy revenue and capacity payments
611 Energy RevenueEnergy revenue is driven by market prices and how many hours each system is operating at its maximum output For the purposes of this illustrative cash flow analysis the average clearing price over the year is $22MWh which is within the range of modeled prices in 2034 For plants with ESS the
Cost amp Performance Requirements for Flexible Advanced Nuclear Plants in Future US Power Markets 32
amount of energy sent to storage will be different for each market due to pricing conditions However for the purposes of this analysis it is assumed that 25 of the nuclear plant output is to go toward charging the ESS system (which is similar to what bears out in PLEXOS) Because the ESS system is optimized to discharge when prices are at their highest the average clearing prices at which the ESS sells power is $25MWh (as opposed to $22MWh) Also because the nuclear plant charges the ESS when prices are at their lowest the average clearing price for the rest of the energy sent to the grid is slightly higher than the annual average For this analysis this is assumed to be $2250MWh The following table represents the energy revenue for each plant configuration
Table 9 Energy Revenue for Each Plant Configuration
Dispatch from Adv Nuclear Plant Total MWh Average Clearing Price (MWh)
Total Energy Revenue
Without ESS
500 MW Nuclear Plant Capacity 500 MW x
Capacity Factor 92 x
8760 hoursyear
403 million $22 $886 million
With ESS
500 MW Nuclear Plant Capacity 500 MW x
Capacity Factor 92 x
75 of output sent to grid 6570 hoursyear
302 million $2250 $68 million
500 MW
ESS System
Capacity 500 MW x
Capacity Factor 92 x
Roundtrip Efficiency 90 x
12-hours avg daily output 4380 hoursyear
907660 $25 $227 million
Total $907 million
The difference in energy revenue between the two configurations is largely driven by the delta between the two average clearing prices and roundtrip efficiency It is also important to note that revenues are sensitive to the input assumptions regarding capacity factor roundtrip efficiency and the systemrsquos power rating and discharge capacity (duration) Making significant modifications to these parameters can materially impact revenues Other thermal storage characteristics (ie thermal stability heat conductivity response time etc) are excluded from the example and assumed to have immaterial consequences on the systemsrsquo operation
Cost amp Performance Requirements for Flexible Advanced Nuclear Plants in Future US Power Markets 33
612 Capacity Revenue In addition to energy sales nuclear plants also typically receive some form of capacity payment Capacity programs encourage resources to be built andor made available during periods with high demand This analysis uses three hypothetical capacity prices $50 $75 or $100kW per year (the middle value of $75kW per year reflects the approximate average of capacity prices in ISO New England recently and a higher-end capacity price seen in recent PJM auctions) There is inherent uncertainty regarding future price levels as capacity programs continue to evolve however if energy prices continue to fall one could argue that stimulating new project investment in such an environment would warrant higher capacity pricesA $75kW-year capacity payment translates to $375 million for the plant without co-located energy storage Plants with 12 hours of energy storage can effectively supply 1000 MW of power through two 500 MW turbine-generators As mentioned in the previous section LucidCatalyst assumes that the ESS receives a full capacity payment as well This translates to an annual capacity payment of $75 million for the plant with storage
62 OampM Expenditures
The following table highlights the OampM expenses for the illustrative plant OampM for the ESS is assumed to be de minimis and because the advanced nuclear plant operates at the same output under both configurations the OampM expenditures are assumed to be the same under both configurations
Table 10 Advanced Nuclear Plant OampM Expenditures
Cost Category Calculation Estimated Value
OampM $31kW-yr ($375MWh) X 500 MW $15 million
Fuel $444MWh X 4073400 MWhs $18 million
Total $33 million
63 Maximum CapEx
Calculating maximum allowable CapEx involves calculating the total annual revenue (energy revenue and capacity payments) and subtracting the total annual operating expenditures (fixed and variable OampM) The result is the annual operating profit which along with a capital recovery period (eg 22 years) and cost of capital (reflected here as the interest rate) is used to calculated maximum allowable CapEx for a breakeven profit The table below estimates this for both plant configurations
Cost amp Performance Requirements for Flexible Advanced Nuclear Plants in Future US Power Markets 34
Table 11 Estimated Annual Plant Revenue Expenditures and Operating Profits for CapEx Recovery ndash Without ESS and With ESS
Illustrative Analysis Without ESS With ESS
Scenario Specifications
of Nuclear Plants 1 1
Reactor Capacity 500 MWe 500 MWe
Avg Annual Capacity Factor 92 92
of Annual Output to ESS System ndash 50
Revenue
Nuclear Plant ndash Avg Energy Price Received $22MWh $22MWh
Nuclear Plant ndash Direct Sales Revenue $90 M $45 M
Nuclear amp ESS ndash Avg Energy Price Received ndash $28MWh
ESS Net Generation Revenue ndash $51 M
Total System Energy Revenue $90 M $96 M
Total Revenue
Low (assumes $50kW-yr capacity payment) $115 M $146 M
Mid (assumes $75kW-yr capacity payment) $127 M $171 M
High (assumes $100kW-yr capacity payment) $140 M $196 M
Expenditures
Fuel Expenditures $18 M $18 M
Other Variable OampM Expenditures $0 M $0 M
Fixed OampM Expenditures $15 M $15 M
Total Operating Expenditures $33 M $33 M
Operating Profits for CapEx Recovery
Low Capacity Price Case $81 M $113 M
Mid Capacity Price Case $94 M $138 M
High Capacity Price Case $106 M $163 M
Maximum Plant CapEx for Profit Breakeven
Low Capacity Price Case $1798kW $2496kW
Mid Capacity Price Case $2075kW $3049kW
High Capacity Price Case $2351kW $3602kW
The following figure shows the ranges of maximum allowable CapEx with or without energy storage based on the parameter assumptions described above Pink cells indicate unfavorable combinations of low energy and capacity prices leading to tight limits on CapEx while green cells indicate favorable combinations of high prices leading to higher allowable CapEx The lower pane for the case without energy storage has tighter limits on CapEx than the upper pane with energy storage because of foregone capacity payments
With ES $50kW-yr $60kW-yr $70kW-yr $75kW-yr $80 kW-yr $90kW-yr $100kW-yr
$10MWh $1225 $1446 $1667 $1778 $1888 $2110 $2331
$15MWh $1653 $1874 $2095 $2206 $2317 $2538 $2759
$20MWh $2081 $2302 $2523 $2634 $2745 $2966 $3187
$22MWh $2252 $2473 $2695 $2805 $2916 $3137 $3358
$24MWh $2423 $2645 $2866 $2976 $3087 $3308 $3529
$26MWh $2595 $2816 $3037 $3148 $3258 $3479 $3701
$28MWh $2766 $2987 $3208 $3319 $3429 $3651 $3872
$30MWh $2937 $3158 $3379 $3490 $3601 $3822 $4043
$35MWh $3365 $3586 $3807 $3918 $4029 $4250 $4471
$40MWh $3793 $4014 $4235 $4346 $4457 $4678 $4899
Without ES $50 kW-yr $60kW-yr $70kW-yr $75kW-yr $80kW-yr $90kW-yr $100kW-yr
$10MWh $717 $827 $938 $993 $1049 $1159 $1270
$15MWh $1167 $1278 $1389 $1444 $1499 $1610 $1720
$20MWh $1618 $1729 $1839 $1894 $1950 $2060 $2171
$22MWh $1798 $1909 $2019 $2075 $2130 $2241 $2351
$24MWh $1978 $2089 $2200 $2255 $2310 $2421 $2531
$26MWh $2159 $2269 $2380 $2435 $2490 $2601 $2712
$28MWh $2339 $2449 $2560 $2615 $2671 $2781 $2892
$30MWh $2519 $2630 $2740 $2796 $2851 $2962 $3072
$35MWh $2970 $3080 $3191 $3246 $3301 $3412 $3523
$40MWh $3420 $3531 $3641 $3697 $3752 $3863 $3973
$1225 $1446 $1667 $1778 $1888 $2110 $2331
$1653 $1874 $2095 $2206 $2317 $2538 $2759
$2081 $2302 $2523 $2634 $2745 $2966 $3187
$2252 $2473 $2695 $2805 $2916 $3137 $3358
$2423 $2645 $2866 $2976 $3087 $3308 $3529
$2595 $2816 $3037 $3148 $3258 $3479 $3701
$2766 $2987 $3208 $3319 $3429 $3651 $3872
$2937 $3158 $3379 $3490 $3601 $3822 $4043
$3365 $3586 $3807 $3918 $4029 $4250 $4471
$3793 $4014 $4235 $4346 $4457 $4678 $4899
$717 $827 $938 $993 $1049 $1159 $1270
$1167 $1278 $1389 $1444 $1499 $1610 $1720
$1618 $1729 $1839 $1894 $1950 $2060 $2171
$1798 $1909 $2019 $2075 $2130 $2241 $2351
$1978 $2089 $2200 $2255 $2310 $2421 $2531
$2159 $2269 $2380 $2435 $2490 $2601 $2712
$2339 $2449 $2560 $2615 $2671 $2781 $2892
$2519 $2630 $2740 $2796 $2851 $2962 $3072
$2970 $3080 $3191 $3246 $3301 $3412 $3523
$3420 $3531 $3641 $3697 $3752 $3863 $3973
$1225 $1446 $1667 $1778 $1888 $2110 $2331
$1653 $1874 $2095 $2206 $2317 $2538 $2759
$2081 $2302 $2523 $2634 $2745 $2966 $3187
$2252 $2473 $2695 $2805 $2916 $3137 $3358
$2423 $2645 $2866 $2976 $3087 $3308 $3529
$2595 $2816 $3037 $3148 $3258 $3479 $3701
$2766 $2987 $3208 $3319 $3429 $3651 $3872
$2937 $3158 $3379 $3490 $3601 $3822 $4043
$3365 $3586 $3807 $3918 $4029 $4250 $4471
$3793 $4014 $4235 $4346 $4457 $4678 $4899
$717 $827 $938 $993 $1049 $1159 $1270
$1167 $1278 $1389 $1444 $1499 $1610 $1720
$1618 $1729 $1839 $1894 $1950 $2060 $2171
$1798 $1909 $2019 $2075 $2130 $2241 $2351
$1978 $2089 $2200 $2255 $2310 $2421 $2531
$2159 $2269 $2380 $2435 $2490 $2601 $2712
$2339 $2449 $2560 $2615 $2671 $2781 $2892
$2519 $2630 $2740 $2796 $2851 $2962 $3072
$2970 $3080 $3191 $3246 $3301 $3412 $3523
$3420 $3531 $3641 $3697 $3752 $3863 $3973
Cost amp Performance Requirements for Flexible Advanced Nuclear Plants in Future US Power Markets 35
Figure 9 Ranges of Maximum Allowable CapEx ($kW) ndash With ESS and Without ESS
Cost amp Performance Requirements for Flexible Advanced Nuclear Plants in Future US Power Markets 36
7 PLEXOS Modeling Results for 2034This section presents results from modeling flexible advanced nuclear plants with and without energy storage in the four identified markets (ISO New England PJM MISO and CAISO) Each subsection presents the baseline 2034 resource mix and then the CapEx for the first plant entering the market (with and without storage)
71 ISO New England
The table below highlights the total plant capacity by resource as well as the annual generation in all modeled scenarios in ISO-NE Most of the capacity and generation in this market comes from natural gas Most of the wind capacity in this market is offshore
Table 12 Resource Capacity and Generation in ISO-NE for the Modeled Scenarios
Installed Capacity amp Generation
Total Coal Nat Gas
Oil Existing Nuclear
Hydro Solar Wind BioOther
Net Imports Exports1
2018 Benchmark
GW 35 1 15 6 3 4 1 1 4 ndash
TWh 124 1 67 0 25 8 1 3 10 -10
2034 Low RE Future
GW 44 1 19 6 3 4 4 3 5 ndash
TWh 110 0 43 0 25 8 7 8 10 -9
2034 High RE Future
GW 47 0 16 4 3 4 9 7 5 ndash
TWh 110 0 28 0 25 8 18 21 10 -2
1 Imports are negative exports are positive
A separate table below summarizes PLEXOS results for annual average market prices revenue and operating expenditures for ISO-NE in the various scenarios It also presents the maximum allowable CapEx which for all four ISO modeling results reflects the financial assumptions of a 22-year CapEx recovery period55 and a 50-50 split of debt and equity financing with a weighted average cost of capital (WACC) of 756
Cost amp Performance Requirements for Flexible Advanced Nuclear Plants in Future US Power Markets 37
Table 13 PLEXOS Results for ISO-NE
Low RE Future wout ESS
with ESS
High RE Future wout ESS
with ESS
Scenario Specifications
of Nuclear Plants 1 1 1 1
Reactor Capacity 500 MWe 500 MWe 500 MWe 500 MWe
Representative Load Zone Mass Central Mass Central Mass Central Mass Central
Annual Avg Energy Market Price $2756MWh $2757MWh $2367MWh $2390MWh
Avg Annual Capacity Factor 92 92 85 86
of Annual Output to ESS System ndash 24 ndash 31
Revenue
Nuclear Plant ndash Avg Energy Price Received $2773MWh $2771MWh $2580MWh $2572MWh
Nuclear Plant ndash Direct Sales Revenue $112 M $84 M $96 M $66 M
Nuclear amp ESS ndash Avg Energy Price Received ndash $2976MWh ndash $2970MWh
ESS Net Generation Revenue ndash $33 M ndash $42 M
Total System Energy Revenue $112 M $117 M $96 M $108 M
Total Revenue
Low (assumes $50kW-yr capacity payment) $137 M $167 M $121 M $158 M
Mid (assumes $75kW-yr capacity payment) $149 M $192 M $133 M $183 M
High (assumes $100kW-yr capacity payment) $162 M $217 M $146 M $208 M
Expenditures
Fuel Expenditures $18 M $18 M $16 M $17 M
Other Variable OampM Expenditures $0 M $0 M $0 M $0 M
Fixed OampM Expenditures $15 M $15 M $15 M $15 M
Total Operating Expenditures $33 M $33 M $32 M $32 M
Operating Profits for CapEx Recovery
Low Capacity Price Case $103 M $134 M $89 M $126 M
Mid Capacity Price Case $116 M $159 M $101 M $151 M
High Capacity Price Case $128 M $184 M $114 M $176 M
Maximum Plant CapEx for Profit Breakeven
Low Capacity Price Case $2289kW $2962kW $1965kW $2788kW
Mid Capacity Price Case $2566kW $3515kW $2242kW $3341kW
High Capacity Price Case $2843kW $4068kW $2519kW $3894kW
Cost amp Performance Requirements for Flexible Advanced Nuclear Plants in Future US Power Markets 38
72 PJM
The tables below highlight the total plant capacity by resource (including the annual generation in all modeled scenarios) as well as a summary of the PLEXOS results for PJM This market has the most coal capacity and generation of the four markets modeled in this analysis The High RE Future has several times more solar and wind capacity and generation than the Low RE Future This market is modeled without neighboring zones (no imports or exports) because of its large geographic breadth
Table 14 Resource Capacity and Generation in PJM for the Modeled Scenarios
Installed Capacity amp Generation
Total Coal Nat Gas
Oil Existing Nuclear
Hydro Solar Wind BioOther
Net Imports Exports1
2018 Benchmark
GW 203 57 75 6 32 9 1 7 15 ndash
TWh 806 364 140 0 247 5 2 20 28 ndash
2034 Low RE Future
GW 239 55 111 6 25 9 7 11 15 ndash
TWh 869 253 351 0 186 5 15 32 27 ndash
2034 High RE Future
GW 281 3 111 6 23 9 64 50 15 ndash
TWh 869 22 361 0 170 5 129 154 27 ndash
1 PJM is modeled without neighboring zones (no imports or exports)
Cost amp Performance Requirements for Flexible Advanced Nuclear Plants in Future US Power Markets 39
Table 15 PLEXOS Results for PJM
Low RE Future wout ESS
with ESS
High RE Future wout ESS
with ESS
Scenario Specifications
of Nuclear Plants 1 1 1 1
Reactor Capacity 500 MWe 500 MWe 500 MWe 500 MWe
Representative Load Zone PEPCO PEPCO PEPCO PEPCO
Annual Avg Energy Market Price $2839MWh $2847MWh $2646MWh $2644MWh
Avg Annual Capacity Factor 92 92 91 92
of Annual Output to ESS System ndash 20 ndash 20
Revenue
Nuclear Plant ndash Avg Energy Price Received $2834MWh $2844MWh $2669MWh $2639MWh
Nuclear Plant ndash Direct Sales Revenue $115 M $92 M $107 M $72 M
Nuclear amp ESS ndash Avg Energy Price Received ndash $2981MWh ndash $3076MWh
ESS Net Generation Revenue ndash $26 M ndash $48 M
Total System Energy Revenue $115 M $118 M $107 M $121 M
Total Revenue
Low (assumes $50kW-yr capacity payment) $140 M $168 M $132 M $171 M
Mid (assumes $75kW-yr capacity payment) $152 M $193 M $144 M $196 M
High (assumes $100kW-yr capacity payment) $165 M $218 M $157 M $221 M
Expenditures
Fuel Expenditures $18 M $18 M $18 M $18 M
Other Variable OampM Expenditures $0 M $0 M $0 M $0 M
Fixed OampM Expenditures $15 M $15 M $15 M $15 M
Total Operating Expenditures $33 M $33 M $33 M $33 M
Operating Profits for CapEx Recovery
Low Capacity Price Case $107 M $135 M $99 M $137 M
Mid Capacity Price Case $119 M $160 M $111 M $162 M
High Capacity Price Case $132 M $185 M $124 M $187 M
Maximum Plant CapEx for Profit Breakeven
Low Capacity Price Case $2358kW $2988kW $2186kW $3038kW
Mid Capacity Price Case $2634kW $3541kW $2462kW $3591kW
High Capacity Price Case $2911 kW $4095kW $2739kW $4144kW
Cost amp Performance Requirements for Flexible Advanced Nuclear Plants in Future US Power Markets 40
73 MISO
The tables below highlight the total plant capacity by resource (including the annual generation in all modeled scenarios) as well as a summary of the PLEXOS results for MISO The market has high wind penetration especially in the High RE Future
Table 16 Resource Capacity and Generation in MISO for the Modeled Scenarios
Installed Capacity amp Generation
Total Coal Nat Gas
Oil Existing Nuclear
Hydro Solar Wind BioOther
Net Imports Exports1
2018 Benchmark
GW 175 61 71 4 13 5 1 18 3 ndash
TWh 709 372 149 0 97 9 2 56 25 0
2034 Low RE Future
GW 229 59 117 3 8 4 9 25 3 ndash
TWh 838 124 392 0 65 9 19 83 25 -122
2034 High RE Future
GW 243 4 99 3 8 4 51 70 3 ndash
TWh 838 16 295 0 65 9 109 253 24 -67
1 Imports are negative exports are positive
Cost amp Performance Requirements for Flexible Advanced Nuclear Plants in Future US Power Markets 41
Table 17 PLEXOS Results for MISO
Low RE Future wout ESS
with ESS
High RE Future wout ESS
with ESS
Scenario Specifications
of Nuclear Plants 1 1 1 1
Reactor Capacity 500 MWe 500 MWe 500 MWe 500 MWe
Representative Load Zone S Illinois S Illinois S Illinois S Illinois
Annual Avg Energy Market Price $2717MWh $2717MWh $2416MWh $2416MWh
Avg Annual Capacity Factor 92 92 92 92
of Annual Output to ESS System ndash 20 ndash 26
Revenue
Nuclear Plant ndash Avg Energy Price Received $2721MWh $2721MWh $2452MWh $2447MWh
Nuclear Plant ndash Direct Sales Revenue $110 M $88 M $98 M $73 M
Nuclear amp ESS ndash Avg Energy Price Received ndash $2844MWh ndash $2628MWh
ESS Net Generation Revenue ndash $24 M ndash $30 M
Total System Energy Revenue $110 M $112 M $98 M $103 M
Total Revenue
Low (assumes $50kW-yr capacity payment) $135 M $162 M $123 M $153 M
Mid (assumes $75kW-yr capacity payment) $147 M $187 M $136 M $178 M
High (assumes $100kW-yr capacity payment) $160 M $212 M $148 M $203 M
Expenditures
Fuel expenditures $18 M $18 M $18 M $18 M
Other Variable OampM Expenditures $0 M $0 M $0 M $0 M
Fixed OampM Expenditures $15 M $15 M $15 M $15 M
Total Operating Expenditures $33 M $33 M $33 M $33 M
Operating Profits for CapEx Recovery
Low Capacity Price Case $101 M $129 M $90 M $120 M
Mid Capacity Price Case $114 M $154 M $103 M $145 M
High Capacity Price Case $126 M $179 M $115 M $170 M
Maximum plant CapEx for Profit Breakeven
Low Capacity Price Case $2244kW $2857kW $2000kW $2654kW
Mid Capacity Price Case $2521kW $3410kW $2276kW $3207kW
High Capacity Price Case $2797kW $3963kW $2553kW $3760kW
Cost amp Performance Requirements for Flexible Advanced Nuclear Plants in Future US Power Markets 42
74 CAISO
The tables below highlight the total plant capacity by resource (including the annual generation in all modeled scenarios) as well as a summary of the PLEXOS results for CAISO This market has high solar and wind penetration especially in the High RE Future
Table 18 Resource Capacity and Generation in CAISO for the Modeled Scenarios
Installed Capacity amp Generation
Total Coal Nat Gas
Oil Existing Nuclear
Hydro Solar Wind BioOther
Net Imports Exports1
2018 Benchmark
GW 74 0 39 0 2 14 9 6 3 ndash
TWh 261 0 116 0 16 37 24 15 10 -42
2034 Low RE Future
GW 86 0 35 0 0 14 23 10 3 ndash
TWh 272 0 61 0 0 37 65 28 10 -70
2034 High RE Future
GW 88 0 30 0 0 11 34 10 3 ndash
TWh 272 0 49 0 0 28 97 28 10 -61
1 Imports are negative exports are positive
Table 19 PLEXOS results for CAISO
Low RE Future wout ESS
with ESS
High RE Future wout ESS
with ESS
Scenario Specifications
of Nuclear Plants 1 1 1 1
Reactor Capacity 500 MWe 500 MWe 500 MWe 500 MWe
Representative Load Zone San Diego San Diego San Diego San Diego
Annual Avg Energy Market Price $2579MWh $2595MWh $2273MWh $2266MWh
Avg Annual Capacity Factor 79 92 67 91
of Annual Output to ESS System ndash 33 ndash 34
Revenue
Nuclear Plant ndash Avg Energy Price Received $3021MWh $2632MWh $3150MWh $2326MWh
Cost amp Performance Requirements for Flexible Advanced Nuclear Plants in Future US Power Markets 43
Low RE Future wout ESS
with ESS
High RE Future wout ESS
with ESS
Nuclear Plant ndash Direct Sales Revenue $104 M $71 M $92 M $61 M
Nuclear amp ESS ndash Avg Energy Price Received ndash $3507MWh ndash $3448MWh
ESS Net Generation Revenue ndash $65 M ndash $71 M
Total System Energy Revenue $104 M $137 M $92 M $132 M
Total Revenue
Low (assumes $50kW-yr capacity payment) $129 M $187 M $117 M $182 M
Mid (assumes $75kW-yr capacity payment) $142 M $212 M $130 M $207 M
High (assumes $100kW-yr capacity payment) $154 M $237 M $142 M $232 M
Expenditures
Fuel Expenditures $15 M $18 M $13 M $18 M
Other Variable OampM Expenditures $0 M $0 M $0 M $0 M
Fixed OampM Expenditures $15 M $15 M $15 M $15 M
Total Operating Expenditures $31 M $33 M $28 M $33 M
Operating Profits for CapEx Recovery
Low Capacity Price Case $99 M $154 M $89 M $149 M
Mid Capacity Price Case $111 M $179 M $101 M $174 M
High Capacity Price Case $124 M $204 M $114 M $199 M
Maximum plant CapEx for Profit Breakeven
Low Capacity Price Case $2187kW $3397kW $1968kW $3306kW
Mid Capacity Price Case $2464kW $3950kW $2244kW $3859kW
High Capacity Price Case $2740kW $4503kW $2521kW $4412kW
75 Summary and Modeling Result Implications
The PLEXOS and financial modeling results in a range of maximum allowable CapEx As shown in the preceding tables this range is largely driven by capacity payments the addition of ESS and the average energy price which is driven by the assumption of continued low natural gas prices and the two different renewables scenarios in 2034 These highlight several implications for advanced reactor developers
n The addition of energy storage may improve a projectrsquos economics but this is dependent on several factors The ESS captures higher average energy prices as it is optimized to charge during the lowest priced hours and sells during the highest priced hours However the amount of CapEx that can be budgeted for the ESS depends on the Low RE vs High RE scenario and importantly the available capacity payment For example the CapEx threshold for ESS in MISO in the Low RE scenario and $25kW-year capacity payment is only $613kW At present there are no commercially available ESS options at this price Conversely assuming the High RE scenario in CAISO and a $100kW-year capacity payment the allowable CapEx for the ESS is $1891kW LucidCatalystrsquos high-level cost analysis for thermal ESS in Appendix E suggests that this is possible using todayrsquos technologies and costs especially for reactor designs with higher outlet temperatures It is highly likely that these will be
Figure 18
0
2
4
6
8
10
12
14
16
18
20
1 2 3 4 5 6 7 8 9 10 11 12
Perc
enta
ge o
f Dis
char
ge E
vent
s
Length of Discharge (Hours)
Cost amp Performance Requirements for Flexible Advanced Nuclear Plants in Future US Power Markets 44
significantly cheaper by 2034 Also as shown in Appendix D projections for electrochemical storage systems (ie batteries) are expected to be well below that cost (even for a 12-hour system) by 2034 Therefore developers should be aware of the potential for storage to impact a projectrsquos bottom line and will want to consider it based on specific market conditions
n It is important to note that capacity payments are a major source of assumed revenue For plants without ESS each additional $50kW-year adds $277kW to a plantrsquos maximum allowable CapEx For plants with ESS this amount is doubled to $553kW One a related note while LucidCatalyst assumed a 12-hour ESS on average the system typically discharged for only 4 hours exceeding an 8-hour discharge only 12 of the time (see Figure 18) Developers should therefore track ifhow performance requirements for capacity payments change over time and weigh the savings of a smaller ESS with the probability of paying non-performance penalties
n Advanced reactor developers should note that higher RE penetrations reduce average energy prices (and thus allowable CapEx) If the assumed VRE penetration is too conservative in these scenarios the effective maximum allowable CapEx will likely be lower Higher VRE penetration will trigger more aggressive ramping and potentially higher prices during critical peak demand periods While this may benefit highly flexible and dispatchable resources like advanced nuclear plants this will also lead to lower capacity factors and a likely decline in average energy prices To the extent these factors affect revenues maximum allowable CapEx may be lower
Figure 10 Frequency of Different Discharge Durations
Cost amp Performance Requirements for Flexible Advanced Nuclear Plants in Future US Power Markets 45
8 Additional Modeling Analyses The Results section above highlights the 2034 CapEx requirements under a highly specific set of assumptions Several different scenarios may play out and it is worth exploring other future outcomes to understand their impact on CapEx requirements
This section examines three additional modeling analyses 1 Effect of CO2 Prices 2 Market Penetration Potential 3 Impact on Allowable CapEx from Alternative Fixed OampM Assumption
1 Effect of CO2 Prices There are six bills in the 116th US Congress that establish a CO2 price with escalators that increase the price over time57 Further seventeen states have introduced some form of carbon pricing legislation including the California and the ten states that makes up the Regional Greenhouse Gas Initiative (RGGI) which already have a variable CO2 price58 One could reasonably argue that there is a non-zero probability of a carbon pricing scheme going into effect by 2034 While current proposals differ in carbon price and rate of escalation the most conservative proposals set a CO2 price of around $50tonne by 2034 This modeling analysis examines how a $50tonne CO2 price with side cases of $25 and $75tonne would affect revenue and the maximum allowable CapEx for advanced nuclear plants
2 Market Penetration Potential Assuming the operational characteristics of a flexible advanced nuclear plant are similar to a CCGT it is worth estimating the extent to which these resources can be deployed without significantly reducing energy prices (due to their low-price energy bids) Advanced reactor developers may want to simultaneously develop more than one project in the same ISO and it is valuable to understand how many plants each market can accommodate and how that might affect the overall cost of electricity delivery
3 Impact on Allowable CapEx from Alternative Fixed OampM Assumption This study considers a relatively low fixed OampM assumption of $31kW-year which is ~70 lower than the fixed OampM assumed for todayrsquos conventional nuclear fleet (~$103kW-year) While LucidCatalyst recognizes that this a realistic goal for advanced reactor developers to target it is also worth exploring how higher fixed OampM might impact maximum allowable CapEx This analysis considers a fixed OampM of $61kW-year a halving of todayrsquos fixed OampM cost estimate
81 Effect of CO2 Prices
To measure the impact of a CO2 price on allowable CapEx LucidCatalyst ran three additional scenarios for PJM $25 $50 and $75tonne CO2 prices do not cause fossil plants to retire in the PLEXOS simulations (ie capacity levels are the same between these simulations and the High Renewables Future described above) because this analysis uses a consistent methodology of considering plant capacity as a deterministic modeling input for each simulation Based on their CO2 emission rates (approximately 1 tonne per MWh for coal plants and 04 tonnes for combined-cycle natural gas plants) applying the CO2 price of $50tonne inflates fossil generatorsrsquo marginal costs by approximately $50MWh
Cost amp Performance Requirements for Flexible Advanced Nuclear Plants in Future US Power Markets 46
for coal plants and $20MWh for combined-cycle natural gas plants which significantly raises market prices and impacts the allowable CapEx for the first flexible advanced nuclear plant that wishes to enter the market The following tables show the PLEXOS modeling resultsmdashwithout and with energy storage
Table 20 CO2 Price Scenarios for PJM without Energy Storage
No CO2 Price $25tonne $50tonne $75tonne
Scenario Specifications
of Nuclear Plants 1 1 1 1
Reactor Capacity 500 MWe 500 MWe 500 MWe 500 MWe
Representative Load Zone PEPCO PEPCO PEPCO PEPCO
Annual Avg Energy Market Price $2646MWh $3706MWh $4757MWh $5788MWh
Nuclear amp ESS Annual Capacity Factor 91 92 92 92
Total System Energy Revenue $107 M $150 M $192 M $234 M
Maximum Plant CapEx for Profit Breakeven
Low Capacity Price Case $2186kW $3132kW $4074kW $4999kW
Mid Capacity Price Case $2462kW $3409kW $4351kW $5276kW
High Capacity Price Case $2739kW $3685kW $4627kW $5552 kW
Table 21 CO2 Price Scenarios for PJM with Energy Storage
No CO2 Price $25tonne $50tonne $75tonne
Scenario Specifications
of Nuclear Plants 1 1 1 1
Reactor Capacity 500 MWe 500 MWe 500 MWe 500 MWe
Representative Load Zone PEPCO (DC) PEPCO PEPCO PEPCO
Annual Avg Energy Market Price $2644MWh $3703MWh $4754MWh $5786MWh
Nuclear amp ESS Annual Capacity Factor 92 92 92 92
Cost amp Performance Requirements for Flexible Advanced Nuclear Plants in Future US Power Markets 47
No CO2 Price $25tonne $50tonne $75tonne
Total System Energy Revenue $121 M $165 M $211 M $257 M
Maximum Plant CapEx for Profit Breakeven
Low Capacity Price Case $3038kW $4031kW $5043kW $6056kW
Mid Capacity Price Case $3591kW $4584kW $5596kW $6609kW
High Capacity Price Case $4144kW $513kW $614kW $7162kW
82 Market Penetration Potential
Advanced nuclear plants provide the same baseload and responsive load-following characteristics as the existing fossil fleet yet they have much lower operating costs By 2034 a sizeable percentage of natural gas plants will be getting close to their retirement Absent fundamental changes to energy markets if advanced nuclear plants ever supply the majority of firm baseload power as the primary marginal resource (setting the energy price) energy prices will begin to rapidly decline due to advanced nuclearrsquos low price energy bids This would significantly impact the economics of most grid resourcesmdashincluding advanced nuclear plants It is therefore worth exploring the market penetration limits of advanced nuclear plants before they begin to materially impact energy pricesmdashand consequently their own CapEx requirements To highlight potential market penetration without significant impact on CapEx requirements LucidCatalyst modeled the 2034 High RE resource mix and supplied the majority of firm baseload power with advanced nuclear plants and co-located ESS Other power plant capacity levels remained unaffected Table 22 below highlights the addition of 168 GWs of flexible advanced nuclear reactors relative to the baseline scenario
Table 22 2034 High RE Baseline and Fleet Deployment of Advanced Nuclear Plants
Installed Capacity amp Generation
Total Coal Nat Gas
Oil Existing Nuclear
Flexible Adv Nuclear
Hydro Solar Wind BioOther
Net Imports Exports1
ISO-NE
GW 46 0 5 4 3 10 4 9 7 5 ndash
TWh 111 0 9 0 24 39 8 18 21 9 +17
PJM
GW 284 3 41 6 23 72 9 64 50 15 ndash
TWh 872 19 96 1 165 276 5 129 154 27 ndash
Cost amp Performance Requirements for Flexible Advanced Nuclear Plants in Future US Power Markets 48
Installed Capacity amp Generation
Total Coal Nat Gas
Oil Existing Nuclear
Flexible Adv Nuclear
Hydro Solar Wind BioOther
Net Imports Exports1
MISO
GW 245 4 35 3 8 66 4 51 70 3 ndash
TWh 840 12 94 0 65 247 9 109 253 24 -26
CAISO
GW 91 0 13 0 0 20 11 34 10 3 ndash
TWh 272 0 3 0 0 75 27 97 28 9 -33
1 Imports are negative exports are positive
In this lsquofleet deployment scenariorsquo annual average market prices drop in all four ISOs due to nuclear plants operating lsquoon the marginrsquo for more hours as shown in Table 23 below
Table 23 Annual Average Market Prices for ISO-NE PJM MISO and CAISO
Average Annual Energy Price
ISO NE
High RE Future (Without Flexible Adv Nuc) $2632MWh
Fleet Deployment of Flex Adv Nuc $2264MWh
PJM
High RE Future (Without Flexible Adv Nuc) $2703MWh
Fleet Deployment of Flex Adv Nuc $2267MWh
MISO
High RE Future (Without Flexible Adv Nuc) $2613MWh
Fleet Deployment of Flex Adv Nuc $2470MWh
CAISO
High RE Future (Without Flexible Adv Nuc) $3806MWh
Fleet Deployment of Flex Adv Nuc $2961MWh
020000400006000080000
100000120000140000160000180000
July 16 July 17 July 18 July 19 July 20 July 21 July 22
MW
Oil Natural Gas
Coal Adv Nuc + ESS
Solar Wind
Hydro BioOther
Existing Nuclear
Cost amp Performance Requirements for Flexible Advanced Nuclear Plants in Future US Power Markets 49
The flexible performance of the advanced nuclear fleet becomes apparent in reviewing hourly modeling results for a representative summer week in 2034 (July 16 ndash 22) In summer cooling demand is typically high and peaks in the afternoons between 2 to 3 pm Because of high cooling demand during weekdays peaks are higher during weekdays than weekends as shown in the following figure
Figure 11 Dispatch Profile for PJM with Majority of Firm Power Supplied by Advanced Nuclear Plants
As expected having more advanced nuclear plants reduces annual energy clearing prices and thus reduces the maximum allowable CapEx by ~$500kW less than the CapEx requirements for the first plant A striking finding of this analysis is how advanced nuclear plants with ESS can actually lower the cost of serving load across the ISO Figure 12 below shows a subset of the total costs of serving annual loadmdashisolating just energy costs and capacity payments to natural gas and advanced nuclear plants Assuming all other costs (ancillary services transmission costs uplift payments imports etc) are held constant the amount spent on capacity for both natural gas and advanced nuclear falls slightly and energy costs drop by over $3 billion
Figure 20
$0
$5
$10
$15
$20
$25
$30
$35
2018 High RE Future(No Adv Nuc Plants)
High RE Future(w Adv Nuc w ESS)
Bill
ions
($U
SD)
Adv Nuc + ESS Capacity Payments
Nat Gas Capacity Payments
Energy
Cost amp Performance Requirements for Flexible Advanced Nuclear Plants in Future US Power Markets 50
Figure 12 Total Cost of Serving Annual Load Energy and Select Capacity Payments
83 Impact on Allowable CapEx from Alternative Fixed OampM Assumption
As discussed above in Section 552 the base case calculations use $31kW-year (equivalent to $375MWh) for the combined fixed and variable OampM costs of flexible advanced nuclear plants The base case value is a significant reduction from current OampM costs at nuclear plants and serves as an ambitious target to guide nuclear designers in their pursuit of market viabilityAs a side case the following table presents maximum allowable CapEx results assuming a less ambitious target for OampM costs In particular this side case posits a 50 reduction from the combined OampM cost of $122kW-year used by the Energy Information Administration in the latest version of the Annual Energy Outlook This alternative assumption of $61kW-year ($750MWh) for combined OampM costs is double the base case assumption cited aboveThe higher OampM costs in the alternative case lead to lower maximum allowable CapEx for flexible advanced nuclear plants with or without energy storage plants as shown in the following table Relative to the base case results all results of maximum allowable CapEx have tightened by $337kW because of higher OampM costs
Cost amp Performance Requirements for Flexible Advanced Nuclear Plants in Future US Power Markets 51
Table 24 Maximum Allowable CapEx by ISO and Scenario ($kW) with Higher OampM Cost Input
Low RE wout ESS
with ESS
High RE wout ESS
with ESS
ISO-NE
Low Capacity Price Case ($50kW-yr) $1952 $2625 $1628 $2450
Mid Capacity Price Case ($75kW-yr) $2229 $3178 $1905 $3003
High Capacity Price Case ($100kW-yr) $2505 $3731 $2181 $3557
Difference from Base Case ($kW) -$337
PJM
Low Capacity Price Case ($50kW-yr) $2021 $2651 $1848 $2701
Mid Capacity Price Case ($75kW-yr) $2297 $3204 $2125 $3254
High Capacity Price Case ($100kW-yr) $2574 $3757 $2401 $3807
Difference from Base Case ($kW) -$337
MISO
Low Capacity Price Case ($50kW-yr) $1907 $2520 $1663 $2316
Mid Capacity Price Case ($75kW-yr) $2184 $3073 $1939 $2869
High Capacity Price Case ($100kW-yr) $2460 $3626 $2216 $3422
Difference from Base Case ($kW) -$337
CAISO
Low Capacity Price Case ($50kW-yr) $1850 $3060 $1630 $2968
Mid Capacity Price Case ($75kW-yr) $2127 $3613 $1907 $3521
High Capacity Price Case ($100kW-yr) $2403 $4166 $2183 $4075
Difference from Base Case ($kW) -$337
Cost amp Performance Requirements for Flexible Advanced Nuclear Plants in Future US Power Markets 52
High-Level CapEx Estimation Exercise for lsquoNuclear-Specificrsquo Costs Several advanced reactor developers are still working on their nuclear reactor designs and the other components that make up the lsquonuclear-relatedrsquo portion of the plant This typically includes the lsquonuclear islandrsquo consisting of the steam supply system (ie nuclear reactor reactor pressure vessel coolants pumps piping controls etc) the containment and auxiliary building and the fuel handling area Other lsquonuclear-relatedrsquo costs include reactor licensing nuclear permitting fuel commissioning and testing related land acquisition offsite design and civil works These lsquonuclear-relatedrsquo costs represent the majority of overall plant costs Designers will likely find it easier to reduce costs by limiting the size and scope of the nuclear heat source design and its relationship to the rest of the plant (ie lsquoconventional islandrsquo) For example if the design allows safety events to propagate into the steam turbine the steam turbine must be designed to handle such events and therefore will be relatively bespoke and more expensive If the nuclear heat source can be effectively isolated more of the plant can be designed with commercially available lsquooff-the-shelfrsquo components which are less expensive Using government cost studies for coal and natural gas power projects LucidCatalyst derived a high-level indicative estimate for all components downstream of the nuclear heat source Having already estimated the maximum allowable CapEx for an entire nuclear plant the goal was to indicatively estimate the remaining CapEx available for the nuclear-related costs Appendix F highlights the costs included in this calculation which should be treated as indicative not exhaustive Added together non-nuclear costs are roughly $1043kW for a plant without energy storage and $1453kW with energy storage Developers can subtract these figures from the allowable CapEx thresholds for the various ISOs
Cost amp Performance Requirements for Flexible Advanced Nuclear Plants in Future US Power Markets 53
9 ConclusionsProvided that advanced nuclear developers can design their reactors to be sufficiently low-cost they can complement production from higher VRE penetration and lower the overall cost of serving load mdash all without power delivery disruptions or sharp market price swings Providing cost-effective flexible capacity these plants offer an emissions-free load following option that can perform similar to CCGTs
This study examined the maximum allowable CapEx for flexible advanced nuclear plants in 2034 in low- and high-renewable market environments Using PLEXOS production cost modeling software LucidCatalyst estimated the maximum allowable CapEx for flexible advanced nuclear plants in two configurationsmdashwith and without energy storagemdashin four deregulated power markets ISO-NE PJM MISO and CAISO The modeling and post-modeling financial analysis revealed that the maximum allowable CapEx for the first plant entering the market is driven by energy and capacity payment revenues The average maximum allowable CapEx across all scenarios is $3234kW This reflects a minimum of $1965kW (High RE in ISO-NE no ESS and $50kW-yr capacity payment) and $4503kW (Low RE in CAISO with ESS and $100kW-yr capacity payment)
Table 25 Summary of Maximum Allowable CapEx ($kW) by ISO Configuration and RE Scenario
Low RE wout ESS
with ESS
High RE wout ESS
with ESS
ISO-NE
Low Capacity Price Case ($50kW-yr) $2289 $2962 $1965 $2788
Mid Capacity Price Case ($75kW-yr) $2566 $3515 $2242 $3341
High Capacity Price Case ($100kW-yr) $2843 $4068 $2519 $3894
PJM
Low Capacity Price Case ($50kW-yr) $2358 $2988 $2186 $3038
Mid Capacity Price Case ($75kW-yr) $2634 $3541 $2462 $3591
High Capacity Price Case ($100kW-yr) $2911 $4095 $2739 $4144
MISO
Low Capacity Price Case ($50kW-yr) $2244 $2857 $2000 $2654
Mid Capacity Price Case ($75kW-yr) $2521 $3410 $2276 $3207
High Capacity Price Case ($100kW-yr) $2797 $3963 $2553 $3760
CAISO
Low Capacity Price Case ($50kW-yr) $2187 $3397 $1968 $3306
Mid Capacity Price Case ($75kW-yr) $2464 $3950 $2244 $3859
High Capacity Price Case ($100kW-yr) $2740 $4503 $2521 $4412
Cost amp Performance Requirements for Flexible Advanced Nuclear Plants in Future US Power Markets 54
Advanced reactor developers should be aware that while there are emerging market mechanisms to reward resources for enhancing grid flexibility and resiliency (and the operating reserve market is likely to expand) the primary revenue sources are energy sales and capacity payments Average annual energy prices are also expected to fall due to increasing quantities of zero-marginal cost VRE Absent a CO2 price or premiums paid for emissions-free generation and capacity advanced nuclear developers will need to design their plants to an average cost of below $2989kW Advanced reactor designers should also recognize that most of the emerging market mechanisms compensating for flexible dispatchable output are too early-stage to gauge their significance in the mid-2030s While the grid will undoubtedly demand large amounts of flexible resources by that time it is currently unclear how much energy will be transacted through these new products The decision to add a thermal energy storage system to a plant design must be informed by the specific market context in which a plant is sited Across the four ISOs modeled co-locating a storage system makes economic sense on average for less than $1126kW Such a system will enable the reactor to run at its rated capacity for more hours and provide the opportunity to sell power from the ESS when prices are at their highest Also without an ESS (or an alternative revenue source such as hydrogen production process heat for industry etc) the plantrsquos capacity factor suffers significantly in high VRE zones For example in the 2034 high RE scenario the capacity factor for nuclear plants in southern California is 67 Given that these plants are being designed to operate for a minimum of 40 years it is worth considering what market conditions (particularly VRE penetration) will exist beyond 2034 A CO2 price or capacity payment premium for emissions-free generation resources could significantly change the maximum allowable CapEx As shown (and specific to the PEPCO load zone in PJM) a $25 $50 or $75tonne CO2 price significantly improves the economics for advanced nuclear plants raising the maximum allowable CapEx by $993kW $2005kW or $3018kW respectively Similarly capacity markets could increase payments to stimulate deployment of emissions-free generation which could significantly improve project economics Advanced nuclear developers should understand the advantages and disadvantages of developing projects in regulated markets Depending on how deregulated markets evolve it may be favorable to focus on regulated markets for initial development efforts Regulated utilities can utilize all the benefits of highly rampable and dispatchable output without requiring complex and relatively slow-moving market reforms to reveal the value of certain grid services For these reasons regulated markets have been in practical terms the first markets for Gen III and III+ nuclear plants (as well as other innovative power projects like the carbon capture and sequestration project at Kemper)The PLEXOS modeling revealed that deploying advanced nuclear power at scale can actually reduce the overall cost of serving electrical load Nearly all national and international energy modeling efforts either do not include advanced nuclear in their projections or assume an insignificant level of capacity Because these plants can operate as baseload resources and load follow like a combined-cycle gas turbine they can supply a large fraction of the firm power without raising the overall cost of electricity This conclusion should motivate policymakers utilities climate advocates and other stakeholders to continue supporting advanced nuclear commercialization efforts In addition to tracking how markets evolve advanced nuclear developers should also track the evolution of competitive technologies that will play an increasing role in grid flexibility and emissions-free generation Technologies to enhance grid flexibility primarily include energy storage Distributed Energy Resources demand-side solutions like flexible loads (eg EVs electric hot water heaters smart thermostats etc) and demand response programs These are effective in lsquotime shiftingrsquo demand and smoothing power flows across the grid However they are less effective in serving the expected increase in overall electricity demand resulting from the electrification of transportation and other sectors Supplying emissions-free energy for multiple days or even weeks (when VREs are not generating) currently cannot be met without extremely low-cost bulk energy storage (which is not yet an economical scalable option) or thermal generation with carbon capture or the use of clean synthetic fuels (eg hydrogen ammonia ethanol DME etc) in converted natural gas plants
Cost amp Performance Requirements for Flexible Advanced Nuclear Plants in Future US Power Markets 55
An important precondition for advanced nuclear plants to play a meaningful role in future resources mixes is their ability to be built at sufficiently low cost While the CapEx thresholds highlighted in this report are relatively low in comparison to conventional nuclear new-build plants in North America and Europe they are well within the range of those reported by third-party cost studies59 and advanced nuclear developers themselves This range is also well within the costs being achieved in countries with continuous new-build nuclear programs60 Designers should integrate these cost requirements into their plant designs and consider whether adding thermal storage makes sense in their target markets
Appendices
Figure 21
$000
$1000
$2000
$3000
$4000
$5000
$6000
$7000
2009 2010 2011 2012 2013 2014 2015 2016 2017 2018
$M
Wh
Day-Ahead
Capacity ($MWh Est)
Ancillary Services
Cost amp Performance Requirements for Flexible Advanced Nuclear Plants in Future US Power Markets 57
A Appendix ndash Historical Revenues by Market Product in Select ISOsIt is useful to examine todayrsquos wholesale market prices to understand the relative revenue potential for flexible nuclear plants By the mid-2030s market rules and prices are bound to be different however revenue breakdown by product and price trends provide a useful benchmark for looking into the future
ISO-NE (New England)
Despite the recent increase in day-ahead clearing prices in 2017 and 2018 average clearing prices for energy have been in decline for the past 10 years61 Overall demand for electricity ISO-NE has been in general decline year since 2013 and demand in 2017 hit an 18-year low62 Figure 13 presents ten years (2009 ndash 2018) of revenue potential for Day-Ahead energy63 capacity (estimated in $MWh) and ancillary services Energy prices were an average of $4598MWh across the ten-year period the highest of the four ISOs analyzed64
Figure 13 Average Annual Clearing Price by Market Product in ISO-NE ($MWh)
Figure 22
$000
$1000
$2000
$3000
$4000
$5000
$6000
2009 2010 2011 2012 2013 2014 2015 2016 2017 2018
$M
Wh
Load-Weighted Energy
Capacity
Ancillary Services
Cost amp Performance Requirements for Flexible Advanced Nuclear Plants in Future US Power Markets 58
PJM (Pennsylvania-Jersey-Maryland)
PJM energy prices have been declining for the past decade on average (see Figure 14) Twelve thousand MW of coal and three nuclear plants having filed for deactivation may close by 2021 (Davis-Besse Perry and Three Mile Island) Nonetheless projected excess capacity (based on the interconnection queue) suggests that ignoring local reliability issues these retirements will not affect energy prices or reliability Most revenues come from energy (~78) with about 20 coming from capacity revenues Depending on capacity requirements in various PJM zones capacity payments could be higher65 Ancillary services as is the case in each power market represent a small fraction of total potential revenue
Figure 14 Average Price by Component of Wholesale Power Price in PJM ($MWh)
MISO (Midcontinent)
MISO has the lowest average clearing price for energy of the four ISOs under consideration ($3134MWh from 2009 ndash 2018) This is partially driven by already depreciated coal and nuclear plants as well as 17GW of wind which makes up 8 of MISOrsquos generating portfolio66 Unlike ISO-NE and PJM MISO does not have a capacity market Instead it has a lsquoResource Adequacyrsquo construct which places the burden on Load Serving Entities (LSEs) and Independent Power Producers (IPPs) to procure a sufficient resource capacity to provide energy during times of forecast (and unexpected) scarcity Typically this means either qualifying capacity through LSE-owned resources or procuring it through bilateral arrangements with other resource owners MISO has a 17 lsquoreserve marginrsquo which means there is 17 surplus generation capacity on average at any given time There is a voluntary capacity auction where LSEs and IPPs can procure capacity that they have not already procured Therefore the capacity payments listed in Figure 15 only reflect the clearing prices of the voluntary capacity auctions As with the other ISOs MISOrsquos ancillary service market is relatively small and would likely represent an insignificant revenue stream for advanced nuclear projects
Figure 23
$000
$500
$1000
$1500
$2000
$2500
$3000
$3500
$4000
$4500
2009 2010 2011 2012 2013 2014 2015 2016 2017 2018
$M
Wh
Load-Weighted Energy
Capacity (RA Construct)
Ancillary Services
Cost amp Performance Requirements for Flexible Advanced Nuclear Plants in Future US Power Markets 59
Figure 15 Average Price by Component of Wholesale Power Price in MISO ($MWh)
CAISO (California)
CAISO is the only ISO that experienced a (mild) increase in energy clearing prices from 2009 ndash 2018 as shown in Figure 16 Day-Ahead clearing prices averaged $3886 over this period with prices reaching $4606 in 2018 CAISO has more non-hydro renewables than any other ISO as a percentage of total energy generation (26 in 2018)67 and installed capacity (23331 MW)68 When Governor Jerry Brown signed SB 100 into law in September 2018 California adopted a 100 RPS by 2045 (50 renewables by 2026 60 renewables by 2030 and 100 CO2-free energy by 2045) The increase in solar and wind will likely depress the average clearing price for energy (certainly during daylight hours) but will undoubted drive up the value for flexible dispatchable resources This will be especially true for the morning and evening ramp With demand expected to grow between 10 and 15 annually until 203069 this will be a revenue opportunity for flexible dispatchable generation Californiarsquos decision not to renew the operating licenses for the Diablo Canyon units 1 and 2 which are set to expire in 2024 and 2025 respectively suggests that the state is perhaps not a priority market for nuclear However because the CAISO energy imbalance market has expanded well beyond the borders of Californiamdashto as far as Wyoming Idaho and Utahmdashthere may be opportunities to supply CAISO while not being physically located within the state
Figure 24
$000
$1000
$2000
$3000
$4000
$5000
$6000
2009 2010 2011 2012 2013 2014 2015 2016 2017 2018
$M
Wh
DA Energy Costs
Ancillary Services (and RUC)
Resource Adequacy Costs
Cost amp Performance Requirements for Flexible Advanced Nuclear Plants in Future US Power Markets 60
Figure 16 Average Price by Component of Wholesale Power Price in CAISO ($MWh)
Cost amp Performance Requirements for Flexible Advanced Nuclear Plants in Future US Power Markets 61
B Appendix ndash New Market Mechanisms that Capture the Value of Resource FlexibilityMost of the new revenue streams aimed at improving grid stability by rewarding resource flexibility and dispatchability are too new and undeveloped to determine whether they will be meaningful revenues So far none provide the compensation necessary to stimulate investment in new capacity However it would serve advanced reactor developers to understand these products and track them going forward
Ramping Products
CAISO Flexible Ramping Product CAISO introduced its Flexible Ramping Product (FRP) in November of 2016 The FRP was designed to provide a margin of sufficient ramping capacitymdashavailable in real-timemdashto address uncertainty arising from load variability or intermittent renewable generation70 This helps maintain power balance during deviations in real-time net load71 reflecting potential renewable forecasting errors and other uncertainties related to ramping needs The FRP includes two products in the 5- and 15-minute real time markets (1) Flexible Ramp Up and (2) Flexible Ramp Down FRP compensation has been extremely small dropping from $25M in 2017 to just $7M in 201872 Flexible Ramp Up was needed for 6 of the time in 2018 whereas Flexible Ramp Down was needed just 1 of the time To participate in FRP resources submit bids to provide the forecasted demand plus the ability to ramp upward or downward to meet a predetermined uncertainty band They receive revenue from selling energy plus an uncertainty award (for either ramping up or down)Currently the ISO is working to incorporate flexible ramping capability in the Day-Ahead markets and procure FRP in smaller regions such that transmission constraints are not a material issue to getting energy on (and off) the grid73
Fast ramping advanced nuclear plants could certainly compete in this market However they will encounter competition from several other resources including battery storage systems which have exceptional charge and discharge rates As the amount of energy transacted through this market increases so too will the number of participating resources which will likely mitigate revenue potential
MISO Ramp Capability ProductMISO implemented their voluntary Ramp Capability Product in the spring of 2016 It consists of a lsquoup ramp capabilityrsquo and lsquodown ramp capabilityrsquo product As with CAISO MISO is interested in increasing ramping capacity to better respond to uncertainties in forecasted net load74 especially during short-term scarcity events or other deviations from the expected dispatch horizon Ramping resources are required
Cost amp Performance Requirements for Flexible Advanced Nuclear Plants in Future US Power Markets 62
to ramp up or down to meet specified uncertainty bands within ten minutes75 The Ramp Capability Product is co-optimized with the energy and ancillary service markets and allows resources that can ramp faster to displace slower resources Slower resources are compensated for their forgone profit to provide such services and faster resources get greater dispatch opportunities The program is completely voluntary and any dispatchable resource is eligible to participate To date there have been few hours where Ramp Capacity Product clearing prices are above zero (from 3 ndash 9 on average)76 and the Day-Ahead and Real-Time hourly price for ramp up capability averaged $058MWh and $021MWh respectively from May 2016 to June 201977 Both Day-Ahead and Real-Time ramp down capability products have been $000MWh since the beginning Given the low clearing prices which have incidentally fallen significantly since January 2019 and the dearth of hours during which the product clears at non-zero prices the MISO Ramp Capability project does not present a significant revenue stream for advanced nuclear plants
ISO-NE and PJMISO-NE and PJM do not currently have ramping products
Other Compensation Mechanisms for Fast Available and Flexible Generators
Fast Start GenerationEach of the ISOs have market pricing rules to reward resources that can more rapidly respond to dispatch instructions Enabling a faster response is typically more costly for a resource and these rules allow them to run more often and receive compensation for their start up and fixed operating costs In some ISOs rules also compensate lsquoslowerrsquo resources that have been moved out of the merit order to make room for lsquofast-startrsquo78 resources It is unlikely that advanced nuclear plants will be the marginal generator very often therefore significant revenue generation from this rule change should not be expected
Pay-for-PerformanceISO-NE and PJM have a lsquopay-for-performancersquo (PFP) model for capacity resources This increases financial incentives for resources able to quickly provide additional capacity or operating reserves during periods of generation scarcity
ISO-NEISO-NErsquos Forward Capacity Market Pay-for-Performance (FCM PFP) Project began in June 2018 Its purpose is to increase financial incentives for resources that can quickly provide additional capacity or operating reserves during periods of generation scarcity During Capacity Scarcity Conditions (CSC)79 resources can be eligible for additional revenue payments based on actual capacity provided (above what was already required and contracted for in the marketplace) PFP prices are cleared on a 5-minute basis until the CSC is resolved Capacity prices are determined on how deficient the grid is in meeting its capacity and operating reserves requirements The amount of capacity provided is multiplied by a predetermined lsquoperformance payment ratersquo80 which dictates the final payment amount In short if a resource can quickly provide additional grid capacity (either by ramping up or decreasing its real-time energy output to provide additional capacity or operating reserves) it is eligible for significant above-market payments From January 1 2015 to August 15 2019 there was only one CSC event declared (on September 3 2018) and it lasted just under 3 hours81
Cost amp Performance Requirements for Flexible Advanced Nuclear Plants in Future US Power Markets 63
PJMStarting in 2016 PJM began providing lsquoCapacity Performancersquo incentive payments to resources participating in its Reliability Pricing Model (RPM) capacity market The purpose was to reward resources for being available and responsive during stressed conditionsmdashwhen PJM determines they are needed to meet power system emergenciesmdashand issuing penalties when resources do not perform This helps ensure that the capacity offered into the RPM reflects a resourcersquos actual performance risk (and ensures that capacity from units less likely to perform during stressed conditions are offered at higher prices to reflect their outage or non-performing risk)82 The number of megawatts cleared in the RPM as Capacity Performance is set to increase each year until the delivery year 2020 ndash 21 when all PJM resources are required to meet Capacity Performance requirements This is to incentivize investment in resource reliability (eg system upgrades and fuel availability) and apply penalties to non-performance83 Resources that exceed performance requirements during peak system conditions collect funds from resources that underperformCapacity Performance increases overall capacity costs in the market however these are ideally offset by relatively lower pricing during extreme weather events and other conditions that stress the grid Under Capacity Performance resources are required to deliver their committed capacity during emergency events called Performance Assessment Intervals (PAI) System-side Performance Assessment Hours (PAH) have not been called since 2014 and zone-wide PAIs have not been called since 201584 Therefore it is unlikely to be a material source of revenue for advanced reactors To be considered a Capacity Resource with lsquounlimited energy capabilityrsquo a nuclear plant must sustain continuous operation for at least 10 hours Capability verification testing performed by PJM requires nuclear plants to sustain their rated output for 2 hours
Table 26 Relevance of Emerging Market Products that Reward Resource Flexibility on Advanced Nuclear Reactor Developers
Resource Flexibility Product
Description Relevance to Adv Reactor Developers
Rationale
CAISO
Flexible Ramping Product (FRP)
This product provides a margin of sufficient ramping capacitymdashavailable in real-timemdashto address uncertainty arising from load variability or intermittent renewable generation85
Very Low FRP compensation has been extremely small dropping from $25M in 2017 to just $7M in 201886
The corresponding cost to CAISO for FRP ranged from $000 ndash $003MWh from Q1 2018 to Q2 201987
Flexible Ramp Up was needed 6 of the time in 2018 and Flexible Ramp Down was needed just 1 of the time
Cost amp Performance Requirements for Flexible Advanced Nuclear Plants in Future US Power Markets 64
Resource Flexibility Product
Description Relevance to Adv Reactor Developers
Rationale
MISO
Ramp Capability Product (RCP)
The RCP is co-optimized with the energy and ancillary service markets and allows resources that can ramp faster to displace slower resources Ramping resources are required to ramp up or down to meet specified uncertainty bands within ten minutes88
Very Low To date there have been few hours where Ramp Capacity Product clearing prices are above zero (from 3 ndash 9 on average)89 and the day-ahead and real-time hourly price for ramp up capability averaged $058MWh and $021MWh respectively from May 2016 to June 201990
Both day-ahead and real-time ramp down capability products have been $000MWh since the beginning
ISO-NE
Pay for Performance (PFP)
The purpose of PFP is to increase financial incentives for resources that can quickly provide additional capacity or operating reserves during periods of generation scarcity In short if a resource can quickly provide additional grid capacity (either by ramping up or decreasing energy output to provide additional capacity or operating reserves) it is eligible for significant above-market payments
Very Low From January 1 2015 to August 15 2019 there was only one occasion (on September 3 2018) when a scarcity event was declared and it lasted just under 3 hours91
PJM
Capacity Performance (CP)
The purpose of CP is to reward resources for being available and responsive during stressed conditionsmdashwhen PJM determines they are needed to meet power system emergenciesmdashalong with penalties when resources do not perform
Very Low Under Capacity Performance resources are required to deliver their committed capacity during emergency events called Performance Assessment Intervals (PAI) System-side PAIs have not been called since 201492 and very rarely have zonal PAIs been called
Cost amp Performance Requirements for Flexible Advanced Nuclear Plants in Future US Power Markets 65
C Appendix ndash Desirable Performance Attributes and Market Participation Requirements In general resource lsquoflexibilityrsquo includes the ability to start up and shut down over short periods of time or rapidly change generation output to support system reliability The primary value of lsquoflexiblersquo advanced reactors is their ability to load follow when renewables go offline Currently this is supplied by natural gas plants (both CCGTs and CTs) To be competitive with natural gas (which may have integrated affordable carbon capture technologies by the mid-2030s) flexible advanced nuclear plants will need to have certain performance characteristics
This appendix highlights the desired performance attributes for advanced nuclear plants which follows the attributes of best-in-class CCGTs For reference generic market participation requirements for energy capacity and ancillary services markets are also included
Competing with Best-In-Class Gas Turbines
Advanced nuclear plants with energy storage will primarily compete with gas turbines in a combined-cycle configuration New lsquobest-in-classrsquo CCGTs have extremely fast start times and can achieve maximum capacity in 30 minutes from a lsquohot startrsquo (ie generator is running and electrically synchronized to the grid)93 This is important for quickly meeting the morning or evening ramp or quickly backfilling for renewables As shown in Table 27 ramp rates are also extremely high For example the GE 7HA02 can ramp up to 60 MWminute It can also ramp down to a minimum operating capacity of 33 (which can be reduced to 15 in a two-plant configuration)94 Under idealized operating conditions (where ambient temperature pressure and humidity affects efficiency) best-in-class CCGTs are extremely flexible and valuable resources
Cost amp Performance Requirements for Flexible Advanced Nuclear Plants in Future US Power Markets 66
Table 27 Selected Performance Criteria for lsquoBest-in-Classrsquo CCGTs
Siemens SGT-9000HL Series GE 7HA-Class 7HA02 MHPS M501J Series
Capacity (MW 1-unit Configuration) 595 573 614
Net Efficiency gt63 gt63 gt64
Ramp Rate (MWmin) 85 60 42
Turndown ndash Minimum Load () 40 33 50
Startup Time to Full Load lt30 minutes lt30 minutes 30 minutes
Simple cycle configuration Based on 8000HL series
Sources
Siemens SGT-9000HL | 405 MW | 60 Hz GE Power 9HA POWER PLANTS Fact Sheet MHPS M501J Series GE Power gas power systems offerings I 2019
Another competitive feature of best-in-class CCGTs is minimal outage risk Some of the major turbine manufacturers have claimed based on field operation hours that fleet uptime or availability (reflecting unscheduled maintenance) consistently exceeds 9995 Further manufacturers continue to push efficiency and believe combined-cycle net efficiency could reach 65 by the early 2020s96 This will continue to improve operating costs Grid operators also benefit from a CCGTrsquos rotational inertia During changes in demand the inertia of the spinning turbines opposes frequency changes and thereby gives system operators more time to correct the frequency deviation (by adjusting generation or load) and maintain a 60 Hz grid frequency While there is currently no market for inertia there are frequency response products97 and the service is undoubtedly valued by vertically integrated utilitiesAdvanced reactor developers should consider how their reactor and energy storage system should perform to meet these performance characteristics Notably without storage a reactor that can achieve these operating characteristics would be extremely valuable for grid stability however economics would be an issue As previously stated without significantly inflated capacity payments other out-of-market payments unprecedentedly high reserve prices or other revenue streams the economics are challenging
Cost amp Performance Requirements for Flexible Advanced Nuclear Plants in Future US Power Markets 67
General Market Participation Requirements
Performance Requirements for Energy RevenuesGenerators participating in wholesale electricity markets must meet several well-established technical and operating performance requirements During project development and through operations (until retirement) the ISOrsquos interconnection commissioning and on-going testing procedures and protocols ensure that resources can perform as stated once ready for commercial operations For grid operators to effectively and efficiently carry out their responsibilities resources need to operate as expected At a high level the ISO makes exhaustive assurances that all eligible energy resources are dependable market participants It is essential that resources be capable of receiving and responding to electronic dispatch instructions and communicate when they are (or will be) downmdashso system operators can balance the grid accordingly Therefore both wireless and lsquohardlinersquo communications equipment are setup between the ISO and energy resource The ISO also maintains a power system model that has all the lsquovital statisticsrsquo for each resource Knowing what each resource is capable ofmdashplus the operating condition of each resource in any given momentmdashallows the operators to optimize economic dispatch
Communication ProtocolsThere is a suite of digital and analog channels through which generators and demand resources communicate with the ISO (and vice versa) These include a mix of telemetry solutions which include wireless technologies (eg cellular systems unlicensed ration frequencies etc) and supervisory control and data acquisition (SCADA) technology It also includes hard-wired fiber optic ethernet cables and establishing dedicated lsquohard-linersquo telephone cables between the plant and ISO control room All required communications equipment is tested prior to any generator being available for dispatchVerbal and electronic communications are performed by a registered entity (which may be the energy resource itself or a third party) responsible for scheduling compliance dispatching administrative functions (information requirements market monitoring etc) and authorized to submit market and technical information
Information Provided to the ISOThere are several different types of generator-specific information that is submitted to the ISO and ultimately incorporated into its power system model This includes static information related to voltage and reactive control the unitrsquos one-line diagram transmission line information and associated equipment and certain technical data for physical components It also includes different types of dynamic information Using ISO-NE as an example such information includes
n Desired Dispatch Point (DDP) is the control signal expressed in megawatts transmitted to direct the output consumption or demand reduction level of each grid-tied resource dispatched by the ISO in accordance with the assetrsquos Offer Data
n Actual Generation is the actual generation being produced by the generating asset n Economic Minimum Limit is the lowest sustainable output level as specified by physical design characteristics environmental regulations or licensing limits
n Economic Maximum Limit is the maximum available output in MW of a Generator Asset that a Market Participant offers to supply in the Day-Ahead Energy Market or Real-Time Energy Market as reflected in the Generator Assetrsquos Offer Data This represents the highest MW output a Market Participant has offered for a Generator Asset for economic dispatch
n Emergency Minimum Limit means the minimum output in MWs that a Generator Asset can deliver for a limited period of time without exceeding specified limits of equipment stability and operating permits
Cost amp Performance Requirements for Flexible Advanced Nuclear Plants in Future US Power Markets 68
n Response Rate is the response rate in MWMinute at which a Market Participant is willing to change its output or consumption
n Regulation High Limit (applicable to Frequency Regulation offers) is an offer parameter that establishes the upper bound for AGC SetPoints and is used in the determination of a Resourcersquos Regulation Capacity
n Regulation Low Limit (applicable to Frequency Regulation offers) is an offer parameter that establishes the lower bound for AGC SetPoints and is used in the determination of a Resourcersquos Regulation Capacity
n Unit Control Mode98 describes the current operational state of an energy resource n Heartbeat describes the active digital connection between computers at the ISO and grid resource and confirms that related energy Data Acquisition and Concentration device are properly scanning and exchanging data as required
These types of information are indicative of the information that all ISOs need in order to properly dispatch a resource Beyond the minimum operating requirements which are highlighted in the table below99 the desired operating requirements to realize energy revenue simply requires that there be consistency between the plantrsquos scheduled output and actual output
Table 28 Minimum Operating Requirements for Large Generators
Category Description of Technical Requirement
Reactive Power Generators must maintain a composite power delivery at continuous rated power output at the Point of Interconnection with dynamic reactive capability over the power factor range of 095 leading to 095 lagging
Voltage Control All generators must keep and maintain an automatic voltage regulator (AVR) in service (and keep it in automatic operation)
Governor Control Generators over 10 MW must provide and maintain a functioning governor which includes the hardware or software that provides autonomous frequency-responsive power control It must have a speed droop set between 4 ndash 5 a frequency response deadband of no greater than 59964 ndash 60036 Hz and a real power response that does not override the governorrsquos response
Power Quality A generatorrsquos facility shall not cause excessive voltage flicker nor introduce excessive distortion to the sinusoidal voltage or current waves
Source ISO-NE Appendix 6 Large Generator Interconnection Agreement
Cost amp Performance Requirements for Flexible Advanced Nuclear Plants in Future US Power Markets 69
The requirements above are sourced from ISO-NE and while PJM MISO and CAISO have similar requirements they also have additional participation requirements that are important to note
n PJM To be considered a resource with lsquounlimited energy capabilityrsquo a resource must sustain continuous operation ldquocommensurate with PJM load requirements specified as 10 hoursrdquo100 If there is insufficient historical operating data to pull from PJM will verify the plants capability by testing whether it can sustain output for 2 hours101
n MISO To participate as a Resource Adequacy resource in MISO an advanced nuclear plant will need to sustain its maximum output for a minimum of four hours across the expected peak hour for each operating day102
n CAISO To qualify for Resource Adequacy like MISO advanced nuclear plants must meet a lsquominimum availability thresholdrsquo whereby they are capable of generating for four continuous hours To participate in lsquoflexiblersquo Resource Adequacy advanced nuclear plants would have to place bids in the Day-Ahead market from one of the following options103
ndash Base Ramping 5am ndash 10pm (all days) ndash Peak Ramping 2 ndash 7pm or 3 ndash 8pm (all days) ndash Super-Peak Ramping 2 ndash 7pm or 3 ndash 8pm (non-holiday weekdays)
Performance Requirements for Capacity Resources
ISO-NEISO-NE capacity resources are compensated based on their Capacity Supply Obligation (CSO) measured in MW and associated payment rate for a given time period (Capacity Commitment Period)104 During shortage events (or lsquoCapacity Scarcity Conditionsrsquo) capacity resources with a CSO are rewarded for being available and operating until the scarcity event has passed During these events the lsquoPay-for-Performancersquo mechanism is active and both capacity and non-capacity resources are rewarded for their availability and ability to meet system needs Capacity resources are required to demonstrate their ability to respond to ISO Dispatch Instructions and to maintain performance at a specified output level for a specified duration For new nuclear and combined-cycle capacity resources these occur within five business days of commercial operations and projects must operate for 4 continuous hours at the capacity level bid in the Forward Capacity Auction105 Existing resources are audited annually as a requirement of fulfilling capacity supply obligations (CSO) during summer and winter Capacity Commitment Periods and nuclear and combined-cycle plants are required to run for 2 hours continuously106
PJMIn PJM resources with capacity contracts are obligated to be available during periods of grid stress when PJM declares that emergency actions are necessary These periods are called lsquoPerformance Assessment Intervalsrsquo (PAIs) and have historically occurred during critical peak periods in the winter The Capacity Performance construct was initiated after the 2014 polar vortex where 22 of generation capacity was out of service which nearly tripled the number of forced outages across the region In fact eight of the ten highest critical peak periods in history were experienced during January 2014107
Cost amp Performance Requirements for Flexible Advanced Nuclear Plants in Future US Power Markets 70
During PAIs resources receiving capacity payments must be available to inject energy onto the grid (at the capacity for which they are receiving capacity payments) PAIs at the RTO level have not occurred since 2014 however it is important to note that when contracted capacity resources are not available during PAIs they are penalized Of the 30 PAHs in 2014 the average interval was 43 hours and the longest was 13 hours (during the height of the polar vortex) In addition to being available lsquoperformingrsquo resources must achieve pre-defined and approved ramp rates during a scarcity event Acceptable rates have historically been defined as being between the historic average and maximum over a defined period (up to 3 months) They ultimately require approval by PJM Table 29 highlights the required operating parameters for eligible capacity resources Currently nuclear plantsmdashpresumably because they are only used as baseload resourcesmdashare not subject to capacity performance operating requirements108 109
Table 29 Capacity Performance and Base Capacity Resource Minimum Unit-Specific Operating Parameters in PJM (Select Technologies)
Generator Technology
Min Down Time Hrs
Min Run Time Hrs
Max Daily Starts
Max Weekly Starts
Start-up Time Hot Hrs
Warm Hrs
Cold Hrs
NotTime1
Turn Down Ratio
Reciprocating ICE 06 1 12 84 01 01 01 01 gt1
Aero CT 11 1 6 42 01 01 01 01 gt1
Frame CT 125 3 4 28 025 025 025 01 gt15
CCGT 35 4 3 21 05 05 05 1 gt15
Storage lt1 TBD TBD TBD Start Time + Notification lt1 TBD
Source Slide 14 in PJM (2016) Capacity Performance Performance Assessment Hour Education
1 Notification Time Time to Start (ColdWarmHot Hours)
MISO Capacity PerformanceIn MISO non-intermittent capacity resources (ie nuclear) must offer all its claimed capacity into the Day-Ahead market for all hours it is scheduled to be available Intermittent capacity resources (for which co-located energy storage may be categorized) must submit bids into the Day-Ahead energy market and offer at least four continuous hours daily across the MISO forecasted daily peak110
CAISO Flexible Resource AdequacyEach CAISO LSE must procure sufficient flexible RA resources Flexible RA resources must submit economic bids depending on one of three Flexible Capacity Categories (listed in the table below)111 112
Cost amp Performance Requirements for Flexible Advanced Nuclear Plants in Future US Power Markets 71
Table 30 Categories of Must-Offer Obligations for Flexible RA Capacity Resources in CAISO
Category 1 Category 2 Category 3
Must-Offer Obligation
17 Hours 5 Hours 5 Hours
5am ndash 10pm Daily for the whole year
3pm ndash 8pm for May ndash September
3pm ndash 8pm for May ndash September
5pm ndash 10pm Daily for the whole year
2pm ndash 7pm for January ndash April and October ndash December
2pm ndash 7pm for January ndash April and October ndash December
Daily Daily Non-holiday weekdays
Energy Limitation
At least 6 Hours At least 3 Hours At least 3 Hours
Starts The minimum of two starts per day or the number of starts feasible with minimum up and down time
At least one start per day Minimum 5 starts a month
Source California Public Utility Commission 2019 Filing Guide for System Local and Flexible Resource Adequacy (RA) Compliance Filings
Start-up time is not an eligibility requirement however resources that can start within 90 minutes can qualify all capacity from zero up to their lsquoEffective Flexible Capacityrsquo113 (EFC)114 If a resource requires more than 90 minutes the capacity eligible for Flexible RA is the difference between its Pmin and EFC CAISO has an open docket to revise Flexible RA requirements which include reducing start-up time to 60 minutes or less for RT (5-minute or 15-minute) products115
CAISO FRAC-MOOThe Flexible Resource Adequacy Criteria and Must-Offer Obligation (FRAC-MOO) is an initiative related to flexible resource adequacy It requires LSEs to procure sufficient flexible resources based on each monthrsquos maximum 3-hour ramp and peak demand Qualifying resources are obligated through a lsquoMust-Offer Obligationrsquo to submit bids into CAISOrsquos day-ahead markets (as opposed to self-schedule)Some analysts view the flexible ramping product and FRAC-MOO as being less for attracting new flexible resources and more as a lsquoretirement prevention toolrsquo for existing flexible capacity resources considering solar-induced decline in energy revenues116 It is likely that existing flexible resources in CAISO can serve as adequate flexible RA capacity until there is a 50 renewables mix (or higher)117
Cost amp Performance Requirements for Flexible Advanced Nuclear Plants in Future US Power Markets 72
Operating Requirements for Fast-Start Generation
Resources that are relatively fast to start up and ramp are typically more expensive than other marginal resources and therefore do not set the price as often During tight system conditions fast-start generators may be too expensive to get dispatched In response fast-starting pricing regimes have been proposed to allow these resources to set the price more often This usually requires relaxing a resourcersquos Economic Minimum118 to zero so it is available for dispatch and then separately compensating it for its start-upno-load119 costs FERC issued a Notice of Proposed Rule Making (NOPR) in 2016 regarding fast-start pricing which directed the RTOISOs to ldquohellipapply fast-start pricing to any resource committed that can start up within 10 minutes or less has a minimum run time of one hour or less and submits economic energy offers to the marketrdquo120 The RTOISOs are still implementing the NOPR existing operating requirements121 122 123 124
Table 31 FERCrsquos Existing Operating Requirements for RTOISOs to Receive lsquoFast-Startrsquo Pricing
ISO Description of Technical Requirements
ISO-NE1 Minimum Run Time does not exceed one hour
Minimum Down Time does not exceed one hour
Time to Start does not exceed 30 minutes after receiving a Dispatch Instruction from ISO
Available for dispatch and manned or has automatic remote dispatch capability
Capable of receiving and acknowledging a start-up or shut-down dispatch instruction electronically within 60 seconds
PJM2 lt=1 hour for start-up and minimum run time
MISO3 Online resource lt=1 hour for starting synchronizing and injecting energy to the grid (online resource) minimum run time of lt=1 hour
Offline resource lt=10 minutes for starting synchronizing and injecting energy to the grid minimum run time of lt=1 hour
CAISO4 Start-up time of less than two hours
1 ISO-NE Appendix 6 Large Generator Interconnection Agreement
2 PJM (2019) Fast-Start Summary August 7 2019
3 MISO (2013) MISO Module AmdashCommon Tariff Provisions 3000 November 19 2013
4 CAISO (2019) Fifth Replacement FERC Electric Tariff Effective as of January 1 2019
Cost amp Performance Requirements for Flexible Advanced Nuclear Plants in Future US Power Markets 73
Operating Requirements for Ancillary Services
As shown in Table 32 below operating requirements for regulation operating reserves and supplemental reserves are largely similar across all four RTOs125
Table 32 Summary of Ancillary Service Operating Requirements
Ancillary Service Product ISO-NE PJM MISO CAISO Performance Requirements
Regulation
Regulation n n n Must immediately increase or decrease output in response to automated signals (typically 2 ndash 4 seconds depending on market)Regulation ndash Up n
Regulation ndash Down n
Regulation Mileage ndash Up n Must minimize the absolute change in output between four-second set points
Regulation Mileage ndash Down n
Spinning Reserves
10-minute Synchronized Reserves n Synchronized to the grid and must respond within 10 minutes
Synchronized or Reserves n n
Spinning Reserves n1
Non-Spinning Reserves
30-minute Operating Reserves n Must respond within 30 minutes
10-minute Non-Sync Reserves n Must respond within 10 minutes
Primary Reserves2 n
Supplemental Reserves n
Non-Spinning Reserves n1
1 Must run for at least two hours
2 Synchronized and non-synchronized
Source Summarized data collected from Zhou et al (2016) Survey of US Ancillary Services Markets Center for Energy Environmental and Economic Systems Analysis Energy Systems Division Argonne National Laboratory
Cost amp Performance Requirements for Flexible Advanced Nuclear Plants in Future US Power Markets 74
Other ancillary services in addition to being minor revenue sources require less generation modification and therefore would not influence design considerations for advanced reactor developers Supplying voltage support typically requires having automatic voltage regulating (AVR) equipment (and telemetered communication with the ISO) Because flexible nuclear plants are motivated to run as much as possible they will likely not supply black start services However if they do they must be capable of starting without support from offsite power and operate at full capacity for 12 ndash 16 hours (depending on the ISO)126
Cost amp Performance Requirements for Flexible Advanced Nuclear Plants in Future US Power Markets 75
D Appendix ndash Alternative Ways of Providing System Flexibility Non-generation resources are becoming increasingly relevant in the competitive landscape of lsquoflexiblersquo technologies against which advanced nuclear will need to compete This section briefly summarizes the applications and market adoption potential for energy storage and demand-side technologies and applications
Energy Storage
Much has already been written about the grid benefits of energy storage127 128 Energy storage systems take up energy store it and make it available for use at a later time They are extremely useful for grid balancing and have become a cost-competitive alternative for a growing number of applications in recent years ESS is now regularly procured by utilities and increasingly required to be co-located with new renewable projects Table 33 below highlights the range of applications including services that directly support integration of variable renewables129
Table 33 Select Energy Storage Applications
Category Storage Services Supporting Renewable Integration
Bulk Energy Services Electric Energy Time-Shift (Arbitrage) n
Electric Supply Capacity n
Ancillary Services Regulation n
Spinning Non-Spinning and Supplemental Reserves n
Voltage SupportBlack StartOther Related Uses (load following frequency response flexible ramping power smoothing of renewable output)
n
Transmission Infrastructure Services
Transmission Upgrade DeferralTransmission Congestion Relief
Distribution Infrastructure Services
Distribution Upgrade DeferralVoltage Support
Customer Energy Management Services
Power QualityPower Reliability n
Retail Electric Energy Time-Shift n
Demand Charge ManagementIncreased Self-Consumption of Solar PV n
Figure 25
Cost amp Performance Requirements for Flexible Advanced Nuclear Plants in Future US Power Markets 76
Category Storage Services Supporting Renewable Integration
Off-grid Solar Home Systems n
Micro-Grids System Stability Services n
Micro-Grids Facilitating High Shares of VRE n
Transportation Electric Vehicles n
Source The US DOEEPRI 2015 Electricity Storage Handbook Sandia National Laboratories
Figure 17 below shows the annual growth trajectory for storage with an estimated 44 GWs deployed in 2024mdashrepresenting a more than 14-times increase over 2018 Cumulatively this assumes over 18 GWs of deployed capacity At the same time Wood Mackenzie and ESA (2019) predict that the US energy storage market will be valued at approximately $47 billion130 Outside the US the market is expected to keep growing at a rapid pace which will undoubtedly drive further cost reductions
Figure 17 US Annual Energy Storage Deployment Forecast 2012-2024E (MW)131
With electrochemical storage (inclusive of battery storage) taking up an increasingly larger share of new storage installations in the US it is useful to examine cost reduction curves for battery storage over time The price of lithium ion batteries fell 80 between 2010 and 2017 ($kWh) and Bloomberg New Energy Finance (BNEF) believes storage costs will continue to drop by 52 between 2018 and 2030 (see Figure 18)132 This forecast is supported by the International Renewable Energy Agency (IRENA) which predicts a of drop between 54 ndash 61133 These predictions suggest an installed cost of $70kWh by 2030 Significant improvements in round rip efficiency the number of full charge-discharge cycles and calendar life are expected to be accompany these cost declines By 2040 BNEF expects storage will represent 7 of the total installed power capacity globally reaching nearly 1000 GW134 Other experts see more modest growth (600 GW by 2040)135 however a positive trajectory is clear136
Figure 26
Cost amp Performance Requirements for Flexible Advanced Nuclear Plants in Future US Power Markets 77
Figure 18 Lithium-Ion Battery Price Historical and Forecast
As more projects are deployed financiers developers utilities operators and regulators are getting more comfortable with the technology137 Market rules are evolving (albeit at different rates across the ISOs) to compensate storage for the values it providesInitially energy storage entered the market by providing high power-short duration services (ie ancillary services) As costs have come down storage is expanding to include more energy time-shifting (as opposed to power-relatedbalancing) values Currently there are no commercially available138 bulk storage technologies (beyond pumped hydropower) that are cheap enough to store and dispatch energy on a weekly monthly or seasonal basis
Demand-Side Flexibility Demand Response and Distributed Energy Resources
A new generation of communication and control technologies is emerging to time shift electricity use across hours of the day Several utility-led programs are allowing utilities to control customer-sited loads that have grid-interactive hardware and software (eg EVs air conditioning electric water heaters thermostats smart solar inverters139 etc) As more of these resources are deployed and if possible aggregated they are expected to help peak shave and provide another grid-balancing tool to grid operatorsISOs have Demand Response (DR) programs where the utility pays electricity customers to reduce their consumption relative to a measurable baseline level of consumption The ability to reduce load on demand reduces the requirement to procure expensive peaking generation which can be valuable during critical peak periods of demand Distributed energy resources (DERs) are typically small-scale physical and virtual assets are connected to and interact with the grid at the local distribution level (oftentimes located behind-the-meter) DERs encompass a range of technologies that include solar PV energy storage combined heat and power plants fuel cells energy efficiency and controllable loads Through various communication and control platforms these resources can be used individually or in aggregate to provide value to customers the
Cost amp Performance Requirements for Flexible Advanced Nuclear Plants in Future US Power Markets 78
local distribution network or the larger transmission network The orchestrated use of multiple DER technologies has given rise to the concept of the lsquovirtual power plantrsquo (VPP) or the optimized use of heterogenous DERs (using control monitoring and management software) to provide retail or wholesale market services VPPs can provide flexible grid services for applications such as frequency regulations demand response operational reserves or peak demand management to maintain or improves the grid reliability efficiency and overall performanceIn aggregate flexible loads DR and DERs are expected to play a material role in helping grid operators manage variable renewable integration While they show great promise it is important to be aware of several issues that could limit their effectiveness Namely leveraging flexible loads requires aggregating several thousand systems which involve customer acquisition costs the prospect of installing additional hardware and potential technical challenges related to aggregation and responding to grid signals DR programs have been in operation for over a decade but are rarely required to modify their load140 DER aggregation and wholesale market performance like flexible loads is still far from where it will ultimately be It will be important for MEITNER Design Teams to follow how these flexible resources evolvemdashboth technically and as they are supported by policymdashas they will undoubtedly be valuable grid reliability tools
Cost amp Performance Requirements for Flexible Advanced Nuclear Plants in Future US Power Markets 79
E Appendix ndash High-Level Cost Analysis of Energy Storage SystemThe analysis described in this report includes scenarios in which advanced nuclear plants would use co-located energy storage systems (ESS) to increase revenue by charging from the reactorrsquos energy when market prices are low and discharging to the grid for energy sales when market prices are high LucidCatalyst and project advisors developed the following high-level information on three potential ESS approaches to assess the financial feasibility of this concept relative to the extra allowable CapEx for advanced nuclear plants with ESS calculated from the PLEXOS results The three potential ESS approaches in this preliminary assessment are firebricks (thermal ESS) molten salt (thermal ESS) and flow batteries
The financial feasibility assessment accounts not only for the ESS medium but also for the heat recovery steam generators (HRSG) and additional turbine-generator capacity when the reactor and ESS release energy to the grid at the same time The assessment below indicates that the cost estimates for these approaches based on currently available data could be financially feasible as components of flexible advanced nuclear plants This is because their CapEx levels are near the extra allowable CapEx values enabled by ESS from many of the PLEXOS simulations Moreover the cost estimates shown below are well within the CapEx thresholds for simulations with high revenue to advanced nuclear plants through high capacity payments ($100kW case) or a CO2 program that lifts electricity market prices
Firebricks
Forsberg et al describe the possible use of firebricks for storing and releasing thermal energy from nuclear plants to provide load-following services to the grid and increase nuclear plant revenue141 Firebrick or refractory brick is designed for higher temperatures than typical masonry brick Firebrick is already produced at large scale and low cost for many applications Forsberg et al estimate the cost for firebrick in this application as less than $10kWh of thermal energy This excludes the additional equipment necessary for coupling the medium to the nuclear plantAs a high-level assessment of firebrick configurations and costs LucidCatalyst and project advisors performed the following calculations The density of brick is approximately 2200 kgm^3142 Packing brick in the system would reduce the density by approximately 25 leading to a packed density of 1650 kgm^3 The specific heat of brick is approximately 105 kJkg-K143 Multiplying the packed density by the specific heat leads to an effective volumetric specific heat of 1732 kJm^3-K
Cost amp Performance Requirements for Flexible Advanced Nuclear Plants in Future US Power Markets 80
Assuming a temperature of 500 C (773 K) from the reactor into the storage system the bricks store 0866 GJ per m^3 or 0525 GJ per metric tonneThe maximum output for each storage system is 500 MWe which effectively doubles the production capacity of the flexible advanced nuclear plant when added with the 500 MWe of direct power production from the reactor The storage system can discharge at maximum output for 12 hours implying a capacity of 6000 MWh in terms of electric energy Assuming a conversion efficiency of 40 this capacity is equivalent to 15000 MWh of thermal energy or 54000 GJ (using the conversion ratio of 36 GJ per MWth) From the energy storage parameters for brick specified above a system at each plant to store this amount of energy would have a volume of 62000 m^3 and weight of 103000 metric tonnesThe typical price for large orders of ordinary brick is approximately $300tonne144 The total raw materials cost for the necessary weight of brick is $31 million If labor costs for installation are approximately equal to the raw materials cost then installation adds another $31 million to the system cost and the subtotal is $62 million (~$10kW installed)As another cost estimation approach for brick thermal energy storage Storasol indicates the cost of its storage system as approximately $20kWh145 A system for this thermal capacity with 12 hours of discharge capability would cost $300 million The estimated cost of the HRSG is $89 million and the supplemental steam turbine is $112 million For the other necessary equipment the cooling system for the steam turbine is estimated to cost $33 million the water system $59 million and the transformers and grid connections $54 million146 The estimated cost for the total package is $646 million which equates to $1292kWe and $269kWhe with 80 round-trip efficiency
Molten Salt
NREL indicates that an oil-to-salt heat exchanger would cost approximately $30kWh of thermal energy147 The cost of a salt-to-steam apparatus for the application in this analysis would presumably be similar For a nuclear reactor with 500 MWe of electric capacity and thermal conversion efficiency of 40 the equivalent thermal capacity is 1250 MWth A molten salt system for this thermal capacity with 12 hours of discharge capability would cost $450 million As discussed above the estimated cost of the supplemental steam turbine is $112 million For the other necessary equipment the cooling system for the steam turbine is estimated to cost $33 million the water system $59 million and the transformers and grid connections $54 million The estimated cost for the total package is $707 million which equates to $1414kWe and $262kWh with 90 round-trip efficiency
Flow Batteries
As an indicative example of flow battery economics StorTera has designed a single liquid flow battery with a lifetime up to 20 years that costs $150kW148 The cost per unit of energy is $94kWh For a 12-hour system the energy component would cost $1125kW leading to a total cost of $1275kW
Cost amp Performance Requirements for Flexible Advanced Nuclear Plants in Future US Power Markets 81
F Appendix ndash High-Level Estimate of Non-Nuclear Island CostsThe following table includes the cost estimates (with their associated sources) for all costs downstream of the nuclear heat source This primarily consists of costs related to power conversion and balance of plant
The estimates below are largely sourced from a 2015 US DOE detailed cost study for natural gas and coal plants149 with other supporting data The figures exclude contingency costs and all costs were bought to 2019 USD by using the Federal Reserve Bank of St Louisrsquo Producer Price Index for Electrical Machinery and Equipment150 Importantly these estimates are from NGCC and coal plants that are 630 MW and 500 MW respectively (similar to the size of the 500 MW illustrative advanced nuclear plant) Costs are rounded to the nearest hundred thousand This costing exercise assumes that the power conversion system and all other downstream components are effectively off-the-shelf components that are otherwise used by other thermal power plants For conventional nuclear plants these components have traditionally had higher costs due to the lsquonuclear premiumrsquo for things such as steam turbines that due to the plant design had to meet higher nuclear-grade standards This costing exercise assumes that advanced reactor developers are able to separate these downstream components from their nuclear heat source design There are two tables below The first estimates the non-nuclear costs for a plant without thermal storage or $880kW The second table outlines the additional non-nuclear costs for a plant with a co-located ESS which is $1100kW (or $9167kWh for a 12-hour system)
Cost amp Performance Requirements for Flexible Advanced Nuclear Plants in Future US Power Markets 82
Table 34 Non-Nuclear Island Costs for 500 MW Plant without ESS
Non-nuclear Component1 Cost $kW Cost Base Year
$kW (2019 USD)
Relevant Assumptions Reference Plant
Feedwater and Misc BOP Systems (a)
$541 M $108 2011 $11126 Assumes costs (expressed in $kW) relate only to 219 MW steam turbine (not 422 MW gas turbine)
NGCC
Coolant to Steam Hx (a) $288 M $58 2011 $5922 NGCC
Ducting (b) $1214 M $243 2019 $24287 NGCC
Steam Turbine Generator (a) $40 M $80 2011 $8233 LC received an indicative quote from Mitsubishi Heavy Industries for a 600 MW steam turbine generator of $80kW The turbine plant auxiliaries condenser amp auxiliaries steam piping and foundations are sourced from 2015 DOE study1
Coal
Cooling Water System (b) $322 M $64 2011 $6620 NGCC
Accessory Electric Plant (a) $118 M $24 2011 $2428 NGCC
Instrumentation and Control (a) $77 M $15 2011 $1575 NGCC
Improvements to Site (a) $20 M $40 2011 $4119 NGCC
Buildings and Structures (excludes ESS or NSSS) (a)
$541 M $108 2011 $11126 NGCC
Land (c) $09 M $2 2011 $2 Assumes 300 acres Coal
Financing Costs (d) $265 M $53 2011 $55 Coal
Ownerrsquos Costs (e) $675 M $135 2011 $139 Includes Pre-production costs Inventory Capital and Other Ownerrsquos Costs
NGCC
Totals $4309 M $880
1 Information labeled (a) (b) (c) (d) and (e) are respectively sourced from Exhibit 4 ndash 14 Case B31A Exhibit 3 ndash 49 Case B31A Exhibit 2 ndash 1 Exhibit 3 ndash 19 and Exhibit 4 ndash 15 from US DOE (2015) Cost and Performance Baseline for Fossil Energy Plants Volume 1a Bituminous Coal (PC) and Natural Gas to Electricity Revision 3 National Energy Technology Laboratory Office of Fossil Energy
Cost amp Performance Requirements for Flexible Advanced Nuclear Plants in Future US Power Markets 83
Table 35 Additional Non-Nuclear Costs for a Plant with a 500 MW ESS
Component1 Cost $kW Cost Base Year
$kW (2019 USD)
Relevant Assumptions Reference Plant
Coolant to Air HX (a) $288 M $58 2011 $59 NGCC
Fans2 $148 M $30 2016 $30 Calculations based on $5MMBtu J Class gas turbine
NGCC
Thermal Energy Storage Facility $978 M $196 2019 $201 Internal LucidCatalyst Analysis
Assumes refractory brick
Cooling Water System (a) $40 M $80 2011 $111 Excludes contingency costs and assumes costs (expressed in $kW) relate only to 219 MW steam turbine (not 422 MW gas turbine)
NGCC
Accessory Electric Plant (a) $322 M $64 2011 $59 NGCC
Instrumentation and Control (b) $118 M $24 2011 $41 $0 Coal
Extra HRSG (hot air to steam) (a)
$575 M $115 2011 $118 NGCC
Buildings and Structures (conventional plant) (a)
$20 M $40 2011 $41 $0 Coal
Financing Costs ndash prorated by CapEx basis (d)
$265 M $53 2011 $55 Coal
Ownerrsquos Costs (d) $675 M $135 2011 $139 Coal
Land (c) $09 M $2 2011 $2 Assumes 300 acres Coal
Steam Turbine Generator (a MHI quote)
$1214 M $243 2019 $243 Indicative quote from Mitsubishi Heavy Industries (see Table 34 entry)
NGCC
Storage Totals $5192 M $1038 $1100
Cost of Storage ($kWhe) $9167
1 Source Info in this column labeled (a) (b) (c) (d) and (e) are respectively sourced from Exhibit 4 ndash 14 Case B31A Exhibit 3 ndash 49 Case B31A Exhibit 2 ndash1 Exhibit 3 ndash 19 and Exhibit 4 ndash15 from US DOE (2015) Cost and Performance Baseline for Fossil Energy Plants Volume 1a Bituminous Coal (PC) and Natural Gas to Electricity Revision 3 National Energy Technology Laboratory Office of Fossil Energy
2 Source Gulen S Can et al (2017) ldquoA Cheaper HRSG with Advanced Gas Turbinesrdquo Power Engineering Issue 3 and Volume 121
Cost amp Performance Requirements for Flexible Advanced Nuclear Plants in Future US Power Markets 84
1 National Renewable Energy Laboratory (NREL) is part of the US Department of Energyrsquos Office of Energy Efficiency amp Renewable Energy
2 This is the ldquoLow Natural Gas Price Low Renewables Costrdquo scenario included in NRELrsquos ReEDS model which is described in further detail in Section 522
3 Note that the PJM ISO now covers a broader area than when it was originally named4 We do include however a conceptual cost buildup for a firebrick thermal storage facility in Appendix
E which suggests that a thermal storage system as modeled can be built for less than is allowable capital cost in most of the scenarios The sources used for this are published reports on the cost of fossil power plants not optimized for this application and hence there is large scope for further cost reduction in this system
5 This figure represents the average across the four ISOs6 Energy Innovations Reform Project (2017) What will advanced nuclear power plants cost July 25
20177 Energy Technologies Institute (2018) The ETI Nuclear Cost Drivers Project Summary Report April
20 20188 ARPA-Ersquos MEITNER program website9 Section 5 includes the complete rationale for selecting the year 203410 Variable renewable energy sources are those that are non-dispatchable (ie intermittent) including
solar PV wind run-of-river hydropower tidal and wave energy11 The NREL ReEDS model is a capacity planning and dispatch model for the North American
electricity system12 Hsieh Eric and Anderson Robert (2017) Grid Flexibility The Quiet Revolution US Department of
Energy Office of Scientific and Technical Information13 MISO (2018) Review Ranking Input from the 2018 Market Roadmap Stakeholder Prioritization
Survey August 9 201814 These rules govern everything from resource procurement billing rates and incentive programs to
terms of service15 Lazar J (2016) Electricity Regulation in the US A Guide Second Edition Montpelier VT The
Regulatory Assistance Project16 Wiser Ryan (2019) The Impact of Variable Renewable Energy on Wholesale Power Pricesmdash
Implications for the Merchant Market Value of Wind and Solar Lawrence Berkeley National Laboratory
17 Bajwa et al (2017) Growing Evidence of Increased Frequency of Negative Electricity Prices in US Wholesale Electricity Markets IAEE Energy Forum Fourth Quarter 2017 Bloomberg (2018) Power Worth Less Than Zero Spreads as Green Energy Floods the Grid August 6 2018
18 It was cheaper on a $MW basis to build large centralized power plants rather than smaller distributed plants Borberly A and Kreider J F (2001) Distributed Generation The Power Paradigm for the New Millennium CRC Press Boca Raton FL
19 Wind Solar Alliance (2018) Customer Focused and Clean Power Markets for the Future Nov 201820 Wind Solar Alliance (2018) Outdated Electricity Market Rules Prevent Full Renewable Energy
Participation21 International Monetary Fund (2019) Falling Costs Make Wind Solar More Affordable April 26 2019
EndnotesFurther information references and hyperlinks
Cost amp Performance Requirements for Flexible Advanced Nuclear Plants in Future US Power Markets 85
22 lsquoNet loadrsquo refers to the difference between forecasted demand and expected generation from variable renewables
23 California ISO (2017) Renewables WatchmdashFor Operating Day Sunday April 09 201724 See NREL ReEDS model (any scenario including ldquo80 National RPSrdquo) US EIAmdashAnnual
Energy Outlook 2019 (natural gas increases in absolute and relative terms beyond 2050) and BloombergNEF New Energy Outlook (2019)
25 MISO (2018) Renewable Integration Impact Assessment (RIIA)26 This is done by providing operating reserves and frequency regulation services when wholesale
energy prices drop below marginal operating costs27 Patel Sonia (2019) Flexible Operation of Nuclear Power Plant Ramps Up Power Magazine28 Jenkins et al (2018) The benefits of nuclear flexibility in power system operations with renewable
energy Applied Energy Vol 2222 July 15 2018 Pgs 872 ndash 88429 Jenkins et al (2018) concluded that flexibly operating a nuclear plant could actually increase its
gross operating margins by providing operating reserves and frequency regulation services when wholesale energy prices drop below marginal operating costs They also concluded that it could reduce solar and wind curtailment and lower overall operating costs for the entire power system Their analysis however considered only one plant in a stylized high renewable power system A fleet of plants would quickly depress these ancillary services revenues leaving the fundamental economic dilemma of operating below a plantrsquos rated output
30 The wind production tax credit pays wind projects for each MWh of generation Therefore wind projects can bid negative prices and still theoretically make positive cash flow
31 Union of Concerned Scientists (2018) The Nuclear Power Dilemma Declining Profits Plant Closures and the Threat of Rising Carbon Emissions November 2018
32 ClimateNexus (2019) Nuclear Energy in the US Recent plant closures and policy decisions April 4 2019
33 US Energy Information Administration (2018) Frequently Asked Questions How old are US nuclear power plants and when was the newest one built
34 Reuters (2019) Pennsylvania state lawmaker offers bill to save nuclear power plants March 11 2019 and NEI (2019) Ohio policymakers support nuclear plants and the 23 million tons of CO2 they prevent June 13 2019
35 Baltimore Sun (2019) Maryland bill mandating 50 renewable energy by 2030 to become law but without Gov Larry Hoganrsquos signature May 22 2019
36 In August 2019 the DOE announced funding for a project with Exelon mdashwhich has the countryrsquos largest nuclear fleetmdashto produce store and use hydrogen produced from an existing nuclear plant Shortly thereafter ARPA-E provided funding to FirstEnergy Solutions Xcel Energy and Arizona Public Service to demonstrate hydrogen production from existing nuclear facilities as well
37 Bloomberg Environment (2019) Advanced Nuclear Reactors Targets for Late 2020s Companies Say February 13 2019
38 The capacity expansion is performed by Energy Exemplar using their Aurorareg software through 2046
39 Energy Exemplar (2018) North American Datasets Data Documentation August 201840 National Renewable Energy Laboratory (NREL) 2019 Regional Energy Deployment Systems
(ReEDS) Model Standard Scenarios Results Viewer41 US Energy Information Administration (2019) What is the efficiency of different types of power
plants Last updated August 8 201942 Congressional Research Service (2019) Advanced Nuclear Reactors Technology Overview and
Current Issues April 18 201943 NREL (2019) Annual Technology Baseline Electricity Natural Gas Plants
Cost amp Performance Requirements for Flexible Advanced Nuclear Plants in Future US Power Markets 86
44 LucidCatalyst did not perform nor reference detailed engineering studies to confirm the claims made about thermal storage performance characteristics It assumes that the claims made in either the published literature or by the companies themselves are true
45 This assumption is supported by several of the project advisors as the 12-hour capacity exceeds contiguous dispatch requirements for capacity resources for all four ISOs (PJMrsquos 10-hour contiguous dispatch being the longest)
46 US Energy Information Administration (2019) Table S1b Weighted-average price of uranium purchased by owners and operators of US civilian nuclear power reactors 1995ndash2018 dollars per pound U3O8 equivalent Nuclear amp Uranium
47 With perfect energy conversion 1 kWh could be produced from 3412 Btu Heat rate calculations scale up the necessary Btu per kWh by dividing 3412 by the efficiency percentage
48 Bowers H I Fuller L C and Myers M L Cost Estimating Relationships for Nuclear Power Plant Operations and Maintenance Oak Ridge National Laboratory 1987 Web doi1021725431729 Table 31
49 Nuclear Energy Institute Nuclear Costs in Context September 2019 p 250 US Energy Information Administration Cost and Performance Characteristics of New Generating
Technologies Annual Energy Outlook 2019 Table 251 Nuclear Energy Insider GE Hitachi chases gas plant displacement with new 300 MW reactor April
18 201852 US Department of Energy Cost and Performance Baseline for Fossil Energy Plants Volume 1
Version 3 2015 Exhibits 4 ndash16 and 3 ndash 5153 Idaho National Laboratory Power Cycles for the Generation of Electricity from a Next Generation
Nuclear Plant 2010 p 33 INL and the plant designer (General Atomics) provided further estimates of staffing levels and OampM costs in 2012 but these estimates do not account for the staffing efficiencies envisioned for flexible advanced nuclear plants in the 2030s For instance the 2012 study includes 7 telecommunications staffers 5 storekeepers 89 security personnel and 16 organizational effectiveness staffers
54 LucidCatalyst did not have detailed information regarding ESS maintenance costs however peer-reviewed literature (see following references) suggests that it is ~1 ndash 2 of total CapEx over a year Black amp Veatch (2016) Molten Salt Concept Definition amp Capital Cost Estimate Prepared for US DOE SunShot June 30 2016 IEA (2010) Technology Roadmap Concentrating Solar Power Purohit Ishan (2010) Techno-economic evaluation of concentrating solar power generation in India Energy Policy 2010 p38
55 The 22-year CapEx recovery assumption was provided under the guidance of project advisors who had brokered several large PPA negotiations for large power projects This is on the higher end of the typical recovery periods considered by debt and equity investors
56 Assumes a 55 interest rate on debt and an 85 return for equity investors Naturally the WACC is a material assumption in calculating maximum allowable CapEx Increasing or decreasing the WACC by a percentage point changes the maximum allowable CapEx by about 8 ndash 9
57 Ye Jason (2019) Carbon Pricing Proposal in the 116th Congress Center for Climate and Energy Solutions
58 Climate XChange Education and Research Inc (2020) State Carbon Pricing Network59 Energy Innovations Reform Project (2017) What will advanced nuclear power plants cost60 Energy Technologies Institute (2018) ldquoThe ETI Nuclear Cost Drivers Project Summary Reportrdquo
April 20 201861 Per analysis of ISO-NE Annual Market Reports from 2008-201862 2017 Annual Markets Report ISO New England Inc Internal Market Monitor May 17 201863 Over 95 of energy is transacted in the Day-Ahead market
Cost amp Performance Requirements for Flexible Advanced Nuclear Plants in Future US Power Markets 87
64 $MWh figures are taken directly from ISO-NE annual market reports with the exception of $MWh of capacity for years 2014 ndash 2017 These data points were estimated based on the reported total spend on fulfilling capacity contracts as a percentage of total spend on energy (which on a proportional basis is translated to $MWh)
65 See PJMrsquos Capacity Market Auction Results66 Potomac Economics (2019) 2018 State of the Market Reports for the MISO Electricity Markets
June 201967 CAISO (2019) 2018 Annual Report on Market Issuesamp Performance May 201968 California ISO (2019) What are we doing to green the grid As of October 23rd 201969 California Energy Commission (2018) The California Energy Demand 2018-2030 Revised Forecast
See Table ES-1 Comparison of CED 2017 Revised and CEDU 2016 Mid Case Demand Baseline Forecasts of Statewide Electricity Demand 1 ndash 15
70 CAISO (2018) Day-Ahead Market Enhancements Updates to Revised Straw Proposal71 Net Load reflects the total system demand not being met by variable renewable resources like solar
PV and wind72 CAISO (2018) 2018 Annual Report on Market Issues amp Performance73 CAISO (2018) Day-Ahead Market Enhancements Updates to Revised Straw Proposal74 As the grid resource mix includes more variable renewable generation it becomes increasingly
challenging to forecast load using historical averages75 Wang et al (2016) Ramp capability Modeling in MISO Dispatch and Pricing FERC Technical
Conference on Increasing Realtime and Day-Ahead Market Efficiency through Improved Software76 Cavicchi Joseph Harvey Scott (2018) Ramp Capability Dispatch and Uncertain Intermittent
Resource Output (Table VI-7mdashMISO Ramp Up Shadow Prices) Advanced Workshop in Regulation and Competition 31st Annual Western Conference Monterey California June 27 ndash 29 2018 Revised July 17 2018
77 See MISO Informational Forums (July 2019 April 2918 October 2017 and November 2016)78 A resource must meet the following criteria to be considered a lsquoFast Start Generatorrsquo (1) Minimum
Run Time does not exceed one hour (2) Minimum Down Time does not exceed one hour (3) cold Notification Time plus cold Start-Up Time does not exceed 30 minutes (4) available for dispatch and manned or has automatic remote dispatch capability and (5) capable of receiving and acknowledging a start-up or shut-down dispatch instruction electronically
79 Capacity Scarcity Conditions (CSC) are conditions when the grid cannot redispatch resources to create more operating reserves (which at the time will be dispatching at a capped price) to help maintain grid stability Pay-for-Performance is triggered and prices are cleared on a 5-minute basis until the CSC is resolved
80 ISO-NErsquos performance payment rates 612018 ndash 5312021 ($2000MWh) 612021 ndash 5312024 ($3500MWh) 612024 ndash 5312025 ($5455MWh) These need to get converted 5-minute rates by dividing by 12
81 ISO-NE (2019) Capacity Scarcity Condition Report (includes ability to search historical data)82 PJM (2018) Strengthening Reliability An Analysis of Capacity Performance June 20 201883 Ibid84 PJM (2019) Historical Emergency Procedures triggering Performance Assessment Hours MS Excel
spreadsheet85 CAISO (2018) Day-ahead Market Enhancements Updates to Revised Straw Proposal86 CAISO (2018) 2018 Annual Report on Market Issues amp Performance87 CAISO (2019) Q1 Report on Market Issues and Performance June 28 201988 Wang et al (2016) Ramp capability Modeling in MISO Dispatch and Pricing FERC Technical
Conference on Increasing Realtime and Day-Ahead Market Efficiency through Improved Software
Cost amp Performance Requirements for Flexible Advanced Nuclear Plants in Future US Power Markets 88
89 Cavicchi Joseph Harvey Scott (2018) Ramp Capability Dispatch and Uncertain Intermittent Resource Output (Table VI-7mdashMISO Ramp Up Shadow Prices) Advanced Workshop in Regulation and Competition 31st Annual Western Conference Monterey California June 27 ndash 29 2018
90 See MISO Informational Forums (July 2019 April 2918 October 2017 November 2016) 91 ISO-NE (2019) Capacity Scarcity Condition Report (includes ability to search historical data)92 PJM (2019) Historical Emergency Procedures triggering Performance Assessment Hours93 Waumlrtsillarsquos Flexicycle plants can ramp to full capacity in 5 minutes in a simple cycle configuration and
then convert to combined-cycle operations within the hour Other large turbines in a simple cycle configuration can achieve maximum capacity in less than 10 minutes from a cold start
94 GE (2017) 7HA Power Plants95 Siemens (2016) Siemens gas turbine portfolio96 General Electric (2018) Powering Forward GErsquos Record Setting HA Gas Turbine Ignites a New Era
of Power Generation September 201897 See ERCOTrsquos Fast Responding Regulation Service Up and Down (FRRS) market and CAISOrsquos
stakeholder initiative98 The following are Unit Control Modes (UCM) UCM 1 ndash Off-line and unavailable for dispatch UCM 2
ndash Off-line and available for dispatch UCM 3 ndash Generator on-line not dispatchable UCM 4 ndash On-line and available for dispatch UCM 5 ndash Posture generator to maintain reliability or provide VAR support UCM 6 ndash Generator regulating
99 ISO-NE Appendix 6 Large Generator Interconnection Agreement100 PJM Manual 21 (2019) Rules and Procedures for Determination of Generating Capability Rev 14101 Ibid102 MISO (2018) Resource Adequacy Business Practice Manual Manual No 011103 CAISO (2019) Final Availability Assessment Hours May 15 2019104 ISO-NE (2018) Lesson 6B1 Supplier-Side SettlementmdashFCM Credit and Peak Energy Rent (PER)105 ISO-NE (2014) Market Rule 1mdashStandard Market Design106 Ibid107 PJM Interconnection (2018) Strengthening Reliability An Analysis of Capacity Performance108 PJM (2018) Capacity Performance Unit Specific Parameter Adjustment FAQs109 Table based on slide 14 from PJM (2016) Capacity Performance Performance Assessment Hour
Education110 MISO (2018) Resource Adequacy Business Practice Manual Manual No 011 Effective Date Nov-
01 ndash 2018111 The determination of operational need for the three Flexible RA Categories are as follows Category
1) Based on the magnitude of the largest 3-hour secondary net load ramp Category 2) Based on the difference between 95 of the maximum 3-hour net load ramp and the largest 3-hour secondary net load ramp Category 3) Determined by 5 of the maximum 3-hour net load ramp of the month
112 Table source California Public Utility Commission (2019) 2019 Filing Guide for System Local and Flexible Resource Adequacy (RA) Compliance Filings Issued October 3 2018
113 Effective Flexible Capacity (EFC) is the capacity that is available to be used to meet a LSErsquos Annual Flexible Resource Adequacy requirement EFC calculation is currently under review by CAISO
114 Effective Flexible Capacity values are required and determined based on a resources Pmin and weighted average ramp rate CAISO Tariff (2019) California Independent System Operator Corporation Fifth replacement Electronic Tariff
115 CAISO (2018) Flexible Resource Adequacy Criteria and Must Offer ObligationmdashPhase 2 Revised Draft Framework Proposal Presented at February 7 2018 Stakeholder Meeting
116 Singleton Chad (2017) Can California Conquer the Next Phase of Renewables Integration
Cost amp Performance Requirements for Flexible Advanced Nuclear Plants in Future US Power Markets 89
Greentech Media June 9 2017117 Ibid118 A resourcersquos lsquoEconomic Minimumrsquo (or lsquoEcoMinrsquo) is the minimum amount of energy (MW) that it must
be allowed to produce while under economic dispatch 119 lsquoNo-load Costrsquo encompasses the fixed cost of operation It includes the cost of starting up the plant
getting it synchronized to the grid and standing by to increase power out Effectively it represents the costs outside generating energy to serve load
120 FERC (2016) FERC Proposes Minimum Pricing Requirements for Fast-Start Resources 121 ISO-NE Appendix 6 Large Generator Interconnection Agreement122 PJM (2019) Fast-Start Summary August 7 2019123 MISO (2013) MISO Module AmdashCommon Tariff Provisions 3000 November 19 2013124 CAISO (2019) Fifth Replacement FERC Electric Tariff Effective as of January 1 2019125 Table reflects summarized data collected from Zhou et al (2016) Survey of US Ancillary Services
Markets Center for Energy Environmental and Economic Systems Analysis Energy Systems Division Argonne National Laboratory January 2016
126 ISO-NE (2019) ISO New England Operating Procedure No 11 Blackstart Resource Administration (OP-11) PJM (2015) Black Start Definitions amp Procurement Process MISO (2018) Business Practices Manual Outage Operations CAISO (2017) CAISO Fifth Replacement TariffmdashAppendix D Black Start Generating Units
127 The US DOEEPRI 2015 Electricity Storage Handbook provides an excellent overview on energy storage technologies and grid applications Akhil et al (2015) DOEEPRI Electricity Storage Handbook in collaboration with NRECA February 2015 Prepared by Sandia National Laboratories
128 Energy Storage Association (2019) Energy Storage Benefits Breeze P (2018) An Introduction to Energy Storage Technologies Power System Energy Storage Technologies 1ndash11 Union of Concerned Scientists (2019) How Energy Storage Works
129 Adapted from the 2015 DOEEPRI Handbookmdashsee footnote 128130 Wood MacKenzie Power amp Renewables Energy Storage Association (2019) US energy storage
monitormdash2018 Year in review and Q1 2019 executive summary131 Figure source Wood Mackenzie Power amp Renewables Energy Storage Association (2019) US
Energy Storage Monitor 2018 Year in review and Q1 2019 Executive Summary March 2019132 Bloomberg New Energy Finance (2018) Long-Term Energy Storage Outlook 133 IRENA (2017) Electricity Storage and Renewables Costs and Markets to 2030 International
Renewable Energy Agency Abu Dhabi134 Walton Robert (2018) BNEF raises forecast for global battery deployment to $12T by 2040 Utility
Dive November 8 2018135 Deign Jason (2019) The Safety Question Persists as Energy Storage Prepares for Huge Growth
Greentech Media July 24 2019 136 Figure source Bloomberg New Energy Financersquos New Energy Outlook 2018137 In May 2020 the company Form Energy announced a 1 MW x 150 MWh pilot project with Great
River Energy This is a major achievement for the storage industry and if costs get low enough this could trigger a significant change in the types of applications in which energy storage can participate This would have profound impacts on shoulder and baseload resources
138 US Energy Information Agency (2018) US Battery Storage Market Trends May 2018139 Smart inverters like traditional inverters convert DC to AC current (which can be used on the
grid) but they can also support renewable integration by providing voltage regulation ride through capabilities (helps solar stay grid connected during periods of low voltage) frequency support They can ensure that renewables can either go offline when the grid goes down or avoid overloading local transformers or circuits
Cost amp Performance Requirements for Flexible Advanced Nuclear Plants in Future US Power Markets 90
140 PJM has not called a Load Management Events since 2013 MISO called its first emergency DR event in 10 years in 2017 and has since called 5 events Kolo Elta (2019) Defining System Flexibility Supply is Only Half of the Equation
141 Forsberg C Brick S amp Haratyk G (2018) Coupling heat storage to nuclear reactors for variable electricity output with baseload reactor operation The Electricity Journal 31(3) 23ndash31
142 See simetriccouk143 See the specific heat of solids at engineeringtoolboxcom144 See Remodeling Calculator (2019) 2020 Brick PricesmdashComplete Brick Buying Guide (using
approximate average price of $600 per thousand bricks and average weight of 45 lb per brick)145 Epp Baerbel (2018) Molten salt storage 33 times cheaper than lithium-ion batteries Global Solar
Thermal Energy Council146 Analysis of typical power plant component costs from US Department of Energy Cost and
Performance Baseline for Fossil Energy Plants Vol 1 Bituminous Coal and Natural Gas to Electricity July 6 2015 Page 189
147 National Renewable Energy Laboratory G Glatzmaier Developing a Cost Model and Methodology to Estimate Capital Costs for Thermal Energy Storage NRELTP-5500-53066 September 2011 P 7 See also NREL Craig S Turchi and Garvin A Heath Molten Salt Power Tower Cost Model for the System Advisor Model (SAM) NRELTP-5500-57625 February 2013 Page 6
148 StorTera (2019) SLIQmdashThe Single Liquid Flow Battery The original cost estimates of pound120kW and pound75kWh have been converted to dollars using an exchange rate of 125 US dollars per British pound (pound)
149 US DOE (2015) Cost and Performance Baseline for Fossil Energy Plants Volume 1a Bituminous Coal (PC) and Natural Gas to Electricity Revision 3 National Energy Technology Laboratory Office of Fossil Energy
150 Federal Reserve Bank of St Louis (2019) Producer Price Index by Commodity for Machinery and Equipment Electrical Machinery and Equipment
LucidCatalyst delivers strategic thought leadership to enable rapid decarbonization and prosperity for alllucidcatalystcom

Cost amp Performance Requirements for Flexible Advanced Nuclear Plants in Future US Power Markets
List of Abbreviations amp Acronyms
ARPA-E Advanced Research Projects AgencyndashEnergy (US Dept of Energy)CAISO California Independent System OperatorCapEx Capital ExpendituresCCGT Combined Cycle Natural Gas PlantCP Capacity PerformanceDAM Day-Ahead MarketDER Distributed Energy ResourcesDR Demand ResponseESIG Energy Systems Integration Group (Berkeley National Laboratory)ESS Energy Storage SystemFRAC-MOO Flexible Resource Adequacy Criteria and Must-Offer ObligationFRP Flexible Ramping ProductHALU High-Assay Low-Enriched UraniumISO Independent System OperatorISO-NE Independent System Operator New EnglandLC LucidCatalyst LLCLEU Low-Enriched UraniumLSE Load Serving EntityMEITNER Modeling-Enhanced Innovations Trailblazing Nuclear Energy Reinvigoration (a program of ARPA-E)MISO Midcontinent Independent System OperatorNGCC Natural Gas Combined Cycle power plantNOPR Notice of Proposed Rule MakingNREL National Renewable Energy Laboratory (US Dept of Energy)OampM Operations and MaintenancePAI Performance Assessment IntervalPAH Performance Assessment HoursPFP Pay for PerformancePJM Pennsylvania-Jersey-Maryland Power Pool (now larger area ISO)PPA Power Purchase AgreementRCP Ramp Capability ProductReEDS Regional Energy Deployment System (NREL model)RFP Request for ProposalRGGI Regional Greenhouse Gas InitiativeRPM Reliability Pricing ModelRPS Renewable Portfolio Standard RTM Real-Time MarketRTO Regional Transmission OperatorTRISO Tristructural-Isotropic nuclear fuel pelletsUCM Unit Control ModeVRE Variable Renewable EnergyWACC Weighted Average Cost of Capital
Executive Summary
Cost amp Performance Requirements for Flexible Advanced Nuclear Plants in Future US Power Markets 1
This is an unusual time Competitive power markets are experiencing extended periods of very low power prices driven primarily by large supplies of low-cost natural gas At the same growth in demand for electricity has stagnated in many areas of the US driven by deindustrialization and efficiency improvements These power market conditions would normally discourage new entrants However federal incentives state policies and corporate purchases of renewable energy are driving significant deployment of wind and solar further depressing wholesale power prices Remarkably in spite of these conditions there are now more companies developing advanced reactors than at any other time in history However reactor developers today must design for very different future market conditions as described in this report than nuclear plants have seen in the past In this new environment it is critical for advanced reactor design teams to have clear signals from the market about what plants need to cost to be attractive investments and what performance characteristics will create the most value for plant owners Many advanced reactor designs are still in the conceptual design stage and therefore have large scope for reducing capital expenditures (CapEx) through design choices and applying target cost design methods Designers face critical questions such as How flexible should the reactor be How much is that flexibility worth How much effort andor cost should be expended to deliver flexible performance and how much value can that create for the plant ownerThis report summarizes a modeling effort to estimate the highest allowable CapEx for advanced nuclear plants in future power market environments while still achieving a market rate of return for their owners The goal is to define target cost and performance parameters determined by future market conditions to guide design choices and tradeoffs in the early stage of the reactor and power plant development process
1 Executive SummaryAdvanced reactor developers are at various stages of commercializing new products and must design for future market environments that will exist when their plants are available It is therefore critical to have a clear understanding about what plants will need to cost to be attractive investments and what performance characteristics will create the most value for plant owners
This study is among the first to model the substantial contribution that flexible advanced reactors can make towards reliable responsive affordable and clean future energy systems by supplying clean dispatchable generating capacity
Advanced reactor technologies could make a major contribution to lowering the overall system cost while reducing emissions and improving the performance of future energy systems Depending on specific market conditions it may also be beneficial to co-locate thermal energy storage systems (ESS)
Cost amp Performance Requirements for Flexible Advanced Nuclear Plants in Future US Power Markets 2
This work was funded by the US Department of Energyrsquos (DoE) Advanced Research Projects Agency-Energyrsquos (ARPA-E) Modeling-Enhanced Innovations Trailblazing Nuclear Energy Reinvigoration (MEITNER) program thorough a Work Authorization to DoErsquos Oak Ridge National Laboratory The intent was to provide guidance to Design Teams developing advanced reactorsLucidCatalyst performed the grid modeling and underlying financial analyses summarized in this report We used PLEXOSreg electricity production cost modeling software to estimate the revenues earned by a generic high-temperature advanced nuclear plant in deregulated power markets in the mid-2030s These revenues were then analyzed in a power plant financial model to determine the maximum allowable CapEx for which a plant must be delivered to achieve a market rate of returnLucidCatalyst modeled two different future scenarios each containing different resource mixes The first was a baseline lsquolow renewablesrsquo (Low RE) scenario which presumes a continuation (and eventual expiration) of existing renewables policy The second was a lsquohigh renewablesrsquo (High RE) scenario that has the same resource mix as an NREL1 Regional Energy Deployment System (ReEDS) scenario The ReEDS scenario assumes low renewables costs and low natural gas prices (and thus high penetration of both resource types)2 Both scenarios were modeled across the four principal deregulated US power markets for the year 2034 (1) ISO-New England (ISO-NE) (2) the Pennsylvania Jersey Maryland Power Pool (PJM)3 (3) the Midcontinent Independent System Operator (MISO) and (4) the California ISO (CAISO)Assuming capacity payments seen in todayrsquos capacity markets the PLEXOS modeling revealed that the average maximum allowable CapEx across all scenarios is $3234kW This reflects a range from a minimum of $1965kW to a maximum of $4503kW depending on the power market resource mix and capacity payment amount Each modeled scenario also includes a run with a 12-hour integrated thermal energy storage system (ESS) The additional revenues from the lsquonuclear + storagersquo plant justified extra allowable CapEx ranging from $613kW to $1891kW across the modeled scenarios and ISOs The table below provides the maximum allowable CapEx for each modeled scenario and power market
Executive Summary Table 1 Maximum Allowable CapEx by ISO and Scenario ($kW)
Low Renewables wo ESS with ESS
High Renewables wo ESS with ESS
ISO-NE
Low Capacity Price Case ($50kW-yr)
Mid Capacity Price Case ($75kW-yr)
High Capacity Price Case ($100kW-yr)
$2289 $2962
$2566 $3515
$2843 $4068
$1965 $2788
$2242 $3341
$2519 $3894
PJM Low Capacity Price Case ($50kW-yr)
Mid Capacity Price Case ($75kW-yr)
High Capacity Price Case ($100kW-yr)
$2358 $2988
$2634 $3541
$2911 $4095
$2186 $3038
$2462 $3591
$2739 $4144
MISO Low Capacity Price Case ($50kW-yr)
Mid Capacity Price Case ($75kW-yr)
High Capacity Price Case ($100kW-yr)
$2244 $2857
$2521 $3410
$2797 $3963
$2000 $2654
$2276 $3207
$2553 $3760
Cost amp Performance Requirements for Flexible Advanced Nuclear Plants in Future US Power Markets 3
Low Renewables wo ESS with ESS
High Renewables wo ESS with ESS
CAISO Low Capacity Price Case ($50kW-yr)
Mid Capacity Price Case ($75kW-yr)
High Capacity Price Case ($100kW-yr)
$2187 $3397
$2464 $3950
$2740 $4503
$1968 $3306
$2244 $3859
$2521 $4412
LucidCatalyst performed additional sensitivity analyses to assess the impact of other factors on maximum allowable CapEx One scenario included a large fleet of advanced nuclear plants with ESS Due to relatively low operating costs advanced nuclear plants set lower energy clearing prices and thus decreased the allowable CapEx thresholds Importantly the lower average energy prices led to a small decrease in the total cost of energy delivery for the ISO as shown in the following table
Executive Summary Table 2 Annual Average Market Prices for ISO-NE PJM MISO and CAISO
Average Annual Energy Price
ISO-NE High RE Future (Without Flexible Adv Nuclear)
Fleet Deployment of Flexible Adv Nuclear
$2632MWh
$2264MWh
PJM High RE Future (Without Flexible Adv Nuclear)
Fleet Deployment of Flexible Adv Nuclear
$2703MWh
$2267MWh
MISO High RE Future (Without Flexible Adv Nuclear)
Fleet Deployment of Flexible Adv Nuclear
$2613MWh
$2470MWh
CAISO High RE Future (Without Flexible Adv Nuclear)
Fleet Deployment of Flexible Adv Nuclear
$3806MWh
$2961MWh
A second scenario explored the influence of operations and maintenance (OampM) costs on maximum allowable CapEx Each $1kW-year in OampM cost reduction resulted in an increase in the allowable CapEx of approximately $11kW The difference between the low OampM case and the high case ($61kW-year) is $337kW of CapEx To put this in perspective for plants without the ESS this has more impact on CapEx than a reduction of $25kW-year in capacity paymentsmdashfor no additional value (energy or capacity) delivered to the market The generic high-temperature reactor modeled in this study potentially enables cost-effective thermal ESS Conceptually this operates by diverting heat from making steam for the turbine to a thermal store In the same way that LucidCatalyst did not model a specific reactor technology the modeling did not reflect any specific thermal storage technology4 Rather it was intended to determine the allowable cost of and value created by the thermal energy storage systemThe integrated thermal energy storage system always increased the allowable CapEx however the PLEXOS modeling revealed that the scale of such an improvement depended on several factors The plant with ESS stops making steam for the primary turbine during the lowest priced hours storing heat
Cost amp Performance Requirements for Flexible Advanced Nuclear Plants in Future US Power Markets 4
from the reactor in the thermal storage facility and then sells from both the primary and the storage facility turbine during the highest priced hours This allows the 500 MW plant to sell no electricity for 12 hours and produce at 1000 MWe for the other 12 hours while the nuclear island operates continuously at full power The amount of CapEx that can be budgeted for thermal storage depends on the grid resource mix (eg Low RE vs High RE scenario) and importantly the prevailing capacity payment The PLEXOS modeling revealed that co-locating a thermal energy storage system makes economic sense if the system can be built for less than $1126kW on average5 This finding should motivate further research and development in innovative cost-effective thermal energy storage systems for integration with advanced reactors It is also important to note that without the thermal ESS (or an alternative revenue source such as hydrogen production process heat for industry etc) the modeled plantsrsquo capacity factors suffer significantly in areas with high renewable penetration Most market mechanisms designed to compensate flexible and dispatchable generators are still too early-stage to be able to gauge their significance in the mid-2030s The grid will undoubtedly demand large amounts of flexible resources by that time however it is currently unclear how much energy will be transacted through these new products Nonetheless developers should track how these products evolve Further they should track the development of competitive technologies such as energy storage distributed energy resources (DERs) demand-side solutions like flexible loads (eg EVs electric hot water heaters smart thermostats etc) and demand response programs These resources help lsquotime shiftrsquo demand smooth power flows across the grid and enhance grid flexibility overall They are less effective however in serving increases in overall electricity demand (absent DER generators) With the electrification of the transportation sector (as well as other sectors) expected to increase overall demand advanced nuclear plants with thermal energy storage are uniquely suited to meet that demandmdashparticularly in markets with high penetration of renewables where ramping is needed Although regulated electricity markets were outside the modeling scope advanced nuclear developers may find it favorable to focus on these markets for their initial sales efforts Regulated utilities can utilize all the benefits of highly rampable and dispatchable output without requiring complex often contested and relatively slow-moving market reforms to reveal the value of certain grid services For these reasons regulated markets have been in practical terms the first markets for Gen III and III+ nuclear plants as well as other innovative power projects (see NuScale Powerrsquos current development efforts in Utah or the Kemper carbon capture and sequestration project in Mississippi)Considering advanced nuclear plants can operate as baseload resources as well as following load they can supply a large fraction of firm power without raising the overall cost of electricity This conclusion should motivate ISO operators public utility commissioners policymakers utilities and other stakeholders to investigate the role that these products could play in the grids of the future and to continue supporting advanced nuclear commercialization efforts This should also motivate organizations responsible for national and international energy modeling to include flexible advanced nuclear with thermal energy storage in their projections for future energy systems The CapEx thresholds highlighted in this report are relatively low compared to conventional nuclear new-build plants in North America and Europe However they are well within the range of those reported by third-party cost studies6 and advanced nuclear developers themselves This range is also well within the costs being achieved in countries with continuous new build nuclear programs7 Designers should integrate these cost requirements into their plant designs and consider whether adding thermal storage makes sense in their target markets
Main Report
Cost amp Performance Requirements for Flexible Advanced Nuclear Plants in Future US Power Markets 6
ARPA-E arranged several meetings with utilities policymakers and other organizations involved in the commercialization process for advanced nuclear technology The goal was to solicit input on the conditions that would lead to increased support Discussions covered a range of topics and high-level feedback largely fell into the following criteria
n Low overnight construction cost n Fast ramp rate without steam bypass (power capacitymin) n Short onsite construction time n Reduced staffing levels (onsite and offsite) n Smaller emergency planning zone limited to site boundary n Longer time before human response required for an accident n Reliable onsite backup power n High process heat temperature
These criteria offer useful guiding principles for advanced reactor designers as they derive from organizations that influence oversee and ultimately make power plant investment decisions They also formed the basis for eligibility requirements for ARPA-Ersquos MEITNER (Modeling-Enhanced Innovations Trailblazing Nuclear Energy Reinvigoration) program The MEITNER program supports a collection of projects that ldquoseek to identify and develop innovative technologies that can enable designs for lower cost safer advanced nuclear reactorshellip [and] establish the basis for a modern domestic supply chain supporting nuclear technologyrdquo 8 This report focuses on the first two criteria from the list above and examines the potential for advanced nuclear plants to meet the growing need for grid flexibility Specifically it uses PLEXOSreg production cost modeling software to estimate revenues earned by a generic advanced nuclear plant in deregulated power markets with low-renewables or high-renewables scenarios in the mid-2030s Revenues are used to estimate the maximum allowable CapEx or the maximum cost for which a plant must be delivered The intent is to provide advanced reactor developers including the MEITNER programrsquos Design Teams with information regarding the value of lsquoflexiblersquo operation (ie highly-rampable and capable of load following) and the CapEx targets they need to achieve by the time their reactors are commercially available This information also allows developers to assess design trade-offs inform interim technical targets evaluate projected system performance and articulate the need and impact of further investments to public and private fundersThis analysis was conducted with funding provided through an ARPA-E Work Authorization to DoErsquos Oak Ridge National Laboratory which subcontracted to LucidCatalyst
2 Introduction Several advanced nuclear plants are being designed to have similar ramping and load-following capabilities as combined-cycle natural gas plants (CCGTs) Because they also provide 247 emissions-free baseload generation the US Department of Energyrsquos Advanced Research Projects Agency-Energy (ARPA-E) approached a variety of stakeholders to better understand the factors that could potentially increase their procurement appeal
Cost amp Performance Requirements for Flexible Advanced Nuclear Plants in Future US Power Markets 7
21 Estimating Maximum Allowable Capex in Future Markets Using Plexos Software
LucidCatalyst modeled flexible (ie highly-rampable) advanced nuclear plants in the four principal deregulated US power markets (1) ISO-New England (ISO-NE) (2) Pennsylvania Jersey Maryland Power Pool (PJM) (3) Midcontinent Independent System Operator (MISO) and (4) California ISO (CAISO) The modeling runs were set in the year 20349 under the assumption that advanced nuclear plants will be commercially available by then LucidCatalyst modeled two potential 2034 scenarios based on different variable renewable energy10 (VRE) penetration assumptions
n Baseline Renewables Future This conservative renewables case reflects built-in values in the PLEXOS software which are the result of a capacity expansionoptimization model run performed by Energy Exemplar (makers of PLEXOS) for 2034 and beyond This assumes that all current state Renewable Portfolio Standard (RPS) targets tax credits and other existing legislation that supports renewables deploymentmdashcurrent as of January 1 2019mdashtake effect It does not include any non- binding targets or assume any future policy that could stimulate further renewables deployment
n Higher Renewables Future This scenario is based on the lsquoLow Natural Gas PriceLow Renewables Costrsquo scenario included in NRELrsquos Regional Energy Deployment System (ReEDS) model (described in Section 522)11 This assumes a higher renewables build-out and that natural gas prices do not significantly differ from todayrsquos prices (~$3MMBtu) This implies that advanced nuclear plants need to compete with highly flexible new-build combined-cycle gas plants in a low-cost natural gas environment
Assuming the current spectrum of capacity payments seen in todayrsquos capacity markets LucidCatalyst concluded that flexible advanced nuclear plants have an allowable CapEx threshold of between $1965kW and $4503kW depending on ISO VRE scenario and assumptions related to capacity payments (see Section 7) LucidCatalyst also modeled a parallel scenario that includes a 12-hour co-located energy storage system (ESS) The additional revenues from the lsquonuclear + ESSrsquo plant justified extra allowable CapEx ranging from $613kW to $1891kW This range is also driven by different scenario assumptions but the key finding is that higher renewables penetration leads to higher ESS revenues LucidCatalyst modeled three additional 2034 scenarios Each examined the impact on maximum allowable CapEx from (1) a hypothetical range of CO2 prices (2) a large fleet of advanced reactors operating in the same market and (3) an alternative assumption for annual fixed OampM cost
22 Report Structure
This report is primarily intended for advanced reactor developers with relatively little knowledge andor experience with wholesale electricity markets The report is divided into the following sections
1 Executive Summary2 Introduction3 Revenue Generation in Deregulated and Regulated Power Markets
This section provides advanced reactor developers with a brief high-level overview of how energy prices are set in wholesale power markets in the US and highlights the most relevant revenue streams for advanced nuclear plants It is not an exhaustive review of all aspects of market operations and settlements rather it focuses on the basics of price formation in deregulated markets and procurement in regulated markets
4 Current Revenue Potential and VRE Effects on Nuclear Projects Flexible dispatchable resources are increasingly important as VRE deployment continues to rise This section explains how VREs depress average wholesale energy prices and present fundamental challenges to grid management and current power market design It also describes how increasing
Cost amp Performance Requirements for Flexible Advanced Nuclear Plants in Future US Power Markets 8
quantities of VRE pose an existential threat to the economic viability of lsquomust-runrsquo baseload assets such as conventional nuclear plants The goal is to provide a brief survey of the US energy landscape such that advanced reactor developers have a baseline understanding from which to view the 2034 scenarios
5 PLEXOS and Financial Modeling Methodology and Assumptions LucidCatalyst developed an illustrative advanced nuclear plant for PLEXOS modeling runs This section includes the cost and performance assumptions for this illustrative plant and describes the methodology for preparing the 2034 low- and high-renewables scenarios in PLEXOS
6 Illustrative Cash Flow Analysis With the reportrsquos focus on allowable CapEx it is important to walk through how this figure is calculated This section describes the sequence of steps taken to arrive at this figure under a set of prescribed market conditions This provides the basis for understanding the PLEXOS modeling results
7 PLEXOS Modeling Results for 2034 All 2034 modeling results are presented in this section Specifically it highlights the maximum allowable CapEx for flexible advanced nuclear plants in four deregulated power markets (ISO-NE PJM MISO and CAISO) in the baseline- and high-renewable environments and under a range of related input assumptions
8 Additional Modeling Analyses Several factors can influence a plantrsquos maximum allowable CapEx This section presents the CapEx implications of CO2 pricing and market penetration potential Additional modeling scenarios in this section examine the impact of a CO2 price on CapEx the potential to deploy significant quantity of advanced nuclear capacity without affecting energy prices (and therefore allowable CapEx) and the relationship between expected fixed OampM costs and allowable CapEx
9 Conclusions The PLEXOS modeling reveals several takeaways for MEITNER participants as they consider their plant designs This section summarizes the findings from the modeling analysis and provides commentary on how flexible advanced nuclear plants can be delivered for less than the maximum allowable CapEx such that they can play a vital role in delivering a clean reliable flexible and low-cost electric power system
10 Appendices This report also contains useful reference information for advanced reactor developers including the MEITNER Design Teams in the following appendices
A Historical revenues by market product in select ISOs B New market mechanisms that capture the value of resource flexibility C Desirable performance attributes and market participation requirements D Alternative ways of providing system flexibility E High-level cost analysis of energy storage system F High-level estimate of non-nuclear island costs
Cost amp Performance Requirements for Flexible Advanced Nuclear Plants in Future US Power Markets 9
3 Price data included in this section are from the ISOs modeled in this analysis (ISO-NE PJM MISO and CAISO)
31 Available Revenue Streams for Advanced Nuclear Plants in Deregulated Markets
The majority of electricity bought and sold on the electric power grid is transacted through bilateral Power Purchase Agreements (PPAs) PPAs involve two parties agreeing to a price quantity of electricity to be supplied and period over which that electricity is to be delivered In deregulated markets while most energy sales are still transacted through PPAs there is a competitive marketplace where energy capacity and ancillary services (used to balance the grid) are bought and sold Table 1 below lists the various revenue opportunities for flexible advanced nuclear power plants and qualifies their relevance
Table 1 Relevance of Available Revenue Streams for Flexible Advanced Reactors
Market Revenue Mechanism
Description Relevance
Energy
Day-Ahead Market
Real-Time Market
The Day-Ahead Market (DAM) allows supply and demand bids to be set a day before electricity is actually generated or consumed It allows power plants to prepare to deliver their commitment and provides the Regional Transmission Operator (RTO) an understanding of which units will be operating to meet the following dayrsquos demand on an hourly basis Most energy sales are still transacted through Power Purchase Agreements however the vast majority of electricity transacted through power markets is through the DAM Relevance Revenues from the Day-Ahead Market will constitute the majority of advanced nuclear plant revenues (gt60)
The Real-Time Market (RTM) is primarily used to resolve deviations between forecasted supply and demand and address other contingences (eg unplannedunforeseen availability and or operational issues at power plants) Relevance An advanced nuclear plant will sell far less energy in the Real Time market (and prices do not differ significantly from DA market)
Very High
Medium
Revenue Generation in Deregulated and Regulated Power MarketsIt is important that advanced reactor developers have a basic understanding of the relevant revenue streams how energy prices are set and relative advantages and disadvantages of deploying in deregulated and regulated power markets
Cost amp Performance Requirements for Flexible Advanced Nuclear Plants in Future US Power Markets 10
Market Revenue Mechanism
Description Relevance
Capacity
Capacity
Forward Capacity
Vertically integrated utilities and load-serving entities (LSEs or local utility companies) in deregulated markets provide capacity payments to resources that help ensure sufficient capacity to meet mandated reliability requirements or meet extraordinarily high electricity demands These payments are designed to replace gaps in revenue resulting from energy sales that are insufficient to maintain the plantsrsquo financial viability Relevance This price will be negotiated with the LSE and represent a substantial percentage of annual revenues for advanced nuclear plants (~20 ndash 30)
Forward capacity markets are used to incentivize the deployment of new energy resources Developing large energy resources takes time and capital and this market helps ensure that these resources are constructed and synchronized to the grid in time to adequately meet forecasted future demand Relevance Based on a historical analysis of capacity auction results capacity payments make up 20 ndash 30 of advanced nuclear revenues
Very High
Very High
Ancillary Services
Frequency Regulation
Spinning Reserves
Non-Spinning Reserves
Voltage Control
Black Start
Resources participating in frequency regulation markets adjust their output or consumption in response to an automated signal from grid operators These adjustments help correct short-term changes in energy demand that affect system stability and keeps the grid frequency at (or very close to) 60 Hertz Relevance Relatively small market and probably best suited for grid-tied electrochemical storage (eg batteries) by the mid-2030s
The spinning reserve market compensates grid-synchronized resources that have available capacity to inject into the grid when called upon Resources must inject this capacity within a relatively short time usually less than 10 minutes While these reserves have conventionally been used to respond to unexpected contingencies such as a generator unexpectedly falling offline it is likely that more spinning reserves will be needed as more VREs are deployed Relevance Grid operators will need more synchronized resources to help maintain stability when large amounts of VRE go offline While this market is likely to grow in size increased participation will likely mitigate an increase in profitability Therefore while this may be a revenue source for advanced nuclear plants it is not expected to be significant
The non-spinning reserve market compensates resources that are not synchronized to the grid but can be within a short period (usually within 10 ndash 30 minutes) As with spinning reserves these resources are called upon during unexpected losses in generation Relevance Relatively small market with little revenue
Generating resources can be compensated for providing reactive power to compensate for drops in system voltage Relevance Insignificant revenue opportunities for advanced nuclear
If the grid loses power Black Start designated generators are committed to restoring electricity to the grid and do not require an outside electrical supply to do so Relevance Insignificant revenue opportunities for advanced nuclear
Very Low
Low
Very Low
Very Low
Very Low
Other
Flexible Ramping Product
Flexible ramping products are relatively new and currently only available in CAISO and MISO They reward resources that can quickly adjust outputmdashbeyond what has been obligatedmdashwithin a certain time period to correct forecasting uncertainties and other anomalies It is possible that these flexible ramping products will transact more energy as VRE deployment rises Relevance These products are very new and currently do not transact significant quantities of energy These may (or may not) become significant revenue opportunities for advanced nuclear plants going forward
Low
Power plants with low marginal costs (solar wind hydro existing nuclear)
Mar
gina
l Cos
t and
Po
wer
(Ene
rgy)
Pric
e in
$M
Wh
Demand
Market Price
Power (Energy) Supply and Demand in MWh
Fossil plants with higher marginal costs (coal natural gas oil)
Figure 1
Cost amp Performance Requirements for Flexible Advanced Nuclear Plants in Future US Power Markets 11
32 Energy Market Price Formation in Deregulated Markets
As in other competitive markets energy prices in power markets are set by the lsquomarginal costsrsquo of the marginal energy producer as shown in Figure 1 below The lsquomarginal costrsquo typically reflects a resourcersquos cost of producing each MWh of electricity which includes fuel costs the efficiency with which they are converted to electricity and any other costs associated with operating such as labor and maintenance The marginal cost guides what a resource will bid into the energy market for a given time period The grid operator will then arrange all energy supply bids in ascending order of price (often called the lsquomerit order) for each moment in time This supply stack (or lsquobid stackrsquo) begins with plants with lowest marginal costs (eg solar wind hydro and nuclear) and proceeds upward to those with higher marginal costs in (eg coal natural gas and oil plants) The supply stack is then compared to electricity demand for a given moment in time and the highest bid that intersects with the demand curve sets the clearing price for all lsquoinfra-marginalrsquo plants (ie with bids lower than the marginal producer)
Figure 1 Stylized Supply Stack Demand Curve and Price
For illustrative purposes Figure 2 below shows the stylized electricity market with the addition of flexible advanced nuclear plants Their assumed low marginal costs have the effect of pushing plants with higher marginal costs beyond the intersection of the supply and demand curve As a result fossil plants which would otherwise set the market price no longer operate as much Displacement of high-marginal-cost plants lowers overall clearing prices
Demand
Market Price
Advanced flexible nuclear plants
Higher-cost fossil plants arepushed out of the marketby advanced flexible nuclear
Power (Energy) Supply and Demand in MWh
Figure 2
Mar
gina
l Cos
t and
Po
wer
(Ene
rgy)
Pric
e in
$M
Wh
Cost amp Performance Requirements for Flexible Advanced Nuclear Plants in Future US Power Markets 12
Figure 2 Stylized Power Market Supply Demand and Price with Flexible Advanced Nuclear Plants
33 New Efforts to Compensate and Promote Flexible Resources
Rewarding resources that can be available and quickly ramp up and down during periods of grid stress (either on an hourly minute second or sub-second basis) has been the focus of several recent regulatory initiatives relating to market design12 Creating new revenue lsquoproductsrsquo often takes years to formalize and implement however They require several rounds of stakeholder input and are often implemented on a trial basis with subsequent revisions In MISO for example it typically takes 5 ndash 7 years between opening a new docket and market implementation13 Upon surveying the markets included in this study (ISO-NE PJM MISO and CAISO) mechanisms designed to reward resource flexibility are relatively nascent and do not transact large quantities of power or capital throughout the year None currently provide the compensation necessary to stimulate investment in new nuclear capacity While these revenue streams will likely become more relevant it is unclear whether they will ever be a material source of revenue for flexible nuclear plants Developers should therefore track the evolution of these products but not consider them as material revenue sources until they prove themselves as such Appendix B provides a longer description of these products and their relevance to advanced nuclear developers
34 Regulated Market Overview
Regulated markets offer an alternative development pathway for advanced nuclear developers In US regulated electricity markets vertically integrated utilities own control andor manage the generation delivery and customer-sited infrastructure for electricity delivery They are monopolies with the obligation to serve retail customers within their service territories and follow rules14 set forth by federal state and local agencies These utilities are overseen by a public regulator usually a state public utilities commission Regulated utilities supply electricity at cost plus an approved rate of return on their investments for delivering electricity (including generation transmission and other grid resources) This structure replaces competitive markets in determining prices set for energy generation capacity ancillary services (and other services)
Cost amp Performance Requirements for Flexible Advanced Nuclear Plants in Future US Power Markets 13
Regulated markets are largely dominant in the Southeast Northwest and much of the West outside California Under this arrangement consumers are limited in their choice of electricity provider however prices are generally more stable and certain over time than in deregulated markets
341 Resource Procurement Regulated utilities typically conduct open and competitive solicitations to procure new resources These are either mandated or strongly encouraged by regulators to assure the lowest-cost supply for retail customers Utilities are often allowed to participate in the bidding process however they are forced to accept the lowest-cost option where equivalent products and services are offered15 Some regulatory commissions will direct utilities to procure certain types of resources like renewables to meet state mandates or Renewable Portfolio Standard (RPS) goals Resource procurement begins with the utility typically issuing a public Request for Proposal (RFP) that describes the type of resources it seeks to procure Based on the bidrsquos content (including price technology maturitybankability OampM contract terms project financing terms developerrsquos reputation etc) and oversight and approval from the overseeing regulatory authority a winner is selected Typically these contract terms are not made public
342 Benefits and Drawbacks of Developing Flexible Advanced Nuclear Plants in a Regulated MarketThe regulated environment is less transparent than a deregulated market environment resulting in advantages and disadvantages for flexible advanced nuclear projects The primary advantage is that developers are not limited to a defined suite of revenue streams which may or may not be well designed to compensate for the values a flexible nuclear plant can provide Developers also get the opportunity to make the case for flexibility directly to the utility or articulate the benefits of flexibility through their RFP response Further when a plant becomes lsquomerchantrsquo (after a PPA expires for example) in a deregulated market it is subject to market conditions which are more dynamic less predictable and more competitive (generally lowering overall revenue potential) Two recent nuclear plant projects in the United StatesmdashVC Summer in South Carolina and Vogtle in Georgiamdashare located in regulated markets The only current advanced nuclear development effort (NuScale Power in Utah Associated Municipal Power Systems) is taking place in a regulated market as wellThe primary disadvantage of a regulated market is the lack of price transparency and the reduced freedom of participating without necessarily winning an RFP Furthermore revenue is fixed and power projects are not able to access high price conditions during scarcity events Deregulated markets have less barriers to entry however even in such markets the capital intensity of nuclear plants will undoubtedly require developers to sign a long-term PPA with a credit-worthy utility or a long-term capacity contract before the project can be financed (or the nuclear plant may be owned directly by the utility)
Cost amp Performance Requirements for Flexible Advanced Nuclear Plants in Future US Power Markets 14
41 Wholesale Market Clearing Prices Have Been in Decline
Average clearing prices in most ISOs have been in decline over the past ten years mostly due to falling natural gas prices Low-cost gas reduces the marginal cost of running natural gas plants which typically operate lsquoon the marginrsquo and therefore set energy prices Table 2 provides the average Day-Ahead energy capacity and ancillary services prices in four ISOs over the past decade (Appendix A presents additional detail on these prices)
Table 2 Average Wholesale Prices by Revenue Stream in Select ISOs (2009 ndash 2018)
ISO-NE PJM MISO CAISO
Average Energy Price ($MWh)
(Trendline growth over 10 years)
$4498
(-21)
$3950
(-27)
$3134
(-09)
$3886
(11)
Average Capacity Price ($MWh)
(Trendline growth over 10 years)
$1301
(67)
$1030
(17)
$0671
(152)
$0181
(180)
Average Ancillary Service Price ($MWh) $146 $089 $014 $046
1 MISO and CAISO have a Resource Adequacy Construct where capacity is procured via bilateral contracts which are not made public These figures represent the voluntary capacity market where utilities can procure remaining capacity needed to fulfill their capacity obligations These prices should not be used as a proxy for capacity payments Also most new-build energy projects require multi-year capacity contracts
4 Current Revenue Potential and VRE Effects on Nuclear ProjectsWhile it is difficult to predict what the 2030s power markets will look like it will inevitably be influenced by the policy technology and cost trends of today As such it is useful to characterize current market conditions and highlight the relevant issues and developments that advanced reactor developers should track This section highlights the current revenue potential for advanced nuclear plants as well as some of the key challenges for participation in future markets
Demand
Market Price
(Out of the Market)
Power (Energy) Supply and Demand in MWh
Lower marginal cost resources push higher marginal cost resources out of the bid stack lowering the overall clearing price
SolarWind
Figure 3
Mar
gina
l Cos
t and
Po
wer
(Ene
rgy)
Pric
e in
$M
Wh
Cost amp Performance Requirements for Flexible Advanced Nuclear Plants in Future US Power Markets 15
While low natural gas prices have largely driven the decline in energy prices other factors are also at work Research at the Lawrence Berkeley National Laboratoryrsquos Energy Systems Integration Group (ESIG) has shown that while solar PV and wind have historically had relatively little impact on energy price they ldquohave [now] begun to meaningfully influence temporal and geographic pricing trendsrdquo 16 Periods of exceptional sun and wind are now driving a higher frequency in the number of hours where market clearing prices are negative17
Figure 3 Market Price Declines When Renewables Dominate the Supply Stack
The increase in VRE deployment and more importantly the anticipation of continued VRE deployment is forcing the power grid to become more flexible and resilient Falling energy prices are a threat to advanced nuclearrsquos economics However the need for more flexible dispatchable resources may be an opportunity
42 The Rise of Variable Renewable Energy and Need for Grid Flexibility
To ensure a reliable supply of electricity in uncertain conditions system operators dynamically alter generation andor load to keep the grid at a stable frequency of 60 Hz Maintaining this frequency was historically furnished by large centralized generators In fact the entire electric power grid was initially designed and built around large centralized generators (eg coal nuclear and hydroelectric plants)18
They were the basis for all grid planning decisions and their startup times fuel availability and operating characteristics informed the design of competitive power markets19 However maintaining a balanced grid frequency has become a growing concern as more VREs are deployed They are also disrupting the way power markets are currently designed Largely driven by rapidly falling costs and supportive policies wind and solar PV deployment has increased 500 in the last 10 years20 Between 2009 ndash 2017 costs dropped 76 for solar PV and 34 for wind and it is expected that deployment rates will continue to rise21 To continue accommodating these resources power systems must maintain sufficient operating reserves and have generators
Figure 4
Cost amp Performance Requirements for Flexible Advanced Nuclear Plants in Future US Power Markets 16
that can quickly inject power when VREmdasheither expectedly or unexpectedlymdashgoes offline Beyond backfilling when the wind and sun are unavailable the grid needs resources that can ramp down as VRE generation comes online in the morning and ramp up as the sun goes down in the evening Figure 4 below presents the net load curve 22 for a spring day in California in 2017 As more VRE is built the net load curversquos lsquobellyrsquo will drop even further making it more difficult to meet demand during morning and evening ramps This provides a useful reference case for other markets that will ultimately encounter steepening net load curves
Figure 4 Net Load Curve in CAISO for April 9 2017 23
Increasing VRE not only requires increasing grid flexibility it also triggers more renewables curtailment and transmission congestion (affecting locational marginal prices) Further VRErsquos capacity to reduce expected reliability problems or outage events (measured by their Effective Load Carrying Capability or ELCC) diminishes as more VRE is deployed (see Figure 5) This helps explain why most lsquohigh renewablesrsquo scenarios in the mid-2030s still include a large amount of fossil generationmdashparticularly natural gas24
Figure 5
Cost amp Performance Requirements for Flexible Advanced Nuclear Plants in Future US Power Markets 17
Figure 5 Wind and Solar ELCC Curves as a Function of Installed Capacity in MISO25
In summary the grid was not designed around the irregular and unscheduled generation inherent to VREs More lsquoflexible resourcesrsquo such as energy storage fast ramping gas plants and demand side resources will be needed to accommodate more VRE while maintaining a high level of grid stability Advanced nuclear reactors if designed to be flexible could play a meaningful role in enabling more VRE deployment To do so they will need to be compensated for the inherent value of being flexible and dispatchable Current market mechanisms do not incentivize nuclear plants to operate flexibly nor reward them for supporting grid stability This has created extremely challenging conditions and made it difficult for conventional nuclear projects to be profitable
43 Conventional Nuclear Plants Face Fundamental Headwinds
Conventional nuclear plants typically operate as lsquomust-runrsquo baseload resources While they are capable of a moderate degree of ramping the economics of doing so in most cases are poor Conventional nuclear plants were initially designed to ramp (up and down) load follow and provide several ancillary services products26 Current reactor designs with best-in-class ramping capabilities such as EDFrsquos EPR and Westinghousersquos AP1000 can safely ramp to a maximum of approximately 5minute2728 However due to high capital costs and low marginal costs of nuclear plantsmdashparticularly in deregulated marketsmdashthey seek to operate at their maximum rated capacity for as long as possible When market prices fall below a nuclear plantrsquos operating costs the plant operates at a financial loss While they may forgo energy sales and provide operating reserves under these conditions it is only economical to do so in highly specific scenarios29 Operating at a loss or at declining profit marginsmdashespecially over a long period of timemdashcan materially impact a plantrsquos economics In markets with significant VRE penetration (eg CAISO) clearing prices can approach zero or below30 during periods of exceptional sun or wind and relatively low demand These pricing events force nuclear and other lsquomust-runrsquo resources to operate at a loss or go offline Low natural gas prices and the anticipation that VRE will continue to push prices downward has motivated several utilities to retire
Cost amp Performance Requirements for Flexible Advanced Nuclear Plants in Future US Power Markets 18
nuclear plants or not renew their operating licenses31 In fact these difficult economic conditions have forced six nuclear plants to close in the past five years with nine more planning to retire in the next 10 years (representing more than 18 GW of generation capacity)32 Further the average age of US nuclear plants is approximately 37 years Plants become more expensive to operate as they age33 Absent significant changes to nuclearrsquos CapEx operating profile or revenue opportunities (particularly capacity payments) it is difficult to see how conventional nuclear will successfully navigate a market environment with low energy prices going forward It is important to note that nuclear plants are not the only generators experiencing difficult economics due to low energy prices Natural gas plants are seeing a higher percentage of their revenues coming from non-energy sales (mostly capacity and reserve payments) Low energy price environments affect all resources
431 Non-Market Payments Keep Some Conventional Nuclear Plants OperationalSeveral states have been passing legislation to provide nuclear plants with payments to ensure they continue to run even as power market conditions worsen Illinois New Jersey Connecticut New York and Ohio have all authorized payments to keep nuclear plants online Pennsylvania has proposed legislation to do the same34 Maryland is currently analyzing whether nuclear should be eligible for clean-energy credits35 Proponents of legislative measures see preserving existing nuclear plants as a cost-effective means (on a $MWh basis) of achieving their emissions-reduction goalsWhile some form of lsquonon-market paymentsrsquo may be available to advanced nuclear developers in the mid-2030s it is neither likely nor clear how they would be structured Therefore the possibility of such payments should not influence design decisions being made today If markets begin to offer compensation to dispatchable resources that provide grid stability and dependability or for emissions-free generation these out-of-market payments will become less important or entirely unnecessary Several plant owners are also looking into potential non-power market revenue streams such as hydrogen production36 to improve economic performance Until these changes occur low natural gas prices (which according to natural gas price futures are not expected to rise substantially in the coming years) and increasing VRE deployment will challenge nuclear plant economics in several markets
Cost amp Performance Requirements for Flexible Advanced Nuclear Plants in Future US Power Markets 19
5 To calculate the maximum allowable CapEx LucidCatalyst transferred PLEXOS outputsmdashwhich included energy revenues and plant outputcapacity factors for both the plant and if necessary the ESS systemmdashinto a lsquopost-PLEXOSrsquo financial model Here capacity payments and various financial assumptions are applied to determine the final allowable CapEx Figure 6 on the following page provides a high-level diagram of the methodology which is described in detail in this section
51 Overview of PLEXOS Electricity Market Modeling Software
PLEXOS is a production cost model for electricity markets in the US (with other international versions available) that can simulate future market conditions Production cost models predict the economic dispatch of power plants in a given service territory or market and across a defined timeframe PLEXOS has been widely used since 1999 by grid operators utilities and electricity market analysts For this analysis data on expected hourly demand for each service territory comes with the software package and the program determines the optimal mix of power plants to meet demand in each hour at the lowest cost Results include plant power operational details market price forecasts and CO2 emissions from fuel consumption at fossil plants PLEXOS determines the optimal production patterns from power plants based on marginal cost pricing as illustrated in the stylized power market diagrams in Section 3 PLEXOS contains detailed data on existing power plants (including their capacity outage requirements energy conversion efficiencies etc) solar and wind availability by location demand forecasts fuel price forecasts transmission line limits emissions rates and all other necessary inputs for performing market simulations LucidCatalyst adjusted some of the built-in data for the future baseline scenario and entered new inputs to represent flexible advanced nuclear plants with energy storage as discussed in the next two subsections
PLEXOS and Financial Modeling Methodology and AssumptionsLucidCatalyst used PLEXOSreg electricity market modeling software from Energy Exemplar to model the revenue potential of flexible advanced nuclear technology (and thus an implied maximum CapEx) in four US future power markets ISO-NE PJM MISO and CAISO The modeling exercise examines a hypothetical plantrsquos annual revenue profile as it responds to fluctuations in demandmdasheither through ramping up and down or through a combination of ramping and co-located energy storage systems PLEXOS provides empirical precision for a projectrsquos annual capacity factor and the optimal output in response to changing market conditions LucidCatalyst also ran additional modeling scenarios to observe the effect of CO2 prices and the aggregate impact of multiple flexible advanced nuclear plants on market prices
Figure 6
Cost amp Performance Requirements for Flexible Advanced Nuclear Plants in Future US Power Markets 20
Figure 6 High-Level Methodology Diagram for Calculating Maximum Allowable CapEx
52 Modeling Methodology
521 Modeling HorizonLucidCatalyst used PLEXOS to model electricity markets in 2018 (to show recent data) and 2034 The year 2034 was selected as a baseline year to model for two reasons First it is far enough in the future (halfway to 2050) when advanced reactors are expected to be commercially available This is supported by several advanced nuclear companies claiming they will have a commercially available reactor in the late 2020s37 Second this date also provides more time for ISOs to transition beyond what is currently being modeled in each ISOrsquos current forward-looking plans Developing credible grid scenarios for 2034 presents obvious challenges State and regional policymakers are developing ambitious emissions-reduction targets as the cost of wind solar and energy storage all continue to fall Demand-side technologies are becoming more relevant and the electrification of transportation and heat continue to be key areas of policy focus As these trends
Cost amp Performance Requirements for Flexible Advanced Nuclear Plants in Future US Power Markets 21
develop ISOs are experimenting with new market products as discussed in Appendix B to reward resource flexibility (which may change the capacity mix and dispatch order of a future grid) Modeling the operation of flexible advanced nuclear plants (with and without energy storage) in 2034 did not require making assumptions about construction time in PLEXOS Construction is assumed to have finished by 2034 so that hypothetical plants are ready for operation in that year Importantly the scenarios are not being run to determine the timing of capacity additions by one or more advanced nuclear plants The modeling largely focuses on the cost of the first advanced nuclear plant in a given ISO
522 Modeling ScenariosThe LucidCatalyst team modeled two main scenarios in 2034 a baseline lsquolow renewablesrsquo (low RE) scenario based on PLEXOSrsquo built-in resource mix for 2034 and a lsquohigh renewablesrsquo (high RE) scenario based on the lsquoLow natural gasLow RE costrsquo scwenario in NRELrsquos ReEDS model which has a significantly higher proportion of renewables These scenarios were selected to define the range of potential likely outcomes and allow for a comparative analysis of the impacts of flexible advanced nuclear plants on generation mix market prices and other modeling variablesThe 2034 lsquolow RErsquo grid mix was consistent with the mix produced by Energy Exemplar (developers of the PLEXOS software) It reflects a long-term capacity expansion outlook38 that reflects expected plant retirements plants under construction and plant announcements Additionally it reflects an optimized build out of generators considering Renewable Portfolio Standards (RPS) the impacts of other emissions-based regulations and expected resource cost curves39 The output assumes relatively higher penetrations of natural gas capacity with relatively modest additions to renewable energy capacity (ie just enough to meet existing RPS standards) For the higher renewables scenario the team adopted the 2034 NREL ReEDS lsquoLow natural gas Low RE costrsquo scenario40 NREL developed their ReEDS model to forecast power plant capacity changes generation mixes and related electricity market impacts from a range of policy and economic assumptions The assumptions underlying the lsquoLow natural gas Low RE costrsquo lead to high capacities and generation levels for natural gas plants and renewable energy facilities such as solar and wind LucidCatalyst calibrated the 2034 baseline scenario in PLEXOS by matching the power plant type and location to the ReEDS scenario Under the lsquolow RErsquo and lsquohigh RErsquo scenario umbrellas a total of nine cases were modeled (see Table 3 below) The lsquolow RErsquo cases include a 2034 baseline without any advanced nuclear plants and individual runs for one plant with and without co-located energy storage system (ESS) The idea is to estimate the maximum allowable CapEx for the first plant in the marketplace Importantly initial modeling showed little difference between the allowable CapEx for the first and fifth plant in smaller markets like ISO-NE In larger markets like PJM it takes dozens of advanced nuclear plants to affect energy prices to the point that the maximum allowable CapEx is significantly different The same cases are run for the lsquohigh RErsquo scenario with two additional cases that examine the impact of hypothetical CO2 pricing a large fleet of advanced nuclear plants operating in the same market and different OampM assumptions on allowable CapEx
Cost amp Performance Requirements for Flexible Advanced Nuclear Plants in Future US Power Markets 22
Table 3 Modeled Scenarios in PLEXOS
of Adv Nuclear Plants
ISO-NE PJM MISO CAISO
2034 Low RE
1 Low RE Baseline 0 n n n n
2 Low RE wout Thermal ES 1 n n n n
3 Low RE with Thermal ES 1 n n n n
2034 High RE
4 High RE Baseline 0 n n n n
5 High RE wout Thermal ES 1 n n n n
6 High RE with Thermal ES 1 n n n n
7 High RE Fleet Advanced Nuclear + ESS varies by ISO n n n n
2034 High RE w Carbon Price
8 High RE Baseline with CO2 Price ($25 $50 $75tonne) with and without ESS
1 n
2034 Alternative OampM Costs (Low amp High RE)
9 Higher OampM Costs Relative to Baseline Assumption (for both Low and High RE scenarios)
1 n n n n
Figure 7
Cost amp Performance Requirements for Flexible Advanced Nuclear Plants in Future US Power Markets 23
523 Modeling RegionsModeling four markets provides insights into the variety of contexts in which flexible advanced nuclear plants may be deployed It leads to different results for wholesale energy prices advanced nuclear plant operational expectations and financial calculations such as maximum allowable CapEx The following map and table show the geographic extents of the four competitive wholesale markets and total power plant capacity and power demand in 2018 and 2034
Figure 7 US Regional Power Markets
Source Federal Energy Regulatory Commission
Cost amp Performance Requirements for Flexible Advanced Nuclear Plants in Future US Power Markets 24
Table 4 Total Capacity and Power Demand in the Four Markets in 2018 and 2034
Market 2018
Total Capacity
2034 Low Renewables
2034 High Renewables1
Total Demand
2018 2034 Low or Higher RE2
ISO New England 35 GW 44 GW 47 GW 124 TWh 110 TWh
PJM 203 GW 239 GW 281 GW 806 TWh 869 TWh
MISO 175 GW 229 GW 243 GW 709 TWh 838 TWh
CAISO 74 GW 86 GW 88 GW 261 TWh 272 TWh
1 In the flexible advanced nuclear scenario for 2034 a fleet of flexible advanced nuclear plants with energy storage are added while maintaining capacity between the 2034 scenarios
2 The 2034 scenario and 2034 flexible advanced nuclear scenario have the same total demand but net imports or exports differ between them for markets modeled with neighboring areas leading to changes in generation between the two scenarios
PLEXOS models these ISOs as aggregations of their component service territories (also called load zones) ISO-NE has 13 service territories PJM has 20 MISO has 10 and CAISO has 9 Results tables for the flexible advanced nuclear scenarios shown below in Section 7 identify the service territories in which flexible nuclear plants were assumed to operateThe four electricity markets differ in several key respects regarding power plant capacity and generation mix Under 2034 baseline conditions ISO New England has high levels of natural gas and wind (mostly offshore) PJM stands out among the regions for its higher reliance on conventional nuclear plants and coal plants MISO has the most wind capacity and generation (onshore) among the regions and CAISO has the most solar (as well as significant amounts of wind)Monetary inputs and outputs for the PLEXOS modeling are expressed in constant 2019 dollars This analysis uses the PLEXOS modelrsquos built-in data for demand projections within each service territory It also uses the modelrsquos built-in transmission constraints between service territories parameters for the thousands of existing plants plants under construction and those that are expected to be built according to Energy Exemplarrsquos capacity expansion model The analysis uses a consistent natural gas price of $300MMBtu in constant dollars for 2018 and 2034 to avoid introducing differences in market prices or plant dispatch arising from underlying fuel price differences The PLEXOS modelrsquos built-in price projections for other fuel prices are maintained The analysis also maintains the built-in price projections for CO2 emission fees in the Northeast Regional Greenhouse Gas Initiative ($17tonne in 2034) and California ($22tonne in 2034) and there is no national CO2 emission fee because such a program has not been enacted by Congress and the Clean Power Plan is being reconsidered In accordance with the most recent federal energy legislation which phases out the Production Tax Credit (PTC) for renewables the modeling does not include these support mechanisms
0
Cost amp Performance Requirements for Flexible Advanced Nuclear Plants in Future US Power Markets 25
524 Modeling Inputs for Flexible Advanced Nuclear Plants with Energy StorageThe modeling software treats the nuclear plant and energy storage system as two facilities whereby the storage facility charge at a rate no greater than the amount of power being produced at the nuclear plant Setting this model constraint (ie defining the relationship between the two facilities) in PLEXOS is equivalent to envisioning the energy storage system at the same site as the nuclear power plant charging from the nuclear plantrsquos production at certain times and discharging at other times LucidCatalyst assumed the ESS was a thermal storage system which stores energy as heat and subsequently uses the heat to make steam which is sent through a dedicated steam turbine A high-level schematic of such a thermal storage system charging and discharging is provided in Figure 8 below
Figure 8 Charging and Discharging Configuration of Advanced Nuclear Plant with Thermal ESS
It is important to note that PLEXOS does not require CapEx estimates for the advanced nuclear plant energy storage system or any other addition to the electricity grid in order to model dispatch (such as the solar and wind additions for alignment with the NREL ReEDS scenario) It economically dispatches resources based on their marginal cost and revenue maximization opportunities For ESS configurations if future market prices are expected to be higher than current prices PLEXOS assumes the operator sends energy to storage (assuming the system is not yet full) The LucidCatalyst team entered the proceeding operating parameters for plants into PLEXOS and allowed it to determine the optimal mix of resources to meet demand based on their marginal costs as discussed above without reliance on CapEx estimates in the model
Cost amp Performance Requirements for Flexible Advanced Nuclear Plants in Future US Power Markets 26
53 Illustrative Advanced Nuclear Plant and Energy Storage System Assumptions
For modeling purposes LucidCatalyst developed an illustrative advanced nuclear plant that assumes a uniform design and does not reflect a specific reactor technology Physical specifications for this illustrative plant as well as the thermal ESS are listed in the tables below41 42
Table 5 Assumed Capacity and Operating Specifications for Illustrative Advanced Nuclear Plant
Advanced Nuclear Specifications
Assumption Rationale
Net Electric Capacity (MWe)
500 This reflects the typical size of what the flexible nuclear plant would likely replace a combined cycle gas plant (CCGT) MEITNER Design Teams are developing reactors across a broad range of scales from 02 MWe to 1200 MWe The smaller reactors are being designed for niche markets whereas this study looks at those looking to compete in power markets
Thermal Efficiency 40 This roughly represents the midpoint within the range of thermal efficiencies for advanced nuclear concepts1 and includes some losses from the energy storage system
Heat Rate (BtukWh) 8530 Btu content of a kWh is 3412 Btu2 This figure is divided by the thermal efficiency
Maximum Potential Capacity Factor
92 The advanced nuclear plants are assumed to take a four-week outage each year (8 of annual hours) for refueling and other maintenance Their capacity factors may be lower to avoid operating at a loss during low-price periods from the PLEXOS modeling
Outlet Temperature 600 ndash 700degC While there are a range of outlet temperatures for advanced reactors (480 ndash 1000degC)3 an outlet temperature of 600 ndash 700degC is assumed This is the same rated inlet temperature for most heat steam recovery generators (HSRG) used for CCGTsmdashallowing the application of HSRG cost assumptions for the energy storage system
Minimum Stable Factor
0 This implies that the plant can ramp all the way down to 0 operating capacity which is a significant departure from conventional nuclear plants that typically have a minimum stable factor of 70
Maximum Ramp Rate
5minute (25 MWmin)
EDFrsquos EPR and Westinghousersquos AP1000 both have max ramp rates of ~5minute4
1 WNA Advanced Nuclear Power Reactors 2019
2 US Energy Information Administration (2019) What is the efficiency of different types of power plants
3 Congressional Research Service (2019) Advanced Nuclear Reactors Technology Overview and Current Issues
4 OECD-NEA Technical and Economic Aspects of Load Following with Nuclear Power Plants 2011 p 8
Cost amp Performance Requirements for Flexible Advanced Nuclear Plants in Future US Power Markets 27
Table 6 Assumed Specifications for Energy Storage
Energy Storage Specifications
Assumption Rationale Used in CapEx Analysis (YN)
Rated Output (MW) 500 Advanced reactor capacities range significantly Y
Hours of Storage (MWh) 12 Assumes 12 hours of 500 MW output Y
Energy Storage Roundtrip Efficiency
90 Assumes a charge efficiency of 90 and discharge efficiency of 100 (implying a round-trip efficiency of 90)
Y
Outlet Temperature 600 ndash 700degC This assumes that the outlet temperature is sufficiently high to be used in a lsquooff-the-shelfrsquo steam turbine
N
Assumed Energy Storage Capacity
6000 MWh Assumes 12 hours of storage (rated at maximum output) Y
Maximum State of Charge 100 The energy storage system can charge to full capacity at any point (no governor)
Y
Minimum State of Charge 0 The energy storage system can discharge completely at any point (no governor)
Y
PLEXOS does not require CapEx inputs for the ESS just a marginal cost of operation The ESSrsquo marginal cost will differ depending on system type however because it does not use fuel and requires extremely small amount of OampM it is rarely if ever a marginal resource (and therefore never sets the energy clearing price) For these reasons LucidCatalyst assumed $0MWh for the ESSrsquo marginal cost Even if LucidCatalyst assumed a high-end marginal cost of say $5MWh the systemsrsquo dispatch would not change (nor would its revenues) as natural gas plants almost always set the clearing price and their marginal costs are 5 ndash 6x higher on average43 For the benefit of advanced reactor developers LucidCatalyst conducted a high-level CapEx review for three types of storage systems that would be complementary to advanced nuclear plants firebricks molten salt and flow batteries44 This review is included in Appendix E
54 Revenue Assumptions
LucidCatalyst assumed that advanced nuclear plant revenues were limited to energy sales and capacity payments While LucidCatalyst recognizes that increasing VRE deployment will likely stimulate an increase in demand for ancillary servicesmdashparticularly spinning reservesmdashLucidCatalyst expects that the increase in demand will be met by an increase in ancillary service market participation thus mitigating any significant increase in clearing prices Energy revenues are calculated by the plantrsquos output operating hours and clearing price LucidCatalyst assumes a range of potential capacity payments ($50 $75 $100kW per year) Importantly because the energy storage system is sized for 12 hours of rated output LucidCatalyst assumes that it also qualifies for a capacity payment45
Cost amp Performance Requirements for Flexible Advanced Nuclear Plants in Future US Power Markets 28
55 Fuel Costs and OampM Assumptions
551 Fuel CostsIn PLEXOS fuel costs for nuclear plants depend on two inputs (1) the price of uranium expressed in dollars per million British thermal units (MMBtu) and (2) the heat rate of each plant expressed in Btu per kWh which reflects the plantrsquos efficiency in converting fuel into electricity Preparing the fuel cost inputs for flexible advanced nuclear plants in PLEXOS therefore involves specifying these two inputsThe built-in dataset for PLEXOS contains a 2034 uranium price projection of $052MMBtu Analysts at Energy Exemplar (the company that licenses PLEXOS) develop price projections for uranium and other fuels to align with expectations from the US Energy Information Administration and other authoritative sources 46 The uranium price in PLEXOS represents the form of fuel currently used in US nuclear plants namely low-enriched uranium (LEU) with U-235 content between 3 to 5This modeling exercise aims to remain agnostic and neutral regarding reactor technologies and fuel sources for flexible advanced nuclear plants Some reactors would use LEU in a similar manner to current nuclear plants Other reactor technologies would encase the uranium in a tristructural-isotropic (TRISO) fuel pellet The use of high-assay low-enriched uranium (HALU) which rises above the typical enrichment for civil purposes toward levels for military applications is another option for advanced nuclear concepts The current lack of supply chains and mature markets for these novel fuels makes it difficult to forecast their prices into the modeling time horizon For these reasons LucidCatalyst assigned the built-in uranium price projection of $052MMBtu to flexible advanced nuclear plants for this analysisMost current nuclear plants in the United States have conversion efficiencies between 31 and 34 percent which equate to heat rates between 11000 and 10000 BtukWh47 As a result of engineering innovations and optimizations over time most of the recently constructed plants have higher efficiencies and lower heat rates than older plantsWhile this analysis refrains from specifying any particular reactor technology for the flexible advanced plants the assumed reactor outlet temperature stated above (600 to 700degC) allows for higher efficiency than conventional designs with lower outlet temperatures (around 325degC for pressurized water reactors and 290degC for boiling water reactors) Based on the target reactor temperature range historical improvements in efficiency and the strong incentive among developers to minimize fuel costs this analysis uses an efficiency of 40 and equivalent heat rate of 8530 BtukWh for flexible advanced nuclear plants in the PLEXOS modelingBy combining the uranium price projection and assumed heat rate flexible advanced nuclear plants have a fuel cost of $052MMBtu x 8530 BtukWh = $444kWh
552 Operating and Maintenance CostsConventional nuclear plants incur high operating and maintenance (OampM) costs because of the need for large site crews and extensive upkeep requirements for complex systems The typical headcount for a full-sized nuclear plant (around 1000 MW) is 800 people48 Many of the personnel positions relate to system monitoring accident preparedness security and maintenance activities The plants require frequent supplies such as makeup materials chemicals and gasesThe average OampM cost for US nuclear plants in 2018 was $1969MWh49 With an average capacity factor of 93 across the nuclear fleet this is equivalent to $160kW per year (combining fixed and variable OampM) Another data source for nuclear plants similar to the current fleet the US Energy Information Administration uses a fixed OampM cost of $103kW per year (equivalent to $1246MWh) and variable OampM cost of $237MWh in the latest version of their 2019 Annual Energy Outlook50 The variable OampM cost equates to $19kW after accounting for the average capacity factor leading to a combined fixed and variable OampM estimate of $122kW per year from this government source
Cost amp Performance Requirements for Flexible Advanced Nuclear Plants in Future US Power Markets 29
The flexible advanced nuclear plants in this modeling analysis are designed for more efficient operation than conventional nuclear plants They reflect the goal of utilizing concepts with superior safety and streamlined processes to reduce the need for complicated backup systems and large crews for monitoring accident preparedness etc Automation robotics and offsite controlresponse centers serving multiple units will also likely reduce staffing needs at advanced nuclear plants deployed in the 2030s As an example of staffing efficiencies at a new plant concept GE Hitachi anticipates a crew of 75 for its 300 MWe BWRX51
Staffing levels at natural gas and coal plants provide useful reference points for target operations at flexible advanced nuclear plants The US Department of Energy uses baseline crew counts of 5 people per shift (20 in total with 4 shifts) for a 630 MW natural gas combined-cycle plant and 14 people per shift (56 in total) for a 550 MW coal plant52 These staffing levels are highly relevant to the current context because the flexible advanced nuclear plants would have their turbine-generator system on a separate fluid loop from the reactor loop (a significant simplification in terms of safety and monitoring relative to conventional nuclear plants because no fluid in the turbine building would pass through the reactor)When Idaho National Laboratory assessed the potential costs of the Next Generation Nuclear Plant concept in 2010 the estimated crew headcount was 28 people for this High Temperature Gas Reactor with capacity of 274 MWe based on operational similarities with natural gas and coal plants53 The annual cost of staff insurance and taxes in this study is $11 million or $27kW-year After adjusting for currency inflation this value becomes $31kW-year in 2019 dollars (equivalent to $375MWh based on the capacity factor above)For this modeling analysis LucidCatalyst used the OampM estimate of $31kW-year from Idaho National Laboratoryrsquos 2010 study as the target level for flexible advanced nuclear plants in the 2030s The energy storage system is assumed to add no OampM costs to the plant because the potential medium such as firebrick or molten salt would simply charge and discharge energy by movements of air or other straightforward physical processes without the need for operators or maintenance activities The OampM parameter for the flexible advanced plants sets a clear goal for MEITNER Design Teams in their efforts to ensure the economic viability of their advanced nuclear concepts Subsequent sections of this report show the maximum allowable CapEx for flexible advanced nuclear plants based on this OampM parameter among other calculation inputs The maximum allowable CapEx would be lower (tighter constraint) in each market simulation if OampM costs were higher
Table 7 OampM and Fuel Assumptions
Category Value
OampM Cost $31kW-yr ($375 MWh)
Fuel Expenditures $444MWh ($37 kW-yr)
The OampM costs for the ESS system are assumed to be minimal54 and effectively immaterial as the ESS does not require fuel or significant operational expenses
Cost amp Performance Requirements for Flexible Advanced Nuclear Plants in Future US Power Markets 30
56 Modeling Result Categories
The following table summarizes the different PLEXOS model inputs and results
Table 8 PLEXOS Input and Result Categories
Inputs
Plant Capacities Plant capacities are inputs to PLEXOS (with adjustments by LucidCatalyst for baseline scenario calibration and flexible advanced nuclear additions) summed by plant type (natural gas solar wind etc) for regional total
Demand (load) Demand in each service territory is an input to PLEXOS summed across service territories for regional total
Results
Plant Operational Dispatch
PLEXOS determines the optimal combinations of plant production across the grid including output from the advanced nuclear plants to meet demand in each hour of the modeling period hourly dispatch is summed over year to calculate total generation by plant in 2034
Market Price PLEXOS calculates market price in each hour of the modeling period in each service territory based on the marginal costs of the marginal producer to meet demand market prices are averaged across service territories and hours in year to calculate average market price in 2034
CO2 Emissions PLEXOS uses plant operational dispatch fuel consumption per MWh and CO2 emission rate per unit of fuel consumption to calculate CO2 emissions from plant operation results are summed across plants and hours in year to calculate total CO2 emissions in each region in 2034
Advanced Nuclear Operational Dispatch
This is part of the broader plant dispatch results by hour described above
Energy Storage Charging and Discharging
PLEXOS optimizes the charging and discharging by hour for each energy storage system in the modeled region subject to the constraint limiting their hourly charging amount to the coupled nuclear plantrsquos production in the same hour
LucidCatalyst calculates maximum allowable CapEx by using operating profits which derives from a combination of PLEXOS results and supplemental assumptions (eg annual capacity payments)
Cost amp Performance Requirements for Flexible Advanced Nuclear Plants in Future US Power Markets 31
6 Illustrative Cash Flow AnalysisThis section presents a high-level cash flow analysis for an advanced nuclear plant with and without ESS This type of analysis is used to calculate maximum allowable CapEx and highlights key profitability drivers It also lays the foundation for understanding how different future market conditions can either threaten or enhance these drivers
As capital-intensive investments power plants recover CapEx over time from the difference between their annual revenue and operating expenditures In this section operating profits are calculated in this manner and presumed to be available for CapEx recovery Annual profits along with industry standard assumptions regarding payback period and interest rate are used to estimate maximum allowable CapEx expressed in $kWCalculating maximum allowable CapEx involves the following steps
1 Identify plant capacity and performance characteristics This involves specifying assumptions regarding plant capacity annual capacity factor and for the ESS round-trip efficiency (the total efficiency of one charge and discharge cycle)
2 Calculate wholesale energy revenue This step occurs in PLEXOS but simply includes a calculation whereby the clearing price is multiplied by the plantrsquos output (MW) in each hour This reflects scheduled down time for plant maintenance and other things (eg refueling) that might affect the plantrsquos annual capacity factor
3 Add capacity payments In addition to wholesale energy revenue LucidCatalyst assumes that the advanced nuclear plant receives capacity payments This step applies a range of potential capacity prices in $kW per year and shows the calculated payments
4 Calculate operating expenditures The three components of operating expenditures for the flexible advanced nuclear plantmdashfuel variable OampM and fixed OampMmdashare summed in this step
5 Calculate operating profit for CapEx recovery The difference between annual revenue (summing wholesale energy revenue with capacity payments) and annual operating expenditures (summing fuel fixed OampM and variable OampM) represents the operating profit per year for CapEx recovery The implied maximum allowable CapEx is derived from the annual operating profit which is based on additional financial parameters such as financing rates and the allowed length of time to pay back the lender
61 Estimating Annual Revenue for a 500 MW Illustrative Plant
Estimating annual revenue includes only two components energy revenue and capacity payments
611 Energy RevenueEnergy revenue is driven by market prices and how many hours each system is operating at its maximum output For the purposes of this illustrative cash flow analysis the average clearing price over the year is $22MWh which is within the range of modeled prices in 2034 For plants with ESS the
Cost amp Performance Requirements for Flexible Advanced Nuclear Plants in Future US Power Markets 32
amount of energy sent to storage will be different for each market due to pricing conditions However for the purposes of this analysis it is assumed that 25 of the nuclear plant output is to go toward charging the ESS system (which is similar to what bears out in PLEXOS) Because the ESS system is optimized to discharge when prices are at their highest the average clearing prices at which the ESS sells power is $25MWh (as opposed to $22MWh) Also because the nuclear plant charges the ESS when prices are at their lowest the average clearing price for the rest of the energy sent to the grid is slightly higher than the annual average For this analysis this is assumed to be $2250MWh The following table represents the energy revenue for each plant configuration
Table 9 Energy Revenue for Each Plant Configuration
Dispatch from Adv Nuclear Plant Total MWh Average Clearing Price (MWh)
Total Energy Revenue
Without ESS
500 MW Nuclear Plant Capacity 500 MW x
Capacity Factor 92 x
8760 hoursyear
403 million $22 $886 million
With ESS
500 MW Nuclear Plant Capacity 500 MW x
Capacity Factor 92 x
75 of output sent to grid 6570 hoursyear
302 million $2250 $68 million
500 MW
ESS System
Capacity 500 MW x
Capacity Factor 92 x
Roundtrip Efficiency 90 x
12-hours avg daily output 4380 hoursyear
907660 $25 $227 million
Total $907 million
The difference in energy revenue between the two configurations is largely driven by the delta between the two average clearing prices and roundtrip efficiency It is also important to note that revenues are sensitive to the input assumptions regarding capacity factor roundtrip efficiency and the systemrsquos power rating and discharge capacity (duration) Making significant modifications to these parameters can materially impact revenues Other thermal storage characteristics (ie thermal stability heat conductivity response time etc) are excluded from the example and assumed to have immaterial consequences on the systemsrsquo operation
Cost amp Performance Requirements for Flexible Advanced Nuclear Plants in Future US Power Markets 33
612 Capacity Revenue In addition to energy sales nuclear plants also typically receive some form of capacity payment Capacity programs encourage resources to be built andor made available during periods with high demand This analysis uses three hypothetical capacity prices $50 $75 or $100kW per year (the middle value of $75kW per year reflects the approximate average of capacity prices in ISO New England recently and a higher-end capacity price seen in recent PJM auctions) There is inherent uncertainty regarding future price levels as capacity programs continue to evolve however if energy prices continue to fall one could argue that stimulating new project investment in such an environment would warrant higher capacity pricesA $75kW-year capacity payment translates to $375 million for the plant without co-located energy storage Plants with 12 hours of energy storage can effectively supply 1000 MW of power through two 500 MW turbine-generators As mentioned in the previous section LucidCatalyst assumes that the ESS receives a full capacity payment as well This translates to an annual capacity payment of $75 million for the plant with storage
62 OampM Expenditures
The following table highlights the OampM expenses for the illustrative plant OampM for the ESS is assumed to be de minimis and because the advanced nuclear plant operates at the same output under both configurations the OampM expenditures are assumed to be the same under both configurations
Table 10 Advanced Nuclear Plant OampM Expenditures
Cost Category Calculation Estimated Value
OampM $31kW-yr ($375MWh) X 500 MW $15 million
Fuel $444MWh X 4073400 MWhs $18 million
Total $33 million
63 Maximum CapEx
Calculating maximum allowable CapEx involves calculating the total annual revenue (energy revenue and capacity payments) and subtracting the total annual operating expenditures (fixed and variable OampM) The result is the annual operating profit which along with a capital recovery period (eg 22 years) and cost of capital (reflected here as the interest rate) is used to calculated maximum allowable CapEx for a breakeven profit The table below estimates this for both plant configurations
Cost amp Performance Requirements for Flexible Advanced Nuclear Plants in Future US Power Markets 34
Table 11 Estimated Annual Plant Revenue Expenditures and Operating Profits for CapEx Recovery ndash Without ESS and With ESS
Illustrative Analysis Without ESS With ESS
Scenario Specifications
of Nuclear Plants 1 1
Reactor Capacity 500 MWe 500 MWe
Avg Annual Capacity Factor 92 92
of Annual Output to ESS System ndash 50
Revenue
Nuclear Plant ndash Avg Energy Price Received $22MWh $22MWh
Nuclear Plant ndash Direct Sales Revenue $90 M $45 M
Nuclear amp ESS ndash Avg Energy Price Received ndash $28MWh
ESS Net Generation Revenue ndash $51 M
Total System Energy Revenue $90 M $96 M
Total Revenue
Low (assumes $50kW-yr capacity payment) $115 M $146 M
Mid (assumes $75kW-yr capacity payment) $127 M $171 M
High (assumes $100kW-yr capacity payment) $140 M $196 M
Expenditures
Fuel Expenditures $18 M $18 M
Other Variable OampM Expenditures $0 M $0 M
Fixed OampM Expenditures $15 M $15 M
Total Operating Expenditures $33 M $33 M
Operating Profits for CapEx Recovery
Low Capacity Price Case $81 M $113 M
Mid Capacity Price Case $94 M $138 M
High Capacity Price Case $106 M $163 M
Maximum Plant CapEx for Profit Breakeven
Low Capacity Price Case $1798kW $2496kW
Mid Capacity Price Case $2075kW $3049kW
High Capacity Price Case $2351kW $3602kW
The following figure shows the ranges of maximum allowable CapEx with or without energy storage based on the parameter assumptions described above Pink cells indicate unfavorable combinations of low energy and capacity prices leading to tight limits on CapEx while green cells indicate favorable combinations of high prices leading to higher allowable CapEx The lower pane for the case without energy storage has tighter limits on CapEx than the upper pane with energy storage because of foregone capacity payments
With ES $50kW-yr $60kW-yr $70kW-yr $75kW-yr $80 kW-yr $90kW-yr $100kW-yr
$10MWh $1225 $1446 $1667 $1778 $1888 $2110 $2331
$15MWh $1653 $1874 $2095 $2206 $2317 $2538 $2759
$20MWh $2081 $2302 $2523 $2634 $2745 $2966 $3187
$22MWh $2252 $2473 $2695 $2805 $2916 $3137 $3358
$24MWh $2423 $2645 $2866 $2976 $3087 $3308 $3529
$26MWh $2595 $2816 $3037 $3148 $3258 $3479 $3701
$28MWh $2766 $2987 $3208 $3319 $3429 $3651 $3872
$30MWh $2937 $3158 $3379 $3490 $3601 $3822 $4043
$35MWh $3365 $3586 $3807 $3918 $4029 $4250 $4471
$40MWh $3793 $4014 $4235 $4346 $4457 $4678 $4899
Without ES $50 kW-yr $60kW-yr $70kW-yr $75kW-yr $80kW-yr $90kW-yr $100kW-yr
$10MWh $717 $827 $938 $993 $1049 $1159 $1270
$15MWh $1167 $1278 $1389 $1444 $1499 $1610 $1720
$20MWh $1618 $1729 $1839 $1894 $1950 $2060 $2171
$22MWh $1798 $1909 $2019 $2075 $2130 $2241 $2351
$24MWh $1978 $2089 $2200 $2255 $2310 $2421 $2531
$26MWh $2159 $2269 $2380 $2435 $2490 $2601 $2712
$28MWh $2339 $2449 $2560 $2615 $2671 $2781 $2892
$30MWh $2519 $2630 $2740 $2796 $2851 $2962 $3072
$35MWh $2970 $3080 $3191 $3246 $3301 $3412 $3523
$40MWh $3420 $3531 $3641 $3697 $3752 $3863 $3973
$1225 $1446 $1667 $1778 $1888 $2110 $2331
$1653 $1874 $2095 $2206 $2317 $2538 $2759
$2081 $2302 $2523 $2634 $2745 $2966 $3187
$2252 $2473 $2695 $2805 $2916 $3137 $3358
$2423 $2645 $2866 $2976 $3087 $3308 $3529
$2595 $2816 $3037 $3148 $3258 $3479 $3701
$2766 $2987 $3208 $3319 $3429 $3651 $3872
$2937 $3158 $3379 $3490 $3601 $3822 $4043
$3365 $3586 $3807 $3918 $4029 $4250 $4471
$3793 $4014 $4235 $4346 $4457 $4678 $4899
$717 $827 $938 $993 $1049 $1159 $1270
$1167 $1278 $1389 $1444 $1499 $1610 $1720
$1618 $1729 $1839 $1894 $1950 $2060 $2171
$1798 $1909 $2019 $2075 $2130 $2241 $2351
$1978 $2089 $2200 $2255 $2310 $2421 $2531
$2159 $2269 $2380 $2435 $2490 $2601 $2712
$2339 $2449 $2560 $2615 $2671 $2781 $2892
$2519 $2630 $2740 $2796 $2851 $2962 $3072
$2970 $3080 $3191 $3246 $3301 $3412 $3523
$3420 $3531 $3641 $3697 $3752 $3863 $3973
$1225 $1446 $1667 $1778 $1888 $2110 $2331
$1653 $1874 $2095 $2206 $2317 $2538 $2759
$2081 $2302 $2523 $2634 $2745 $2966 $3187
$2252 $2473 $2695 $2805 $2916 $3137 $3358
$2423 $2645 $2866 $2976 $3087 $3308 $3529
$2595 $2816 $3037 $3148 $3258 $3479 $3701
$2766 $2987 $3208 $3319 $3429 $3651 $3872
$2937 $3158 $3379 $3490 $3601 $3822 $4043
$3365 $3586 $3807 $3918 $4029 $4250 $4471
$3793 $4014 $4235 $4346 $4457 $4678 $4899
$717 $827 $938 $993 $1049 $1159 $1270
$1167 $1278 $1389 $1444 $1499 $1610 $1720
$1618 $1729 $1839 $1894 $1950 $2060 $2171
$1798 $1909 $2019 $2075 $2130 $2241 $2351
$1978 $2089 $2200 $2255 $2310 $2421 $2531
$2159 $2269 $2380 $2435 $2490 $2601 $2712
$2339 $2449 $2560 $2615 $2671 $2781 $2892
$2519 $2630 $2740 $2796 $2851 $2962 $3072
$2970 $3080 $3191 $3246 $3301 $3412 $3523
$3420 $3531 $3641 $3697 $3752 $3863 $3973
Cost amp Performance Requirements for Flexible Advanced Nuclear Plants in Future US Power Markets 35
Figure 9 Ranges of Maximum Allowable CapEx ($kW) ndash With ESS and Without ESS
Cost amp Performance Requirements for Flexible Advanced Nuclear Plants in Future US Power Markets 36
7 PLEXOS Modeling Results for 2034This section presents results from modeling flexible advanced nuclear plants with and without energy storage in the four identified markets (ISO New England PJM MISO and CAISO) Each subsection presents the baseline 2034 resource mix and then the CapEx for the first plant entering the market (with and without storage)
71 ISO New England
The table below highlights the total plant capacity by resource as well as the annual generation in all modeled scenarios in ISO-NE Most of the capacity and generation in this market comes from natural gas Most of the wind capacity in this market is offshore
Table 12 Resource Capacity and Generation in ISO-NE for the Modeled Scenarios
Installed Capacity amp Generation
Total Coal Nat Gas
Oil Existing Nuclear
Hydro Solar Wind BioOther
Net Imports Exports1
2018 Benchmark
GW 35 1 15 6 3 4 1 1 4 ndash
TWh 124 1 67 0 25 8 1 3 10 -10
2034 Low RE Future
GW 44 1 19 6 3 4 4 3 5 ndash
TWh 110 0 43 0 25 8 7 8 10 -9
2034 High RE Future
GW 47 0 16 4 3 4 9 7 5 ndash
TWh 110 0 28 0 25 8 18 21 10 -2
1 Imports are negative exports are positive
A separate table below summarizes PLEXOS results for annual average market prices revenue and operating expenditures for ISO-NE in the various scenarios It also presents the maximum allowable CapEx which for all four ISO modeling results reflects the financial assumptions of a 22-year CapEx recovery period55 and a 50-50 split of debt and equity financing with a weighted average cost of capital (WACC) of 756
Cost amp Performance Requirements for Flexible Advanced Nuclear Plants in Future US Power Markets 37
Table 13 PLEXOS Results for ISO-NE
Low RE Future wout ESS
with ESS
High RE Future wout ESS
with ESS
Scenario Specifications
of Nuclear Plants 1 1 1 1
Reactor Capacity 500 MWe 500 MWe 500 MWe 500 MWe
Representative Load Zone Mass Central Mass Central Mass Central Mass Central
Annual Avg Energy Market Price $2756MWh $2757MWh $2367MWh $2390MWh
Avg Annual Capacity Factor 92 92 85 86
of Annual Output to ESS System ndash 24 ndash 31
Revenue
Nuclear Plant ndash Avg Energy Price Received $2773MWh $2771MWh $2580MWh $2572MWh
Nuclear Plant ndash Direct Sales Revenue $112 M $84 M $96 M $66 M
Nuclear amp ESS ndash Avg Energy Price Received ndash $2976MWh ndash $2970MWh
ESS Net Generation Revenue ndash $33 M ndash $42 M
Total System Energy Revenue $112 M $117 M $96 M $108 M
Total Revenue
Low (assumes $50kW-yr capacity payment) $137 M $167 M $121 M $158 M
Mid (assumes $75kW-yr capacity payment) $149 M $192 M $133 M $183 M
High (assumes $100kW-yr capacity payment) $162 M $217 M $146 M $208 M
Expenditures
Fuel Expenditures $18 M $18 M $16 M $17 M
Other Variable OampM Expenditures $0 M $0 M $0 M $0 M
Fixed OampM Expenditures $15 M $15 M $15 M $15 M
Total Operating Expenditures $33 M $33 M $32 M $32 M
Operating Profits for CapEx Recovery
Low Capacity Price Case $103 M $134 M $89 M $126 M
Mid Capacity Price Case $116 M $159 M $101 M $151 M
High Capacity Price Case $128 M $184 M $114 M $176 M
Maximum Plant CapEx for Profit Breakeven
Low Capacity Price Case $2289kW $2962kW $1965kW $2788kW
Mid Capacity Price Case $2566kW $3515kW $2242kW $3341kW
High Capacity Price Case $2843kW $4068kW $2519kW $3894kW
Cost amp Performance Requirements for Flexible Advanced Nuclear Plants in Future US Power Markets 38
72 PJM
The tables below highlight the total plant capacity by resource (including the annual generation in all modeled scenarios) as well as a summary of the PLEXOS results for PJM This market has the most coal capacity and generation of the four markets modeled in this analysis The High RE Future has several times more solar and wind capacity and generation than the Low RE Future This market is modeled without neighboring zones (no imports or exports) because of its large geographic breadth
Table 14 Resource Capacity and Generation in PJM for the Modeled Scenarios
Installed Capacity amp Generation
Total Coal Nat Gas
Oil Existing Nuclear
Hydro Solar Wind BioOther
Net Imports Exports1
2018 Benchmark
GW 203 57 75 6 32 9 1 7 15 ndash
TWh 806 364 140 0 247 5 2 20 28 ndash
2034 Low RE Future
GW 239 55 111 6 25 9 7 11 15 ndash
TWh 869 253 351 0 186 5 15 32 27 ndash
2034 High RE Future
GW 281 3 111 6 23 9 64 50 15 ndash
TWh 869 22 361 0 170 5 129 154 27 ndash
1 PJM is modeled without neighboring zones (no imports or exports)
Cost amp Performance Requirements for Flexible Advanced Nuclear Plants in Future US Power Markets 39
Table 15 PLEXOS Results for PJM
Low RE Future wout ESS
with ESS
High RE Future wout ESS
with ESS
Scenario Specifications
of Nuclear Plants 1 1 1 1
Reactor Capacity 500 MWe 500 MWe 500 MWe 500 MWe
Representative Load Zone PEPCO PEPCO PEPCO PEPCO
Annual Avg Energy Market Price $2839MWh $2847MWh $2646MWh $2644MWh
Avg Annual Capacity Factor 92 92 91 92
of Annual Output to ESS System ndash 20 ndash 20
Revenue
Nuclear Plant ndash Avg Energy Price Received $2834MWh $2844MWh $2669MWh $2639MWh
Nuclear Plant ndash Direct Sales Revenue $115 M $92 M $107 M $72 M
Nuclear amp ESS ndash Avg Energy Price Received ndash $2981MWh ndash $3076MWh
ESS Net Generation Revenue ndash $26 M ndash $48 M
Total System Energy Revenue $115 M $118 M $107 M $121 M
Total Revenue
Low (assumes $50kW-yr capacity payment) $140 M $168 M $132 M $171 M
Mid (assumes $75kW-yr capacity payment) $152 M $193 M $144 M $196 M
High (assumes $100kW-yr capacity payment) $165 M $218 M $157 M $221 M
Expenditures
Fuel Expenditures $18 M $18 M $18 M $18 M
Other Variable OampM Expenditures $0 M $0 M $0 M $0 M
Fixed OampM Expenditures $15 M $15 M $15 M $15 M
Total Operating Expenditures $33 M $33 M $33 M $33 M
Operating Profits for CapEx Recovery
Low Capacity Price Case $107 M $135 M $99 M $137 M
Mid Capacity Price Case $119 M $160 M $111 M $162 M
High Capacity Price Case $132 M $185 M $124 M $187 M
Maximum Plant CapEx for Profit Breakeven
Low Capacity Price Case $2358kW $2988kW $2186kW $3038kW
Mid Capacity Price Case $2634kW $3541kW $2462kW $3591kW
High Capacity Price Case $2911 kW $4095kW $2739kW $4144kW
Cost amp Performance Requirements for Flexible Advanced Nuclear Plants in Future US Power Markets 40
73 MISO
The tables below highlight the total plant capacity by resource (including the annual generation in all modeled scenarios) as well as a summary of the PLEXOS results for MISO The market has high wind penetration especially in the High RE Future
Table 16 Resource Capacity and Generation in MISO for the Modeled Scenarios
Installed Capacity amp Generation
Total Coal Nat Gas
Oil Existing Nuclear
Hydro Solar Wind BioOther
Net Imports Exports1
2018 Benchmark
GW 175 61 71 4 13 5 1 18 3 ndash
TWh 709 372 149 0 97 9 2 56 25 0
2034 Low RE Future
GW 229 59 117 3 8 4 9 25 3 ndash
TWh 838 124 392 0 65 9 19 83 25 -122
2034 High RE Future
GW 243 4 99 3 8 4 51 70 3 ndash
TWh 838 16 295 0 65 9 109 253 24 -67
1 Imports are negative exports are positive
Cost amp Performance Requirements for Flexible Advanced Nuclear Plants in Future US Power Markets 41
Table 17 PLEXOS Results for MISO
Low RE Future wout ESS
with ESS
High RE Future wout ESS
with ESS
Scenario Specifications
of Nuclear Plants 1 1 1 1
Reactor Capacity 500 MWe 500 MWe 500 MWe 500 MWe
Representative Load Zone S Illinois S Illinois S Illinois S Illinois
Annual Avg Energy Market Price $2717MWh $2717MWh $2416MWh $2416MWh
Avg Annual Capacity Factor 92 92 92 92
of Annual Output to ESS System ndash 20 ndash 26
Revenue
Nuclear Plant ndash Avg Energy Price Received $2721MWh $2721MWh $2452MWh $2447MWh
Nuclear Plant ndash Direct Sales Revenue $110 M $88 M $98 M $73 M
Nuclear amp ESS ndash Avg Energy Price Received ndash $2844MWh ndash $2628MWh
ESS Net Generation Revenue ndash $24 M ndash $30 M
Total System Energy Revenue $110 M $112 M $98 M $103 M
Total Revenue
Low (assumes $50kW-yr capacity payment) $135 M $162 M $123 M $153 M
Mid (assumes $75kW-yr capacity payment) $147 M $187 M $136 M $178 M
High (assumes $100kW-yr capacity payment) $160 M $212 M $148 M $203 M
Expenditures
Fuel expenditures $18 M $18 M $18 M $18 M
Other Variable OampM Expenditures $0 M $0 M $0 M $0 M
Fixed OampM Expenditures $15 M $15 M $15 M $15 M
Total Operating Expenditures $33 M $33 M $33 M $33 M
Operating Profits for CapEx Recovery
Low Capacity Price Case $101 M $129 M $90 M $120 M
Mid Capacity Price Case $114 M $154 M $103 M $145 M
High Capacity Price Case $126 M $179 M $115 M $170 M
Maximum plant CapEx for Profit Breakeven
Low Capacity Price Case $2244kW $2857kW $2000kW $2654kW
Mid Capacity Price Case $2521kW $3410kW $2276kW $3207kW
High Capacity Price Case $2797kW $3963kW $2553kW $3760kW
Cost amp Performance Requirements for Flexible Advanced Nuclear Plants in Future US Power Markets 42
74 CAISO
The tables below highlight the total plant capacity by resource (including the annual generation in all modeled scenarios) as well as a summary of the PLEXOS results for CAISO This market has high solar and wind penetration especially in the High RE Future
Table 18 Resource Capacity and Generation in CAISO for the Modeled Scenarios
Installed Capacity amp Generation
Total Coal Nat Gas
Oil Existing Nuclear
Hydro Solar Wind BioOther
Net Imports Exports1
2018 Benchmark
GW 74 0 39 0 2 14 9 6 3 ndash
TWh 261 0 116 0 16 37 24 15 10 -42
2034 Low RE Future
GW 86 0 35 0 0 14 23 10 3 ndash
TWh 272 0 61 0 0 37 65 28 10 -70
2034 High RE Future
GW 88 0 30 0 0 11 34 10 3 ndash
TWh 272 0 49 0 0 28 97 28 10 -61
1 Imports are negative exports are positive
Table 19 PLEXOS results for CAISO
Low RE Future wout ESS
with ESS
High RE Future wout ESS
with ESS
Scenario Specifications
of Nuclear Plants 1 1 1 1
Reactor Capacity 500 MWe 500 MWe 500 MWe 500 MWe
Representative Load Zone San Diego San Diego San Diego San Diego
Annual Avg Energy Market Price $2579MWh $2595MWh $2273MWh $2266MWh
Avg Annual Capacity Factor 79 92 67 91
of Annual Output to ESS System ndash 33 ndash 34
Revenue
Nuclear Plant ndash Avg Energy Price Received $3021MWh $2632MWh $3150MWh $2326MWh
Cost amp Performance Requirements for Flexible Advanced Nuclear Plants in Future US Power Markets 43
Low RE Future wout ESS
with ESS
High RE Future wout ESS
with ESS
Nuclear Plant ndash Direct Sales Revenue $104 M $71 M $92 M $61 M
Nuclear amp ESS ndash Avg Energy Price Received ndash $3507MWh ndash $3448MWh
ESS Net Generation Revenue ndash $65 M ndash $71 M
Total System Energy Revenue $104 M $137 M $92 M $132 M
Total Revenue
Low (assumes $50kW-yr capacity payment) $129 M $187 M $117 M $182 M
Mid (assumes $75kW-yr capacity payment) $142 M $212 M $130 M $207 M
High (assumes $100kW-yr capacity payment) $154 M $237 M $142 M $232 M
Expenditures
Fuel Expenditures $15 M $18 M $13 M $18 M
Other Variable OampM Expenditures $0 M $0 M $0 M $0 M
Fixed OampM Expenditures $15 M $15 M $15 M $15 M
Total Operating Expenditures $31 M $33 M $28 M $33 M
Operating Profits for CapEx Recovery
Low Capacity Price Case $99 M $154 M $89 M $149 M
Mid Capacity Price Case $111 M $179 M $101 M $174 M
High Capacity Price Case $124 M $204 M $114 M $199 M
Maximum plant CapEx for Profit Breakeven
Low Capacity Price Case $2187kW $3397kW $1968kW $3306kW
Mid Capacity Price Case $2464kW $3950kW $2244kW $3859kW
High Capacity Price Case $2740kW $4503kW $2521kW $4412kW
75 Summary and Modeling Result Implications
The PLEXOS and financial modeling results in a range of maximum allowable CapEx As shown in the preceding tables this range is largely driven by capacity payments the addition of ESS and the average energy price which is driven by the assumption of continued low natural gas prices and the two different renewables scenarios in 2034 These highlight several implications for advanced reactor developers
n The addition of energy storage may improve a projectrsquos economics but this is dependent on several factors The ESS captures higher average energy prices as it is optimized to charge during the lowest priced hours and sells during the highest priced hours However the amount of CapEx that can be budgeted for the ESS depends on the Low RE vs High RE scenario and importantly the available capacity payment For example the CapEx threshold for ESS in MISO in the Low RE scenario and $25kW-year capacity payment is only $613kW At present there are no commercially available ESS options at this price Conversely assuming the High RE scenario in CAISO and a $100kW-year capacity payment the allowable CapEx for the ESS is $1891kW LucidCatalystrsquos high-level cost analysis for thermal ESS in Appendix E suggests that this is possible using todayrsquos technologies and costs especially for reactor designs with higher outlet temperatures It is highly likely that these will be
Figure 18
0
2
4
6
8
10
12
14
16
18
20
1 2 3 4 5 6 7 8 9 10 11 12
Perc
enta
ge o
f Dis
char
ge E
vent
s
Length of Discharge (Hours)
Cost amp Performance Requirements for Flexible Advanced Nuclear Plants in Future US Power Markets 44
significantly cheaper by 2034 Also as shown in Appendix D projections for electrochemical storage systems (ie batteries) are expected to be well below that cost (even for a 12-hour system) by 2034 Therefore developers should be aware of the potential for storage to impact a projectrsquos bottom line and will want to consider it based on specific market conditions
n It is important to note that capacity payments are a major source of assumed revenue For plants without ESS each additional $50kW-year adds $277kW to a plantrsquos maximum allowable CapEx For plants with ESS this amount is doubled to $553kW One a related note while LucidCatalyst assumed a 12-hour ESS on average the system typically discharged for only 4 hours exceeding an 8-hour discharge only 12 of the time (see Figure 18) Developers should therefore track ifhow performance requirements for capacity payments change over time and weigh the savings of a smaller ESS with the probability of paying non-performance penalties
n Advanced reactor developers should note that higher RE penetrations reduce average energy prices (and thus allowable CapEx) If the assumed VRE penetration is too conservative in these scenarios the effective maximum allowable CapEx will likely be lower Higher VRE penetration will trigger more aggressive ramping and potentially higher prices during critical peak demand periods While this may benefit highly flexible and dispatchable resources like advanced nuclear plants this will also lead to lower capacity factors and a likely decline in average energy prices To the extent these factors affect revenues maximum allowable CapEx may be lower
Figure 10 Frequency of Different Discharge Durations
Cost amp Performance Requirements for Flexible Advanced Nuclear Plants in Future US Power Markets 45
8 Additional Modeling Analyses The Results section above highlights the 2034 CapEx requirements under a highly specific set of assumptions Several different scenarios may play out and it is worth exploring other future outcomes to understand their impact on CapEx requirements
This section examines three additional modeling analyses 1 Effect of CO2 Prices 2 Market Penetration Potential 3 Impact on Allowable CapEx from Alternative Fixed OampM Assumption
1 Effect of CO2 Prices There are six bills in the 116th US Congress that establish a CO2 price with escalators that increase the price over time57 Further seventeen states have introduced some form of carbon pricing legislation including the California and the ten states that makes up the Regional Greenhouse Gas Initiative (RGGI) which already have a variable CO2 price58 One could reasonably argue that there is a non-zero probability of a carbon pricing scheme going into effect by 2034 While current proposals differ in carbon price and rate of escalation the most conservative proposals set a CO2 price of around $50tonne by 2034 This modeling analysis examines how a $50tonne CO2 price with side cases of $25 and $75tonne would affect revenue and the maximum allowable CapEx for advanced nuclear plants
2 Market Penetration Potential Assuming the operational characteristics of a flexible advanced nuclear plant are similar to a CCGT it is worth estimating the extent to which these resources can be deployed without significantly reducing energy prices (due to their low-price energy bids) Advanced reactor developers may want to simultaneously develop more than one project in the same ISO and it is valuable to understand how many plants each market can accommodate and how that might affect the overall cost of electricity delivery
3 Impact on Allowable CapEx from Alternative Fixed OampM Assumption This study considers a relatively low fixed OampM assumption of $31kW-year which is ~70 lower than the fixed OampM assumed for todayrsquos conventional nuclear fleet (~$103kW-year) While LucidCatalyst recognizes that this a realistic goal for advanced reactor developers to target it is also worth exploring how higher fixed OampM might impact maximum allowable CapEx This analysis considers a fixed OampM of $61kW-year a halving of todayrsquos fixed OampM cost estimate
81 Effect of CO2 Prices
To measure the impact of a CO2 price on allowable CapEx LucidCatalyst ran three additional scenarios for PJM $25 $50 and $75tonne CO2 prices do not cause fossil plants to retire in the PLEXOS simulations (ie capacity levels are the same between these simulations and the High Renewables Future described above) because this analysis uses a consistent methodology of considering plant capacity as a deterministic modeling input for each simulation Based on their CO2 emission rates (approximately 1 tonne per MWh for coal plants and 04 tonnes for combined-cycle natural gas plants) applying the CO2 price of $50tonne inflates fossil generatorsrsquo marginal costs by approximately $50MWh
Cost amp Performance Requirements for Flexible Advanced Nuclear Plants in Future US Power Markets 46
for coal plants and $20MWh for combined-cycle natural gas plants which significantly raises market prices and impacts the allowable CapEx for the first flexible advanced nuclear plant that wishes to enter the market The following tables show the PLEXOS modeling resultsmdashwithout and with energy storage
Table 20 CO2 Price Scenarios for PJM without Energy Storage
No CO2 Price $25tonne $50tonne $75tonne
Scenario Specifications
of Nuclear Plants 1 1 1 1
Reactor Capacity 500 MWe 500 MWe 500 MWe 500 MWe
Representative Load Zone PEPCO PEPCO PEPCO PEPCO
Annual Avg Energy Market Price $2646MWh $3706MWh $4757MWh $5788MWh
Nuclear amp ESS Annual Capacity Factor 91 92 92 92
Total System Energy Revenue $107 M $150 M $192 M $234 M
Maximum Plant CapEx for Profit Breakeven
Low Capacity Price Case $2186kW $3132kW $4074kW $4999kW
Mid Capacity Price Case $2462kW $3409kW $4351kW $5276kW
High Capacity Price Case $2739kW $3685kW $4627kW $5552 kW
Table 21 CO2 Price Scenarios for PJM with Energy Storage
No CO2 Price $25tonne $50tonne $75tonne
Scenario Specifications
of Nuclear Plants 1 1 1 1
Reactor Capacity 500 MWe 500 MWe 500 MWe 500 MWe
Representative Load Zone PEPCO (DC) PEPCO PEPCO PEPCO
Annual Avg Energy Market Price $2644MWh $3703MWh $4754MWh $5786MWh
Nuclear amp ESS Annual Capacity Factor 92 92 92 92
Cost amp Performance Requirements for Flexible Advanced Nuclear Plants in Future US Power Markets 47
No CO2 Price $25tonne $50tonne $75tonne
Total System Energy Revenue $121 M $165 M $211 M $257 M
Maximum Plant CapEx for Profit Breakeven
Low Capacity Price Case $3038kW $4031kW $5043kW $6056kW
Mid Capacity Price Case $3591kW $4584kW $5596kW $6609kW
High Capacity Price Case $4144kW $513kW $614kW $7162kW
82 Market Penetration Potential
Advanced nuclear plants provide the same baseload and responsive load-following characteristics as the existing fossil fleet yet they have much lower operating costs By 2034 a sizeable percentage of natural gas plants will be getting close to their retirement Absent fundamental changes to energy markets if advanced nuclear plants ever supply the majority of firm baseload power as the primary marginal resource (setting the energy price) energy prices will begin to rapidly decline due to advanced nuclearrsquos low price energy bids This would significantly impact the economics of most grid resourcesmdashincluding advanced nuclear plants It is therefore worth exploring the market penetration limits of advanced nuclear plants before they begin to materially impact energy pricesmdashand consequently their own CapEx requirements To highlight potential market penetration without significant impact on CapEx requirements LucidCatalyst modeled the 2034 High RE resource mix and supplied the majority of firm baseload power with advanced nuclear plants and co-located ESS Other power plant capacity levels remained unaffected Table 22 below highlights the addition of 168 GWs of flexible advanced nuclear reactors relative to the baseline scenario
Table 22 2034 High RE Baseline and Fleet Deployment of Advanced Nuclear Plants
Installed Capacity amp Generation
Total Coal Nat Gas
Oil Existing Nuclear
Flexible Adv Nuclear
Hydro Solar Wind BioOther
Net Imports Exports1
ISO-NE
GW 46 0 5 4 3 10 4 9 7 5 ndash
TWh 111 0 9 0 24 39 8 18 21 9 +17
PJM
GW 284 3 41 6 23 72 9 64 50 15 ndash
TWh 872 19 96 1 165 276 5 129 154 27 ndash
Cost amp Performance Requirements for Flexible Advanced Nuclear Plants in Future US Power Markets 48
Installed Capacity amp Generation
Total Coal Nat Gas
Oil Existing Nuclear
Flexible Adv Nuclear
Hydro Solar Wind BioOther
Net Imports Exports1
MISO
GW 245 4 35 3 8 66 4 51 70 3 ndash
TWh 840 12 94 0 65 247 9 109 253 24 -26
CAISO
GW 91 0 13 0 0 20 11 34 10 3 ndash
TWh 272 0 3 0 0 75 27 97 28 9 -33
1 Imports are negative exports are positive
In this lsquofleet deployment scenariorsquo annual average market prices drop in all four ISOs due to nuclear plants operating lsquoon the marginrsquo for more hours as shown in Table 23 below
Table 23 Annual Average Market Prices for ISO-NE PJM MISO and CAISO
Average Annual Energy Price
ISO NE
High RE Future (Without Flexible Adv Nuc) $2632MWh
Fleet Deployment of Flex Adv Nuc $2264MWh
PJM
High RE Future (Without Flexible Adv Nuc) $2703MWh
Fleet Deployment of Flex Adv Nuc $2267MWh
MISO
High RE Future (Without Flexible Adv Nuc) $2613MWh
Fleet Deployment of Flex Adv Nuc $2470MWh
CAISO
High RE Future (Without Flexible Adv Nuc) $3806MWh
Fleet Deployment of Flex Adv Nuc $2961MWh
020000400006000080000
100000120000140000160000180000
July 16 July 17 July 18 July 19 July 20 July 21 July 22
MW
Oil Natural Gas
Coal Adv Nuc + ESS
Solar Wind
Hydro BioOther
Existing Nuclear
Cost amp Performance Requirements for Flexible Advanced Nuclear Plants in Future US Power Markets 49
The flexible performance of the advanced nuclear fleet becomes apparent in reviewing hourly modeling results for a representative summer week in 2034 (July 16 ndash 22) In summer cooling demand is typically high and peaks in the afternoons between 2 to 3 pm Because of high cooling demand during weekdays peaks are higher during weekdays than weekends as shown in the following figure
Figure 11 Dispatch Profile for PJM with Majority of Firm Power Supplied by Advanced Nuclear Plants
As expected having more advanced nuclear plants reduces annual energy clearing prices and thus reduces the maximum allowable CapEx by ~$500kW less than the CapEx requirements for the first plant A striking finding of this analysis is how advanced nuclear plants with ESS can actually lower the cost of serving load across the ISO Figure 12 below shows a subset of the total costs of serving annual loadmdashisolating just energy costs and capacity payments to natural gas and advanced nuclear plants Assuming all other costs (ancillary services transmission costs uplift payments imports etc) are held constant the amount spent on capacity for both natural gas and advanced nuclear falls slightly and energy costs drop by over $3 billion
Figure 20
$0
$5
$10
$15
$20
$25
$30
$35
2018 High RE Future(No Adv Nuc Plants)
High RE Future(w Adv Nuc w ESS)
Bill
ions
($U
SD)
Adv Nuc + ESS Capacity Payments
Nat Gas Capacity Payments
Energy
Cost amp Performance Requirements for Flexible Advanced Nuclear Plants in Future US Power Markets 50
Figure 12 Total Cost of Serving Annual Load Energy and Select Capacity Payments
83 Impact on Allowable CapEx from Alternative Fixed OampM Assumption
As discussed above in Section 552 the base case calculations use $31kW-year (equivalent to $375MWh) for the combined fixed and variable OampM costs of flexible advanced nuclear plants The base case value is a significant reduction from current OampM costs at nuclear plants and serves as an ambitious target to guide nuclear designers in their pursuit of market viabilityAs a side case the following table presents maximum allowable CapEx results assuming a less ambitious target for OampM costs In particular this side case posits a 50 reduction from the combined OampM cost of $122kW-year used by the Energy Information Administration in the latest version of the Annual Energy Outlook This alternative assumption of $61kW-year ($750MWh) for combined OampM costs is double the base case assumption cited aboveThe higher OampM costs in the alternative case lead to lower maximum allowable CapEx for flexible advanced nuclear plants with or without energy storage plants as shown in the following table Relative to the base case results all results of maximum allowable CapEx have tightened by $337kW because of higher OampM costs
Cost amp Performance Requirements for Flexible Advanced Nuclear Plants in Future US Power Markets 51
Table 24 Maximum Allowable CapEx by ISO and Scenario ($kW) with Higher OampM Cost Input
Low RE wout ESS
with ESS
High RE wout ESS
with ESS
ISO-NE
Low Capacity Price Case ($50kW-yr) $1952 $2625 $1628 $2450
Mid Capacity Price Case ($75kW-yr) $2229 $3178 $1905 $3003
High Capacity Price Case ($100kW-yr) $2505 $3731 $2181 $3557
Difference from Base Case ($kW) -$337
PJM
Low Capacity Price Case ($50kW-yr) $2021 $2651 $1848 $2701
Mid Capacity Price Case ($75kW-yr) $2297 $3204 $2125 $3254
High Capacity Price Case ($100kW-yr) $2574 $3757 $2401 $3807
Difference from Base Case ($kW) -$337
MISO
Low Capacity Price Case ($50kW-yr) $1907 $2520 $1663 $2316
Mid Capacity Price Case ($75kW-yr) $2184 $3073 $1939 $2869
High Capacity Price Case ($100kW-yr) $2460 $3626 $2216 $3422
Difference from Base Case ($kW) -$337
CAISO
Low Capacity Price Case ($50kW-yr) $1850 $3060 $1630 $2968
Mid Capacity Price Case ($75kW-yr) $2127 $3613 $1907 $3521
High Capacity Price Case ($100kW-yr) $2403 $4166 $2183 $4075
Difference from Base Case ($kW) -$337
Cost amp Performance Requirements for Flexible Advanced Nuclear Plants in Future US Power Markets 52
High-Level CapEx Estimation Exercise for lsquoNuclear-Specificrsquo Costs Several advanced reactor developers are still working on their nuclear reactor designs and the other components that make up the lsquonuclear-relatedrsquo portion of the plant This typically includes the lsquonuclear islandrsquo consisting of the steam supply system (ie nuclear reactor reactor pressure vessel coolants pumps piping controls etc) the containment and auxiliary building and the fuel handling area Other lsquonuclear-relatedrsquo costs include reactor licensing nuclear permitting fuel commissioning and testing related land acquisition offsite design and civil works These lsquonuclear-relatedrsquo costs represent the majority of overall plant costs Designers will likely find it easier to reduce costs by limiting the size and scope of the nuclear heat source design and its relationship to the rest of the plant (ie lsquoconventional islandrsquo) For example if the design allows safety events to propagate into the steam turbine the steam turbine must be designed to handle such events and therefore will be relatively bespoke and more expensive If the nuclear heat source can be effectively isolated more of the plant can be designed with commercially available lsquooff-the-shelfrsquo components which are less expensive Using government cost studies for coal and natural gas power projects LucidCatalyst derived a high-level indicative estimate for all components downstream of the nuclear heat source Having already estimated the maximum allowable CapEx for an entire nuclear plant the goal was to indicatively estimate the remaining CapEx available for the nuclear-related costs Appendix F highlights the costs included in this calculation which should be treated as indicative not exhaustive Added together non-nuclear costs are roughly $1043kW for a plant without energy storage and $1453kW with energy storage Developers can subtract these figures from the allowable CapEx thresholds for the various ISOs
Cost amp Performance Requirements for Flexible Advanced Nuclear Plants in Future US Power Markets 53
9 ConclusionsProvided that advanced nuclear developers can design their reactors to be sufficiently low-cost they can complement production from higher VRE penetration and lower the overall cost of serving load mdash all without power delivery disruptions or sharp market price swings Providing cost-effective flexible capacity these plants offer an emissions-free load following option that can perform similar to CCGTs
This study examined the maximum allowable CapEx for flexible advanced nuclear plants in 2034 in low- and high-renewable market environments Using PLEXOS production cost modeling software LucidCatalyst estimated the maximum allowable CapEx for flexible advanced nuclear plants in two configurationsmdashwith and without energy storagemdashin four deregulated power markets ISO-NE PJM MISO and CAISO The modeling and post-modeling financial analysis revealed that the maximum allowable CapEx for the first plant entering the market is driven by energy and capacity payment revenues The average maximum allowable CapEx across all scenarios is $3234kW This reflects a minimum of $1965kW (High RE in ISO-NE no ESS and $50kW-yr capacity payment) and $4503kW (Low RE in CAISO with ESS and $100kW-yr capacity payment)
Table 25 Summary of Maximum Allowable CapEx ($kW) by ISO Configuration and RE Scenario
Low RE wout ESS
with ESS
High RE wout ESS
with ESS
ISO-NE
Low Capacity Price Case ($50kW-yr) $2289 $2962 $1965 $2788
Mid Capacity Price Case ($75kW-yr) $2566 $3515 $2242 $3341
High Capacity Price Case ($100kW-yr) $2843 $4068 $2519 $3894
PJM
Low Capacity Price Case ($50kW-yr) $2358 $2988 $2186 $3038
Mid Capacity Price Case ($75kW-yr) $2634 $3541 $2462 $3591
High Capacity Price Case ($100kW-yr) $2911 $4095 $2739 $4144
MISO
Low Capacity Price Case ($50kW-yr) $2244 $2857 $2000 $2654
Mid Capacity Price Case ($75kW-yr) $2521 $3410 $2276 $3207
High Capacity Price Case ($100kW-yr) $2797 $3963 $2553 $3760
CAISO
Low Capacity Price Case ($50kW-yr) $2187 $3397 $1968 $3306
Mid Capacity Price Case ($75kW-yr) $2464 $3950 $2244 $3859
High Capacity Price Case ($100kW-yr) $2740 $4503 $2521 $4412
Cost amp Performance Requirements for Flexible Advanced Nuclear Plants in Future US Power Markets 54
Advanced reactor developers should be aware that while there are emerging market mechanisms to reward resources for enhancing grid flexibility and resiliency (and the operating reserve market is likely to expand) the primary revenue sources are energy sales and capacity payments Average annual energy prices are also expected to fall due to increasing quantities of zero-marginal cost VRE Absent a CO2 price or premiums paid for emissions-free generation and capacity advanced nuclear developers will need to design their plants to an average cost of below $2989kW Advanced reactor designers should also recognize that most of the emerging market mechanisms compensating for flexible dispatchable output are too early-stage to gauge their significance in the mid-2030s While the grid will undoubtedly demand large amounts of flexible resources by that time it is currently unclear how much energy will be transacted through these new products The decision to add a thermal energy storage system to a plant design must be informed by the specific market context in which a plant is sited Across the four ISOs modeled co-locating a storage system makes economic sense on average for less than $1126kW Such a system will enable the reactor to run at its rated capacity for more hours and provide the opportunity to sell power from the ESS when prices are at their highest Also without an ESS (or an alternative revenue source such as hydrogen production process heat for industry etc) the plantrsquos capacity factor suffers significantly in high VRE zones For example in the 2034 high RE scenario the capacity factor for nuclear plants in southern California is 67 Given that these plants are being designed to operate for a minimum of 40 years it is worth considering what market conditions (particularly VRE penetration) will exist beyond 2034 A CO2 price or capacity payment premium for emissions-free generation resources could significantly change the maximum allowable CapEx As shown (and specific to the PEPCO load zone in PJM) a $25 $50 or $75tonne CO2 price significantly improves the economics for advanced nuclear plants raising the maximum allowable CapEx by $993kW $2005kW or $3018kW respectively Similarly capacity markets could increase payments to stimulate deployment of emissions-free generation which could significantly improve project economics Advanced nuclear developers should understand the advantages and disadvantages of developing projects in regulated markets Depending on how deregulated markets evolve it may be favorable to focus on regulated markets for initial development efforts Regulated utilities can utilize all the benefits of highly rampable and dispatchable output without requiring complex and relatively slow-moving market reforms to reveal the value of certain grid services For these reasons regulated markets have been in practical terms the first markets for Gen III and III+ nuclear plants (as well as other innovative power projects like the carbon capture and sequestration project at Kemper)The PLEXOS modeling revealed that deploying advanced nuclear power at scale can actually reduce the overall cost of serving electrical load Nearly all national and international energy modeling efforts either do not include advanced nuclear in their projections or assume an insignificant level of capacity Because these plants can operate as baseload resources and load follow like a combined-cycle gas turbine they can supply a large fraction of the firm power without raising the overall cost of electricity This conclusion should motivate policymakers utilities climate advocates and other stakeholders to continue supporting advanced nuclear commercialization efforts In addition to tracking how markets evolve advanced nuclear developers should also track the evolution of competitive technologies that will play an increasing role in grid flexibility and emissions-free generation Technologies to enhance grid flexibility primarily include energy storage Distributed Energy Resources demand-side solutions like flexible loads (eg EVs electric hot water heaters smart thermostats etc) and demand response programs These are effective in lsquotime shiftingrsquo demand and smoothing power flows across the grid However they are less effective in serving the expected increase in overall electricity demand resulting from the electrification of transportation and other sectors Supplying emissions-free energy for multiple days or even weeks (when VREs are not generating) currently cannot be met without extremely low-cost bulk energy storage (which is not yet an economical scalable option) or thermal generation with carbon capture or the use of clean synthetic fuels (eg hydrogen ammonia ethanol DME etc) in converted natural gas plants
Cost amp Performance Requirements for Flexible Advanced Nuclear Plants in Future US Power Markets 55
An important precondition for advanced nuclear plants to play a meaningful role in future resources mixes is their ability to be built at sufficiently low cost While the CapEx thresholds highlighted in this report are relatively low in comparison to conventional nuclear new-build plants in North America and Europe they are well within the range of those reported by third-party cost studies59 and advanced nuclear developers themselves This range is also well within the costs being achieved in countries with continuous new-build nuclear programs60 Designers should integrate these cost requirements into their plant designs and consider whether adding thermal storage makes sense in their target markets
Appendices
Figure 21
$000
$1000
$2000
$3000
$4000
$5000
$6000
$7000
2009 2010 2011 2012 2013 2014 2015 2016 2017 2018
$M
Wh
Day-Ahead
Capacity ($MWh Est)
Ancillary Services
Cost amp Performance Requirements for Flexible Advanced Nuclear Plants in Future US Power Markets 57
A Appendix ndash Historical Revenues by Market Product in Select ISOsIt is useful to examine todayrsquos wholesale market prices to understand the relative revenue potential for flexible nuclear plants By the mid-2030s market rules and prices are bound to be different however revenue breakdown by product and price trends provide a useful benchmark for looking into the future
ISO-NE (New England)
Despite the recent increase in day-ahead clearing prices in 2017 and 2018 average clearing prices for energy have been in decline for the past 10 years61 Overall demand for electricity ISO-NE has been in general decline year since 2013 and demand in 2017 hit an 18-year low62 Figure 13 presents ten years (2009 ndash 2018) of revenue potential for Day-Ahead energy63 capacity (estimated in $MWh) and ancillary services Energy prices were an average of $4598MWh across the ten-year period the highest of the four ISOs analyzed64
Figure 13 Average Annual Clearing Price by Market Product in ISO-NE ($MWh)
Figure 22
$000
$1000
$2000
$3000
$4000
$5000
$6000
2009 2010 2011 2012 2013 2014 2015 2016 2017 2018
$M
Wh
Load-Weighted Energy
Capacity
Ancillary Services
Cost amp Performance Requirements for Flexible Advanced Nuclear Plants in Future US Power Markets 58
PJM (Pennsylvania-Jersey-Maryland)
PJM energy prices have been declining for the past decade on average (see Figure 14) Twelve thousand MW of coal and three nuclear plants having filed for deactivation may close by 2021 (Davis-Besse Perry and Three Mile Island) Nonetheless projected excess capacity (based on the interconnection queue) suggests that ignoring local reliability issues these retirements will not affect energy prices or reliability Most revenues come from energy (~78) with about 20 coming from capacity revenues Depending on capacity requirements in various PJM zones capacity payments could be higher65 Ancillary services as is the case in each power market represent a small fraction of total potential revenue
Figure 14 Average Price by Component of Wholesale Power Price in PJM ($MWh)
MISO (Midcontinent)
MISO has the lowest average clearing price for energy of the four ISOs under consideration ($3134MWh from 2009 ndash 2018) This is partially driven by already depreciated coal and nuclear plants as well as 17GW of wind which makes up 8 of MISOrsquos generating portfolio66 Unlike ISO-NE and PJM MISO does not have a capacity market Instead it has a lsquoResource Adequacyrsquo construct which places the burden on Load Serving Entities (LSEs) and Independent Power Producers (IPPs) to procure a sufficient resource capacity to provide energy during times of forecast (and unexpected) scarcity Typically this means either qualifying capacity through LSE-owned resources or procuring it through bilateral arrangements with other resource owners MISO has a 17 lsquoreserve marginrsquo which means there is 17 surplus generation capacity on average at any given time There is a voluntary capacity auction where LSEs and IPPs can procure capacity that they have not already procured Therefore the capacity payments listed in Figure 15 only reflect the clearing prices of the voluntary capacity auctions As with the other ISOs MISOrsquos ancillary service market is relatively small and would likely represent an insignificant revenue stream for advanced nuclear projects
Figure 23
$000
$500
$1000
$1500
$2000
$2500
$3000
$3500
$4000
$4500
2009 2010 2011 2012 2013 2014 2015 2016 2017 2018
$M
Wh
Load-Weighted Energy
Capacity (RA Construct)
Ancillary Services
Cost amp Performance Requirements for Flexible Advanced Nuclear Plants in Future US Power Markets 59
Figure 15 Average Price by Component of Wholesale Power Price in MISO ($MWh)
CAISO (California)
CAISO is the only ISO that experienced a (mild) increase in energy clearing prices from 2009 ndash 2018 as shown in Figure 16 Day-Ahead clearing prices averaged $3886 over this period with prices reaching $4606 in 2018 CAISO has more non-hydro renewables than any other ISO as a percentage of total energy generation (26 in 2018)67 and installed capacity (23331 MW)68 When Governor Jerry Brown signed SB 100 into law in September 2018 California adopted a 100 RPS by 2045 (50 renewables by 2026 60 renewables by 2030 and 100 CO2-free energy by 2045) The increase in solar and wind will likely depress the average clearing price for energy (certainly during daylight hours) but will undoubted drive up the value for flexible dispatchable resources This will be especially true for the morning and evening ramp With demand expected to grow between 10 and 15 annually until 203069 this will be a revenue opportunity for flexible dispatchable generation Californiarsquos decision not to renew the operating licenses for the Diablo Canyon units 1 and 2 which are set to expire in 2024 and 2025 respectively suggests that the state is perhaps not a priority market for nuclear However because the CAISO energy imbalance market has expanded well beyond the borders of Californiamdashto as far as Wyoming Idaho and Utahmdashthere may be opportunities to supply CAISO while not being physically located within the state
Figure 24
$000
$1000
$2000
$3000
$4000
$5000
$6000
2009 2010 2011 2012 2013 2014 2015 2016 2017 2018
$M
Wh
DA Energy Costs
Ancillary Services (and RUC)
Resource Adequacy Costs
Cost amp Performance Requirements for Flexible Advanced Nuclear Plants in Future US Power Markets 60
Figure 16 Average Price by Component of Wholesale Power Price in CAISO ($MWh)
Cost amp Performance Requirements for Flexible Advanced Nuclear Plants in Future US Power Markets 61
B Appendix ndash New Market Mechanisms that Capture the Value of Resource FlexibilityMost of the new revenue streams aimed at improving grid stability by rewarding resource flexibility and dispatchability are too new and undeveloped to determine whether they will be meaningful revenues So far none provide the compensation necessary to stimulate investment in new capacity However it would serve advanced reactor developers to understand these products and track them going forward
Ramping Products
CAISO Flexible Ramping Product CAISO introduced its Flexible Ramping Product (FRP) in November of 2016 The FRP was designed to provide a margin of sufficient ramping capacitymdashavailable in real-timemdashto address uncertainty arising from load variability or intermittent renewable generation70 This helps maintain power balance during deviations in real-time net load71 reflecting potential renewable forecasting errors and other uncertainties related to ramping needs The FRP includes two products in the 5- and 15-minute real time markets (1) Flexible Ramp Up and (2) Flexible Ramp Down FRP compensation has been extremely small dropping from $25M in 2017 to just $7M in 201872 Flexible Ramp Up was needed for 6 of the time in 2018 whereas Flexible Ramp Down was needed just 1 of the time To participate in FRP resources submit bids to provide the forecasted demand plus the ability to ramp upward or downward to meet a predetermined uncertainty band They receive revenue from selling energy plus an uncertainty award (for either ramping up or down)Currently the ISO is working to incorporate flexible ramping capability in the Day-Ahead markets and procure FRP in smaller regions such that transmission constraints are not a material issue to getting energy on (and off) the grid73
Fast ramping advanced nuclear plants could certainly compete in this market However they will encounter competition from several other resources including battery storage systems which have exceptional charge and discharge rates As the amount of energy transacted through this market increases so too will the number of participating resources which will likely mitigate revenue potential
MISO Ramp Capability ProductMISO implemented their voluntary Ramp Capability Product in the spring of 2016 It consists of a lsquoup ramp capabilityrsquo and lsquodown ramp capabilityrsquo product As with CAISO MISO is interested in increasing ramping capacity to better respond to uncertainties in forecasted net load74 especially during short-term scarcity events or other deviations from the expected dispatch horizon Ramping resources are required
Cost amp Performance Requirements for Flexible Advanced Nuclear Plants in Future US Power Markets 62
to ramp up or down to meet specified uncertainty bands within ten minutes75 The Ramp Capability Product is co-optimized with the energy and ancillary service markets and allows resources that can ramp faster to displace slower resources Slower resources are compensated for their forgone profit to provide such services and faster resources get greater dispatch opportunities The program is completely voluntary and any dispatchable resource is eligible to participate To date there have been few hours where Ramp Capacity Product clearing prices are above zero (from 3 ndash 9 on average)76 and the Day-Ahead and Real-Time hourly price for ramp up capability averaged $058MWh and $021MWh respectively from May 2016 to June 201977 Both Day-Ahead and Real-Time ramp down capability products have been $000MWh since the beginning Given the low clearing prices which have incidentally fallen significantly since January 2019 and the dearth of hours during which the product clears at non-zero prices the MISO Ramp Capability project does not present a significant revenue stream for advanced nuclear plants
ISO-NE and PJMISO-NE and PJM do not currently have ramping products
Other Compensation Mechanisms for Fast Available and Flexible Generators
Fast Start GenerationEach of the ISOs have market pricing rules to reward resources that can more rapidly respond to dispatch instructions Enabling a faster response is typically more costly for a resource and these rules allow them to run more often and receive compensation for their start up and fixed operating costs In some ISOs rules also compensate lsquoslowerrsquo resources that have been moved out of the merit order to make room for lsquofast-startrsquo78 resources It is unlikely that advanced nuclear plants will be the marginal generator very often therefore significant revenue generation from this rule change should not be expected
Pay-for-PerformanceISO-NE and PJM have a lsquopay-for-performancersquo (PFP) model for capacity resources This increases financial incentives for resources able to quickly provide additional capacity or operating reserves during periods of generation scarcity
ISO-NEISO-NErsquos Forward Capacity Market Pay-for-Performance (FCM PFP) Project began in June 2018 Its purpose is to increase financial incentives for resources that can quickly provide additional capacity or operating reserves during periods of generation scarcity During Capacity Scarcity Conditions (CSC)79 resources can be eligible for additional revenue payments based on actual capacity provided (above what was already required and contracted for in the marketplace) PFP prices are cleared on a 5-minute basis until the CSC is resolved Capacity prices are determined on how deficient the grid is in meeting its capacity and operating reserves requirements The amount of capacity provided is multiplied by a predetermined lsquoperformance payment ratersquo80 which dictates the final payment amount In short if a resource can quickly provide additional grid capacity (either by ramping up or decreasing its real-time energy output to provide additional capacity or operating reserves) it is eligible for significant above-market payments From January 1 2015 to August 15 2019 there was only one CSC event declared (on September 3 2018) and it lasted just under 3 hours81
Cost amp Performance Requirements for Flexible Advanced Nuclear Plants in Future US Power Markets 63
PJMStarting in 2016 PJM began providing lsquoCapacity Performancersquo incentive payments to resources participating in its Reliability Pricing Model (RPM) capacity market The purpose was to reward resources for being available and responsive during stressed conditionsmdashwhen PJM determines they are needed to meet power system emergenciesmdashand issuing penalties when resources do not perform This helps ensure that the capacity offered into the RPM reflects a resourcersquos actual performance risk (and ensures that capacity from units less likely to perform during stressed conditions are offered at higher prices to reflect their outage or non-performing risk)82 The number of megawatts cleared in the RPM as Capacity Performance is set to increase each year until the delivery year 2020 ndash 21 when all PJM resources are required to meet Capacity Performance requirements This is to incentivize investment in resource reliability (eg system upgrades and fuel availability) and apply penalties to non-performance83 Resources that exceed performance requirements during peak system conditions collect funds from resources that underperformCapacity Performance increases overall capacity costs in the market however these are ideally offset by relatively lower pricing during extreme weather events and other conditions that stress the grid Under Capacity Performance resources are required to deliver their committed capacity during emergency events called Performance Assessment Intervals (PAI) System-side Performance Assessment Hours (PAH) have not been called since 2014 and zone-wide PAIs have not been called since 201584 Therefore it is unlikely to be a material source of revenue for advanced reactors To be considered a Capacity Resource with lsquounlimited energy capabilityrsquo a nuclear plant must sustain continuous operation for at least 10 hours Capability verification testing performed by PJM requires nuclear plants to sustain their rated output for 2 hours
Table 26 Relevance of Emerging Market Products that Reward Resource Flexibility on Advanced Nuclear Reactor Developers
Resource Flexibility Product
Description Relevance to Adv Reactor Developers
Rationale
CAISO
Flexible Ramping Product (FRP)
This product provides a margin of sufficient ramping capacitymdashavailable in real-timemdashto address uncertainty arising from load variability or intermittent renewable generation85
Very Low FRP compensation has been extremely small dropping from $25M in 2017 to just $7M in 201886
The corresponding cost to CAISO for FRP ranged from $000 ndash $003MWh from Q1 2018 to Q2 201987
Flexible Ramp Up was needed 6 of the time in 2018 and Flexible Ramp Down was needed just 1 of the time
Cost amp Performance Requirements for Flexible Advanced Nuclear Plants in Future US Power Markets 64
Resource Flexibility Product
Description Relevance to Adv Reactor Developers
Rationale
MISO
Ramp Capability Product (RCP)
The RCP is co-optimized with the energy and ancillary service markets and allows resources that can ramp faster to displace slower resources Ramping resources are required to ramp up or down to meet specified uncertainty bands within ten minutes88
Very Low To date there have been few hours where Ramp Capacity Product clearing prices are above zero (from 3 ndash 9 on average)89 and the day-ahead and real-time hourly price for ramp up capability averaged $058MWh and $021MWh respectively from May 2016 to June 201990
Both day-ahead and real-time ramp down capability products have been $000MWh since the beginning
ISO-NE
Pay for Performance (PFP)
The purpose of PFP is to increase financial incentives for resources that can quickly provide additional capacity or operating reserves during periods of generation scarcity In short if a resource can quickly provide additional grid capacity (either by ramping up or decreasing energy output to provide additional capacity or operating reserves) it is eligible for significant above-market payments
Very Low From January 1 2015 to August 15 2019 there was only one occasion (on September 3 2018) when a scarcity event was declared and it lasted just under 3 hours91
PJM
Capacity Performance (CP)
The purpose of CP is to reward resources for being available and responsive during stressed conditionsmdashwhen PJM determines they are needed to meet power system emergenciesmdashalong with penalties when resources do not perform
Very Low Under Capacity Performance resources are required to deliver their committed capacity during emergency events called Performance Assessment Intervals (PAI) System-side PAIs have not been called since 201492 and very rarely have zonal PAIs been called
Cost amp Performance Requirements for Flexible Advanced Nuclear Plants in Future US Power Markets 65
C Appendix ndash Desirable Performance Attributes and Market Participation Requirements In general resource lsquoflexibilityrsquo includes the ability to start up and shut down over short periods of time or rapidly change generation output to support system reliability The primary value of lsquoflexiblersquo advanced reactors is their ability to load follow when renewables go offline Currently this is supplied by natural gas plants (both CCGTs and CTs) To be competitive with natural gas (which may have integrated affordable carbon capture technologies by the mid-2030s) flexible advanced nuclear plants will need to have certain performance characteristics
This appendix highlights the desired performance attributes for advanced nuclear plants which follows the attributes of best-in-class CCGTs For reference generic market participation requirements for energy capacity and ancillary services markets are also included
Competing with Best-In-Class Gas Turbines
Advanced nuclear plants with energy storage will primarily compete with gas turbines in a combined-cycle configuration New lsquobest-in-classrsquo CCGTs have extremely fast start times and can achieve maximum capacity in 30 minutes from a lsquohot startrsquo (ie generator is running and electrically synchronized to the grid)93 This is important for quickly meeting the morning or evening ramp or quickly backfilling for renewables As shown in Table 27 ramp rates are also extremely high For example the GE 7HA02 can ramp up to 60 MWminute It can also ramp down to a minimum operating capacity of 33 (which can be reduced to 15 in a two-plant configuration)94 Under idealized operating conditions (where ambient temperature pressure and humidity affects efficiency) best-in-class CCGTs are extremely flexible and valuable resources
Cost amp Performance Requirements for Flexible Advanced Nuclear Plants in Future US Power Markets 66
Table 27 Selected Performance Criteria for lsquoBest-in-Classrsquo CCGTs
Siemens SGT-9000HL Series GE 7HA-Class 7HA02 MHPS M501J Series
Capacity (MW 1-unit Configuration) 595 573 614
Net Efficiency gt63 gt63 gt64
Ramp Rate (MWmin) 85 60 42
Turndown ndash Minimum Load () 40 33 50
Startup Time to Full Load lt30 minutes lt30 minutes 30 minutes
Simple cycle configuration Based on 8000HL series
Sources
Siemens SGT-9000HL | 405 MW | 60 Hz GE Power 9HA POWER PLANTS Fact Sheet MHPS M501J Series GE Power gas power systems offerings I 2019
Another competitive feature of best-in-class CCGTs is minimal outage risk Some of the major turbine manufacturers have claimed based on field operation hours that fleet uptime or availability (reflecting unscheduled maintenance) consistently exceeds 9995 Further manufacturers continue to push efficiency and believe combined-cycle net efficiency could reach 65 by the early 2020s96 This will continue to improve operating costs Grid operators also benefit from a CCGTrsquos rotational inertia During changes in demand the inertia of the spinning turbines opposes frequency changes and thereby gives system operators more time to correct the frequency deviation (by adjusting generation or load) and maintain a 60 Hz grid frequency While there is currently no market for inertia there are frequency response products97 and the service is undoubtedly valued by vertically integrated utilitiesAdvanced reactor developers should consider how their reactor and energy storage system should perform to meet these performance characteristics Notably without storage a reactor that can achieve these operating characteristics would be extremely valuable for grid stability however economics would be an issue As previously stated without significantly inflated capacity payments other out-of-market payments unprecedentedly high reserve prices or other revenue streams the economics are challenging
Cost amp Performance Requirements for Flexible Advanced Nuclear Plants in Future US Power Markets 67
General Market Participation Requirements
Performance Requirements for Energy RevenuesGenerators participating in wholesale electricity markets must meet several well-established technical and operating performance requirements During project development and through operations (until retirement) the ISOrsquos interconnection commissioning and on-going testing procedures and protocols ensure that resources can perform as stated once ready for commercial operations For grid operators to effectively and efficiently carry out their responsibilities resources need to operate as expected At a high level the ISO makes exhaustive assurances that all eligible energy resources are dependable market participants It is essential that resources be capable of receiving and responding to electronic dispatch instructions and communicate when they are (or will be) downmdashso system operators can balance the grid accordingly Therefore both wireless and lsquohardlinersquo communications equipment are setup between the ISO and energy resource The ISO also maintains a power system model that has all the lsquovital statisticsrsquo for each resource Knowing what each resource is capable ofmdashplus the operating condition of each resource in any given momentmdashallows the operators to optimize economic dispatch
Communication ProtocolsThere is a suite of digital and analog channels through which generators and demand resources communicate with the ISO (and vice versa) These include a mix of telemetry solutions which include wireless technologies (eg cellular systems unlicensed ration frequencies etc) and supervisory control and data acquisition (SCADA) technology It also includes hard-wired fiber optic ethernet cables and establishing dedicated lsquohard-linersquo telephone cables between the plant and ISO control room All required communications equipment is tested prior to any generator being available for dispatchVerbal and electronic communications are performed by a registered entity (which may be the energy resource itself or a third party) responsible for scheduling compliance dispatching administrative functions (information requirements market monitoring etc) and authorized to submit market and technical information
Information Provided to the ISOThere are several different types of generator-specific information that is submitted to the ISO and ultimately incorporated into its power system model This includes static information related to voltage and reactive control the unitrsquos one-line diagram transmission line information and associated equipment and certain technical data for physical components It also includes different types of dynamic information Using ISO-NE as an example such information includes
n Desired Dispatch Point (DDP) is the control signal expressed in megawatts transmitted to direct the output consumption or demand reduction level of each grid-tied resource dispatched by the ISO in accordance with the assetrsquos Offer Data
n Actual Generation is the actual generation being produced by the generating asset n Economic Minimum Limit is the lowest sustainable output level as specified by physical design characteristics environmental regulations or licensing limits
n Economic Maximum Limit is the maximum available output in MW of a Generator Asset that a Market Participant offers to supply in the Day-Ahead Energy Market or Real-Time Energy Market as reflected in the Generator Assetrsquos Offer Data This represents the highest MW output a Market Participant has offered for a Generator Asset for economic dispatch
n Emergency Minimum Limit means the minimum output in MWs that a Generator Asset can deliver for a limited period of time without exceeding specified limits of equipment stability and operating permits
Cost amp Performance Requirements for Flexible Advanced Nuclear Plants in Future US Power Markets 68
n Response Rate is the response rate in MWMinute at which a Market Participant is willing to change its output or consumption
n Regulation High Limit (applicable to Frequency Regulation offers) is an offer parameter that establishes the upper bound for AGC SetPoints and is used in the determination of a Resourcersquos Regulation Capacity
n Regulation Low Limit (applicable to Frequency Regulation offers) is an offer parameter that establishes the lower bound for AGC SetPoints and is used in the determination of a Resourcersquos Regulation Capacity
n Unit Control Mode98 describes the current operational state of an energy resource n Heartbeat describes the active digital connection between computers at the ISO and grid resource and confirms that related energy Data Acquisition and Concentration device are properly scanning and exchanging data as required
These types of information are indicative of the information that all ISOs need in order to properly dispatch a resource Beyond the minimum operating requirements which are highlighted in the table below99 the desired operating requirements to realize energy revenue simply requires that there be consistency between the plantrsquos scheduled output and actual output
Table 28 Minimum Operating Requirements for Large Generators
Category Description of Technical Requirement
Reactive Power Generators must maintain a composite power delivery at continuous rated power output at the Point of Interconnection with dynamic reactive capability over the power factor range of 095 leading to 095 lagging
Voltage Control All generators must keep and maintain an automatic voltage regulator (AVR) in service (and keep it in automatic operation)
Governor Control Generators over 10 MW must provide and maintain a functioning governor which includes the hardware or software that provides autonomous frequency-responsive power control It must have a speed droop set between 4 ndash 5 a frequency response deadband of no greater than 59964 ndash 60036 Hz and a real power response that does not override the governorrsquos response
Power Quality A generatorrsquos facility shall not cause excessive voltage flicker nor introduce excessive distortion to the sinusoidal voltage or current waves
Source ISO-NE Appendix 6 Large Generator Interconnection Agreement
Cost amp Performance Requirements for Flexible Advanced Nuclear Plants in Future US Power Markets 69
The requirements above are sourced from ISO-NE and while PJM MISO and CAISO have similar requirements they also have additional participation requirements that are important to note
n PJM To be considered a resource with lsquounlimited energy capabilityrsquo a resource must sustain continuous operation ldquocommensurate with PJM load requirements specified as 10 hoursrdquo100 If there is insufficient historical operating data to pull from PJM will verify the plants capability by testing whether it can sustain output for 2 hours101
n MISO To participate as a Resource Adequacy resource in MISO an advanced nuclear plant will need to sustain its maximum output for a minimum of four hours across the expected peak hour for each operating day102
n CAISO To qualify for Resource Adequacy like MISO advanced nuclear plants must meet a lsquominimum availability thresholdrsquo whereby they are capable of generating for four continuous hours To participate in lsquoflexiblersquo Resource Adequacy advanced nuclear plants would have to place bids in the Day-Ahead market from one of the following options103
ndash Base Ramping 5am ndash 10pm (all days) ndash Peak Ramping 2 ndash 7pm or 3 ndash 8pm (all days) ndash Super-Peak Ramping 2 ndash 7pm or 3 ndash 8pm (non-holiday weekdays)
Performance Requirements for Capacity Resources
ISO-NEISO-NE capacity resources are compensated based on their Capacity Supply Obligation (CSO) measured in MW and associated payment rate for a given time period (Capacity Commitment Period)104 During shortage events (or lsquoCapacity Scarcity Conditionsrsquo) capacity resources with a CSO are rewarded for being available and operating until the scarcity event has passed During these events the lsquoPay-for-Performancersquo mechanism is active and both capacity and non-capacity resources are rewarded for their availability and ability to meet system needs Capacity resources are required to demonstrate their ability to respond to ISO Dispatch Instructions and to maintain performance at a specified output level for a specified duration For new nuclear and combined-cycle capacity resources these occur within five business days of commercial operations and projects must operate for 4 continuous hours at the capacity level bid in the Forward Capacity Auction105 Existing resources are audited annually as a requirement of fulfilling capacity supply obligations (CSO) during summer and winter Capacity Commitment Periods and nuclear and combined-cycle plants are required to run for 2 hours continuously106
PJMIn PJM resources with capacity contracts are obligated to be available during periods of grid stress when PJM declares that emergency actions are necessary These periods are called lsquoPerformance Assessment Intervalsrsquo (PAIs) and have historically occurred during critical peak periods in the winter The Capacity Performance construct was initiated after the 2014 polar vortex where 22 of generation capacity was out of service which nearly tripled the number of forced outages across the region In fact eight of the ten highest critical peak periods in history were experienced during January 2014107
Cost amp Performance Requirements for Flexible Advanced Nuclear Plants in Future US Power Markets 70
During PAIs resources receiving capacity payments must be available to inject energy onto the grid (at the capacity for which they are receiving capacity payments) PAIs at the RTO level have not occurred since 2014 however it is important to note that when contracted capacity resources are not available during PAIs they are penalized Of the 30 PAHs in 2014 the average interval was 43 hours and the longest was 13 hours (during the height of the polar vortex) In addition to being available lsquoperformingrsquo resources must achieve pre-defined and approved ramp rates during a scarcity event Acceptable rates have historically been defined as being between the historic average and maximum over a defined period (up to 3 months) They ultimately require approval by PJM Table 29 highlights the required operating parameters for eligible capacity resources Currently nuclear plantsmdashpresumably because they are only used as baseload resourcesmdashare not subject to capacity performance operating requirements108 109
Table 29 Capacity Performance and Base Capacity Resource Minimum Unit-Specific Operating Parameters in PJM (Select Technologies)
Generator Technology
Min Down Time Hrs
Min Run Time Hrs
Max Daily Starts
Max Weekly Starts
Start-up Time Hot Hrs
Warm Hrs
Cold Hrs
NotTime1
Turn Down Ratio
Reciprocating ICE 06 1 12 84 01 01 01 01 gt1
Aero CT 11 1 6 42 01 01 01 01 gt1
Frame CT 125 3 4 28 025 025 025 01 gt15
CCGT 35 4 3 21 05 05 05 1 gt15
Storage lt1 TBD TBD TBD Start Time + Notification lt1 TBD
Source Slide 14 in PJM (2016) Capacity Performance Performance Assessment Hour Education
1 Notification Time Time to Start (ColdWarmHot Hours)
MISO Capacity PerformanceIn MISO non-intermittent capacity resources (ie nuclear) must offer all its claimed capacity into the Day-Ahead market for all hours it is scheduled to be available Intermittent capacity resources (for which co-located energy storage may be categorized) must submit bids into the Day-Ahead energy market and offer at least four continuous hours daily across the MISO forecasted daily peak110
CAISO Flexible Resource AdequacyEach CAISO LSE must procure sufficient flexible RA resources Flexible RA resources must submit economic bids depending on one of three Flexible Capacity Categories (listed in the table below)111 112
Cost amp Performance Requirements for Flexible Advanced Nuclear Plants in Future US Power Markets 71
Table 30 Categories of Must-Offer Obligations for Flexible RA Capacity Resources in CAISO
Category 1 Category 2 Category 3
Must-Offer Obligation
17 Hours 5 Hours 5 Hours
5am ndash 10pm Daily for the whole year
3pm ndash 8pm for May ndash September
3pm ndash 8pm for May ndash September
5pm ndash 10pm Daily for the whole year
2pm ndash 7pm for January ndash April and October ndash December
2pm ndash 7pm for January ndash April and October ndash December
Daily Daily Non-holiday weekdays
Energy Limitation
At least 6 Hours At least 3 Hours At least 3 Hours
Starts The minimum of two starts per day or the number of starts feasible with minimum up and down time
At least one start per day Minimum 5 starts a month
Source California Public Utility Commission 2019 Filing Guide for System Local and Flexible Resource Adequacy (RA) Compliance Filings
Start-up time is not an eligibility requirement however resources that can start within 90 minutes can qualify all capacity from zero up to their lsquoEffective Flexible Capacityrsquo113 (EFC)114 If a resource requires more than 90 minutes the capacity eligible for Flexible RA is the difference between its Pmin and EFC CAISO has an open docket to revise Flexible RA requirements which include reducing start-up time to 60 minutes or less for RT (5-minute or 15-minute) products115
CAISO FRAC-MOOThe Flexible Resource Adequacy Criteria and Must-Offer Obligation (FRAC-MOO) is an initiative related to flexible resource adequacy It requires LSEs to procure sufficient flexible resources based on each monthrsquos maximum 3-hour ramp and peak demand Qualifying resources are obligated through a lsquoMust-Offer Obligationrsquo to submit bids into CAISOrsquos day-ahead markets (as opposed to self-schedule)Some analysts view the flexible ramping product and FRAC-MOO as being less for attracting new flexible resources and more as a lsquoretirement prevention toolrsquo for existing flexible capacity resources considering solar-induced decline in energy revenues116 It is likely that existing flexible resources in CAISO can serve as adequate flexible RA capacity until there is a 50 renewables mix (or higher)117
Cost amp Performance Requirements for Flexible Advanced Nuclear Plants in Future US Power Markets 72
Operating Requirements for Fast-Start Generation
Resources that are relatively fast to start up and ramp are typically more expensive than other marginal resources and therefore do not set the price as often During tight system conditions fast-start generators may be too expensive to get dispatched In response fast-starting pricing regimes have been proposed to allow these resources to set the price more often This usually requires relaxing a resourcersquos Economic Minimum118 to zero so it is available for dispatch and then separately compensating it for its start-upno-load119 costs FERC issued a Notice of Proposed Rule Making (NOPR) in 2016 regarding fast-start pricing which directed the RTOISOs to ldquohellipapply fast-start pricing to any resource committed that can start up within 10 minutes or less has a minimum run time of one hour or less and submits economic energy offers to the marketrdquo120 The RTOISOs are still implementing the NOPR existing operating requirements121 122 123 124
Table 31 FERCrsquos Existing Operating Requirements for RTOISOs to Receive lsquoFast-Startrsquo Pricing
ISO Description of Technical Requirements
ISO-NE1 Minimum Run Time does not exceed one hour
Minimum Down Time does not exceed one hour
Time to Start does not exceed 30 minutes after receiving a Dispatch Instruction from ISO
Available for dispatch and manned or has automatic remote dispatch capability
Capable of receiving and acknowledging a start-up or shut-down dispatch instruction electronically within 60 seconds
PJM2 lt=1 hour for start-up and minimum run time
MISO3 Online resource lt=1 hour for starting synchronizing and injecting energy to the grid (online resource) minimum run time of lt=1 hour
Offline resource lt=10 minutes for starting synchronizing and injecting energy to the grid minimum run time of lt=1 hour
CAISO4 Start-up time of less than two hours
1 ISO-NE Appendix 6 Large Generator Interconnection Agreement
2 PJM (2019) Fast-Start Summary August 7 2019
3 MISO (2013) MISO Module AmdashCommon Tariff Provisions 3000 November 19 2013
4 CAISO (2019) Fifth Replacement FERC Electric Tariff Effective as of January 1 2019
Cost amp Performance Requirements for Flexible Advanced Nuclear Plants in Future US Power Markets 73
Operating Requirements for Ancillary Services
As shown in Table 32 below operating requirements for regulation operating reserves and supplemental reserves are largely similar across all four RTOs125
Table 32 Summary of Ancillary Service Operating Requirements
Ancillary Service Product ISO-NE PJM MISO CAISO Performance Requirements
Regulation
Regulation n n n Must immediately increase or decrease output in response to automated signals (typically 2 ndash 4 seconds depending on market)Regulation ndash Up n
Regulation ndash Down n
Regulation Mileage ndash Up n Must minimize the absolute change in output between four-second set points
Regulation Mileage ndash Down n
Spinning Reserves
10-minute Synchronized Reserves n Synchronized to the grid and must respond within 10 minutes
Synchronized or Reserves n n
Spinning Reserves n1
Non-Spinning Reserves
30-minute Operating Reserves n Must respond within 30 minutes
10-minute Non-Sync Reserves n Must respond within 10 minutes
Primary Reserves2 n
Supplemental Reserves n
Non-Spinning Reserves n1
1 Must run for at least two hours
2 Synchronized and non-synchronized
Source Summarized data collected from Zhou et al (2016) Survey of US Ancillary Services Markets Center for Energy Environmental and Economic Systems Analysis Energy Systems Division Argonne National Laboratory
Cost amp Performance Requirements for Flexible Advanced Nuclear Plants in Future US Power Markets 74
Other ancillary services in addition to being minor revenue sources require less generation modification and therefore would not influence design considerations for advanced reactor developers Supplying voltage support typically requires having automatic voltage regulating (AVR) equipment (and telemetered communication with the ISO) Because flexible nuclear plants are motivated to run as much as possible they will likely not supply black start services However if they do they must be capable of starting without support from offsite power and operate at full capacity for 12 ndash 16 hours (depending on the ISO)126
Cost amp Performance Requirements for Flexible Advanced Nuclear Plants in Future US Power Markets 75
D Appendix ndash Alternative Ways of Providing System Flexibility Non-generation resources are becoming increasingly relevant in the competitive landscape of lsquoflexiblersquo technologies against which advanced nuclear will need to compete This section briefly summarizes the applications and market adoption potential for energy storage and demand-side technologies and applications
Energy Storage
Much has already been written about the grid benefits of energy storage127 128 Energy storage systems take up energy store it and make it available for use at a later time They are extremely useful for grid balancing and have become a cost-competitive alternative for a growing number of applications in recent years ESS is now regularly procured by utilities and increasingly required to be co-located with new renewable projects Table 33 below highlights the range of applications including services that directly support integration of variable renewables129
Table 33 Select Energy Storage Applications
Category Storage Services Supporting Renewable Integration
Bulk Energy Services Electric Energy Time-Shift (Arbitrage) n
Electric Supply Capacity n
Ancillary Services Regulation n
Spinning Non-Spinning and Supplemental Reserves n
Voltage SupportBlack StartOther Related Uses (load following frequency response flexible ramping power smoothing of renewable output)
n
Transmission Infrastructure Services
Transmission Upgrade DeferralTransmission Congestion Relief
Distribution Infrastructure Services
Distribution Upgrade DeferralVoltage Support
Customer Energy Management Services
Power QualityPower Reliability n
Retail Electric Energy Time-Shift n
Demand Charge ManagementIncreased Self-Consumption of Solar PV n
Figure 25
Cost amp Performance Requirements for Flexible Advanced Nuclear Plants in Future US Power Markets 76
Category Storage Services Supporting Renewable Integration
Off-grid Solar Home Systems n
Micro-Grids System Stability Services n
Micro-Grids Facilitating High Shares of VRE n
Transportation Electric Vehicles n
Source The US DOEEPRI 2015 Electricity Storage Handbook Sandia National Laboratories
Figure 17 below shows the annual growth trajectory for storage with an estimated 44 GWs deployed in 2024mdashrepresenting a more than 14-times increase over 2018 Cumulatively this assumes over 18 GWs of deployed capacity At the same time Wood Mackenzie and ESA (2019) predict that the US energy storage market will be valued at approximately $47 billion130 Outside the US the market is expected to keep growing at a rapid pace which will undoubtedly drive further cost reductions
Figure 17 US Annual Energy Storage Deployment Forecast 2012-2024E (MW)131
With electrochemical storage (inclusive of battery storage) taking up an increasingly larger share of new storage installations in the US it is useful to examine cost reduction curves for battery storage over time The price of lithium ion batteries fell 80 between 2010 and 2017 ($kWh) and Bloomberg New Energy Finance (BNEF) believes storage costs will continue to drop by 52 between 2018 and 2030 (see Figure 18)132 This forecast is supported by the International Renewable Energy Agency (IRENA) which predicts a of drop between 54 ndash 61133 These predictions suggest an installed cost of $70kWh by 2030 Significant improvements in round rip efficiency the number of full charge-discharge cycles and calendar life are expected to be accompany these cost declines By 2040 BNEF expects storage will represent 7 of the total installed power capacity globally reaching nearly 1000 GW134 Other experts see more modest growth (600 GW by 2040)135 however a positive trajectory is clear136
Figure 26
Cost amp Performance Requirements for Flexible Advanced Nuclear Plants in Future US Power Markets 77
Figure 18 Lithium-Ion Battery Price Historical and Forecast
As more projects are deployed financiers developers utilities operators and regulators are getting more comfortable with the technology137 Market rules are evolving (albeit at different rates across the ISOs) to compensate storage for the values it providesInitially energy storage entered the market by providing high power-short duration services (ie ancillary services) As costs have come down storage is expanding to include more energy time-shifting (as opposed to power-relatedbalancing) values Currently there are no commercially available138 bulk storage technologies (beyond pumped hydropower) that are cheap enough to store and dispatch energy on a weekly monthly or seasonal basis
Demand-Side Flexibility Demand Response and Distributed Energy Resources
A new generation of communication and control technologies is emerging to time shift electricity use across hours of the day Several utility-led programs are allowing utilities to control customer-sited loads that have grid-interactive hardware and software (eg EVs air conditioning electric water heaters thermostats smart solar inverters139 etc) As more of these resources are deployed and if possible aggregated they are expected to help peak shave and provide another grid-balancing tool to grid operatorsISOs have Demand Response (DR) programs where the utility pays electricity customers to reduce their consumption relative to a measurable baseline level of consumption The ability to reduce load on demand reduces the requirement to procure expensive peaking generation which can be valuable during critical peak periods of demand Distributed energy resources (DERs) are typically small-scale physical and virtual assets are connected to and interact with the grid at the local distribution level (oftentimes located behind-the-meter) DERs encompass a range of technologies that include solar PV energy storage combined heat and power plants fuel cells energy efficiency and controllable loads Through various communication and control platforms these resources can be used individually or in aggregate to provide value to customers the
Cost amp Performance Requirements for Flexible Advanced Nuclear Plants in Future US Power Markets 78
local distribution network or the larger transmission network The orchestrated use of multiple DER technologies has given rise to the concept of the lsquovirtual power plantrsquo (VPP) or the optimized use of heterogenous DERs (using control monitoring and management software) to provide retail or wholesale market services VPPs can provide flexible grid services for applications such as frequency regulations demand response operational reserves or peak demand management to maintain or improves the grid reliability efficiency and overall performanceIn aggregate flexible loads DR and DERs are expected to play a material role in helping grid operators manage variable renewable integration While they show great promise it is important to be aware of several issues that could limit their effectiveness Namely leveraging flexible loads requires aggregating several thousand systems which involve customer acquisition costs the prospect of installing additional hardware and potential technical challenges related to aggregation and responding to grid signals DR programs have been in operation for over a decade but are rarely required to modify their load140 DER aggregation and wholesale market performance like flexible loads is still far from where it will ultimately be It will be important for MEITNER Design Teams to follow how these flexible resources evolvemdashboth technically and as they are supported by policymdashas they will undoubtedly be valuable grid reliability tools
Cost amp Performance Requirements for Flexible Advanced Nuclear Plants in Future US Power Markets 79
E Appendix ndash High-Level Cost Analysis of Energy Storage SystemThe analysis described in this report includes scenarios in which advanced nuclear plants would use co-located energy storage systems (ESS) to increase revenue by charging from the reactorrsquos energy when market prices are low and discharging to the grid for energy sales when market prices are high LucidCatalyst and project advisors developed the following high-level information on three potential ESS approaches to assess the financial feasibility of this concept relative to the extra allowable CapEx for advanced nuclear plants with ESS calculated from the PLEXOS results The three potential ESS approaches in this preliminary assessment are firebricks (thermal ESS) molten salt (thermal ESS) and flow batteries
The financial feasibility assessment accounts not only for the ESS medium but also for the heat recovery steam generators (HRSG) and additional turbine-generator capacity when the reactor and ESS release energy to the grid at the same time The assessment below indicates that the cost estimates for these approaches based on currently available data could be financially feasible as components of flexible advanced nuclear plants This is because their CapEx levels are near the extra allowable CapEx values enabled by ESS from many of the PLEXOS simulations Moreover the cost estimates shown below are well within the CapEx thresholds for simulations with high revenue to advanced nuclear plants through high capacity payments ($100kW case) or a CO2 program that lifts electricity market prices
Firebricks
Forsberg et al describe the possible use of firebricks for storing and releasing thermal energy from nuclear plants to provide load-following services to the grid and increase nuclear plant revenue141 Firebrick or refractory brick is designed for higher temperatures than typical masonry brick Firebrick is already produced at large scale and low cost for many applications Forsberg et al estimate the cost for firebrick in this application as less than $10kWh of thermal energy This excludes the additional equipment necessary for coupling the medium to the nuclear plantAs a high-level assessment of firebrick configurations and costs LucidCatalyst and project advisors performed the following calculations The density of brick is approximately 2200 kgm^3142 Packing brick in the system would reduce the density by approximately 25 leading to a packed density of 1650 kgm^3 The specific heat of brick is approximately 105 kJkg-K143 Multiplying the packed density by the specific heat leads to an effective volumetric specific heat of 1732 kJm^3-K
Cost amp Performance Requirements for Flexible Advanced Nuclear Plants in Future US Power Markets 80
Assuming a temperature of 500 C (773 K) from the reactor into the storage system the bricks store 0866 GJ per m^3 or 0525 GJ per metric tonneThe maximum output for each storage system is 500 MWe which effectively doubles the production capacity of the flexible advanced nuclear plant when added with the 500 MWe of direct power production from the reactor The storage system can discharge at maximum output for 12 hours implying a capacity of 6000 MWh in terms of electric energy Assuming a conversion efficiency of 40 this capacity is equivalent to 15000 MWh of thermal energy or 54000 GJ (using the conversion ratio of 36 GJ per MWth) From the energy storage parameters for brick specified above a system at each plant to store this amount of energy would have a volume of 62000 m^3 and weight of 103000 metric tonnesThe typical price for large orders of ordinary brick is approximately $300tonne144 The total raw materials cost for the necessary weight of brick is $31 million If labor costs for installation are approximately equal to the raw materials cost then installation adds another $31 million to the system cost and the subtotal is $62 million (~$10kW installed)As another cost estimation approach for brick thermal energy storage Storasol indicates the cost of its storage system as approximately $20kWh145 A system for this thermal capacity with 12 hours of discharge capability would cost $300 million The estimated cost of the HRSG is $89 million and the supplemental steam turbine is $112 million For the other necessary equipment the cooling system for the steam turbine is estimated to cost $33 million the water system $59 million and the transformers and grid connections $54 million146 The estimated cost for the total package is $646 million which equates to $1292kWe and $269kWhe with 80 round-trip efficiency
Molten Salt
NREL indicates that an oil-to-salt heat exchanger would cost approximately $30kWh of thermal energy147 The cost of a salt-to-steam apparatus for the application in this analysis would presumably be similar For a nuclear reactor with 500 MWe of electric capacity and thermal conversion efficiency of 40 the equivalent thermal capacity is 1250 MWth A molten salt system for this thermal capacity with 12 hours of discharge capability would cost $450 million As discussed above the estimated cost of the supplemental steam turbine is $112 million For the other necessary equipment the cooling system for the steam turbine is estimated to cost $33 million the water system $59 million and the transformers and grid connections $54 million The estimated cost for the total package is $707 million which equates to $1414kWe and $262kWh with 90 round-trip efficiency
Flow Batteries
As an indicative example of flow battery economics StorTera has designed a single liquid flow battery with a lifetime up to 20 years that costs $150kW148 The cost per unit of energy is $94kWh For a 12-hour system the energy component would cost $1125kW leading to a total cost of $1275kW
Cost amp Performance Requirements for Flexible Advanced Nuclear Plants in Future US Power Markets 81
F Appendix ndash High-Level Estimate of Non-Nuclear Island CostsThe following table includes the cost estimates (with their associated sources) for all costs downstream of the nuclear heat source This primarily consists of costs related to power conversion and balance of plant
The estimates below are largely sourced from a 2015 US DOE detailed cost study for natural gas and coal plants149 with other supporting data The figures exclude contingency costs and all costs were bought to 2019 USD by using the Federal Reserve Bank of St Louisrsquo Producer Price Index for Electrical Machinery and Equipment150 Importantly these estimates are from NGCC and coal plants that are 630 MW and 500 MW respectively (similar to the size of the 500 MW illustrative advanced nuclear plant) Costs are rounded to the nearest hundred thousand This costing exercise assumes that the power conversion system and all other downstream components are effectively off-the-shelf components that are otherwise used by other thermal power plants For conventional nuclear plants these components have traditionally had higher costs due to the lsquonuclear premiumrsquo for things such as steam turbines that due to the plant design had to meet higher nuclear-grade standards This costing exercise assumes that advanced reactor developers are able to separate these downstream components from their nuclear heat source design There are two tables below The first estimates the non-nuclear costs for a plant without thermal storage or $880kW The second table outlines the additional non-nuclear costs for a plant with a co-located ESS which is $1100kW (or $9167kWh for a 12-hour system)
Cost amp Performance Requirements for Flexible Advanced Nuclear Plants in Future US Power Markets 82
Table 34 Non-Nuclear Island Costs for 500 MW Plant without ESS
Non-nuclear Component1 Cost $kW Cost Base Year
$kW (2019 USD)
Relevant Assumptions Reference Plant
Feedwater and Misc BOP Systems (a)
$541 M $108 2011 $11126 Assumes costs (expressed in $kW) relate only to 219 MW steam turbine (not 422 MW gas turbine)
NGCC
Coolant to Steam Hx (a) $288 M $58 2011 $5922 NGCC
Ducting (b) $1214 M $243 2019 $24287 NGCC
Steam Turbine Generator (a) $40 M $80 2011 $8233 LC received an indicative quote from Mitsubishi Heavy Industries for a 600 MW steam turbine generator of $80kW The turbine plant auxiliaries condenser amp auxiliaries steam piping and foundations are sourced from 2015 DOE study1
Coal
Cooling Water System (b) $322 M $64 2011 $6620 NGCC
Accessory Electric Plant (a) $118 M $24 2011 $2428 NGCC
Instrumentation and Control (a) $77 M $15 2011 $1575 NGCC
Improvements to Site (a) $20 M $40 2011 $4119 NGCC
Buildings and Structures (excludes ESS or NSSS) (a)
$541 M $108 2011 $11126 NGCC
Land (c) $09 M $2 2011 $2 Assumes 300 acres Coal
Financing Costs (d) $265 M $53 2011 $55 Coal
Ownerrsquos Costs (e) $675 M $135 2011 $139 Includes Pre-production costs Inventory Capital and Other Ownerrsquos Costs
NGCC
Totals $4309 M $880
1 Information labeled (a) (b) (c) (d) and (e) are respectively sourced from Exhibit 4 ndash 14 Case B31A Exhibit 3 ndash 49 Case B31A Exhibit 2 ndash 1 Exhibit 3 ndash 19 and Exhibit 4 ndash 15 from US DOE (2015) Cost and Performance Baseline for Fossil Energy Plants Volume 1a Bituminous Coal (PC) and Natural Gas to Electricity Revision 3 National Energy Technology Laboratory Office of Fossil Energy
Cost amp Performance Requirements for Flexible Advanced Nuclear Plants in Future US Power Markets 83
Table 35 Additional Non-Nuclear Costs for a Plant with a 500 MW ESS
Component1 Cost $kW Cost Base Year
$kW (2019 USD)
Relevant Assumptions Reference Plant
Coolant to Air HX (a) $288 M $58 2011 $59 NGCC
Fans2 $148 M $30 2016 $30 Calculations based on $5MMBtu J Class gas turbine
NGCC
Thermal Energy Storage Facility $978 M $196 2019 $201 Internal LucidCatalyst Analysis
Assumes refractory brick
Cooling Water System (a) $40 M $80 2011 $111 Excludes contingency costs and assumes costs (expressed in $kW) relate only to 219 MW steam turbine (not 422 MW gas turbine)
NGCC
Accessory Electric Plant (a) $322 M $64 2011 $59 NGCC
Instrumentation and Control (b) $118 M $24 2011 $41 $0 Coal
Extra HRSG (hot air to steam) (a)
$575 M $115 2011 $118 NGCC
Buildings and Structures (conventional plant) (a)
$20 M $40 2011 $41 $0 Coal
Financing Costs ndash prorated by CapEx basis (d)
$265 M $53 2011 $55 Coal
Ownerrsquos Costs (d) $675 M $135 2011 $139 Coal
Land (c) $09 M $2 2011 $2 Assumes 300 acres Coal
Steam Turbine Generator (a MHI quote)
$1214 M $243 2019 $243 Indicative quote from Mitsubishi Heavy Industries (see Table 34 entry)
NGCC
Storage Totals $5192 M $1038 $1100
Cost of Storage ($kWhe) $9167
1 Source Info in this column labeled (a) (b) (c) (d) and (e) are respectively sourced from Exhibit 4 ndash 14 Case B31A Exhibit 3 ndash 49 Case B31A Exhibit 2 ndash1 Exhibit 3 ndash 19 and Exhibit 4 ndash15 from US DOE (2015) Cost and Performance Baseline for Fossil Energy Plants Volume 1a Bituminous Coal (PC) and Natural Gas to Electricity Revision 3 National Energy Technology Laboratory Office of Fossil Energy
2 Source Gulen S Can et al (2017) ldquoA Cheaper HRSG with Advanced Gas Turbinesrdquo Power Engineering Issue 3 and Volume 121
Cost amp Performance Requirements for Flexible Advanced Nuclear Plants in Future US Power Markets 84
1 National Renewable Energy Laboratory (NREL) is part of the US Department of Energyrsquos Office of Energy Efficiency amp Renewable Energy
2 This is the ldquoLow Natural Gas Price Low Renewables Costrdquo scenario included in NRELrsquos ReEDS model which is described in further detail in Section 522
3 Note that the PJM ISO now covers a broader area than when it was originally named4 We do include however a conceptual cost buildup for a firebrick thermal storage facility in Appendix
E which suggests that a thermal storage system as modeled can be built for less than is allowable capital cost in most of the scenarios The sources used for this are published reports on the cost of fossil power plants not optimized for this application and hence there is large scope for further cost reduction in this system
5 This figure represents the average across the four ISOs6 Energy Innovations Reform Project (2017) What will advanced nuclear power plants cost July 25
20177 Energy Technologies Institute (2018) The ETI Nuclear Cost Drivers Project Summary Report April
20 20188 ARPA-Ersquos MEITNER program website9 Section 5 includes the complete rationale for selecting the year 203410 Variable renewable energy sources are those that are non-dispatchable (ie intermittent) including
solar PV wind run-of-river hydropower tidal and wave energy11 The NREL ReEDS model is a capacity planning and dispatch model for the North American
electricity system12 Hsieh Eric and Anderson Robert (2017) Grid Flexibility The Quiet Revolution US Department of
Energy Office of Scientific and Technical Information13 MISO (2018) Review Ranking Input from the 2018 Market Roadmap Stakeholder Prioritization
Survey August 9 201814 These rules govern everything from resource procurement billing rates and incentive programs to
terms of service15 Lazar J (2016) Electricity Regulation in the US A Guide Second Edition Montpelier VT The
Regulatory Assistance Project16 Wiser Ryan (2019) The Impact of Variable Renewable Energy on Wholesale Power Pricesmdash
Implications for the Merchant Market Value of Wind and Solar Lawrence Berkeley National Laboratory
17 Bajwa et al (2017) Growing Evidence of Increased Frequency of Negative Electricity Prices in US Wholesale Electricity Markets IAEE Energy Forum Fourth Quarter 2017 Bloomberg (2018) Power Worth Less Than Zero Spreads as Green Energy Floods the Grid August 6 2018
18 It was cheaper on a $MW basis to build large centralized power plants rather than smaller distributed plants Borberly A and Kreider J F (2001) Distributed Generation The Power Paradigm for the New Millennium CRC Press Boca Raton FL
19 Wind Solar Alliance (2018) Customer Focused and Clean Power Markets for the Future Nov 201820 Wind Solar Alliance (2018) Outdated Electricity Market Rules Prevent Full Renewable Energy
Participation21 International Monetary Fund (2019) Falling Costs Make Wind Solar More Affordable April 26 2019
EndnotesFurther information references and hyperlinks
Cost amp Performance Requirements for Flexible Advanced Nuclear Plants in Future US Power Markets 85
22 lsquoNet loadrsquo refers to the difference between forecasted demand and expected generation from variable renewables
23 California ISO (2017) Renewables WatchmdashFor Operating Day Sunday April 09 201724 See NREL ReEDS model (any scenario including ldquo80 National RPSrdquo) US EIAmdashAnnual
Energy Outlook 2019 (natural gas increases in absolute and relative terms beyond 2050) and BloombergNEF New Energy Outlook (2019)
25 MISO (2018) Renewable Integration Impact Assessment (RIIA)26 This is done by providing operating reserves and frequency regulation services when wholesale
energy prices drop below marginal operating costs27 Patel Sonia (2019) Flexible Operation of Nuclear Power Plant Ramps Up Power Magazine28 Jenkins et al (2018) The benefits of nuclear flexibility in power system operations with renewable
energy Applied Energy Vol 2222 July 15 2018 Pgs 872 ndash 88429 Jenkins et al (2018) concluded that flexibly operating a nuclear plant could actually increase its
gross operating margins by providing operating reserves and frequency regulation services when wholesale energy prices drop below marginal operating costs They also concluded that it could reduce solar and wind curtailment and lower overall operating costs for the entire power system Their analysis however considered only one plant in a stylized high renewable power system A fleet of plants would quickly depress these ancillary services revenues leaving the fundamental economic dilemma of operating below a plantrsquos rated output
30 The wind production tax credit pays wind projects for each MWh of generation Therefore wind projects can bid negative prices and still theoretically make positive cash flow
31 Union of Concerned Scientists (2018) The Nuclear Power Dilemma Declining Profits Plant Closures and the Threat of Rising Carbon Emissions November 2018
32 ClimateNexus (2019) Nuclear Energy in the US Recent plant closures and policy decisions April 4 2019
33 US Energy Information Administration (2018) Frequently Asked Questions How old are US nuclear power plants and when was the newest one built
34 Reuters (2019) Pennsylvania state lawmaker offers bill to save nuclear power plants March 11 2019 and NEI (2019) Ohio policymakers support nuclear plants and the 23 million tons of CO2 they prevent June 13 2019
35 Baltimore Sun (2019) Maryland bill mandating 50 renewable energy by 2030 to become law but without Gov Larry Hoganrsquos signature May 22 2019
36 In August 2019 the DOE announced funding for a project with Exelon mdashwhich has the countryrsquos largest nuclear fleetmdashto produce store and use hydrogen produced from an existing nuclear plant Shortly thereafter ARPA-E provided funding to FirstEnergy Solutions Xcel Energy and Arizona Public Service to demonstrate hydrogen production from existing nuclear facilities as well
37 Bloomberg Environment (2019) Advanced Nuclear Reactors Targets for Late 2020s Companies Say February 13 2019
38 The capacity expansion is performed by Energy Exemplar using their Aurorareg software through 2046
39 Energy Exemplar (2018) North American Datasets Data Documentation August 201840 National Renewable Energy Laboratory (NREL) 2019 Regional Energy Deployment Systems
(ReEDS) Model Standard Scenarios Results Viewer41 US Energy Information Administration (2019) What is the efficiency of different types of power
plants Last updated August 8 201942 Congressional Research Service (2019) Advanced Nuclear Reactors Technology Overview and
Current Issues April 18 201943 NREL (2019) Annual Technology Baseline Electricity Natural Gas Plants
Cost amp Performance Requirements for Flexible Advanced Nuclear Plants in Future US Power Markets 86
44 LucidCatalyst did not perform nor reference detailed engineering studies to confirm the claims made about thermal storage performance characteristics It assumes that the claims made in either the published literature or by the companies themselves are true
45 This assumption is supported by several of the project advisors as the 12-hour capacity exceeds contiguous dispatch requirements for capacity resources for all four ISOs (PJMrsquos 10-hour contiguous dispatch being the longest)
46 US Energy Information Administration (2019) Table S1b Weighted-average price of uranium purchased by owners and operators of US civilian nuclear power reactors 1995ndash2018 dollars per pound U3O8 equivalent Nuclear amp Uranium
47 With perfect energy conversion 1 kWh could be produced from 3412 Btu Heat rate calculations scale up the necessary Btu per kWh by dividing 3412 by the efficiency percentage
48 Bowers H I Fuller L C and Myers M L Cost Estimating Relationships for Nuclear Power Plant Operations and Maintenance Oak Ridge National Laboratory 1987 Web doi1021725431729 Table 31
49 Nuclear Energy Institute Nuclear Costs in Context September 2019 p 250 US Energy Information Administration Cost and Performance Characteristics of New Generating
Technologies Annual Energy Outlook 2019 Table 251 Nuclear Energy Insider GE Hitachi chases gas plant displacement with new 300 MW reactor April
18 201852 US Department of Energy Cost and Performance Baseline for Fossil Energy Plants Volume 1
Version 3 2015 Exhibits 4 ndash16 and 3 ndash 5153 Idaho National Laboratory Power Cycles for the Generation of Electricity from a Next Generation
Nuclear Plant 2010 p 33 INL and the plant designer (General Atomics) provided further estimates of staffing levels and OampM costs in 2012 but these estimates do not account for the staffing efficiencies envisioned for flexible advanced nuclear plants in the 2030s For instance the 2012 study includes 7 telecommunications staffers 5 storekeepers 89 security personnel and 16 organizational effectiveness staffers
54 LucidCatalyst did not have detailed information regarding ESS maintenance costs however peer-reviewed literature (see following references) suggests that it is ~1 ndash 2 of total CapEx over a year Black amp Veatch (2016) Molten Salt Concept Definition amp Capital Cost Estimate Prepared for US DOE SunShot June 30 2016 IEA (2010) Technology Roadmap Concentrating Solar Power Purohit Ishan (2010) Techno-economic evaluation of concentrating solar power generation in India Energy Policy 2010 p38
55 The 22-year CapEx recovery assumption was provided under the guidance of project advisors who had brokered several large PPA negotiations for large power projects This is on the higher end of the typical recovery periods considered by debt and equity investors
56 Assumes a 55 interest rate on debt and an 85 return for equity investors Naturally the WACC is a material assumption in calculating maximum allowable CapEx Increasing or decreasing the WACC by a percentage point changes the maximum allowable CapEx by about 8 ndash 9
57 Ye Jason (2019) Carbon Pricing Proposal in the 116th Congress Center for Climate and Energy Solutions
58 Climate XChange Education and Research Inc (2020) State Carbon Pricing Network59 Energy Innovations Reform Project (2017) What will advanced nuclear power plants cost60 Energy Technologies Institute (2018) ldquoThe ETI Nuclear Cost Drivers Project Summary Reportrdquo
April 20 201861 Per analysis of ISO-NE Annual Market Reports from 2008-201862 2017 Annual Markets Report ISO New England Inc Internal Market Monitor May 17 201863 Over 95 of energy is transacted in the Day-Ahead market
Cost amp Performance Requirements for Flexible Advanced Nuclear Plants in Future US Power Markets 87
64 $MWh figures are taken directly from ISO-NE annual market reports with the exception of $MWh of capacity for years 2014 ndash 2017 These data points were estimated based on the reported total spend on fulfilling capacity contracts as a percentage of total spend on energy (which on a proportional basis is translated to $MWh)
65 See PJMrsquos Capacity Market Auction Results66 Potomac Economics (2019) 2018 State of the Market Reports for the MISO Electricity Markets
June 201967 CAISO (2019) 2018 Annual Report on Market Issuesamp Performance May 201968 California ISO (2019) What are we doing to green the grid As of October 23rd 201969 California Energy Commission (2018) The California Energy Demand 2018-2030 Revised Forecast
See Table ES-1 Comparison of CED 2017 Revised and CEDU 2016 Mid Case Demand Baseline Forecasts of Statewide Electricity Demand 1 ndash 15
70 CAISO (2018) Day-Ahead Market Enhancements Updates to Revised Straw Proposal71 Net Load reflects the total system demand not being met by variable renewable resources like solar
PV and wind72 CAISO (2018) 2018 Annual Report on Market Issues amp Performance73 CAISO (2018) Day-Ahead Market Enhancements Updates to Revised Straw Proposal74 As the grid resource mix includes more variable renewable generation it becomes increasingly
challenging to forecast load using historical averages75 Wang et al (2016) Ramp capability Modeling in MISO Dispatch and Pricing FERC Technical
Conference on Increasing Realtime and Day-Ahead Market Efficiency through Improved Software76 Cavicchi Joseph Harvey Scott (2018) Ramp Capability Dispatch and Uncertain Intermittent
Resource Output (Table VI-7mdashMISO Ramp Up Shadow Prices) Advanced Workshop in Regulation and Competition 31st Annual Western Conference Monterey California June 27 ndash 29 2018 Revised July 17 2018
77 See MISO Informational Forums (July 2019 April 2918 October 2017 and November 2016)78 A resource must meet the following criteria to be considered a lsquoFast Start Generatorrsquo (1) Minimum
Run Time does not exceed one hour (2) Minimum Down Time does not exceed one hour (3) cold Notification Time plus cold Start-Up Time does not exceed 30 minutes (4) available for dispatch and manned or has automatic remote dispatch capability and (5) capable of receiving and acknowledging a start-up or shut-down dispatch instruction electronically
79 Capacity Scarcity Conditions (CSC) are conditions when the grid cannot redispatch resources to create more operating reserves (which at the time will be dispatching at a capped price) to help maintain grid stability Pay-for-Performance is triggered and prices are cleared on a 5-minute basis until the CSC is resolved
80 ISO-NErsquos performance payment rates 612018 ndash 5312021 ($2000MWh) 612021 ndash 5312024 ($3500MWh) 612024 ndash 5312025 ($5455MWh) These need to get converted 5-minute rates by dividing by 12
81 ISO-NE (2019) Capacity Scarcity Condition Report (includes ability to search historical data)82 PJM (2018) Strengthening Reliability An Analysis of Capacity Performance June 20 201883 Ibid84 PJM (2019) Historical Emergency Procedures triggering Performance Assessment Hours MS Excel
spreadsheet85 CAISO (2018) Day-ahead Market Enhancements Updates to Revised Straw Proposal86 CAISO (2018) 2018 Annual Report on Market Issues amp Performance87 CAISO (2019) Q1 Report on Market Issues and Performance June 28 201988 Wang et al (2016) Ramp capability Modeling in MISO Dispatch and Pricing FERC Technical
Conference on Increasing Realtime and Day-Ahead Market Efficiency through Improved Software
Cost amp Performance Requirements for Flexible Advanced Nuclear Plants in Future US Power Markets 88
89 Cavicchi Joseph Harvey Scott (2018) Ramp Capability Dispatch and Uncertain Intermittent Resource Output (Table VI-7mdashMISO Ramp Up Shadow Prices) Advanced Workshop in Regulation and Competition 31st Annual Western Conference Monterey California June 27 ndash 29 2018
90 See MISO Informational Forums (July 2019 April 2918 October 2017 November 2016) 91 ISO-NE (2019) Capacity Scarcity Condition Report (includes ability to search historical data)92 PJM (2019) Historical Emergency Procedures triggering Performance Assessment Hours93 Waumlrtsillarsquos Flexicycle plants can ramp to full capacity in 5 minutes in a simple cycle configuration and
then convert to combined-cycle operations within the hour Other large turbines in a simple cycle configuration can achieve maximum capacity in less than 10 minutes from a cold start
94 GE (2017) 7HA Power Plants95 Siemens (2016) Siemens gas turbine portfolio96 General Electric (2018) Powering Forward GErsquos Record Setting HA Gas Turbine Ignites a New Era
of Power Generation September 201897 See ERCOTrsquos Fast Responding Regulation Service Up and Down (FRRS) market and CAISOrsquos
stakeholder initiative98 The following are Unit Control Modes (UCM) UCM 1 ndash Off-line and unavailable for dispatch UCM 2
ndash Off-line and available for dispatch UCM 3 ndash Generator on-line not dispatchable UCM 4 ndash On-line and available for dispatch UCM 5 ndash Posture generator to maintain reliability or provide VAR support UCM 6 ndash Generator regulating
99 ISO-NE Appendix 6 Large Generator Interconnection Agreement100 PJM Manual 21 (2019) Rules and Procedures for Determination of Generating Capability Rev 14101 Ibid102 MISO (2018) Resource Adequacy Business Practice Manual Manual No 011103 CAISO (2019) Final Availability Assessment Hours May 15 2019104 ISO-NE (2018) Lesson 6B1 Supplier-Side SettlementmdashFCM Credit and Peak Energy Rent (PER)105 ISO-NE (2014) Market Rule 1mdashStandard Market Design106 Ibid107 PJM Interconnection (2018) Strengthening Reliability An Analysis of Capacity Performance108 PJM (2018) Capacity Performance Unit Specific Parameter Adjustment FAQs109 Table based on slide 14 from PJM (2016) Capacity Performance Performance Assessment Hour
Education110 MISO (2018) Resource Adequacy Business Practice Manual Manual No 011 Effective Date Nov-
01 ndash 2018111 The determination of operational need for the three Flexible RA Categories are as follows Category
1) Based on the magnitude of the largest 3-hour secondary net load ramp Category 2) Based on the difference between 95 of the maximum 3-hour net load ramp and the largest 3-hour secondary net load ramp Category 3) Determined by 5 of the maximum 3-hour net load ramp of the month
112 Table source California Public Utility Commission (2019) 2019 Filing Guide for System Local and Flexible Resource Adequacy (RA) Compliance Filings Issued October 3 2018
113 Effective Flexible Capacity (EFC) is the capacity that is available to be used to meet a LSErsquos Annual Flexible Resource Adequacy requirement EFC calculation is currently under review by CAISO
114 Effective Flexible Capacity values are required and determined based on a resources Pmin and weighted average ramp rate CAISO Tariff (2019) California Independent System Operator Corporation Fifth replacement Electronic Tariff
115 CAISO (2018) Flexible Resource Adequacy Criteria and Must Offer ObligationmdashPhase 2 Revised Draft Framework Proposal Presented at February 7 2018 Stakeholder Meeting
116 Singleton Chad (2017) Can California Conquer the Next Phase of Renewables Integration
Cost amp Performance Requirements for Flexible Advanced Nuclear Plants in Future US Power Markets 89
Greentech Media June 9 2017117 Ibid118 A resourcersquos lsquoEconomic Minimumrsquo (or lsquoEcoMinrsquo) is the minimum amount of energy (MW) that it must
be allowed to produce while under economic dispatch 119 lsquoNo-load Costrsquo encompasses the fixed cost of operation It includes the cost of starting up the plant
getting it synchronized to the grid and standing by to increase power out Effectively it represents the costs outside generating energy to serve load
120 FERC (2016) FERC Proposes Minimum Pricing Requirements for Fast-Start Resources 121 ISO-NE Appendix 6 Large Generator Interconnection Agreement122 PJM (2019) Fast-Start Summary August 7 2019123 MISO (2013) MISO Module AmdashCommon Tariff Provisions 3000 November 19 2013124 CAISO (2019) Fifth Replacement FERC Electric Tariff Effective as of January 1 2019125 Table reflects summarized data collected from Zhou et al (2016) Survey of US Ancillary Services
Markets Center for Energy Environmental and Economic Systems Analysis Energy Systems Division Argonne National Laboratory January 2016
126 ISO-NE (2019) ISO New England Operating Procedure No 11 Blackstart Resource Administration (OP-11) PJM (2015) Black Start Definitions amp Procurement Process MISO (2018) Business Practices Manual Outage Operations CAISO (2017) CAISO Fifth Replacement TariffmdashAppendix D Black Start Generating Units
127 The US DOEEPRI 2015 Electricity Storage Handbook provides an excellent overview on energy storage technologies and grid applications Akhil et al (2015) DOEEPRI Electricity Storage Handbook in collaboration with NRECA February 2015 Prepared by Sandia National Laboratories
128 Energy Storage Association (2019) Energy Storage Benefits Breeze P (2018) An Introduction to Energy Storage Technologies Power System Energy Storage Technologies 1ndash11 Union of Concerned Scientists (2019) How Energy Storage Works
129 Adapted from the 2015 DOEEPRI Handbookmdashsee footnote 128130 Wood MacKenzie Power amp Renewables Energy Storage Association (2019) US energy storage
monitormdash2018 Year in review and Q1 2019 executive summary131 Figure source Wood Mackenzie Power amp Renewables Energy Storage Association (2019) US
Energy Storage Monitor 2018 Year in review and Q1 2019 Executive Summary March 2019132 Bloomberg New Energy Finance (2018) Long-Term Energy Storage Outlook 133 IRENA (2017) Electricity Storage and Renewables Costs and Markets to 2030 International
Renewable Energy Agency Abu Dhabi134 Walton Robert (2018) BNEF raises forecast for global battery deployment to $12T by 2040 Utility
Dive November 8 2018135 Deign Jason (2019) The Safety Question Persists as Energy Storage Prepares for Huge Growth
Greentech Media July 24 2019 136 Figure source Bloomberg New Energy Financersquos New Energy Outlook 2018137 In May 2020 the company Form Energy announced a 1 MW x 150 MWh pilot project with Great
River Energy This is a major achievement for the storage industry and if costs get low enough this could trigger a significant change in the types of applications in which energy storage can participate This would have profound impacts on shoulder and baseload resources
138 US Energy Information Agency (2018) US Battery Storage Market Trends May 2018139 Smart inverters like traditional inverters convert DC to AC current (which can be used on the
grid) but they can also support renewable integration by providing voltage regulation ride through capabilities (helps solar stay grid connected during periods of low voltage) frequency support They can ensure that renewables can either go offline when the grid goes down or avoid overloading local transformers or circuits
Cost amp Performance Requirements for Flexible Advanced Nuclear Plants in Future US Power Markets 90
140 PJM has not called a Load Management Events since 2013 MISO called its first emergency DR event in 10 years in 2017 and has since called 5 events Kolo Elta (2019) Defining System Flexibility Supply is Only Half of the Equation
141 Forsberg C Brick S amp Haratyk G (2018) Coupling heat storage to nuclear reactors for variable electricity output with baseload reactor operation The Electricity Journal 31(3) 23ndash31
142 See simetriccouk143 See the specific heat of solids at engineeringtoolboxcom144 See Remodeling Calculator (2019) 2020 Brick PricesmdashComplete Brick Buying Guide (using
approximate average price of $600 per thousand bricks and average weight of 45 lb per brick)145 Epp Baerbel (2018) Molten salt storage 33 times cheaper than lithium-ion batteries Global Solar
Thermal Energy Council146 Analysis of typical power plant component costs from US Department of Energy Cost and
Performance Baseline for Fossil Energy Plants Vol 1 Bituminous Coal and Natural Gas to Electricity July 6 2015 Page 189
147 National Renewable Energy Laboratory G Glatzmaier Developing a Cost Model and Methodology to Estimate Capital Costs for Thermal Energy Storage NRELTP-5500-53066 September 2011 P 7 See also NREL Craig S Turchi and Garvin A Heath Molten Salt Power Tower Cost Model for the System Advisor Model (SAM) NRELTP-5500-57625 February 2013 Page 6
148 StorTera (2019) SLIQmdashThe Single Liquid Flow Battery The original cost estimates of pound120kW and pound75kWh have been converted to dollars using an exchange rate of 125 US dollars per British pound (pound)
149 US DOE (2015) Cost and Performance Baseline for Fossil Energy Plants Volume 1a Bituminous Coal (PC) and Natural Gas to Electricity Revision 3 National Energy Technology Laboratory Office of Fossil Energy
150 Federal Reserve Bank of St Louis (2019) Producer Price Index by Commodity for Machinery and Equipment Electrical Machinery and Equipment
LucidCatalyst delivers strategic thought leadership to enable rapid decarbonization and prosperity for alllucidcatalystcom