Cortical Control of Affective Networks - The Journal of Neuroscience
14
Systems/Circuits Cortical Control of Affective Networks Sunil Kumar, 1 Sherilynn J. Black, 1 Rainbo Hultman, 5 Steven T. Szabo, 1 Kristine D. DeMaio, 5 Jeanette Du, 5 Brittany M. Katz, 1 Guoping Feng, 6 Herbert E. Covington III, 3,5 * and Kafui Dzirasa 1,2,3,4 * 1 Department of Psychiatry and Behavioral Sciences, 2 Center for Neuroengineering, and 3 Duke Institute for Brain Sciences, Duke University Medical Center, Durham, North Carolina 27710, Departments of 4 Biomedical Engineering and Neurobiology and 5 Psychology and Neuroscience, Duke University, Durham, North Carolina 27708, and 6 Department of Brain and Cognitive Sciences, McGovern Institute for Brain Research at Massachusetts Institute of Technology, Cambridge, Massachusetts 02139 Transcranial magnetic stimulation and deep brain stimulation have emerged as therapeutic modalities for treatment refractory depres- sion; however, little remains known regarding the circuitry that mediates the therapeutic effect of these approaches. Here we show that direct optogenetic stimulation of prefrontal cortex (PFC) descending projection neurons in mice engineered to express Chr2 in layer V pyramidal neurons (Thy1–Chr2 mice) models an antidepressant-like effect in mice subjected to a forced-swim test. Furthermore, we show that this PFC stimulation induces a long-lasting suppression of anxiety-like behavior (but not conditioned social avoidance) in socially stressed Thy1–Chr2 mice: an effect that is observed 10 d after the last stimulation. Finally, we use optogenetic stimulation and multicircuit recording techniques concurrently in Thy1–Chr2 mice to demonstrate that activation of cortical projection neurons entrains neural oscillatory activity and drives synchrony across limbic brain areas that regulate affect. Importantly, these neural oscillatory changes directly correlate with the temporally precise activation and suppression of limbic unit activity. Together, our findings show that the direct activation of cortical projection systems is sufficient to modulate activity across networks underlying affective regulation. They also suggest that optogenetic stimulation of cortical projection systems may serve as a viable therapeutic strategy for treating affective disorders. Introduction Major depressive disorder (MDD) is a complex multifactorial neuropsychiatric illness characterized by profound changes in mood, sleep, affect, and interests (American Psychiatric Associa- tion, 2000; Akil et al., 2010). At least 4% of the United States population is affected by MDD each year, and 17% of the popu- lation is expected to suffer from MDD in their lifetime (Blazer et al., 1994; Kessler et al., 1994). The disorder is associated with significant morbidity and mortality and is projected to become the second leading cause of disability worldwide by 2030 (Mathers and Loncar, 2006). Furthermore, the disorder is high- lighted by a heterogeneous presentation of symptoms, which makes its characterization, evaluation, and treatment difficult. Functional changes across vast circuits spanning multiple cor- tical and subcortical brain areas are thought to contribute to the symptoms comprising MDD (Drevets, 2001; Liotti and Mayberg, 2001). Nevertheless, the exact neurobiological underpinnings of depressive symptoms and various therapeutic modalities remain to be clarified. The primary treatment modalities for individuals suffering from MDD include pharmacotherapy, psychotherapy, and electroconvulsive therapy (ECT). However, these modalities fail to fully ameliorate symptoms in up to 50% of depressed in- dividuals (Nestler et al., 2002), and lifetime recurrence rates after recovery are estimated to be 35–50% (Mueller et al., 1999; Ea- ton et al., 2008). Novel approaches, including deep brain stimu- lation (DBS) and transcranial magnetic stimulation (TMS), have recently emerged as viable therapeutic options (Ressler and May- berg, 2007; George et al., 2010). Both DBS and TMS function by stimulating cortical brain areas (George et al., 1999; Mayberg et al., 2005), either through the direct delivery of current via surgi- cally implanted stimulating electrodes (DBS) or through the transcranial modulation of neural activity via the external manip- ulation of magnetic fields (TMS); however, little remains known about the brain network mechanisms whereby these modalities mediate their antidepressant effect. The prevailing hypothesis is that DBS and TMS mediate their antidepressant effect by directly activating descending prefrontal cortex (PFC) signals (Mayberg, 2009). These descending brain signals then modulate dynamic activity across subcortical limbic circuits (i.e., top-down control) that are responsible for reward processing, fear and anxiety, motivation, and circadian regula- tion. Unfortunately, it has been difficult to generate concrete evidence that supports this hypothesis given the complexity of recording the activity of widely distributed limbic circuits during Received Jan. 6, 2012; revised Nov. 3, 2012; accepted Nov. 11, 2012. Author contributions: G.F., H.E.C., and K.Dz. designed research; S.K., S.J.B., R.H., K.D.De., J.D., B.M.K., H.E.C., and K.Dz. performed research; K.Dz. contributed unpublished reagents/analytic tools; S.J.B., R.H., K.D.De., J.D., H.E.C., and K.Dz. analyzed data; S.K., S.J.B., R.H., S.T.S., B.M.K., G.F., H.E.C., and K.Dz. wrote the paper. This work was supported by National Institute of Mental Health Grants P50MH060451-09S1 and R37MH073853 (K.Dz.), American Recovery and Reinvestment Act Grant RC1-MH088434 (G.F.), and a Duke Institute for Brain Sci- ences Research Incubator Award (H.E.C. and K.Dz.). A special thanks to Freeman Hrabowski, Robert and Jane Mey- erhoff, and the Meyerhoff Scholarship Program. We thank Joao Peca for assistance with laser setup, Raag Airan, and Karl Deisseroth for helpful suggestions with optogenetic stimulation. *H.E.C. and K.Dz. contributed equally to this work. Correspondence should be addressed to Dr. Kafui Dzirasa, Department of Psychiatry and Behavioral Sci- ences, Duke University Medical Center, Box 3209, 327 Bryan Research Building, Durham, NC 27710. E-mail: [email protected]. DOI:10.1523/JNEUROSCI.0092-12.2013 Copyright © 2013 the authors 0270-6474/13/331116-14$15.00/0 1116 • The Journal of Neuroscience, January 16, 2013 • 33(3):1116 –1129
Transcript of Cortical Control of Affective Networks - The Journal of Neuroscience

Systems/Circuits
Cortical Control of Affective Networks
Sunil Kumar,1 Sherilynn J. Black,1 Rainbo Hultman,5 Steven T. Szabo,1 Kristine D. DeMaio,5 Jeanette Du,5
Brittany M. Katz,1 Guoping Feng,6 Herbert E. Covington III,3,5* and Kafui Dzirasa1,2,3,4*1Department of Psychiatry and Behavioral Sciences, 2Center for Neuroengineering, and 3Duke Institute for Brain Sciences, Duke University Medical Center,Durham, North Carolina 27710, Departments of 4Biomedical Engineering and Neurobiology and 5Psychology and Neuroscience, Duke University, Durham,North Carolina 27708, and 6Department of Brain and Cognitive Sciences, McGovern Institute for Brain Research at Massachusetts Institute of Technology,Cambridge, Massachusetts 02139
Transcranial magnetic stimulation and deep brain stimulation have emerged as therapeutic modalities for treatment refractory depres-sion; however, little remains known regarding the circuitry that mediates the therapeutic effect of these approaches. Here we show thatdirect optogenetic stimulation of prefrontal cortex (PFC) descending projection neurons in mice engineered to express Chr2 in layer Vpyramidal neurons (Thy1–Chr2 mice) models an antidepressant-like effect in mice subjected to a forced-swim test. Furthermore, weshow that this PFC stimulation induces a long-lasting suppression of anxiety-like behavior (but not conditioned social avoidance) insocially stressed Thy1–Chr2 mice: an effect that is observed �10 d after the last stimulation. Finally, we use optogenetic stimulation andmulticircuit recording techniques concurrently in Thy1–Chr2 mice to demonstrate that activation of cortical projection neurons entrainsneural oscillatory activity and drives synchrony across limbic brain areas that regulate affect. Importantly, these neural oscillatorychanges directly correlate with the temporally precise activation and suppression of limbic unit activity. Together, our findings show thatthe direct activation of cortical projection systems is sufficient to modulate activity across networks underlying affective regulation. Theyalso suggest that optogenetic stimulation of cortical projection systems may serve as a viable therapeutic strategy for treating affectivedisorders.
IntroductionMajor depressive disorder (MDD) is a complex multifactorialneuropsychiatric illness characterized by profound changes inmood, sleep, affect, and interests (American Psychiatric Associa-tion, 2000; Akil et al., 2010). At least 4% of the United Statespopulation is affected by MDD each year, and 17% of the popu-lation is expected to suffer from MDD in their lifetime (Blazer etal., 1994; Kessler et al., 1994). The disorder is associated withsignificant morbidity and mortality and is projected to becomethe second leading cause of disability worldwide by 2030(Mathers and Loncar, 2006). Furthermore, the disorder is high-lighted by a heterogeneous presentation of symptoms, whichmakes its characterization, evaluation, and treatment difficult.
Functional changes across vast circuits spanning multiple cor-tical and subcortical brain areas are thought to contribute to the
symptoms comprising MDD (Drevets, 2001; Liotti and Mayberg,2001). Nevertheless, the exact neurobiological underpinnings ofdepressive symptoms and various therapeutic modalities remainto be clarified. The primary treatment modalities for individualssuffering from MDD include pharmacotherapy, psychotherapy,and electroconvulsive therapy (ECT). However, these modalitiesfail to fully ameliorate symptoms in up to 50% of depressed in-dividuals (Nestler et al., 2002), and lifetime recurrence rates afterrecovery are estimated to be �35–50% (Mueller et al., 1999; Ea-ton et al., 2008). Novel approaches, including deep brain stimu-lation (DBS) and transcranial magnetic stimulation (TMS), haverecently emerged as viable therapeutic options (Ressler and May-berg, 2007; George et al., 2010). Both DBS and TMS function bystimulating cortical brain areas (George et al., 1999; Mayberg etal., 2005), either through the direct delivery of current via surgi-cally implanted stimulating electrodes (DBS) or through thetranscranial modulation of neural activity via the external manip-ulation of magnetic fields (TMS); however, little remains knownabout the brain network mechanisms whereby these modalitiesmediate their antidepressant effect.
The prevailing hypothesis is that DBS and TMS mediate theirantidepressant effect by directly activating descending prefrontalcortex (PFC) signals (Mayberg, 2009). These descending brainsignals then modulate dynamic activity across subcortical limbiccircuits (i.e., top-down control) that are responsible for rewardprocessing, fear and anxiety, motivation, and circadian regula-tion. Unfortunately, it has been difficult to generate concreteevidence that supports this hypothesis given the complexity ofrecording the activity of widely distributed limbic circuits during
Received Jan. 6, 2012; revised Nov. 3, 2012; accepted Nov. 11, 2012.Author contributions: G.F., H.E.C., and K.Dz. designed research; S.K., S.J.B., R.H., K.D.De., J.D., B.M.K., H.E.C., and
K.Dz. performed research; K.Dz. contributed unpublished reagents/analytic tools; S.J.B., R.H., K.D.De., J.D., H.E.C.,and K.Dz. analyzed data; S.K., S.J.B., R.H., S.T.S., B.M.K., G.F., H.E.C., and K.Dz. wrote the paper.
This work was supported by National Institute of Mental Health Grants P50MH060451-09S1 and R37MH073853(K.Dz.), American Recovery and Reinvestment Act Grant RC1-MH088434 (G.F.), and a Duke Institute for Brain Sci-ences Research Incubator Award (H.E.C. and K.Dz.). A special thanks to Freeman Hrabowski, Robert and Jane Mey-erhoff, and the Meyerhoff Scholarship Program. We thank Joao Peca for assistance with laser setup, Raag Airan, andKarl Deisseroth for helpful suggestions with optogenetic stimulation.
*H.E.C. and K.Dz. contributed equally to this work.Correspondence should be addressed to Dr. Kafui Dzirasa, Department of Psychiatry and Behavioral Sci-
ences, Duke University Medical Center, Box 3209, 327 Bryan Research Building, Durham, NC 27710. E-mail:[email protected].
DOI:10.1523/JNEUROSCI.0092-12.2013Copyright © 2013 the authors 0270-6474/13/331116-14$15.00/0
1116 • The Journal of Neuroscience, January 16, 2013 • 33(3):1116 –1129
direct activation of descending cortical pathways in both healthyand depressed individuals. Furthermore, although animal studieshave been used to generate a great deal of insight into the mech-anism of action of several treatment modalities for depressedindividuals, including pharmacotherapy and ECT (Nestler et al.,2002; Jinno and Kosaka, 2009), neuroscience tools that allowactivity to be quantified across intact brain circuits in animalsduring the manipulation of activity across specific cell types havebeen lacking.
Here we empirically assess whether direct optogenetic stimu-lation of cortical projection neurons is sufficient to modifydepression-related behaviors in mice. Furthermore, we use mul-ticircuit neurophysiological recording techniques and optoge-netic stimulation concurrently to examine the effect of corticallayer V activation on neural activity across distributed limbicnetworks responsible for affective regulation.
Materials and MethodsAnimal care and use. Male mice were used for all experiments. Thy1–ChR2– eYFP line 18 mice (Thy1–Chr2 mice) were generated as describedpreviously (Arenkiel et al., 2007). These mice are also commercially avail-able through The Jackson Laboratories [B6.Cg–Tg(Thy1–Chr2/EYFP)18Gfng/J]. Thy1–Chr2 (line 18) mice express the ChR2–YFPfusion protein in layer V cortical neurons [including prelimbic cortex(PrL); see Figure 1], CA1 and CA3 pyramidal neurons of the hippocam-pus, cerebellar mossy fibers, neurons in the thalamus, neurons in themidbrain and brainstem, and the olfactory bulb mitral cells. Consistentwith previous reports (Arenkiel et al., 2007; Kahn et al., 2011), pyramidalneurons in layer 2/3 of PrL do not express Chr2 in the Thy1–Chr2 line 18mice. Mice were housed on a 12 h light/dark cycle, three to five per cageand maintained in a humidity- and temperature-controlled room withfood and water available ad libitum. Behavioral experiments were initi-ated after a 1 week recovery and were conducted during the dark cycle.Neurophysiological experiments were initiated after a 2– 4 week recoveryand were conducted during the light cycle while animals were in theirhome cage. All of the implanted Thy1–Chr2 animals were subjected to a20 min recording session wherein the stimulating laser was driven at 0.1Hz. Eight of the implanted Thy1–Chr2 mice were also subjected to a 2min recording sessions in which �30 s of baseline neurophysiologicalactivity was acquired before and after 60 s of continuous cortical stimu-lation using an exogenous spike pattern.
All studies were conducted with approved protocols from the DukeUniversity Institutional Animal Care and Use Committees and were inaccordance with the National Institutes of Health Guidelines for the Careand Use of Laboratory Animals.
Surgery. Four- to eight-month-old Thy1–Chr2 mice were anesthetizedwith ketamine (100 mg/kg) and xylazine (10 mg/kg) and placed in astereotaxic device, and metal ground screws were secured to the skullabove cerebellum and anterior cranium. For physiology experiments, atotal of 32– 46 tungsten microwires were arranged in bundle arrays offour to eight wires (each wire separated by at least 250 �m) and im-planted as shown in Table 1 (all coordinates are measured from bregma).
Full details of the procedures for electrode construction and surgicalimplantation have been described previously (Dzirasa et al., 2011a).
Twelve Thy1–Chr2 mice were implanted with recording electrodes inall four brain areas, and one wild-type (WT) mouse was implanted inPrL. A mono fiber-optic cannula coupled to a 2.5 mm metal ferrule[numerical aperture 0.22; 100 �m (inner diameter), 125 �m buffer
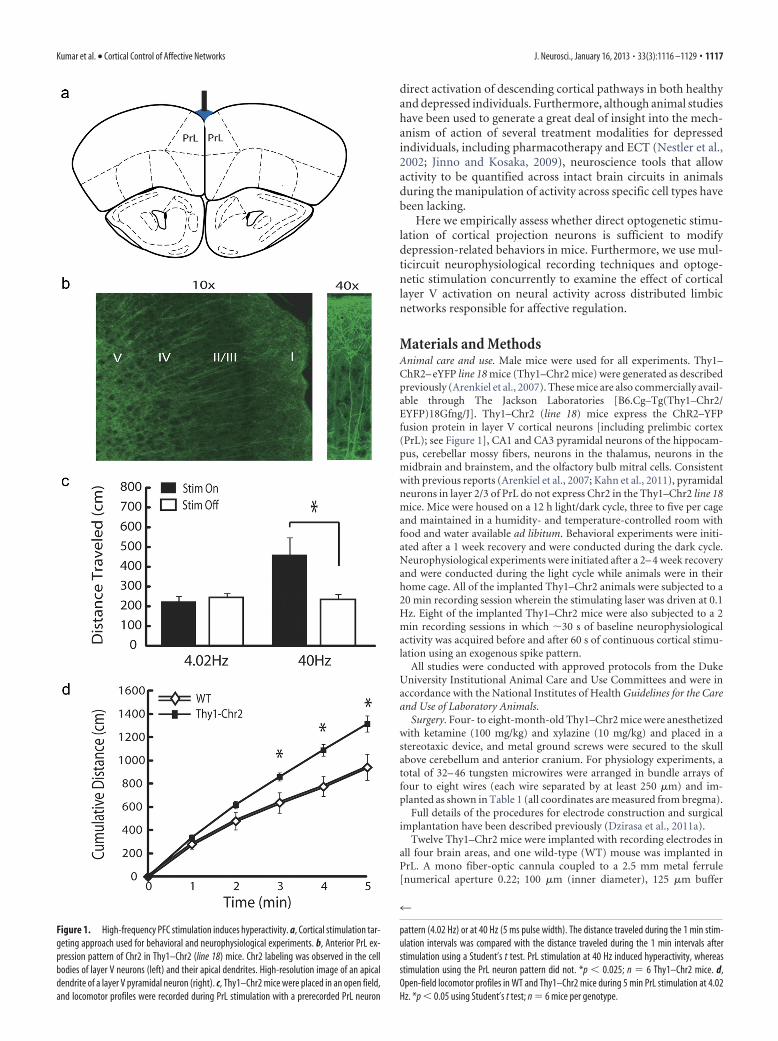
Figure 1. High-frequency PFC stimulation induces hyperactivity. a, Cortical stimulation tar-geting approach used for behavioral and neurophysiological experiments. b, Anterior PrL ex-pression pattern of Chr2 in Thy1–Chr2 (line 18) mice. Chr2 labeling was observed in the cellbodies of layer V neurons (left) and their apical dendrites. High-resolution image of an apicaldendrite of a layer V pyramidal neuron (right). c, Thy1–Chr2 mice were placed in an open field,and locomotor profiles were recorded during PrL stimulation with a prerecorded PrL neuron
4
pattern (4.02 Hz) or at 40 Hz (5 ms pulse width). The distance traveled during the 1 min stim-ulation intervals was compared with the distance traveled during the 1 min intervals afterstimulation using a Student’s t test. PrL stimulation at 40 Hz induced hyperactivity, whereasstimulation using the PrL neuron pattern did not. *p � 0.025; n � 6 Thy1–Chr2 mice. d,Open-field locomotor profiles in WT and Thy1–Chr2 mice during 5 min PrL stimulation at 4.02Hz. *p � 0.05 using Student’s t test; n � 6 mice per genotype.
Kumar et al. • Cortical Control of Affective Networks J. Neurosci., January 16, 2013 • 33(3):1116 –1129 • 1117

(outer diameter); MFC_100/125-0.22; Doric Lenses] was built directlyinto the PrL cortex bundle. The tip of the fiber was secured 800 �m abovethe tip of the tungsten microwires such that the optical fiber lay just abovethe dura above the midline after implantation. Implanted electrodes wereanchored to ground screws using dental acrylic. For all behavioral exper-iments, 8- to 10-week-old Thy1–Chr2 mice and their littermate controls(N � 42 mice) were implanted with a single mono fiber-optic cannula inPrL 250 �m below the dura [anteroposterior (AP), 2.65 mm; mediolat-eral (ML), 0 mm to bregma]. All behavioral experiments were initiatedafter a 7 d recovery period after surgery. Note that, for our behavioralexperiments using chronic subordination stress, mice were implantedwith stimulating electrodes before being exposed to the stress paradigm.For c-fos experiments, 18- to 24-week-old Thy1–Chr2 mice (n � 12)were implanted with a single mono fiber-optic cannula in PrL 250 �mbelow the dura (AP, 2.65 mm; ML, 0 mm to bregma). All behavioralexperiments were initiated after a 7–14 d recovery period after surgery.
In vivo light stimulation. Laser output was controlled by digital inputfrom the Cerebus acquisition system using custom-written MATLABscripts for neurophysiology experiments and during the forced-swimtest. For chronic stimulation experiments, an arbitrary function genera-tor (model 33210A; Agilent Technologies) was used to drive the laser.The stimulation pattern used for both systems was identical. For all ex-periments presented in the main text, each spike of the stimulus traininitiated a 10 ms light pulse. The prerecorded neuron firing pattern usedto drive the laser was based on a PFC layer V pyramidal neuron. Thisneuron exhibited a mean firing rate (4.02 Hz), consistent with the meanfiring rate of PFC pyramidal neurons described in other studies (Jonesand Wilson, 2005). Our physiology experiments were performed with alaser power of 2.5 mW (corresponding to 250 mW/mm 2). The tip of thefiber-optic cannula was located above the superior sagittal sinus andabove the dura. Assuming the attenuation of light above the gray matteris predicted by a simple conical model for diffusion through saline (Yi-zhar et al., 2011), we expect a maximum illumination of 9.2 mW/mm 2
over a cortical surface area of 0.217 mm 2 and a maximum light spread of300 �m. All behavioral experiments were conducted with a laser power of2.0 mW (corresponding to 200 mW/mm 2), with the optic stimulatingfiber placed 250 �m below the dorsal surface of the dura at the midline.For these experiments, we expect a maximum illumination of 23.3 mW/mm 2 over a cortical surface area of 0.102 mm 2 and a maximum lightspread of 400 �m. For the neurophysiological anatomical control exper-iment, the optic fiber was placed directly on the brain surface directlyabove primary sensory cortex (S1) [AP, �0.1 mm; ML, �3.25 mm;dorsoventral (DV), 0.75 from bregma], and light stimulation was deliv-ered at 20 mW/mm 2. Laser output was measured using a Power meter(PM100D; Thorlabs).
Controlling for tissue-heating effects during high-intensity cortical stim-ulation. Five minutes of high-intensity light stimulation has the potentialto damage cortical tissues and to induce physiological and behavioralchanges. To account for this potential confound, the tip of the opticstimulating fiber was placed into the superior sagittal sinus such thatthere was constant blood flow over the stimulated cortical tissue. Thisapproach was used to increase the likelihood for the dissipation of heatthat resulted from high-intensity light stimulation. Second, all controlexperiments were performed in WT littermates that received identicalcortical stimulations, and behavioral comparisons were made acrossgenotype.
Forced-swim test. Thy1–Chr2 mice and their WT littermate controlswere anesthetized with isoflurane and connected to an optic stimulatingfiber. After a 15 min recovery period, mice were placed into a 4000 mlgraduated beaker filled with water (26°C) to a depth of 7 inches. The mice
remained in the water for 5 min during cortical stimulation and werethen removed and allowed to dry in a clean dry cage before they werereturned to their home cage. The water was changed between each sub-ject. Mice were monitored using a side-mounted camera, and video datawere scored for the total time each mouse spent immobile. The experi-menter scoring the behavior was blind to the genotype of the mice, andimmobility was defined as no volitional body or limb movement. Addi-tional control experiments were performed in unimplanted animals.Data were analyzed using a two-way ANOVA, followed by aBonferroni’s-corrected Student’s t test at � � 0.05.
Open-field test. Mice were anesthetized with isoflurane and connectedto an optic stimulating fiber. After a 15 min recovery period, mice wereplaced into a 10.75 � 10.75-inch open-field test environment (MED-OFA-MS; Med Associates). For our initial experiments, six Thy1–Chr2mice were placed in an open field, and locomotor profiles were recordedfor 5 min. Light stimulations were delivered at 40 Hz (5 ms pulse width)and 4.02 Hz (prerecorded neuron pattern) for 1 min during minutes 2and 4 of the open-field test. Three Thy1–Chr2 mice received the 40 Hzstimulus first, and the other three mice received the 4.02 Hz stimulusfirst. Animals were used only once, and statistical comparisons of loco-motor behavior were made between the 1 min period in which eachanimal received PFC stimulation and the 1 min period immediately afterstimulation using a paired Student’s t test at � � 0.05.
For the second set of experiments, locomotor profiles were monitoredin Thy1–Chr2 and WT control mice while light stimulation was deliveredusing the 1 min prerecorded PrL neuron pattern repeated across the 5min test period. Additional control experiments were performed in un-implanted animals. Data were analyzed using a two-way ANOVA, fol-lowed by a Bonferroni’s-corrected Student’s t test at � � 0.05.
Chronic subordination stress and chronic PrL stimulation. Thy1–Chr2and WT littermate control mice were implanted with stimulating fibersand 10 d later subjected to 15 d of chronic social defeat stress as describedpreviously (Berton et al., 2006; Covington et al., 2010). Briefly, mice wereexposed to a novel CD1 aggressor for 5 min daily and then separatedfrom the aggressor behind a protective barrier for the remainder of theday. During bouts of exposure to the CD1 mice, hallmark behavioralsigns of subordination stress were observed, including escape, submissivepostures (i.e., defensive upright and supine), and freezing. Immediatelyafter the last social defeat episode, all mice were housed individually.Forty-eight hours after the last social defeat encounter, mice received 5min of daily cortical stimulation using the same prerecorded PrL neuronpattern used for our physiology experiments. All animals were stimulatedin their home cage for 14 days. Ten to 14 d after the last cortical stimu-lation, mice were tested for social avoidance and anxiety-related behav-iors. Single-housed C57BL/6J mice were used as an additional control forthe social interaction test.
Social interaction test. Social interaction was measured as describedpreviously (Berton et al., 2006). Briefly, mice were placed within a novelarena with a small animal cage located at one end. Each socially stressedmouse’s movement was monitored for 5 min in the presence of a CD1mouse. Locomotor activity measurements (distance traveled) and infor-mation pertaining to the duration spent within the interaction zone wasquantified using Ethovision 3.0 software. Data were analyzed using aStudent’s t test at � � 0.05.
Elevated plus maze test. The elevated plus maze (EPM) was designedusing black Plexiglas fitted with white-bottom surfaces to providecontrast, and tests were conducted as described previously (Monteg-gia et al., 2007). Briefly, mice were placed in the center of the plusmaze and allowed to freely explore the maze for 5 min under well-litconditions (Covington et al., 2010). The position of each mouse in themaze was monitored with video tracking equipment (Ethovision) anda ceiling-mounted camera. Data were analyzed using a Student’s t testat � � 0.05.
Neurophysiological data acquisition. Neuronal activity was sampled at30 kHz, high-pass filtered at 250 Hz, sorted online, and stored using theCerebus acquisition system (Blackrock Microsystems). Neuronal datawere referenced online against a wire within the same brain area that didnot exhibit a signal-to-noise ratio greater than 3:1. At the end of therecording, cells were sorted again using an offline sorting algorithm
Table 1. Implantation coordinates measured from bregma
Area AP (mm) ML (mm) DV (mm)
PrL �2.65 �0.25 �0.8NAc �1.25 �1.15 �3.9BA �1.58 2.5 4.75VTA �3.3 �0.3 �4.25
1118 • J. Neurosci., January 16, 2013 • 33(3):1116 –1129 Kumar et al. • Cortical Control of Affective Networks

(Plexon) to confirm the quality of the recorded cells. Local field poten-tials (LFPs) were bandpass filtered at 0.3–500 Hz and stored at 1000 Hz.An online 60 Hz line noise-cancelation algorithm was applied to neuro-physiological signals at the time of acquisition, and all neurophysiologi-
cal recordings were referenced to a ground wire connected to bothground screws. Notably, wires tested from the two screws were iso-electric, demonstrating that ground loops were not introduced by thisdesign.
Determination of the effect of cortical stimulation on LFP oscillatorypower. A second sliding window Fourier transform was applied to theLFP signal using MATLAB (MathWorks). Parameters were chosen toallow a frequency and temporal resolution of 0.125 Hz and 500 ms,respectively. The mean oscillatory power was then calculated for eachfrequency band of interest for the time intervals before, during, andafter cortical stimulation. To determine the effect of cortical stimu-lation on limbic oscillatory power, oscillatory power observed duringcortical stimulation was averaged across all LFPs recorded from thesame area within a mouse and compared with the mean of the oscil-latory power observed before and after cortical stimulation using apaired t test at � � 0.05, followed by a false discovery rate (FDR)correction (Benjamini et al., 2001) within each frequency band (n � 8mice for all areas).
Determination of the effect of cortical stimulation on cross-area spectralsynchrony. Two LFPs were randomly chosen from each recorded brainarea, and four cross-area synchrony functions were calculated foreach LFP pair using the MATLAB mscohere function. Parameters werechosen to allow a frequency and temporal resolution of 0.125 Hz and500 ms, respectively. To determine the effect of cortical stimulationon limbic synchrony, coherence values observed during cortical stim-ulation were averaged across the four cross-area synchrony functionscalculated for each brain area pair and compared to the mean of thecoherence values observed before and after cortical stimulation usinga paired t test at � � 0.05, followed by an FDR correction for the fivebrain area pairs within each frequency band (n � 8 mice for all othercomparisons).
Determination of the effect of cortical stimulation on limbic unit activity.Neuronal activity was recorded for 20 min while cortex was stimulated at0.1 Hz. Neuronal activity referenced to the light onset was averaged in 20ms bin, shifted by 1 ms, and averaged across the 120 trials to construct theperievent time histogram. Distributions of the histogram from the[�5000, �2000 ms] interval were considered baseline activity. We thendetermined which 20 ms bins slid in 1 ms steps during an epoch spanningfrom the [0, 300 ms] interval met the criteria for modulation by corticalstimulation. A unit was considered to be modulated by cortical stimula-tion if at least 20 bins had firing rates either larger than a threshold of 99%above baseline activity or smaller than a threshold of 94% below baselineactivity (several neurons displayed both temporally delayed increasesand decreases in their firing rates after single-pulse cortical stimulation).This approach was modeled after perievent analytical approaches used inother published studies (Jin and Costa, 2010). Correlations between peri-stimulus firing rate time histograms and mean LFP evoked responseswere calculated for the [0, 100 ms] interval using a linear regression at� � 0.05.
Excitotoxic lesions. Ibotenic acid was used to induce selective excito-toxic lesions in the PrL of Thy1 mice (Hamani et al., 2010). Briefly,ibotenic acid (Abcam) was dissolved in PBS, pH 7.4, containing 0.01% ofacetic acid. Mice were anesthetized and placed in a stereotaxic device asdescribed above. Next, 2 �g of ibotenic acid (dissolved in 0.4 �l of PBS)was injected at four target sites using a 5 �l Hamilton syringe (AP, 2.4 or2.9 mm; ML, �0.35 and �0.35 mm; DV, 0.8 mm measured frombregma). The solution was injected at a rate of 0.1 �l/min, and the needlewas left in place for 5 min after each injection to ensure the diffusion ofthe solution in the brain tissue. Mice were then returned to their homecage, and electrodes were implanted 2 weeks later as described above.One Thy1–Chr2 mouse was also injected unilaterally with ibotenic acidand used for the generation of histological images.
Histology and immunohistochemistry. To characterize the PrL Chr2expression pattern in the Thy1–Chr2 (line 18) mice, an 8-week-oldmouse was perfused, and its brain was incubated for 3 d in 4% parafor-maldehyde (PFA), followed by 24 h in 30% sucrose. Free-floating sec-tions (50 �m) were cut using a microtome, mounted on glass slides, andexamined near the PrL (�2.6 mm AP to bregma) for the presence of YFPto identify expression of Chr2 as well as DAPI to identify nuclei using a
Figure 2. Antidepressant-like effect of chronic cortical stimulation in chronically stressedmice. a, Thy1–Chr2 mice exposed to chronic subordination stress displayed similar interactiontimes as their WT littermates during the social interaction test after chronic cortical stimulation.Chronically stressed mice exhibited significantly lower social interaction scores than non-stressed nonstimulated single-housed control mice. **p � 0.001 using Student’s t test; n �6 –7 per genotype. b, Thy1–Chr2 mice exposed to chronic subordination stress exhibited similaropen-field exploration profiles as their chronically stressed WT littermates after chronic corticalstimulation. c, Chronically stressed and chronically stimulated Thy1–Chr2 mice spent more timein the open arm of an EPM compared with their WT littermate controls. *p � 0.05 usingStudent’s t test; n � 7 per genotype (left). No significant differences in open arm time wereobserved between single-housed (nonstressed) Thy1–Chr2 and WT control mice after chronicstimulation. P � 0.05 using Student’s t test; n � 6 –7 per genotype.
Kumar et al. • Cortical Control of Affective Networks J. Neurosci., January 16, 2013 • 33(3):1116 –1129 • 1119
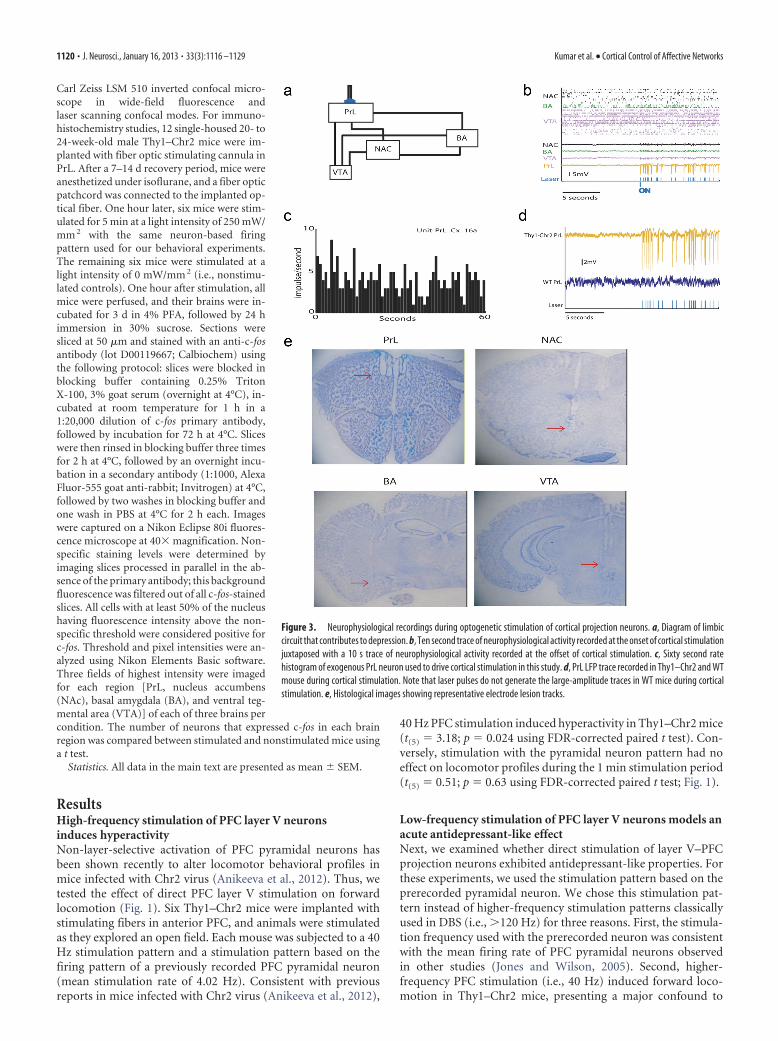
Carl Zeiss LSM 510 inverted confocal micro-scope in wide-field fluorescence andlaser scanning confocal modes. For immuno-histochemistry studies, 12 single-housed 20- to24-week-old male Thy1–Chr2 mice were im-planted with fiber optic stimulating cannula inPrL. After a 7–14 d recovery period, mice wereanesthetized under isoflurane, and a fiber opticpatchcord was connected to the implanted op-tical fiber. One hour later, six mice were stim-ulated for 5 min at a light intensity of 250 mW/mm 2 with the same neuron-based firingpattern used for our behavioral experiments.The remaining six mice were stimulated at alight intensity of 0 mW/mm 2 (i.e., nonstimu-lated controls). One hour after stimulation, allmice were perfused, and their brains were in-cubated for 3 d in 4% PFA, followed by 24 himmersion in 30% sucrose. Sections weresliced at 50 �m and stained with an anti-c-fosantibody (lot D00119667; Calbiochem) usingthe following protocol: slices were blocked inblocking buffer containing 0.25% TritonX-100, 3% goat serum (overnight at 4°C), in-cubated at room temperature for 1 h in a1:20,000 dilution of c-fos primary antibody,followed by incubation for 72 h at 4°C. Sliceswere then rinsed in blocking buffer three timesfor 2 h at 4°C, followed by an overnight incu-bation in a secondary antibody (1:1000, AlexaFluor-555 goat anti-rabbit; Invitrogen) at 4°C,followed by two washes in blocking buffer andone wash in PBS at 4°C for 2 h each. Imageswere captured on a Nikon Eclipse 80i fluores-cence microscope at 40� magnification. Non-specific staining levels were determined byimaging slices processed in parallel in the ab-sence of the primary antibody; this backgroundfluorescence was filtered out of all c-fos-stainedslices. All cells with at least 50% of the nucleushaving fluorescence intensity above the non-specific threshold were considered positive forc-fos. Threshold and pixel intensities were an-alyzed using Nikon Elements Basic software.Three fields of highest intensity were imagedfor each region [PrL, nucleus accumbens(NAc), basal amygdala (BA), and ventral teg-mental area (VTA)] of each of three brains percondition. The number of neurons that expressed c-fos in each brainregion was compared between stimulated and nonstimulated mice usinga t test.
Statistics. All data in the main text are presented as mean � SEM.
ResultsHigh-frequency stimulation of PFC layer V neuronsinduces hyperactivityNon-layer-selective activation of PFC pyramidal neurons hasbeen shown recently to alter locomotor behavioral profiles inmice infected with Chr2 virus (Anikeeva et al., 2012). Thus, wetested the effect of direct PFC layer V stimulation on forwardlocomotion (Fig. 1). Six Thy1–Chr2 mice were implanted withstimulating fibers in anterior PFC, and animals were stimulatedas they explored an open field. Each mouse was subjected to a 40Hz stimulation pattern and a stimulation pattern based on thefiring pattern of a previously recorded PFC pyramidal neuron(mean stimulation rate of 4.02 Hz). Consistent with previousreports in mice infected with Chr2 virus (Anikeeva et al., 2012),
40 Hz PFC stimulation induced hyperactivity in Thy1–Chr2 mice(t(5) � 3.18; p � 0.024 using FDR-corrected paired t test). Con-versely, stimulation with the pyramidal neuron pattern had noeffect on locomotor profiles during the 1 min stimulation period(t(5) � 0.51; p � 0.63 using FDR-corrected paired t test; Fig. 1).
Low-frequency stimulation of PFC layer V neurons models anacute antidepressant-like effectNext, we examined whether direct stimulation of layer V–PFCprojection neurons exhibited antidepressant-like properties. Forthese experiments, we used the stimulation pattern based on theprerecorded pyramidal neuron. We chose this stimulation pat-tern instead of higher-frequency stimulation patterns classicallyused in DBS (i.e., �120 Hz) for three reasons. First, the stimula-tion frequency used with the prerecorded neuron was consistentwith the mean firing rate of PFC pyramidal neurons observedin other studies (Jones and Wilson, 2005). Second, higher-frequency PFC stimulation (i.e., 40 Hz) induced forward loco-motion in Thy1–Chr2 mice, presenting a major confound to
Figure 3. Neurophysiological recordings during optogenetic stimulation of cortical projection neurons. a, Diagram of limbiccircuit that contributes to depression. b, Ten second trace of neurophysiological activity recorded at the onset of cortical stimulationjuxtaposed with a 10 s trace of neurophysiological activity recorded at the offset of cortical stimulation. c, Sixty second ratehistogram of exogenous PrL neuron used to drive cortical stimulation in this study. d, PrL LFP trace recorded in Thy1–Chr2 and WTmouse during cortical stimulation. Note that laser pulses do not generate the large-amplitude traces in WT mice during corticalstimulation. e, Histological images showing representative electrode lesion tracks.
1120 • J. Neurosci., January 16, 2013 • 33(3):1116 –1129 Kumar et al. • Cortical Control of Affective Networks

measuring the effect of layer V PFC stimulation on classicdepression-related behaviors. Finally, previous studies havedemonstrated that the fidelity of Chr2 stimulation is significantlylimited above 40 Hz (Gunaydin et al., 2010).
Seven Thy1–Chr2 mice and their WT littermate controls wereimplanted with optogenetic stimulating fibers in PrL, and micewere subjected to a classic forced-swim test during PrL stimula-tion. For these experiments, animals were stimulated with the 1min pattern used in our initial behavioral experiments repeatedover the course of the 5 min behavioral experiments (acute stim-ulation). Our results indicated that stimulated Thy1–Chr2 micedisplayed significantly lower immobility times compared withtheir stimulated WT littermate controls during the forced-swimtest [two-way ANOVA of genotype � stimulation found signifi-cant genotype � stimulation effects (F(1,27) � 8.36, p � 0.008);post hoc tests using Bonferroni’s-corrected Student’s t test foundsignificant genotype effects (immobility time, 32.4 � 7.3 and6.4 � 2.5 s for stimulated Thy1–Chr2 and their WT littermates,respectively; t(12) � 3.65; p � 0.003; n � 7 mice per genotype)].No differences in immobility time were observed between non-stimulated Thy1–Chr2 mice and their littermate controls (im-mobility time, 153.9 � 7.9 and 133.8 � 11.6 s for Thy1–Chr2 andtheir WT littermates, respectively; t(12) � 1.43; p � 0.18 usingBonferroni’s-corrected Student’s t test; n � 7 mice per genotype;
note that these mice were not implantedwith stimulating fibers before theforced-swim test). Thy1–Chr2 micestimulated with the PrL neuron patternalso traveled greater distances in anopen-field test compared with their lit-termate controls [two-way ANOVA ofgenotype � stimulation revealed a signif-icant genotype� stimulation interaction ef-fect (F(1,24) � 5.22, p � 0.0328)]. Post hoctests of distance traveled found significantgenotype effects within the stimulatedgroup of mice (distance traveled,1324.0 � 57.9 and 942.1 � 113.7 s forThy1–Chr2 and their WT littermates, re-spectively; t(9) � 3.16; p � 0.01 usingBonferroni’s-corrected Student’s t test;n � 5–7 mice per genotype) but notwithin the nonstimulated group (distancetraveled, 975.3 � 84.7 and 1045.7 � 119.6s for Thy1–Chr2 and their WT littermates,respectively; t(12) � 0.48; p � 0.64 usingBonferroni’s-corrected Student’s t test;n � 5–7 mice per genotype; note thatthese mice were not implanted with stim-ulating fibers before the open-field test).Notably, cortical stimulation did not di-rectly induce hyperactivity, because nostatistical differences were observed be-tween stimulated Thy1–Chr2 mice andWT littermate controls during the firstminute of open-field exploration (t(9) �1.32; p � 0.22 using Student’s t test).Rather, cortical stimulation in Thy1–Chr2 mice sustained the initial behavioralresponse observed in both WT and Thy1–Chr2 mice (Fig. 1d). This effect was con-sistent with the psychomotor activatingproperties exhibited by antidepressant
agents (Brocco et al., 2002).
PFC stimulation models a chronic antidepressant-like effectin socially stressed miceChronic subordination stress is most often followed by the ex-pression of a long-lasting behavioral syndrome in mice that ischaracterized by social avoidance, impaired coping responses toother environmental stressors, and anxiety-like behaviors (Krish-nan et al., 2007). Notably, these stress-induced behaviors can bereversed by chronic, but not acute, administration of conven-tional antidepressants (Berton et al., 2006). Thus, we also exam-ined whether chronic PrL stimulation was sufficient to model anantidepressant-like response in chronically stressed mice. Thy1–Chr2 mice and their WT littermate controls were subjected to15 d of chronic subordination stress. Following chronic stressexposure, WT and Thy1-Chr2 mice were repeatedly stimulatedwith the same 5 min pattern used during the other depression-related tests. Stimulations were delivered daily over 14 consecu-tive days. WT and Thy1–Chr2 mice were tested 10 d after the laststimulation in a social interaction test to quantify their socialavoidance and an EPM test to quantify their anxiety-related be-havior. No additional cortical stimulations were performed dur-ing these tests. Chronically stressed and stimulated Thy1–Chr2
Figure 4. Optogenetic stimulation of cortical projection neurons increases oscillatory power across limbic brain areas. a, LFPspectral trace during optogenetic stimulation of cortical projection neurons. b, Change in oscillatory power during optogeneticcortical stimulation. *p � 0.05 using Student’s t test, followed by an FDR correction for multiple comparisons; n � 8 for all brainareas.
Kumar et al. • Cortical Control of Affective Networks J. Neurosci., January 16, 2013 • 33(3):1116 –1129 • 1121

mice exhibited decreased social interaction scores compared withsingle-housed control mice (t(11) � 5.74; p � 0.00013 using Stu-dent’s t test); however, no significant differences in social inter-action (t(12) � 0.35; p � 0.73 using Student’s t test) or open-fieldexploration (t(12) � 0.75; p � 0.47 using Student’s t test) wereobserved between Thy1–Chr2 mice and their chronically stressedand stimulated WT littermate controls (Fig. 2a,b). Conversely,chronically stressed and stimulated Thy1–Chr2 mice spent sig-nificantly more time in the open arms of the EPM compared withWT mice [two-way ANOVA of genotype � stress conditionrevealedasignificantgenotype�stress interactioneffect(F(1,26)� 8.06,p � 0.0093); and post hoc tests using Student’s t test (t(12) � 2.66;p � 0.012) revealed a significant genotype effect in the chronicallystressed group; Fig. 2c, left]. Together, these experiments demon-strate that chronic stimulation of PFC projection neurons in-duces an anxiolytic-like effect in mice exposed to chronic socialsubordination stress. Furthermore, this effect is long lasting giventhat it is observed 10 –14 d after the last session of cortical stim-ulation. Notably, no significant differences in EPM open-armtime were observed between chronically stimulated Thy1–Chr2
mice and their WT littermate controls that were not exposed tochronic social defeat stress [post hoc tests using Student’s t test(t(11) � 1.16; p � 0.27) found no significant genotype effect in thenonstressed group; Fig. 2c, right].
Layer V PFC stimulation drives limbic beta synchronyTwelve Thy1–Chr2 mice were implanted with a fiber-optic stim-ulating cannula directly above anterior PrL (an anatomical sub-division of medial PFC). Microwire array recording electrodeswere also implanted across multiple limbic brain regions, includ-ing PrL, NAc, BA, and VTA. Mice implanted with the microwireelectrode assemblies recovered well and behaved normally aftersurgery, allowing us to concurrently record LFP and unit activityacross entire limbic circuits in awake, non-restrained conditionsduring direct stimulation of cortical projecting neurons (Fig.3a,b). The same spike train pattern used for our behavioral ex-periments was used to drive the stimulating laser (Fig. 3c). Usingthis stimulating pattern, we found that direct activation of PrLprojection neurons was sufficient to enhance LFP oscillatory
Figure 5. Cortical stimulation modulates spectral synchrony across distributed limbic circuits. a, Spectral coherence plots generated for LFP pairs recorded across limbic brain areas during PrLstimulation. b, Circuits that demonstrated significant changes in synchrony during cortical stimulation are shown in green (increases) or red (decreases) with their respective percentage coherencechange from baseline. p � 0.05 using Student’s t test, followed by an FDR correction for multiple comparisons; n � 8 for all brain area pairs. c, Spectral coherence plots generated for LFP pairsrecorded across limbic brain areas in a mouse during fixed frequency PrL stimulation at 4 Hz (note that 4 Hz stimulation tended to enhance limbic beta synchrony).
1122 • J. Neurosci., January 16, 2013 • 33(3):1116 –1129 Kumar et al. • Cortical Control of Affective Networks

power across all of the limbic brain regions we recorded (p � 0.05for all comparisons across brain areas and frequency bands ex-amined; see Fig. 4). Notably, these observations were not attrib-utable to stimulus artifact introduced by the direct effect of lightexposure on the PrL electrode tips (Cardin et al., 2009), becausethey were not observed in WT mice subjected to the same stim-ulation and recording protocol (Fig. 3d).
LFP synchrony has been implicated as a neurophysiologicalcorrelate of brain circuit function (Seidenbecher et al., 2003;Jones and Wilson, 2005; Dzirasa et al., 2009; Adhikari et al.,2010). Because direct PrL stimulation modulated limbic oscilla-tory power, we also quantified changes in spectral coherenceacross LFP pairs during the recording session. Interestingly, we
found that PrL stimulation suppressed PrL–NAc delta syn-chrony, and drove beta synchrony across the entire limbic circuit(p � 0.05 for all comparisons using FDR-corrected t test; Fig. 5).Conversely, optogenetic stimulation of PrL projection neuronshad no effect on theta or gamma synchrony across the circuit.Notably, because the mean firing rate of the exogenous cell usedto drive the stimulating laser was 4.02 Hz and PrL stimulation ata fixed 4 Hz frequency tended to enhance limbic beta synchronyas well (Fig. 5c), the changes in beta synchrony observed acrosslimbic circuits during cortical stimulation did not simply reflectthe activation pattern of the stimulating laser. Rather, the changesin synchrony observed across this frequency range likely corre-sponded with the activation of neural networks responsible for
Figure 6. Stimulation of cortical projection neurons is necessary to enhance limbic synchrony. a, LFP activity and limbic synchrony during S1 stimulation in a Thy1–Chr2 mouse (n � 1). b,Example LFP activity and limbic synchrony during PrL stimulation in a Thy1–Chr2 mouse pretreated with ibotenic acid (n � 2). Example histological image of PrL in Thy1–Chr2 mouse treatedunilaterally with ibotenic acid. Note the decreased eYPF expression in the hemisphere treated with ibotenic acid (IBO).
Kumar et al. • Cortical Control of Affective Networks J. Neurosci., January 16, 2013 • 33(3):1116 –1129 • 1123

the modulation of physiologically rele-vant circuits. Importantly, no enhance-ment of limbic beta synchrony wasobserved in a mouse pretreated with ibo-tenic acid in PrL or during stimulation ofS1 or using the same PrL neuron-basedpattern (i.e., 4.02 Hz; Fig. 6). Together,these findings demonstrate that direct PrLstimulation induces circuit-selectivechanges in limbic neural oscillatorydynamics.
After demonstrating that direct stim-ulation of PrL projection neurons is suf-ficient to modulate limbic oscillatorypower and the synchronization of lim-bic brain networks, we examinedwhether these changes were accompa-nied by changes in the timing of unitfiring across limbic brain areas. Forthese experiments, PrL was stimulatedat a frequency of 0.1 Hz. Neurophysio-logical activity was then recorded for anadditional 20 min, and perievent firingrate histograms were calculated relativeto each light pulse. Our findings indi-cated that 73.7% of the remote limbicneurons (101 of 137 neurons) displayedsignificant changes in their firing ratesafter single-pulse PrL stimulation (Fig.7; for example of remote units modu-lated by single-pulse PrL stimulation,see Fig. 8). Effects differed widely withinand across brains regions, with someunits decreasing their firing rate afterPrL stimulation, some units increasing their firing rate afterPrL stimulation, and other units exhibiting both increases anddecreases in their firing rates at various temporal delays afterPrL stimulation. In several cases, unit activity changes couldbe observed �150 ms after light pulses. Notably, 80.3% (110 of137) of the units analyzed exhibited stimulation-inducedchanges in their firing rates that correlated with locally re-corded light-induced evoked potentials [i.e., light-triggeredaverages (LTAs) of LFP activity recorded from the same mi-crowire as each unit], providing strong evidence that the lim-bic oscillatory changes observed after cortical stimulationwere locally relevant. Several of the neurons recorded exhib-ited higher firing rates during temporal offsets consistent withthe positive evoked response in LTA signals (Type A), whereasothers exhibited higher firing rates during periods ofthe stronger negative evoked response (Type B). These differ-ent response patterns may reflect circuit-based response prop-erties based on the profile of afferent connections thatmodulate the activity of each unit. When we examined theprofile of population of neurons recorded within each region,we found that Type A BA neurons exhibited a significantlyhigher correlation with their local LTAs than Type B BA neu-rons (although no significant difference was observed in theproportion of Type A and Type B BA neurons; p � 0.015 usingWilcoxon’s rank-sum test; p � 0.05 using Z test, followed byFDR correction; Fig. 8). No significant differences were ob-served in the LTA coupling strength of Type A and Type Bneurons across any of the other brain areas examined ( p �0.20 and 0.07 using Wilcoxon’s rank-sum test for NAc and
VTA neurons, respectively); however, a significantly higherproportion of Type A neurons was observed in NAc and VTA( p � 0.05 using Z test, followed by FDR correction). Together,these results raise the hypothesis that PrL efferents may pref-erentially activate BA, NAc, and VTA inhibitory networks be-cause Type A neurons (by definition) exhibit higher firingrates at time points in which the LFP was more hyperpolarized(more positive extracellular potential). Altogether, these re-sults demonstrate that direct stimulation of PrL modulatesneural oscillatory power, oscillatory phase timing, cross-areasynchrony, and unit activity across vast limbic circuits respon-sible for mood regulation, affective control, fear and rewardprocessing, and circadian regulation. Importantly, LFPs re-corded concurrently from distinct brain areas within a mousedid not exhibit identical stimulation-locked responses (aswould be expected if the remote signals resulted from electri-cal artifacts introduced by activating the laser; Fig. 9), thetemporal nature of the remote evoked responses did not cor-respond with the distance of each site from the stimulatingfiber (as would be expected in the case of volume conductionof the high-amplitude PrL signals that follow light stimula-tion), and the evoked responses were consistent with local unitactivity. Thus, these neurophysiological changes were not at-tributable to stimulation artifact or the volume conduction ofthe high-amplitude PrL signals.
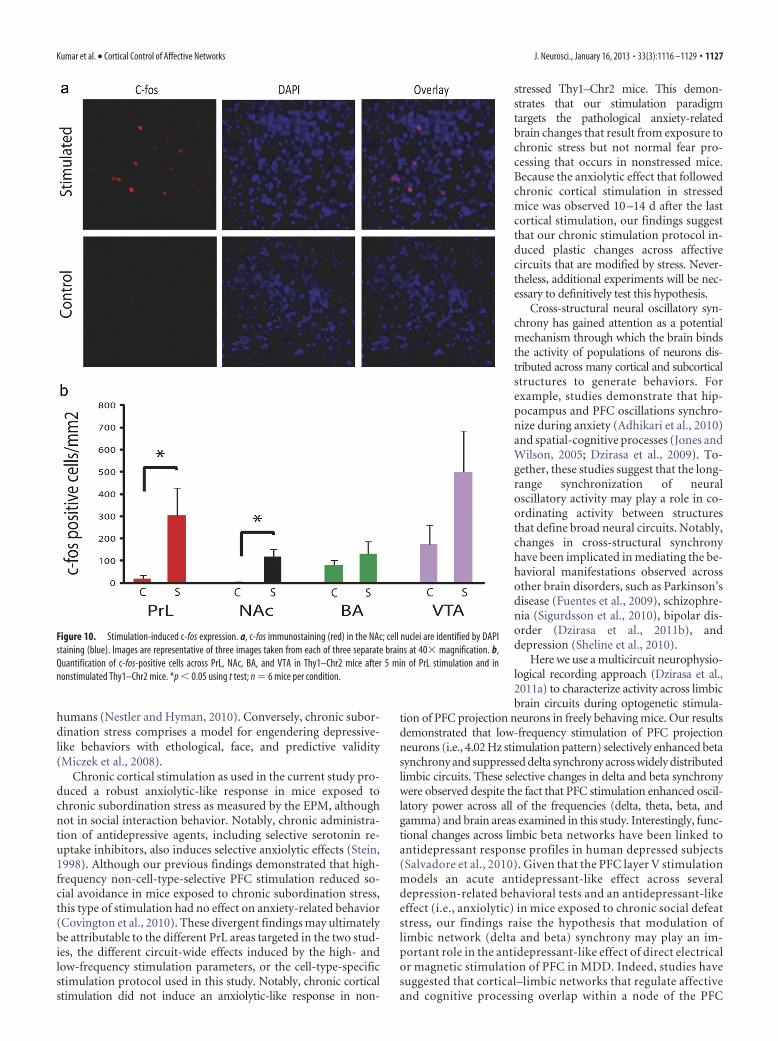
Finally, we examined the effect of PrL stimulation on the ex-pression of the immediate early gene c-fos across limbic brainareas. When we compared stimulated Thy1–Chr2 mice and theirnonstimulated Thy1–Chr2 littermates, we found that PrL stimu-
Figure 7. Example of neuron isolated from NAc. From left to right, Depiction of the extracellularly recorded waveform ofthe unit (x-axis, 1600 �s; y-axis, 185 �V), projection of the clusters corresponding to the unit and the noise based onanalysis of the first two principal components of the waveforms recorded (x-axis, PC1; y-axis, PC2), and interspike intervalhistogram.
1124 • J. Neurosci., January 16, 2013 • 33(3):1116 –1129 Kumar et al. • Cortical Control of Affective Networks

Figure 8. Cortical stimulation synchronizes unit activity across limbic circuits. PrL was stimulated at 0.1 Hz for 20 min for a total of 120 trials. a, Each plot depicts a spike waveform (800 �s width,top), the perievent spike raster plot (middle), and the perievent firing rate time histogram (bottom) for the same neuron during cortical stimulation. Time 0 (red line) is the time of cortical stimulationduring each trial. A total of 78.6% of NAc neurons (33 of 42), 53.3% of BA neurons (16 of 30), and 80.0% of VTA neurons (52 of 65) were significantly modulated by cortical stimulation. Blue linesrepresent LTA functions calculated from LFPs recorded simultaneously from the same microwire as each isolated unit. b, A total of 90.5% of NAc neurons (38 of 42), 60.0% of BA neurons (18 of 30),and 83.1% of VTA neurons (54 of 65) displayed activities that positively correlated (�Corr; Type A; see NAC_6_04a for example) or negatively correlated (�Corr; Type B; see NAC_4_05d forexample) with locally recorded LTAs after single-pulse cortical stimulation. *p � 0.05 using Mann–Whitney U test.
Kumar et al. • Cortical Control of Affective Networks J. Neurosci., January 16, 2013 • 33(3):1116 –1129 • 1125

lation tended to increase c-fos expressionacross multiple limbic brain areas, al-though only PrL and NAc reached statis-tical significance (p � 0.05 usingunpaired t test; Fig. 10). Notably, thesedata provide unequivocal evidence thatPrL stimulation modulates the firing rateof neurons distributed across target areasof PrL efferents.
DiscussionMDD is a heterogeneous multifactorialneuropsychiatric illness characterized byprofound changes in sleep, affect, inter-ests, and outlook on life (American Psy-chiatric Association, 2000; Akil et al.,2010). Although it has been difficult to re-capitulate all of the salient aspects ofMDD in a single animal (Krishnan andNestler, 2008; Nestler and Hyman, 2010),animal models have served as powerfultools to investigate the mechanism of ac-tion of modalities used to ameliorate de-pressive symptoms (Nestler et al., 2002;Charney and Manji, 2004; Jinno andKosaka, 2009; Akil et al., 2010). Here weshow that the direct activation of PrL pro-jection systems is sufficient to modulateoscillatory activity across limbic networksand induce limbic beta synchrony. More-over, we show that the oscillatory changesobserved across limbic brain areas duringcortical stimulation directly correlatewith changes in local unit activity andthat cortical stimulation differentiallyaffects local networks and c-fos expressionacross each of the limbic brain regions weexamined. Finally, we demonstrate thechronic PrL stimulation modifies affect-related behavior in chronically stressedanimals.
High-frequency electrical stimulationof infralimbic (IL) cortex (i.e., DBS) pro-motes antidepressant-like properties inrodents subjected to a forced-swim test (Hamani et al., 2010).Notably, IL DBS continues to induce an antidepressant-like re-sponse after the ablation of local neurons within IL cortex, sug-gesting that electrical stimulation of pass through fibers (such asthose originating from PrL) may play a role in mediating theantidepressant-like effects of IL DBS. Our findings demonstratethat similar responses can be recapitulated by directly stimulatingexcitatory projection neurons in PrL. Thy1–Chr2 (line 18) miceexpress the ChR2–YFP fusion protein in layer V cortical neuronsand several subcortical brain areas (Arenkiel et al., 2007). Al-though the Thy1–Chr2 transgenics may express Chr2 in the axonterminals of several PrL afferents, the neurophysiological effectswe observe during PrL light stimulation is unlikely attributable toantidromic activation of these fibers. First, BA projections to PrLdo not express Chr2 in the line 18 mice. Second, DA neurons thatproject from VTA to PrL do not express Chr2 in line 18 mice.Third, there are no direct projections from striatum (i.e., NAc) toPrL in rodents. Fourth, PrL efferents provide monosynaptic orpolysynaptic input to many of the subcortical brain regions that
express Chr2 in the Thy1–Chr2 (line 18) mice, and the efferentoutput from PrL to these subcortical brain regions far exceeds theafferent input from these brain regions to PrL (Douglas andMartin, 2004; Logothetis, 2008). Finally, pretreatment with ibo-tenic acid [which induces excitotoxic lesions in local neuronswhile sparing pass-through fibers (Hamani et al., 2010)] sup-presses the enhancement of limbic synchrony observed duringPrL stimulation. Thus, we are confident that the neurophysiolog-ical and behavioral changes induced by PrL stimulation are at-tributable to the activation of descending cortical efferents andnot antidromic activation of PrL afferents.
Decreased immobility time on the forced-swim test after theacute administration of various pharmacological agents is widelyused as a model for predicting the clinical efficacy of antidepres-sants. Although our findings show that acute PrL activation reca-pitulates the effect of antidepressants on the forced-swim test andthe psychomotor activating effect of antidepressants in the openfield (Brocco et al., 2002), it remains unclear the extent to whichthe forced-swim test in and of itself actually models MDD in
Figure 9. Evoked potential recorded from limbic brain areas during low-frequency cortical stimulation (0.1 Hz). Evoked poten-tials are shown as the mean � SEM for all of the LFP channels recorded across each structure within a single mouse during a singletrial. This mouse had recording electrodes implanted in dorsal raphe (DR) (AP, �4.5 mm; ML, 0.3 mm; and DV, �2.25 mm frombregma) and medial dorsal thalamus (THAL) (AP, �1.6 mm; ML, 0.3 mm; and DV, �2.9 mm from bregma) in addition to the otherbrain areas described in this study. Note that several brain areas that were most distal to the stimulation site (i.e., DR and VTA)exhibited maximum/minimum potential peaks that occurred before the proximal brain areas (i.e., NAc).
1126 • J. Neurosci., January 16, 2013 • 33(3):1116 –1129 Kumar et al. • Cortical Control of Affective Networks
humans (Nestler and Hyman, 2010). Conversely, chronic subor-dination stress comprises a model for engendering depressive-like behaviors with ethological, face, and predictive validity(Miczek et al., 2008).
Chronic cortical stimulation as used in the current study pro-duced a robust anxiolytic-like response in mice exposed tochronic subordination stress as measured by the EPM, althoughnot in social interaction behavior. Notably, chronic administra-tion of antidepressive agents, including selective serotonin re-uptake inhibitors, also induces selective anxiolytic effects (Stein,1998). Although our previous findings demonstrated that high-frequency non-cell-type-selective PFC stimulation reduced so-cial avoidance in mice exposed to chronic subordination stress,this type of stimulation had no effect on anxiety-related behavior(Covington et al., 2010). These divergent findings may ultimatelybe attributable to the different PrL areas targeted in the two stud-ies, the different circuit-wide effects induced by the high- andlow-frequency stimulation parameters, or the cell-type-specificstimulation protocol used in this study. Notably, chronic corticalstimulation did not induce an anxiolytic-like response in non-
stressed Thy1–Chr2 mice. This demon-strates that our stimulation paradigmtargets the pathological anxiety-relatedbrain changes that result from exposure tochronic stress but not normal fear pro-cessing that occurs in nonstressed mice.Because the anxiolytic effect that followedchronic cortical stimulation in stressedmice was observed 10 –14 d after the lastcortical stimulation, our findings suggestthat our chronic stimulation protocol in-duced plastic changes across affectivecircuits that are modified by stress. Never-theless, additional experiments will be nec-essary to definitively test this hypothesis.
Cross-structural neural oscillatory syn-chrony has gained attention as a potentialmechanism through which the brain bindsthe activity of populations of neurons dis-tributed across many cortical and subcorticalstructures to generate behaviors. Forexample, studies demonstrate that hip-pocampus and PFC oscillations synchro-nize during anxiety (Adhikari et al., 2010)and spatial-cognitive processes (Jones andWilson, 2005; Dzirasa et al., 2009). To-gether, these studies suggest that the long-range synchronization of neuraloscillatory activity may play a role in co-ordinating activity between structuresthat define broad neural circuits. Notably,changes in cross-structural synchronyhave been implicated in mediating the be-havioral manifestations observed acrossother brain disorders, such as Parkinson’sdisease (Fuentes et al., 2009), schizophre-nia (Sigurdsson et al., 2010), bipolar dis-order (Dzirasa et al., 2011b), anddepression (Sheline et al., 2010).
Here we use a multicircuit neurophysio-logical recording approach (Dzirasa et al.,2011a) to characterize activity across limbicbrain circuits during optogenetic stimula-
tion of PFC projection neurons in freely behaving mice. Our resultsdemonstrated that low-frequency stimulation of PFC projectionneurons (i.e., 4.02 Hz stimulation pattern) selectively enhanced betasynchrony and suppressed delta synchrony across widely distributedlimbic circuits. These selective changes in delta and beta synchronywere observed despite the fact that PFC stimulation enhanced oscil-latory power across all of the frequencies (delta, theta, beta, andgamma) and brain areas examined in this study. Interestingly, func-tional changes across limbic beta networks have been linked toantidepressant response profiles in human depressed subjects(Salvadore et al., 2010). Given that the PFC layer V stimulationmodels an acute antidepressant-like effect across severaldepression-related behavioral tests and an antidepressant-likeeffect (i.e., anxiolytic) in mice exposed to chronic social defeatstress, our findings raise the hypothesis that modulation oflimbic network (delta and beta) synchrony may play an im-portant role in the antidepressant-like effect of direct electricalor magnetic stimulation of PFC in MDD. Indeed, studies havesuggested that cortical–limbic networks that regulate affectiveand cognitive processing overlap within a node of the PFC
Figure 10. Stimulation-induced c-fos expression. a, c-fos immunostaining (red) in the NAc; cell nuclei are identified by DAPIstaining (blue). Images are representative of three images taken from each of three separate brains at 40� magnification. b,Quantification of c-fos-positive cells across PrL, NAc, BA, and VTA in Thy1–Chr2 mice after 5 min of PrL stimulation and innonstimulated Thy1–Chr2 mice. *p � 0.05 using t test; n � 6 mice per condition.
Kumar et al. • Cortical Control of Affective Networks J. Neurosci., January 16, 2013 • 33(3):1116 –1129 • 1127

(i.e., the dorsal nexus), and alterations in synchrony betweenthis node and several limbic brain areas have been described inMDD (Sheline et al., 2010). Nevertheless, additional studies inpatients with MDD will be necessary to definitely test thishypothesis.
ConclusionsOverall, our findings provide strong support for the top-downmodulation hypothesis proposed to underlie the mechanism ofaction of DBS and TMS in treatment refractory MDD (Mayberg,2009). The unveiling of the circuit-based interactions betweenPFC and limbic brain regions, with millisecond resolution, holdspromise toward greater understanding of the neurobiologicalunderpinnings of MDD and the targeted therapeutics used totreat the disorder. Most importantly, these findings may ulti-mately serve to enhance the targeting of antidepressant therapies,including DBS and TMS, and they may facilitate the developmentof the optogenetic-based therapeutic approaches to target dys-functional circuits in affective and anxiety disorders.
ReferencesAdhikari A, Topiwala MA, Gordon JA (2010) Synchronized activity be-
tween the ventral hippocampus and the medial prefrontal cortex duringanxiety. Neuron 65:257–269. CrossRef Medline
Akil H, Brenner S, Kandel E, Kendler KS, King MC, Scolnick E, Watson JD,Zoghbi HY (2010) Medicine. The future of psychiatric research: ge-nomes and neural circuits. Science 327:1580 –1581. CrossRef Medline
American Psychiatric Association (2000) Diagnostic and statistical manualof mental disorders DSM-IV-TR. Washington, DC: American PsychiatricAssociation.
Anikeeva P, Andalman AS, Witten I, Warden M, Goshen I, Grosenick L, Gunay-din LA, Frank LM, Deisseroth K (2012) Optetrode: a multichannel readoutfor optogenetic control in freely moving mice. Nat Neurosci 15:163–170.CrossRef Medline
Arenkiel BR, Peca J, Davison IG, Feliciano C, Deisseroth K, Augustine GJ,Ehlers MD, Feng G (2007) In vivo light-induced activation of neuralcircuitry in transgenic mice expressing channelrhodopsin-2. Neuron 54:205–218. CrossRef Medline
Benjamini Y, Drai D, Elmer G, Kafkafi N, Golani I (2001) Controlling thefalse discovery rate in behavior genetics research. Behav Brain Res 125:279 –284. CrossRef Medline
Berton O, McClung CA, Dileone RJ, Krishnan V, Renthal W, Russo SJ, GrahamD, Tsankova NM, Bolanos CA, Rios M, Monteggia LM, Self DW, Nestler EJ(2006) Essential role of BDNF in the mesolimbic dopamine pathway in so-cial defeat stress. Science 311:864–868. CrossRef Medline
Blazer DG, Kessler RC, McGonagle KA, Swartz MS (1994) The prevalenceand distribution of major depression in a national community sample:the National Comorbidity Survey. Am J Psychiatry 151:979 –986. Medline
Brocco M, Dekeyne A, Veiga S, Girardon S, Millan MJ (2002) Inductionof hyperlocomotion in mice exposed to a novel environment by inhi-bition of serotonin reuptake. A pharmacological characterization ofdiverse classes of antidepressant agents. Pharmacol Biochem Behav71:667– 680. CrossRef Medline
Cardin JA, Carlen M, Meletis K, Knoblich U, Zhang F, Deisseroth K, Tsai LH,Moore CI (2009) Driving fast-spiking cells induces gamma rhythm andcontrols sensory responses. Nature 459:663– 667. CrossRef Medline
Charney DS, Manji HK (2004) Life stress, genes, and depression: multiplepathways lead to increased risk and new opportunities for intervention.Sci STKE 2004:re5. CrossRef Medline
Covington HE 3rd, Lobo MK, Maze I, Vialou V, Hyman JM, Zaman S,LaPlant Q, Mouzon E, Ghose S, Tamminga CA, Neve RL, Deisseroth K,Nestler EJ (2010) Antidepressant effect of optogenetic stimulation of themedial prefrontal cortex. J Neurosci 30:16082–16090. CrossRef Medline
Douglas RJ, Martin KA (2004) Neuronal circuits of the neocortex. AnnuRev Neurosci 27:419 – 451. CrossRef Medline
Drevets WC (2001) Neuroimaging and neuropathological studies of de-pression: implications for the cognitive-emotional features of mood dis-orders. Curr Opin Neurobiol 11:240 –249. CrossRef Medline
Dzirasa K, Ramsey AJ, Takahashi DY, Stapleton J, Potes JM, Williams JK,
Gainetdinov RR, Sameshima K, Caron MG, Nicolelis MA (2009) Hy-perdopaminergia and NMDA receptor hypofunction disrupt neuralphase signaling. J Neurosci 29:8215– 8224. CrossRef Medline
Dzirasa K, Fuentes R, Kumar S, Potes JM, Nicolelis MA (2011a) Chronic invivo multi-circuit neurophysiological recordings in mice. J NeurosciMethods 195:36 – 46. CrossRef Medline
Dzirasa K, McGarity DL, Bhattacharya A, Kumar S, Takahashi JS, Dunson D,McClung CA, Nicolelis MA (2011b) Impaired limbic gamma oscillatorysynchrony during anxiety-related behavior in a genetic mouse model ofbipolar mania. J Neurosci 31:6449 – 6456. CrossRef Medline
Eaton WW, Shao H, Nestadt G, Lee HB, Bienvenu OJ, Zandi P (2008)Population-based study of first onset and chronicity in major depressivedisorder. Arch Gen Psychiatry 65:513–520. CrossRef Medline
Fuentes R, Petersson P, Siesser WB, Caron MG, Nicolelis MA (2009) Spinalcord stimulation restores locomotion in animal models of Parkinson’sdisease. Science 323:1578 –1582. CrossRef Medline
George MS, Lisanby SH, Sackeim HA (1999) Transcranial magnetic stimu-lation: applications in neuropsychiatry. Arch Gen Psychiatry 56:300 –311.CrossRef Medline
George MS, Lisanby SH, Avery D, McDonald WM, Durkalski V, Pavlicova M,Anderson B, Nahas Z, Bulow P, Zarkowski P, Holtzheimer PE 3rd,Schwartz T, Sackeim HA (2010) Daily left prefrontal transcranial mag-netic stimulation therapy for major depressive disorder: a sham-controlled randomized trial. Arch Gen Psychiatry 67:507–516. CrossRefMedline
Gunaydin LA, Yizhar O, Berndt A, Sohal VS, Deisseroth K, Hegemann P(2010) Ultrafast optogenetic control. Nat Neurosci 13:387–392.CrossRef Medline
Hamani C, Diwan M, Macedo CE, Brandao ML, Shumake J, Gonzalez-LimaF, Raymond R, Lozano AM, Fletcher PJ, Nobrega JN (2010)Antidepressant-like effects of medial prefrontal cortex deep brain stimu-lation in rats. Biol Psychiatry 67:117–124. CrossRef Medline
Jin X, Costa RM (2010) Start/stop signals emerge in nigrostriatal circuitsduring sequence learning. Nature 466:457– 462. CrossRef Medline
Jinno S, Kosaka T (2009) Neuronal circuit-dependent alterations in expres-sion of two isoforms of glutamic acid decarboxylase in the hippocampusfollowing electroconvulsive shock: a stereology-based study. Hippocam-pus 19:1130 –1141. CrossRef Medline
Jones MW, Wilson MA (2005) Theta rhythms coordinate hippocampal-prefrontal interactions in a spatial memory task. PLoS Biol 3:e402.CrossRef Medline
Kahn I, Desai M, Knoblich U, Bernstein J, Henninger M, Graybiel AM, Boy-den ES, Buckner RL, Moore CI (2011) Characterization of the func-tional MRI response temporal linearity via optical control of neocorticalpyramidal neurons. J Neurosci 31:15086 –15091. CrossRef Medline
Kessler RC, McGonagle KA, Zhao S, Nelson CB, Hughes M, Eshleman S,Wittchen HU, Kendler KS (1994) Lifetime and 12-month prevalence ofDSM-III-R psychiatric disorders in the United States. Results from theNational Comorbidity Survey. Arch Gen Psychiatry 51:8 –19. CrossRefMedline
Krishnan V, Nestler EJ (2008) The molecular neurobiology of depression.Nature 455:894 –902. CrossRef Medline
Krishnan V, Han MH, Graham DL, Berton O, Renthal W, Russo SJ, LaplantQ, Graham A, Lutter M, Lagace DC, Ghose S, Reister R, Tannous P, GreenTA, Neve RL, Chakravarty S, Kumar A, Eisch AJ, Self DW, Lee FS, Tam-minga CA, Cooper DC, Gershenfeld HK, Nestler EJ (2007) Molecularadaptations underlying susceptibility and resistance to social defeat inbrain reward regions. Cell 131:391– 404. CrossRef Medline
Liotti M, Mayberg HS (2001) The role of functional neuroimaging in theneuropsychology of depression. J Clin Exp Neuropsychol 23:121–136.CrossRef Medline
Logothetis NK (2008) What we can do and what we cannot do with fMRI.Nature 453:869 – 878. CrossRef Medline
Mathers CD, Loncar D (2006) Projections of global mortality and burden ofdisease from 2002 to 2030. PLoS Med 3:e442. CrossRef Medline
Mayberg HS (2009) Targeted electrode-based modulation of neural circuitsfor depression. J Clin Invest 119:717–725. CrossRef Medline
Mayberg HS, Lozano AM, Voon V, McNeely HE, Seminowicz D, Hamani C,Schwalb JM, Kennedy SH (2005) Deep brain stimulation for treatment-resistant depression. Neuron 45:651– 660. CrossRef Medline
Miczek KA, Yap JJ, Covington HE 3rd (2008) Social stress, therapeutics and
1128 • J. Neurosci., January 16, 2013 • 33(3):1116 –1129 Kumar et al. • Cortical Control of Affective Networks

drug abuse: preclinical models of escalated and depressed intake. Phar-macol Ther 120:102–128. CrossRef Medline
Monteggia LM, Luikart B, Barrot M, Theobold D, Malkovska I, Nef S, ParadaLF, Nestler EJ (2007) Brain-derived neurotrophic factor conditionalknockouts show gender differences in depression-related behaviors. BiolPsychiatry 61:187–197. CrossRef Medline
Mueller TI, Leon AC, Keller MB, Solomon DA, Endicott J, Coryell W, War-shaw M, Maser JD (1999) Recurrence after recovery from major depres-sive disorder during 15 years of observational follow-up. Am J Psychiatry156:1000 –1006. Medline
Nestler EJ, Hyman SE (2010) Animal models of neuropsychiatric disorders.Nat Neurosci 13:1161–1169. CrossRef Medline
Nestler EJ, Barrot M, DiLeone RJ, Eisch AJ, Gold SJ, Monteggia LM (2002)Neurobiology of depression. Neuron 34:13–25. CrossRef Medline
Ressler KJ, Mayberg HS (2007) Targeting abnormal neural circuits in moodand anxiety disorders: from the laboratory to the clinic. Nat Neurosci10:1116 –1124. CrossRef Medline
Salvadore G, Cornwell BR, Sambataro F, Latov D, Colon-Rosario V, Carver F,Holroyd T, DiazGranados N, Machado-Vieira R, Grillon C, Drevets WC,
Zarate CA Jr (2010) Anterior cingulate desynchronization and func-tional connectivity with the amygdala during a working memory taskpredict rapid antidepressant response to ketamine. Neuropsychopharma-cology 35:1415–1422. CrossRef Medline
Seidenbecher T, Laxmi TR, Stork O, Pape HC (2003) Amygdalar and hip-pocampal theta rhythm synchronization during fear memory retrieval.Science 301:846 – 850. CrossRef Medline
Sheline YI, Price JL, Yan Z, Mintun MA (2010) Resting-state functionalMRI in depression unmasks increased connectivity between networks viathe dorsal nexus. Proc Natl Acad Sci USA 107:11020 –11025. CrossRefMedline
Sigurdsson T, Stark KL, Karayiorgou M, Gogos JA, Gordon JA (2010) Im-paired hippocampal-prefrontal synchrony in a genetic mouse model ofschizophrenia. Nature 464:763–767. CrossRef Medline
Stein MB (1998) Medication treatments for panic disorder and social pho-bia. Depress Anxiety 7:134 –138. CrossRef Medline
Yizhar O, Fenno LE, Davidson TJ, Mogri M, Deisseroth K (2011) Optoge-netics in neural systems. Neuron 71:9 –34. CrossRef Medline
Kumar et al. • Cortical Control of Affective Networks J. Neurosci., January 16, 2013 • 33(3):1116 –1129 • 1129