Corrosion of Steel in High-Strength Self-Compacting ... Masterbuilder February 2 168 Corrosion of...
10
The Masterbuilder | February 2015 | www.masterbuilder.co.in 168 Corrosion of Steel in High-Strength Self-Compacting Concrete Exposed to Saline Environment Abstract: A research work was carried out to investigate the effectiveness of high-strength self-compacting concrete (SF-R) in controlling corrosion of embedded steel. Rein- forced concrete cylinders and plain cubes were subjected to 5%NaCl solution. Slump flow, J-ring, V-funnel, compressive strength, electrical resistance, and electrochemical tests were conducted. Corrosion resisting characteristics of steel were examined by monitoring corrosion potential, polar- ization resistance, corrosion currents, and Tafel plots. The relationship between corrosion current density and corro- sion potential was established. Results were compared with characteristics of a grade 40MPa reference concrete (R) and grade 70MPa conventional self-compacting concrete (SP). Results indicated that at 270 days of exposure, the corrosion currents for steel in SF-R were 63- and 16-fold lower com- pared to those of steel in R and SP concretes, respectively. This concrete showed a considerable increase in electrical resistance and compressive strength of 96MPa at 28 days of exposure. Relying on corrosion risk classification based on corrosion current densities and corrosion potentials, the steel in SF-R concrete is definitely in the passive condition. The splendid durability performance of steel in SF-R concrete linked to adorable self-compacting features could furnish numerous opportunities for future structural applications in severe environmental conditions. Corrosion of reinforcing steel in concrete and the high repair and rehabilitation costs of structures associated with materials failures are nowadays a matter of considerable concern and forcing the engineers to become durability conscious. An increasing number of incidents of structural problems arising from corrosion of steel associated with chloride intrusion have been reported from different parts of the world [1, 2]. The damage to concrete resulting from corrosion of steel may lead to a reduction in service life or precocious structural damage due to loss of bond between steel and concrete and reduction of steel cross-section- al area [3].Therefore, construction engineer should focus on producing dense, high-quality concrete with very low permeability which consequently limits the intrusion of the corrosion inducing substances. Building elements made of high-strength concrete are usually densely reinforced. The small distance between reinforcing bars may lead to defects in concrete. Therefore, suitable compaction is nec- essary to ensure that adequate strength and durability are achieved. Insufficient compaction will lead to the inclusion of voids, which not only lead to a reduction in strength but also strongly influence the natural physical and chemical pro- tection of embedded steel reinforcement afforded by con- crete. Accordingly, the utilization of high-strength self com- pacting concrete in structural elements exposed to saline environment may provide splendid performance in terms of self-compacting features without any external means of consolidation [4]. Furthermore, the wonderful flowability, filling ability, and high resistance to segregation of SCC lead to consistent and dense microstructure characterized by the low porosity of the matrix and interfacial transition zone and consequently enhance the electrical resistance and limit the transmission properties of concrete. These features may promote the durability characteristics and conserve the re- inforcing steel versus corrosion [5]. The low capillary poros- ity and high electrical resistance limit the chloride penetra- tion and impede the electrochemical reaction and therefore prevent corrosion of steel reinforcement. Numerous researchers have been investigating various corrosion resistance characteristics and related durabili- ty features of SCC and confirmed to be superior to normal concrete (NC). Their investigations involved essentially the permeation properties [6], steel-concrete interface defects [7], chloride penetration [8, 9], oxygen permeability and ac- celerated carbonation [8], electrical resistivity, porosity, and transport properties [10], structural performance under four-point loading after exposing to corrosive environment [11], chloride permeability [12, 13], diffusion coefficient [13], reinforcement corrosion initiation and chloride ion content [14, 15], and corrosion loss of steel [10, 14]. Despite vital im- portance and extensive application of SCC in chloride lad- en environments, extremely little research work [7, 12] has been published about some electrochemical behaviors of steel in self-compacting concrete exposed to the severe saline environment. The main objective of the current research work is to Hana A. Yousif, 1,2 Farqad F. Al-Hadeethi, 3 Bashar Al-Nabilsy, 4 and Amani N. Abdelhadi 3 1 Building and Construction Engineering Department, University of Technology, Iraq 2 Building Research Center, Royal Scientific Society (RSS), Jordan 3 Scientific Research Center, Applied Science Sector, Royal Scientific Society,Jordan 4 Conformity and Quality Institutional Company, Jordan REPAIR & REHAB
Transcript of Corrosion of Steel in High-Strength Self-Compacting ... Masterbuilder February 2 168 Corrosion of...

The
Mas
terb
uild
er |
Febr
uary
201
5 | w
ww
.mas
terb
uild
er.c
o.in
168
Corrosion of Steel in High-Strength Self-Compacting Concrete Exposed to Saline Environment
Abstract: A research work was carried out to investigate the effectiveness of high-strength self-compacting concrete (SF-R) in controlling corrosion of embedded steel. Rein-forced concrete cylinders and plain cubes were subjected to 5%NaCl solution. Slump flow, J-ring, V-funnel, compressive strength, electrical resistance, and electrochemical tests were conducted. Corrosion resisting characteristics of steel were examined by monitoring corrosion potential, polar-ization resistance, corrosion currents, and Tafel plots. The relationship between corrosion current density and corro-sion potential was established. Results were compared with characteristics of a grade 40MPa reference concrete (R) and grade 70MPa conventional self-compacting concrete (SP). Results indicated that at 270 days of exposure, the corrosion currents for steel in SF-R were 63- and 16-fold lower com-pared to those of steel in R and SP concretes, respectively. This concrete showed a considerable increase in electrical resistance and compressive strength of 96MPa at 28 days of exposure. Relying on corrosion risk classification based on corrosion current densities and corrosion potentials, the steel in SF-R concrete is definitely in the passive condition. The splendid durability performance of steel in SF-R concrete linked to adorable self-compacting features could furnish numerous opportunities for future structural applications in severe environmentalconditions.
Corrosion of reinforcing steel in concrete and the high repair and rehabilitation costs of structures associated with materials failures are nowadays a matter of considerable concern and forcing the engineers to become durability conscious. An increasing number of incidents of structural problems arising from corrosion of steel associated with chloride intrusion have been reported from different parts of the world [1, 2]. The damage to concrete resulting from corrosion of steel may lead to a reduction in service life or precocious structural damage due to loss of bond between steel and concrete and reduction of steel cross-section-al area [3].Therefore, construction engineer should focus on producing dense, high-quality concrete with very low permeability which consequently limits the intrusion of the corrosion inducing substances. Building elements made
of high-strength concrete are usually densely reinforced. The small distance between reinforcing bars may lead to defects in concrete. Therefore, suitable compaction is nec-essary to ensure that adequate strength and durability are achieved. Insufficient compaction will lead to the inclusion of voids, which not only lead to a reduction in strength but also strongly influence the natural physical and chemical pro-tection of embedded steel reinforcement afforded by con-crete. Accordingly, the utilization of high-strength self com-pacting concrete in structural elements exposed to saline environment may provide splendid performance in terms of self-compacting features without any external means of consolidation [4]. Furthermore, the wonderful flowability, filling ability, and high resistance to segregation of SCC lead to consistent and dense microstructure characterized by the low porosity of the matrix and interfacial transition zone and consequently enhance the electrical resistance and limit the transmission properties of concrete. These features may promote the durability characteristics and conserve the re-inforcing steel versus corrosion [5]. The low capillary poros-ity and high electrical resistance limit the chloride penetra-tion and impede the electrochemical reaction and therefore prevent corrosion of steel reinforcement.
Numerous researchers have been investigating various corrosion resistance characteristics and related durabili-ty features of SCC and confirmed to be superior to normal concrete (NC). Their investigations involved essentially the permeation properties [6], steel-concrete interface defects [7], chloride penetration [8, 9], oxygen permeability and ac-celerated carbonation [8], electrical resistivity, porosity, and transport properties [10], structural performance under four-point loading after exposing to corrosive environment [11], chloride permeability [12, 13], diffusion coefficient [13], reinforcement corrosion initiation and chloride ion content [14, 15], and corrosion loss of steel [10, 14]. Despite vital im-portance and extensive application of SCC in chloride lad-en environments, extremely little research work [7, 12] has been published about some electrochemical behaviors of steel in self-compacting concrete exposed to the severe saline environment.
The main objective of the current research work is to
Hana A. Yousif,1,2 Farqad F. Al-Hadeethi,3 Bashar Al-Nabilsy,4 and Amani N. Abdelhadi3
1Building and Construction Engineering Department, University of Technology, Iraq2Building Research Center, Royal Scientific Society (RSS), Jordan3Scientific Research Center, Applied Science Sector, Royal Scientific Society,Jordan4Conformity and Quality Institutional Company, Jordan
REPAIR & REHAB

169The M
asterbuilder | February 2015 | ww
w.m
asterbuilder.co.in
investigate the electrochemical corrosion performance of reinforcing steel in high-strength self-compacted concrete. The concrete incorporated high performance super plasticizer and silica fume as a partial replacement by weight of ce-ment as well as an addition to cement. The electrochemical corrosion resisting characteristics of steel were examined by monitoring half-cell potentials, linear polarization resis-tance, corrosion currents, and Tafel plots. The strength of the SCC and the DC electrical resistance of the corrosion carrying media were also examined. The results of this study provide a vital reference for future structural application and design, particularly for structures exposed to deicing salts and those located in a coastal marine environment.
Research Significance
Intensive research studies were required to examine corrosion resisting characteristics of steel in SCC. The per-formance of reinforced SCC in aggressive environment may diverge widely depending on the mix formulation. Therefore, investigations addressing the influence of the various types of powders, their specific surface area, and mix design on the flowability, resistance to segregation, permeability, and du-rability of steel in the SCC are needed to manage the elec-trochemical reactions and meet the design life under certain environmental conditions.
The utilization of high-strength self-compacting concrete (HS-SCC) has increased vastly worldwide, and their applica-tions were expanded to structural members situated in se-vere environmental conditions. However, the electrochem-ical corrosion which was extremely important concern has not been investigated yet and was very limited for steel in SCC. Moreover, well controlled HS-SCC may produce a high durability system, provide lower electronic conduction and high electrical resistance that hinders the flow of the corro-sion currents, maintain high pH level in the vicinity of steel, improve corrosion resisting characteristics, and extend the service life of the structure.
the production of HS-SCC. Silica fume (SF) contained greater than 90%SiO2 and less than 3%carbon.The chemical composi-tion of cement (C) and SF according to the producer is shown in Table 1. “Flocrete PC260” from Don Construction Products (DCP) Ltd. based on polycarboxylic ether polymer was used as a high-performance superplasticizer (SP) for reducing water content of the mix. It meets the requirements of ASTM C 494 Type A and F [18]. A mixture of 40% Swelh sand and 60% Sel sand and crushed coarse aggregate with particle sizes 12.5 to 4.75mm conforming to ASTM C 33 [19] were used. Table 2 lists the details of the mix proportions. Steel reinforcement with an effective diameter of 15.8mmwas cal-culated based on unit weight of steel, and the weight of the rebar of 305mm in length was used.
Four types of concrete mixes were used; reference con-crete mix (R) was designed to have 28 days characteristic compressive strength of 40MPa with a slump of 180mm, and conventional self-compacting concrete (SP) incorporating only 3% SP was designed to yield 28 days strength of 70MPa.
Further, two HS-SCC were used: SF-R and SF-A concretes incorporating 3% SP and 10% SF as a partial replacement by weight of cement for the former and as an addition to the latter. There is no standard method for the design of SCC mixes. Mix design often uses volumes as key parameters because of the importance of the need to overfill the voids between the ag-gregate particles [20]. The details of the mixes are presented in Table 2.
Trial Mixes and Self-Compacting Tests. Self-compacting concrete must have the ability to flow under its own weight, to pass easily between reinforcing bars or other obstacles without segregation during or after casting. Trial mixes were conducted to address these fresh properties and to moni-tor w/c or w/cm materials ratio and superplasticizer dosage. Concretes were mixed using pan mixer. Slump test in accor-dance with ASTM C 143 [21] was used to determine the work-ability of R mix. Slump flow based on ASTM C 1611 [22], J-ring according to ASTM C1621 [23], and Vfunnel tests based on EF-NARC [24] were carried out to examine the self-compacting features of SCC mixes. The slump flow test is used to exam-ine the horizontal free flow of self-compacted concrete in the absence of obstructions. The diameter of the concrete circle is a measure of filling ability. The flow rate is influenced by the concrete’s viscosity, and the stability can be observed by visually examining the concrete patty for evidence of seg-regation. The J-ring test is used to determine the passing ability in combination with the slump flow test. The J-ring is placed outside the slump cone so that the concrete flows through the legs of the ring when the cone is lifted. The slump flow with and without the J-ring is measured. A difference of less than 25mm indicates a good passing ability. The V-funnel test is used to measure the ease of flow and filling ability of concrete. The funnel is filled with concrete and the time taken for it to flow through the apparatus is measured.
Compo-nents CaO SiO2 Al2O3 Fe2O3 SO3 MgO K2O Na2O LOI IR C3S C2S C3A C4AF
C 63.3 20.8 5.0 3.2 2.8 2.8 0.6 - 0.9 0.8 53.3 19.7 7.9 9.8
SF - >90 - - - - - - <3 - - - - -
Table 1: Chemical composition of cement and SF
Table 2: Proportion of concrete mixes.
Sym-bol Mix ingredients, kg/m3 w/c or
w/cm SP %
R 550 - 780 850 0.52 -
SP 550 - 780 850 0.31 3
SF-R 495 55 780 850 0.31 3
SF-A 550 55 780 850 0.31 3
Experimental Details
Materials and Mix Proportions. The cement used in this study was ordinary Portland cement (OPC) that conforms to ASTMC 150 [16] Type I. Elkem Microsilica Grade 940D with a typical bulk density of 500–700 kg/m3 conforming to ASTM C 1240 [17] was used as a highly active mineral admixture for
REPAIR & REHAB
The
Mas
terb
uild
er |
Febr
uary
201
5 | w
ww
.mas
terb
uild
er.c
o.in
170
Shorter flow time indicates greater flowability. Target values are slump flow of 550–750mm and V-funnel time of 6 to 12 seconds. The self-compacting features are demonstrated in Table 3.
Specimens Preparation and Exposure Condition. Four cylindrical series were prepared for electrochemical corro-sion measurements. Specimens were 100mm in diameter and 200mm in length, reinforced with deformed mild steel rebar of 16mm in diameter. The rebar has an effective cover of 42mm and was protruding from the upper surface of the cylinder. The rust on the rebar was cleaned by steel brush and SiC sand paper. The specimens for electrical resistance and compressive strength measurements were 100mm cubes cast also in four series. Concrete poured into the molds in three layers for cylindrical specimens and in two layers for cubes, and compaction was applied using vibrating table for R mixes, while SP and HS-SCC mixes neither needed any
vibration nor surface leveling. After casting, specimens were covered with nylon sheets for 24hours to prevent evaporation and then removed from the molds and cured for 27 days in a controlled environment of 25 ± 2oC temperature and about 95% relative humidity. During this period, the projected por-tions of the rebar were wrapped with sealed tape to prevent corrosion. At the end of the curing period, specimens were placed in laboratory air for three days then partially im-mersed in a 5% NaCl solution in vertical position to accel-erate the deterioration process. The level of the solution was adjusted so that half the depth of the specimens was in solu-tion continuously. Measurements were conducted at ages of 7, 60, 90, 120, 150, 180, and 270 days of exposure to 5%NaCl solution. The compressive strength tests for the four series were carried out in accordance with ASTM C39 [25] using a digitally controlled compression machine with a maximum load capacity of 2000KN. For each measurement, a set of six specimens was used for HS-SCC and a set of three speci-mens for R and SP specimens.
Half-Cell Potential (HCP) Measurements. The half-cell potential has been greatly used in the laboratory and in the
Symbol SP % w/c or w/cmSelf-compacting features
Tests Actual value
R - 0.52 Slump 180mm
SP 3 0.31
Slump flowT 50 cm
J-ring flow Passingability
V-funnel time
710mm7 sec
700mm13mm8 sec
SF-R 3 0.31
Slump flowT 50 cm
J-Ring flowPassing abilityV-funnel time
683mm7 sec
670mm13mm9 sec
SF-A 3 0.31
Slump flowT 50 cm
J-Ring flowPassing abilityV-funnel time
675mm8 sec
660mm15mm9 sec
Table 3: Self-compacting features.
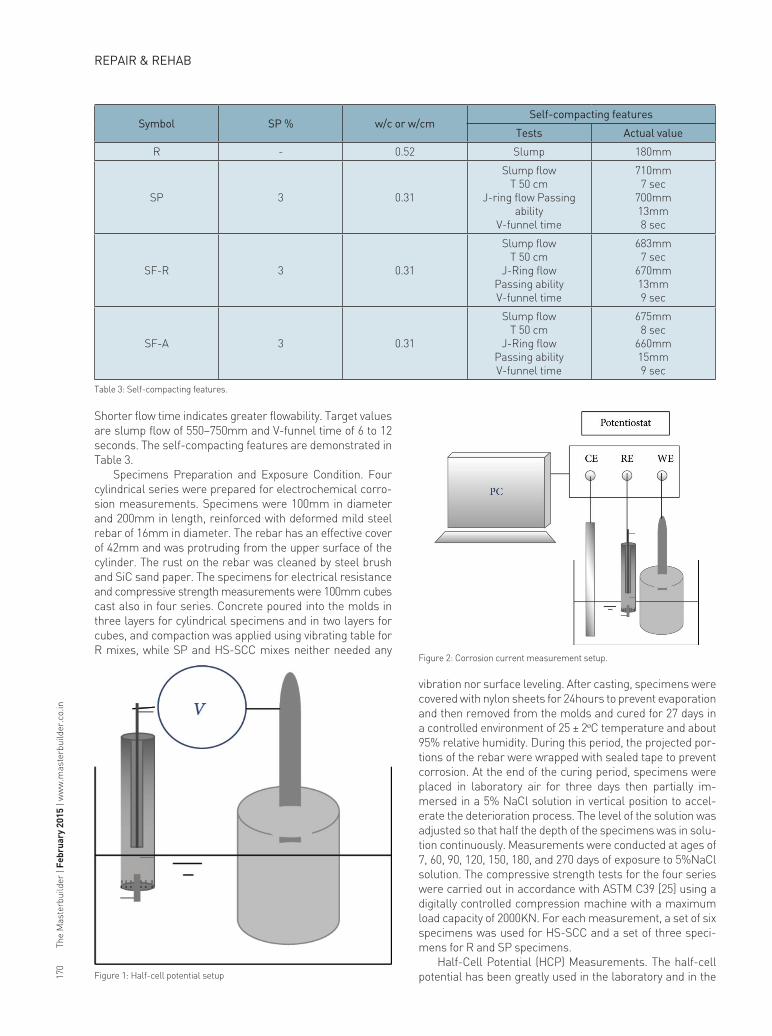
Figure 1: Half-cell potential setup
Figure 2: Corrosion current measurement setup.
REPAIR & REHAB

The
Mas
terb
uild
er |
Febr
uary
201
5 | w
ww
.mas
terb
uild
er.c
o.in
172
field for the assessment of the corrosion potential of steel reinforcement in concrete. It is non intrusive test and provides a rapid and inexpensive means of identifying zones of active corrosion in reinforced concrete structures that need fur-ther analysis and rehabilitation [3]. The test was performed based on ASTM C876 [26] to determine the corrosion activity and the time to corrosion initiation. The principal concerned with this technique is basically a measurement of corrosion potential of the working electrode (steel reinforcement in concrete) as the voltage difference between the steel and a standard reference electrode close to concrete surface [27–29]. Silver/silver chloride (Ag/AgCl) was used as a standard reference electrode, Figure 1. Electrically, the reinforcing steel has to be connected to the positive terminal of the volt-meter and the half-cell to the negative (ground) terminal of the voltmeter. Precaution measures were taken to maintain the half-cell in proper conditions during the testing period. Halfcell Potential measurements were taken at scheduled periods.
The potentials recorded in the half cell readings can be used to indicate the probability of reinforcement corrosion. If the potentials are less negative than −0.119VAg/AgCl, there is greater than 90% probability that no reinforcing steel corro-sion was occurring at the time of measurement. If the poten-tials are in the range of −0.119 to −0.269VAg/AgCl corrosion activities are uncertain. If the potentials are more negative than −0.269VAg/AgCl there is greater than 90% risk of cor-rosion [26].
Corrosion Current Measurements. Corrosion currents were determined by Tafel extrapolation methods. Three electrodes were used: reinforcing steel as a working electrode, Ag/AgCl electrode as standard reference electrode and cop-per plate measuring 60 x 30 x 3mm as the auxiliary electrode. The electrical connection of the reinforcement was secured by pin connected to the projected part of the bar. The experi-mental setup is shown in Figure 2. Measurements were car-ried out to determine the polarization resistance (Rp) using small potential scan within ±20mV from Ecorr at the scan rate of 0.167mV/s.The amount of polarization shift (ΔE) was selected within linear Stern-Geary range of 10–30mV [30] to avoid electrochemical disturbance of the polarized electrode during the test. In the present work, Rp was obtained directly using the “Rp fit graphic tool” associated with Software tech-niques.The fundamentals of this technique are based on the following Stern-Geary equation [30]:
(1)Tafel extrapolation is used to determine the polarization
curve. The anodic and cathodic Tafel constants a and c were determined from Tafel plots. The Tafel slopes a and c are the voltage change per one logarithmic cycle of current (volts per decade) in the positive (Nobel) and negative (Active) direction, respectively. The back extrapolation lines intersect at a point on line of corrosion potential, Ecorr, and the pro-jection of this point on the current scale gives the value of the Ecorr. In the present work, the potentiostat instrument and general-purpose electrochemical system (GPES) software package were used to plot polarization curves and deter-mine corrosion rates, a and c with Tafel fits. This technique
is designed for plotting polarization curves and determining Ecorr through potential steps of ±100m Varound the corro-sion potential. Work has been done in correlating Ecorr to the condition of the rebar [27]; where Ecorr < 0.1 A/cm2, steel is in a passive condition, Ecorr 0.1 to 0.5 A/cm2 corrosion risk is low to moderate, Ecorr 0.5 to 1 A/cm2 corrosion risk is moderate to high, and Ecorr > 1 A/cm2 corrosion risk is high. The surface area (A) of the steel reinforcement that has been polarized needs to be accurately known for determina-tion of the corrosion current density (Ecorr) as in the following equation:
(2)
The corrosion rate (CR) in a millimeter per year (mmpy) is calculated according to the next equation:
(3)
Icorr is corrosion current,K is constant that defines the units of the corrosionrate (3272 mm/(A.cm.year),EW is equivalent weight of steel (atomic weight/valence of the reacting electrode (iron)27.9225 g/eq),d is density, 7.8 g/cm3,A is sample surface area, 78.4 cm2.
Figure 3: Electrical resistance measuring setup.
Figure 4: Half-cell potentials (HSPs) with age.
REPAIR & REHAB

173The M
asterbuilder | February 2015 | ww
w.m
asterbuilder.co.in
Electrical Resistance Measurements. Direct electric cur-rent (DC) technique was exercised for electrical resistance measurements of the concrete cubes. A constant electric field was applied between two external electrodes, and the resulting current was measured. The electrical resistance measuring setup includes DC power supply, two high per-formance digital multi-meters, used as voltage and current measuring devices and two stainless steel plates, measur-ing 100 . 100 . 3mm were used as external electrodes. Steel plates were cleaned thoroughly using SiC paper to ensure good conductivity. The two plates were lasted to the opposite sides of the specimen using cement paste with a w/c or w/cm materials ratio analogous to those of the test specimen to avoid a significant change in resistance due to the polar-ization effect. The electrical circuit for DC resistance mea-surement is shown in Figure 3. The specimens were investi-gated over a wide range of output voltages. At each selected voltage, the synchronous value of current was recorded. The electrical resistance of concrete specimens was determined by the slope of the voltage-current plot. The average of three specimens, measured just after removal from the solution was adopted at the scheduled ages. This ensured contin-uous electrical connectivity across the gap separating the electrodes. The resistance of concrete was determined by the slope of the line of the voltage current plots. The resistiv-ity then is calculated from the following equation:
(4)R: resistance (Ohm)
: resistivity (Ohm.cm)A: cross-sectional area the current flows through =10 . 10 = 100 cm2
L: the gap separating the electrodes.
Results and Discussions
Half-Cell Potential (HCP). The HCP data presented in Figure 4 indicated that at the end of 28 days curing in tap water the steel potentials in concretes were in the range of −124mV to −360mVAg/AgCl. According to Arup [31] in the absence of chlorides, the reinforcing steel in concrete is in the passive state brought about by the high pH and the availability of oxygen. The range of passive potential, howev-er, is very wide from +200mV to –700mV CSE or more neg-ative against Ag/AgCl at pH 13. Consequently, in this state, the potentials more negative than ASTM C-876 threshold value (−269mVAg/AgCl) do not indicate, with any degree of
accuracy that corrosion of steel reinforcement is occurring at the end of 28 days curing. At an early stage of immersion in 5% NaCl solution the reinforcing steel potentials, in gen-eral, rapidly changed to values less negative than the initial potentials. This is clearly indicative of a change in the elec-trochemical status due to the presence of chloride ions in the solution. Thereafter, the reinforcing steel in SF-R and SF-A concretes exhibited gradual variation in potentials to-ward more negative values up to 60 days of exposure and then varied continuously toward less negative potentials up to the end of the testing period, Figure 4. In those specimens, a threshold value of −269mVAg/AgCl was not exceeded and corrosion activity of reinforcing steel is uncertain based on ASTM C876 [26]. Furthermore, the steel in R and SP con-cretes showed rapid and great variations toward more negative potentials and a threshold value of −269mVAg/AgCl based on ASTM C876 was exceeded after 70 days of exposure. This is indicating corrosion initiation according to ASTM C876 in R and SP specimens at 70 days of exposure, Figure 4, due to penetration of chloride ions and breakdown of the passive protective layer.
The measurements are too susceptible to the humidity standing on the concrete, oxygen availability in the proxim-ity of the steel and micro cracks in concrete. More negative potentials result for steel in concrete with a higher degree of saturation, lack of oxygen in the vicinity of the reinforce-ment and the presence of localized micro cracks [3]. The superior performance of steel in a system of lower corro-sion activity, SF-R and SF-A specimens, may be explained in terms of pores size and continuity, hence, the penetrability of the solution aggressive species. Therefore, these systems have a higher electrical resistance and superior internal in-tegrity, thus, reducing the likelihood for the intrusion of ag-gressive chloride ions, that is, the factors that manage the electrochemical corrosion activity. Attempts, however, to describe the electrochemical process in terms of potential measurements is irritating and not adequate as a criterion. Accordingly, may result in improper conclusions, since they are affected by many factors such as polarization caused by limited propagation of oxygen [26–28], the existence of highly resistive layers and concrete porosity [32]. Further, deceptive conclusions regarding corrosion risk may result in a structure where portions are exposed to dry conditions while others remain moist [3].Thus, potentials readings should be inter-preted together with corrosion rate data as considered in this work.
Corrosion Current. Polarization resistance and Tafel
Age—dRp—Ohm
SF-A R —mV/decade
R SP SF-R SP SF-R SF-A
7 139 237 1973 1700 31 36 82 62
60 211 312 2715 2523 66 58 77 70
120 232 381 2900 2100 68 56 68 58
150 265 481 3064 2023 73 55 62 46
180 623 745 6167 5989 112 98 77 120
270 1074 1268 9592 8095 150 119 90 154
Table 4: Polarization resistance and proportionality constant.
REPAIR & REHAB

The
Mas
terb
uild
er |
Febr
uary
201
5 | w
ww
.mas
terb
uild
er.c
o.in
174
extrapolation techniques were applied to all series. Three specimens were tested at each scheduled age. Examination of the Tafel data indicated that the corrosion process of steel reinforcement embedded in all types of concrete is cathodi-cally controlled, since the cathodic Tafel slope ( c) is greater than the anodic slope ( a). This means that
corrosion is determined by polarization of the cathodic controlling reactions, that is, the electrode is accelerated by moving the potential in the negative (active) direction. Figure 5 represents typical Tafel plots at 7 days of exposure to NaCl solution. The proportionality constants ( ), were in the range of 31–150mV/decade for steel in R concrete, 36–119mV/de-cade in SP concrete, 62–90mV/decade in SFR
concrete and 46–154mV/decade in SF-A concrete. The average Rp and proportionality constant determined from Tafel plots (TP) at scheduled ages are shown in Table 4 and the variation of the corrosion current with exposure time is shown in Figure 6. Results reveal that, in general the corrosion current of steel in SF-R concrete exhibited a gradual re-duction with exposure time, while in SF-Aconcrete showed a slight increase in the corrosion current as compared to steel in SF-R concrete after 150 days of exposure. On the other hand, the steel in R concrete showed a rapid increase
in corrosion current and in SP concrete exhibited, a gradual increase after 60 days indicating a breakdown in the passive film as a result of chloride ion ingress. However, the increase in the corrosion current is more pronounced for steel in R concrete compared to steel in SP concrete.
Examination of the Tafel plots and data in Figure 6 for steel in SF-R concrete indicated that at the end of the test-ing period the corrosion currents are 63 and 16 fold lower than those for steel in R, and SP concretes respectively. The corresponding values for steel in SF-A concrete are 17 and 4 fold lower. Superior corrosion resistance performance of steel in SF-R concrete over the R as well as SP concrete is attributed to many reasons: The utilization of high surface area silica fume leads to progressive improvement in the internal micro structural system and the transition zone through the pore size and grain size refinement processes, hence blocking the continuity of the voids [3]. The use of high performance super plasticizer produced concrete mix of ex-cellent flowability and high resistance to segregation, with a 40% water reduction. The well dispersion of the cementitious particles by the action of superplasticizer produces a homo-geneous and dense microstructure. Furthermore, the tight microstructure can impede the movement of electrons from the anode to the cathode zone, thus, tends to hinder the prop-agation of the corrosion process. These features as a parcel contribute positively to reduce corrosion current of SF-R. Based on corrosion current density’s data presented in Table 5 and according to Rodriguez et al. [27] corrosion risk classi-fication, the steel in SF-R was absolutely in passive condi-tions, whereas, corrosion risk is low to moderate for steel in SF-A concrete, moderate to high for steel in SP concrete, and high in R concrete. It is worth mentioning that, after 150 days of exposure, the steel in SF-R concrete elucidates bet-ter performance as compared to steel in SF-A concrete in spite of higher cement content of the latter concrete. This behaviour is mainly associated with the formation of larg-er size and concentration of crystalline calcium hydroxide crystals with distinctive hexagonal-prism morphology in the interfacial transition zone [3]. These crystals are the weakest link in the system causing cracks in the direction perpendic-ular to the c-axis. Such effects explicate lower strength of the transition zone than the bulk cement paste in concrete leading to higher corrosion current.
Corrosion Current versus Corrosion Potential.
Commonly, it is known that the corrosion rate is high-
Figure 5: Polarization curves at 7 days of exposure.
Table 5: Corrosion current density.
Figure 6: Corrosion currents versus time of exposure.
Age—dCorrosion current density— A/cm2
R SP SF-R SF-A
7 0.83 0.69 0.02 0.11
60 0.79 0.23 0.09 0.12
90 1.38 0.51 0.08 0.07
120 1.94 0.79 0.07 0.07
150 2.52 0.79 0.06 0.07
180 2.96 0.87 0.08 0.19
270 4.24 1.09 0.07 0.25
REPAIR & REHAB

The
Mas
terb
uild
er |
Febr
uary
201
5 | w
ww
.mas
terb
uild
er.c
o.in
176
er at more negative corrosion potential (Ecorr). However, no pragmatic conclusions can be drawn from Ecorr without great hazard of error. In the deprivation of superficial signs of corrosion of the embedded steel, dependable qualitative as-sessment using potentials data counts on a convenient fore-knowledge of the electrochemical history of the structure. The corrosion current densities versus Ecorr. plots based on experimental data, Figure 7, indicate different slopes for dif-ferent types ofconcrete and were increasing in the following order: R, SP, SF-A, and SF-R. Consequently, weak correla-tion is observed for steel in a higher corrosion activity sys-tem which is steel in R concrete, and the most obvious trend is associated with steel in lower corrosion activity systems, thus, SF-R specimen. Figure 8 shows the corrosion current density versus corrosion potential data for the whole spec-imens. Irrespective of the type of concrete, the embedded steel identifies a regular increase in values of Ecorr as Ecorr moves toward a more negative value. The points possessed lower corrosion current densities and less negative poten-tials located in the upper left portion of the curve are related to steel in SF-R concrete, whereas, the points with higher corrosion current densities and more negative potentials are linked with steel in R concrete. The improved corrosion re-sistance features of steel in high-Strength self-compacting concretes are attributed to the densification of microstruc-ture providing an intensive barrier against the transmission of the intrusive agents. Moreover, the excellent flowability and high resistance to segregation authorized well distribution of cementitious particles, hence produce a consistent and dense microstructure by well intermeshing of the hydra-tion products and provided improved adhesion to steel re-inforcement. Similar linear relationships, of negative slope, between Ecorr and Ecorr has been reported by Page and Havdahl [33] for steel in various microsilica content cement pastes admixed with chloride and Lambert et al. [34] for steel in conventional concrete exposed to chloride ingress.
It is meritorious to point out that there is no general correlation between the corrosion rates and HCPs [2] since those variables respond distinctly to the specific related pa-rameters essentially, moisture, presence of oxygen, concrete resistance and temperature [35]. From Figures 7 and 8 it can
be seen that, for steel in SF-R concrete the values of Ecorr were in the range of −190mVAg/AgCl, measured at early ages and approached to −90mVAg/AgCl at the end of the testing period, and the corresponding values of corrosion current densities were 0.02 and 0.08 A/cm2.This condition clearly indicates passivity of steel in SF-R specimens under NaCl solution. On the other hand, for steel in R specimens, the val-ues of Ecorr fall in between −211 to −550mVAg/AgCl and the corresponding values of corrosion current densities were between 0.79– 4.24 A/cm2. These values reveal the high probability of destruction of the passive protective layer on the surface of steel reinforcement and hence high corrosion activity in most of these specimens at the time of the mea-surements. Figure 8 plotted for the whole series confirms the correlation between HCPs and corrosion rate for SF-R specimens which all located fully in the passive zone to the left of vertical line representing active corrosion threshold value (0.1 A/cm2) and above the horizontal line (threshold potential, −269mV versus Ag/AgCl). Accordingly, it is prob-able that the effect of microsilica in lowering the pH values and hydroxide ion concentration of the pore solution phase were being greatly offset by densification of the microstruc-ture of the hydrated cement matrix and excellent intermesh-ing of the hydration products which tended to stabilize the passivity of steel reinforcement. Moreover, the correlation can
Figure 7: Corrosion current density versus Ecorr
Figure 8: Corrosion current density versus HCP
Figure 9: Electrical resistance at 60 days.
REPAIR & REHAB
177The M
asterbuilder | February 2015 | ww
w.m
asterbuilder.co.in
be well applied to SF-R, and SFA specimens. The relation-ship between the corrosion rate and HCPs, Figure 8, indicate active corrosion conditions for steel in R, SP and SF-A con-cretes located in the active zone to the right of the vertical line (0.1 A/cm2). However, for the some cases the corre-sponding potentials are less negative than −269mVAg/AgCl. Consequently, HCP measurements need to be supported by other techniques because wide variations in corrosion rate are linked with a narrow range of potentials that are nobler than −269mVAg/AgCl.
Electrical Resistance
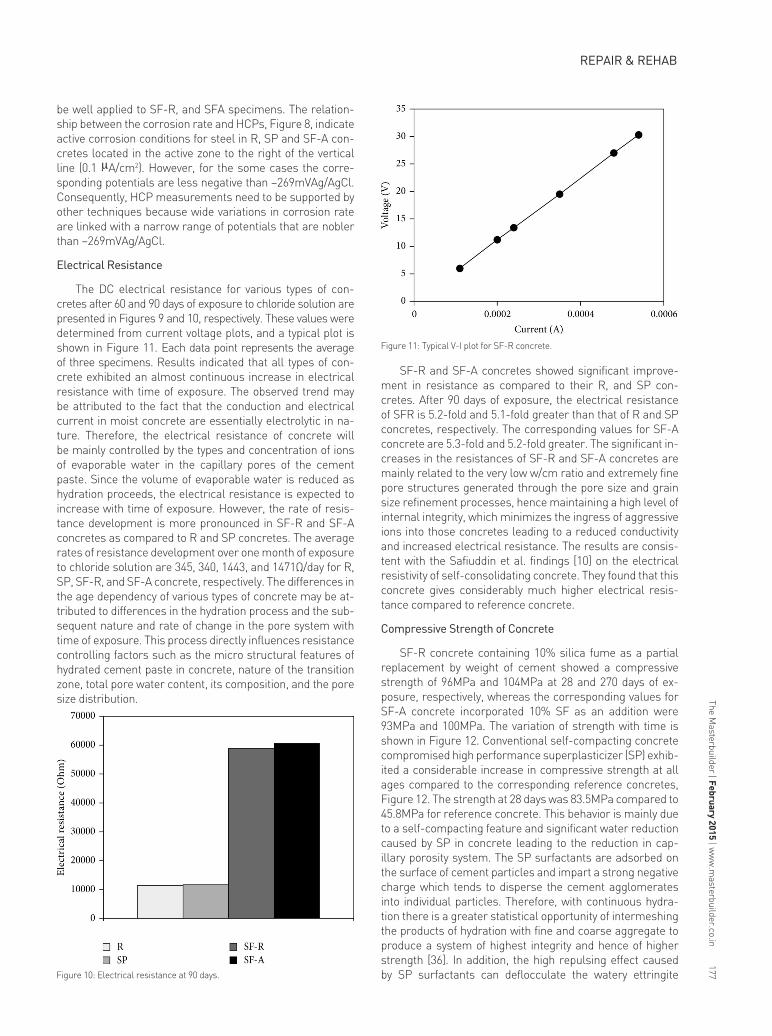
The DC electrical resistance for various types of con-cretes after 60 and 90 days of exposure to chloride solution are presented in Figures 9 and 10, respectively. These values were determined from current voltage plots, and a typical plot is shown in Figure 11. Each data point represents the average of three specimens. Results indicated that all types of con-crete exhibited an almost continuous increase in electrical resistance with time of exposure. The observed trend may be attributed to the fact that the conduction and electrical current in moist concrete are essentially electrolytic in na-ture. Therefore, the electrical resistance of concrete will be mainly controlled by the types and concentration of ions of evaporable water in the capillary pores of the cement paste. Since the volume of evaporable water is reduced as hydration proceeds, the electrical resistance is expected to increase with time of exposure. However, the rate of resis-tance development is more pronounced in SF-R and SF-A concretes as compared to R and SP concretes. The average rates of resistance development over one month of exposure to chloride solution are 345, 340, 1443, and 1471Ω/day for R, SP, SF-R, and SF-A concrete, respectively. The differences in the age dependency of various types of concrete may be at-tributed to differences in the hydration process and the sub-sequent nature and rate of change in the pore system with time of exposure. This process directly influences resistance controlling factors such as the micro structural features of hydrated cement paste in concrete, nature of the transition zone, total pore water content, its composition, and the pore size distribution.
SF-R and SF-A concretes showed significant improve-ment in resistance as compared to their R, and SP con-cretes. After 90 days of exposure, the electrical resistance of SFR is 5.2-fold and 5.1-fold greater than that of R and SP concretes, respectively. The corresponding values for SF-A concrete are 5.3-fold and 5.2-fold greater. The significant in-creases in the resistances of SF-R and SF-A concretes are mainly related to the very low w/cm ratio and extremely fine pore structures generated through the pore size and grain size refinement processes, hence maintaining a high level of internal integrity, which minimizes the ingress of aggressive ions into those concretes leading to a reduced conductivity and increased electrical resistance. The results are consis-tent with the Safiuddin et al. findings [10] on the electrical resistivity of self-consolidating concrete. They found that this concrete gives considerably much higher electrical resis-tance compared to reference concrete.
Compressive Strength of Concrete
SF-R concrete containing 10% silica fume as a partial replacement by weight of cement showed a compressive strength of 96MPa and 104MPa at 28 and 270 days of ex-posure, respectively, whereas the corresponding values for SF-A concrete incorporated 10% SF as an addition were 93MPa and 100MPa. The variation of strength with time is shown in Figure 12. Conventional self-compacting concrete compromised high performance superplasticizer (SP) exhib-ited a considerable increase in compressive strength at all ages compared to the corresponding reference concretes, Figure 12. The strength at 28 days was 83.5MPa compared to 45.8MPa for reference concrete. This behavior is mainly due to a self-compacting feature and significant water reduction caused by SP in concrete leading to the reduction in cap-illary porosity system. The SP surfactants are adsorbed on the surface of cement particles and impart a strong negative charge which tends to disperse the cement agglomerates into individual particles. Therefore, with continuous hydra-tion there is a greater statistical opportunity of intermeshing the products of hydration with fine and coarse aggregate to produce a system of highest integrity and hence of higher strength [36]. In addition, the high repulsing effect caused by SP surfactants can deflocculate the watery ettringite Figure 10: Electrical resistance at 90 days.
Figure 11: Typical V-I plot for SF-R concrete.
REPAIR & REHAB

The
Mas
terb
uild
er |
Febr
uary
201
5 | w
ww
.mas
terb
uild
er.c
o.in
178
shell around the cement particles, and the small ettringite needles are freed from their watery shell by the adsorption of the SP molecules [37] thus providing a more consistent structure of hydrated cement paste.
Figure 12 shows that SF-R and SF-A have superior per-formance to SP concrete. This is mainly due to the fact that with a highly active silica fume, the pozzolanic reaction may start as soon as Ca(OH)2 are available from the hydration of Portland cement compounds and thereby strengthen the concrete through the pore size and grain size refinement processes. In the first process, the large capillary voids are filled with a micro porous low density calcium silicate hy-drates, formed as a secondary hydration product during the pozzolanic reaction. In the second process, nucleation of calcium hydroxide around the fine and well distributed par-ticles of pozzolan will have the effect of replacing the larger and oriented crystals of calcium hydroxide with numerous, small, and fewer oriented crystals plus poorly crystalline reaction products [3]. Mehta and Monteiro suggested that both processes strengthen the cement paste and transition zone thus reducing the micro cracking and permeability of concrete [3].
SF-A concrete showed slightly lower strength than SF-R concrete, mainly associated with larger size and concentra-tion of Ca(OH)2 crystals liberated during the hydration of ce-ment in concrete of higher cement content. These crystals offer the feeblest link in the system causing cracks in the di-rection perpendicular to the c-axis. Such effects account for lower strength of the transition zone than the bulk cement paste in concrete leading to lower compressive strength. However, the strength is relatively much higher compared to SP concrete Figure 12.
Conclusions
The following conclusion can be made from the data developed in the present study.
(i) The half-cell potentials (HCPs) of steel in SF-R concrete were considerably nobler than −269mVAg/ AgCl indicat-ing a state of passive potential. The inclusion of 10% SF
by weight of cement as an addition to the mix in SF-A concrete changed the HCPs of steel to more negative potentials compared to steel in SF-R concrete through-out the testing period. In R concrete the HCPs of steel drops suddenly to more negative than −269mVAg/AgCl at 70 days of exposure and the steel in SP concrete exhib-ited fluctuations in potentials during the testing period.
(ii) The corrosion process of steel in all types of concrete was cathodically controlled. Based on Tafel extrapola-tion technique, the corrosion currents for steel in SF-R concrete were, respectively, 63- and 16-fold lower than R and SP concretes at the end of the testing period. The corresponding values for steel in SF-A concrete were 17- and 4-fold lower. The superior durability performance of steel in SFR concrete linked to terrific self-compact-ing features may significantly expand the service life of structural members and provide vast opportunities for future structural application under severe environmen-tal conditions.
(iii) Corrosion risk classification based on corrosion current densities and HCPs, detected that the steel in SFR is definitely in the passive condition, while, corrosion risk is low to moderate for steel in SF-A, moderate to high for steel in SP concrete and high for steel in R concrete. Moreover, large distinctions in corrosion rate are asso-ciated with a narrow range of potentials that are less negative than −269mVAg/AgCl. This clearly indicates that HCP measurements may yield deceptive results if considered separately thus, should be always boosted by other techniques. Corrosion current density-Ecorr. plots indicated different slopes for different types of concrete and were increasing in the following order: R, SP, SF-A, and SF-R concrete.
(iv) SF-R and SF-Aconcretes elucidate significant increase in electrical resistance and compressive strength com-pared to Rand SP concretes. The average rates of re-sistance development over one month of exposure were 345, 340, 1443, and 1471Ω/day for R, SP, SF-R, and SFA concrete, respectively. The compressive strength of SF-R concretes was 104MPa at 270 days of exposure, whereas the corresponding value for SF-A concrete was 100MPa. Conventional self-compacting concrete (SP) exhibited compressive strength of 83.5MPa compared to 45.8MPa for R concrete.
Conflict of Interests
The authors declare that there is no conflict of interests regarding the publication of this paper.
Acknowledgments
The authors would like to express deep thanks and ap-preciation to the Royal Scientific Society as well as the In-stitute of International Education Scholar Rescue Fund for providing the needed support to conduct this research work.
References
[1] M. Raupach and P. Schiesbl, “Macrocell sensor systems for moni-toring of the corrosion risk of the reinforcement in concrete struc-tures,” NDT & E International, vol. 34, no. 6, pp. 435–442, 2001.
Figure 12: Compressive strength of concretes.
REPAIR & REHAB
The
Mas
terb
uild
er |
Febr
uary
201
5 | w
ww
.mas
terb
uild
er.c
o.in
180
[2] J. P. Broomfield, Corrosion of Steel in Concrete: Understanding, In-vestigation and Repair, Taylor & Francis, London, UK, 2nd edition, 2007.
[3] P. K. Mehta and P. J. Monteiro, Concrete: Microstructure, Proper-ties, and Materials, McGraw-Hill, New York, NY, USA, 3rd edition, 2006.
[4] K. H. Khayat, “Workability, testing, and performance of selfconsoli-dating concrete,” ACI Materials Journal, vol. 96, no. 3, pp. 346–353, 1999.
[5] ACI Committee 222, “Corrosion of metals in concrete,” ACI Manual of Concrete Practice, Part 1, American Concrete Institute, Farming-tonHills,Mich, USA, 2000.
[6] W. Zhu and P. J. M. Bartos, “Permeation properties of selfcompact-ing concrete,” Cement and Concrete Research, vol. 33, no. 6, pp. 921–926, 2003.
[7] T. A. Saylev and R. Francois, “Quality of steel-concrete interface and corrosion of reinforcing steel,” Cement and Concrete Research, vol. 33, no. 9, pp. 1407–1415, 2003.
[8] S. Assie, G. Escadeillas, and V. Waller, “Estimates of selfcompacting concrete “potential” durability,” Construction and Building Materi-als, vol. 21, no. 10, pp. 1909–1917, 2007.
[9] H. Yazici, “The effect of silica fume and high-volume class C fly ash onmechanical properties, chloride penetration and freeze– thaw resistance of self-compacting concrete,” Construction and Building Materials, vol. 22, no. 4, pp. 456–462, 2008.
[10] M. Safiuddin, J. S. West, and K.A. Soudki, “Durability performance of self-consolidating concrete,” Journal of Applied Sciences Research, vol. 4, no. 12, pp. 1834–1840, 2008.
[11] M. A. Safan, “Performance of beams made of low-cost selfcompact-ing concrete in an aggressive environment,” Acta Polytechnica, vol. 51, no. 5, pp. 120–130, 2011.
[12] H. F. Dehwah, “Corrosion resistance of self-compacting concrete in-corporated quarry dust powder, silica fume and fly ash,” Construc-tion and Building Materials, vol. 37, pp. 277–282, 2012.
[13] M. Uysal, K. Yilmaz, and M. Ipek, “The effect of mineral admixtures onmechanical properties, chloride ion permeability and imperme-ability of self-compacting concrete,” Construction and Building Ma-terials, vol. 27, no. 1, pp. 263–270, 2012.
[14] A. Hassan,M. Hossain, andM. Lachemi, “Corrosion resistance of self-consolidating concrete in full-scale reinforced beams,” Cement and Concrete Composites, vol. 31, no. 1, pp. 29–38, 2009.
[15] H. Yu, X. Shi,W. H. Hartt, and B. Lu, “Laboratory investigation of re-inforcement corrosion initiation and chloride threshold content for self-compacting concrete,” Cement and Concrete Research, vol. 40, no. 10, pp. 1507–1516, 2010.
[16] American Society for Testing and Materials, ASTM C150: Standard Specification for Portland Cement, ASTM,Philadelphia, Pa, USA, 2002.
[17] American Society for Testing and Materials, ASTM C1240: Standard Specification for Silica Fume Used in Cementitious Mixtures, ASTM, Philadelphia, Pa, USA, 2005.
[18] American Society for Testing and Materials, ASTM C494: Standard Specification for Chemical Admixture for Concrete, ASTM, Philadel-phia, Pa, USA, 2001.
[19] American Society for Testing and Materials, ASTM C33: Standard
Specification for Concrete Aggregate, ASTM, Philadelphia, Pa, USA, 2003.
[20] The European Guidelines for Self Compacting Concrete, Specifica-tion, Production and Use, 2005.
[21] American Society for Testing and Materials, ASTM C143: Standard Test Method for Slump of Hydraulic Cement Concrete, ASTM, Phil-adelphia, Pa, USA, 2000.
[22] American Society for Testing and Materials, ASTM C1611: Standard Test Method for Slump Flow of Self-Consolidating Concrete, ASTM, Philadelphia, Pa, USA, 2005.
[23] American Society for Testing and Materials, ASTM C1621: Standard Test Method for Passing Ability of Self-Consolidating Concrete by J-Ring, ASTM, Philadelphia, Pa, USA, 2009.
[24] EFNARC, “Specification and guidelines for self-compacting con-crete,” European Federation Dedicated to Specialist Construction Chemicals and Concrete Systems, 2002.
[25] American Society for Testing andMaterials, ASTMC39/C39M: Stan-dard Test Method for Compressive Strength of Cylindrical Concrete Specimens, ASTM, Philadelphia, Pa, USA, 2001.
[26] American Society for Testing andMaterials, ASTM C876: Standard TestMethod forHalf-Cell Potentials ofUncoated Reinforcing Steel in Concrete, ASTM, Philadelphia, Pa, USA, 1999.
[27] P. Rodriguez, E. Ramirez, and J. A. Gonzalez, “Methods for studying corrosion in reinforced concrete,” Magazine of Concrete Research, vol. 46, no. 167, pp. 81–90, 1994.
[28] C. Andrade, J. Gulikers, R. Polder, and M. Raupach, “Halfcell po-tential measurements-potential mapping on reinforced concrete structures,” Materials and Structures, vol. 36, pp. 461– 471, 2003.
[29] C. Andrade and C. Alonso, “Corrosion rate monitoring in the labora-tory and on-site,” Construction and Building Materials, vol. 10, no. 5, pp. 315–328, 1996.
[30] M. Stern and A. Geary, “Electrochemical polarizationtheoretical analysis of the shape of polarization curves,” Journal of the Electro-chemical Society, vol. 104, no. 1, pp. 56–63, 1957.
[31] H. Arup, Corrosion of Reinforcement in Concrete Construction, So-ciety of Chemical Industry, London, UK, 1983.
[32] R. D. Browne, M. P. Geoghegan, and A. F. Baker, “Analysis of struc-tural condition from durability results,” in Corrosion of Reinforce-ment in Concrete Construction, A. P. Crane, Ed., Ellis Horwood, London, UK, 1983.
[33] C. L. Page and J. Havdahl, “Electrochemical monitoring of corrosion of steel in microsilica cement pastes,” Materials and Structures, vol. 18, no. 1, pp. 41–47, 1985.
[34] P. Lambert, C. L. Page, and P. R. W. Vassie, “Investigations of rein-forcement corrosion. 2. Electrochemicalmonitoring of steel in chlo-ride-contaminated concrete,” Materials and Structures, vol. 24, no. 5, pp. 351–358, 1991.
[35] J. A. Grubb, J. Blunt, C. P. Ostertag, and T. M. Devine, “Effect of steelmicrofibers on corrosion of steel reinforcing bars,” Cement and Concrete Research, vol. 37, no. 7, pp. 1115–1126, 2007.
[36] M. R. Rixom, Concrete Admixtures: Use and Applications, Construc-tion Press, Lancaster, UK, 1977.
[37] P. C. Kreiger, “Plasticizers and dispersing admixtures,” in Proceed-ings of the Concrete International Admixtures (CI ’80), pp. 1–17, Lon-don, UK, 1980. w
REPAIR & REHAB