
Corrosion of copper in alkaline chloride environments The available literature information on the...
71
Svensk Kärnbränslehantering AB Swedish Nuclear Fuel and Waste Management Co Box 5864 SE-102 40 Stockholm Sweden Tel 08-459 84 00 +46 8 459 84 00 Fax 08-661 57 19 +46 8 661 57 19 Technical Report TR-02-25 Corrosion of copper in alkaline chloride environments F King Integrity Corrosion Consulting Ltd August 2002
Transcript of Corrosion of copper in alkaline chloride environments The available literature information on the...

Svensk Kärnbränslehantering ABSwedish Nuclear Fueland Waste Management CoBox 5864SE-102 40 Stockholm SwedenTel 08-459 84 00
+46 8 459 84 00Fax 08-661 57 19
+46 8 661 57 19
Technical Report
TR-02-25
Corrosion of copper in alkalinechloride environments
F King
Integrity Corrosion Consulting Ltd
August 2002

Keywords: copper, corrosion, chloride, sulphide, saline, concrete, alkaline,canister, geologic repository, spent nuclear fuel, bentonite, general corrosion,pitting.
This report concerns a study which was conducted for SKB. The conclusionsand viewpoints presented in the report are those of the author and do notnecessarily coincide with those of the client.
Corrosion of copper in alkalinechloride environments
F King
Integrity Corrosion Consulting Ltd
August 2002

Abstract The available literature information on the corrosion and electrochemical behaviour of copper in alkaline environments has been reviewed. The purpose of the review was to assess the impact of an alkaline plume from cementitious material on the corrosion behaviour of a copper canister in an SKB-3 type repository. The effect of the evolution of the environmental conditions within the repository have been considered, including the effects of temperature, redox conditions, pore-water salinity and pH. If the pore-water pH increases prior to the establishment of anoxic conditions, the canister surface will passivate as the pore-water pH exceeds a value of ~pH 9. Passivation will result from the formation of a duplex Cu2O/Cu(OH)2 film. The corrosion potential will be determined by the equilibrium potential for the Cu2O/Cu(OH)2 couple under oxic conditions, or by the Cu/Cu2O redox couple under anoxic conditions (in the absence of sulphide). Pitting corrosion is only likely to occur early in the evolution of the repository environment, whilst the canister is still relatively cool (<40oC), whilst there is still O2 available to support localised corrosion, and prior to the increase in pore-water pH and salinity. The subsequent increase in canister surface temperature, pore-water pH and salinity, and decrease in [O2] will make pit initiation less likely, although the canister will remain passive provided the pore-water pH is maintained above pH 9. The higher the pore-water pH, the more strongly the canister is passivated and the less likely the surface is to undergo localised attack. If the pore-water salinity increases prior to the increase in pH, there could be a period of active canister corrosion before passivation occurs. Under these circumstances, the corrosion potential will be a true mixed potential, determine by the relative kinetics of Cu dissolution as CuCl2
– and of the reduction of O2. The development of anoxic conditions and an increase in pore-water sulphide concentration will result in passivation of the surface by a duplex Cu2S/CuS film. Increasing pH due to an alkaline plume will tend to enhance the passivity, because of the decrease in solubility of Cu2S. At the same time, pitting corrosion will become less likely, since the corrosion potential will shift to more-negative values and the pitting potential to more-positive values with increasing pH. As in sulphide-free environments, therefore, there appears to be little threat to the integrity of the canister from an increase in pore-water pH. In summary, an increase in pore-water pH due to an alkaline plume from cementitious material will induce passivation of the canister surface. The stability of the passive film, and its ability to prevent localised corrosion, are enhanced by increasing pH. In this regard, there appears to be little negative impact on the integrity of the canister from the use in the repository of cementitious materials with pore fluids in the pH range pH 12–13.

5
Content 1 Introduction 7 2 Background 9 2.1 Evolution of the repository environment 9 2.2 Definition of possible scenarios 11 3 Thermodynamic stability, solubility and speciation of copper in alkaline solutions 13 3.1 Potential-pH diagrams 13 3.2 Solubility and speciation of dissolved copper 17 4 Behaviour of copper in alkaline environments 27 4.1 Passivation in alkaline solutions 27 4.1.1 Passivation in absence of carbonate 27 4.1.2 Effect of carbonate on passivation 34 4.2 Effect of chloride ions on copper corrosion in alkaline solutions 34 4.2.1 Pitting of copper in alkaline chloride solutions 34 4.2.2 Effect of chloride on passive films on copper 41 4.3 Behaviour in alkaline sulphidic environments 55 4.3.1 Voltammetric behaviour of copper in alkaline sulphide solution 55 4.3.2 Pitting of copper in alkaline sulphide environments 57 4.3.3 Behaviour of copper at ECORR in alkaline sulphide solutions 58 5 Behaviour of copper canisters in a repository 61 5.1 Active-passive transition in the repository 61 5.2 Pitting of copper canisters due to an alkaline plume 62 5.3 Corrosion behaviour for the four environmental scenarios 67 6 Summary and conclusions 69 References 71
7
1 Introduction Cementitious materials could be used in an underground repository as seals, bulkheads, grouts, or to provide a smooth surface for vehicles in the rooms and tunnels during repository construction. Various types of concrete could be used for this purpose. “Conventional” concretes with high Ca:Si ratios produce pore solutions within the concrete that are essentially saturated Ca(OH)2 solutions with a ~pH 12.5. Although concretes with lower Ca:Si ratios and lower pore-water pH are available /Johnson et al. 1996/, there is still a concern that an alkaline “plume” could be released from the cementitious materials in the repository and impact the corrosion behaviour of the canisters. Chloride and hydroxide ions have different effects on the corrosion behaviour of copper. Chloride ions tend to promote active dissolution in the form of soluble Cu(I)-Cl– complexes, such as CuCl2
– and CuCl32– /Deslouis et al. 1988a,b; Lee and Nobe 1986/. Therefore,
increasing groundwater salinity would be expected to result in general corrosion of the canister, rather than pitting /King et al. 2001/. Hydroxide ions, on the other hand, tend to promote passivity of copper through the formation of a duplex Cu2O/CuO, Cu(OH)2 film /Strehblow and Titze 1980/. Cupric species play a larger role in the corrosion of copper in alkaline solutions, with the outer Cu(II) precipitated layer responsible for passivation. Although the behaviour in neutral or acidic chloride solutions or in chloride-free alkaline solutions has been clearly established, the behaviour of copper in alkaline chloride solutions is less certain. For copper, as for many other metals and alloys, chloride ions induce the localised breakdown of protective surface films and can lead to pitting /Gennero de Chialvo et al. 1985; Nishikata et al. 1990; Qafsaoui et al. 1993/. Because chloride and hydroxide ions appear to have opposite, and possibly competitive, effects on the corrosion behaviour of copper, it is feasible that the most aggressive conditions may result from moderately saline, moderately alkaline environments. In highly saline groundwaters of neutral or slightly alkaline pH, copper will undergo general corrosion. In more-dilute groundwaters at high pH, the copper surface will be passive. This report contains an assessment of the potential impact of a high-pH plume from concrete in the repository on the corrosion behaviour of copper canisters in the presence of saline groundwaters. First, possible scenarios for the evolution of the repository environment are presented. These scenarios are necessarily qualitative in nature since little is currently known about the time dependence of the salinity or pH within the repository. Next, the relative effects of chloride and hydroxide ions on the thermodynamic properties of copper are reviewed, with the use of Eh-pH and solubility/speciation diagrams. Various kinetic aspects of the corrosion of copper are then reviewed, including: the passivation of copper in alkaline solutions with and without carbonate ions, the effect of chloride ions on the passivation and pitting of copper, and the effect of sulphide on copper corrosion in alkaline solutions. Finally, the implications for the corrosion behaviour of copper canisters in a repository are discussed.

9
2 Background 2.1 Evolution of the repository environment A number of factors will affect the evolution of the repository environment. These factors include: the surface temperature of the canister, the consumption of the initially trapped atmospheric oxygen in the buffer and backfill materials, the dissolution of sulphide ions from minerals in the bentonite clay, the ingress of chloride ions from the saline groundwater, and the release of alkaline pore fluids from cementitious materials. The time-dependence of the temperature within the repository is well established. Figure 2-1 illustrates the predicted variation of the canister surface and near-field temperatures for the case of dry bentonite and a rock temperature of 11oC. This series of temperature profiles represent an extreme case, since saturation of the bentonite by groundwater will result in a lower temperatures (higher thermal conductivity), with the maximum canister surface temperature expected to be ~80oC /Raiko and Salo 1999; Ageskog and Jansson 1999/. The temperature transient will persist for several thousands of years. Redox conditions within the repository will be initially oxidising due to the presence of trapped atmospheric oxygen in the pores of the compacted bentonite. Oxygen will be consumed by microbial activity and by the oxidation of inorganic minerals (primarily pyrite) /King et al. 2001/. Based only on the oxidation of pyrite, /Wersin et al. 1994/ predicted it would take between 7 and 290 years to reduce the oxygen concentration to 1% of its initial value. Microbial action will reduce this time, but it is possible that oxic conditions will persist for several tens-hundreds of years.
Figure 2-1. Predicted time dependence of the canister surface and near-field temperatures (Raiko and Salo 1999).
TEMPERATURE IN REPOSITORY
0
10
20
30
40
50
60
70
80
90
100
1 2 5 10 20 50 100 200 500 1000 2000
TIME (a)
T (
C)
CanistersurfaceEdge ofdisposal holeRock betweenthe tunnels

10
The major sources of sulphide are the groundwater and the dissolution of pyrite impurities in the bentonite /King et al. 2001/. Microbial activity may also contribute some sulphide. Sulphide minerals will start to dissolve as soon as they are contacted by the pore-water solution. In the presence of oxygen, any free sulphide ions will be oxidised to sulphate. Once all the trapped oxygen has been consumed, however, the pore-water sulphide concentration will begin to increase. Eventually, the pore-water will equilibrate with the groundwater, so that the long-term pore-water sulphide concentration will be similar to that in the groundwater (0–9 x 10⁻⁵ mol/L). Prior to equilibration with the groundwater (a few hundred years), the pore-water sulphide concentration could be as high as 0–3 x 10⁻⁴ mol/L /King et al. 2001/. The chloride concentration of the bentonite pore-water will increase with time as the buffer saturates and as the pore-water equilibrates with the groundwater. Eventually, the chloride concentration in the pore-water will equal that of the groundwater, and could reach levels as high as 0.1–0.6 mol/L /King et al. 2001/. If bentonite saturation and equilibration with the groundwater occurs quickly, saline bentonite pore-water could be present within a few hundred years. At this stage, the suggestion that the corrosion behaviour of the canisters will be affected by an alkaline plume diffusing from various cementitious materials in the repository is speculative. Although the high-pH pore fluids in the concrete will develop relatively quickly (of the order of days-months), it is by no means certain that such pore fluids will necessarily impact the environment around the canister. Elevated temperatures and pH values cause alteration and dissolution of bentonite, although under realistic temperature conditions and solid:solution ratios, the extent of alteration is limited to a distance of a few mm from the clay/solution interface after periods up to 16 months /Karnland 1997; Karnland 2001, and references therein/. Of more importance than clay alteration for the present purposes, is the effect of the high-pH concrete pore fluids on the pH of the bentonite pore solution in contact with the canister. The natural pH of bentonite pore-water (i.e., in the absence of cementitious materials) is ~pH 8.6 /Muurinen and Lehikoinen 1999/. Bentonite clays are known to have a large pH-buffering capacity, and a simple mass-balance argument can be used to assess the likely impact of the presence of concrete on the bentonite pore-water pH. It has been shown that Lake Agassiz clay (to be used as a component of the buffer and backfill materials in the proposed Canadian repository) can consume approximately 0.2 mol OH–/kg of clay by ion-exchange and other pH-buffering processes /Johnson et al. 1996/. Bentonite clays are reported to have a similar buffering capacity. Compacted bentonite with a density of 2 Mg/m3, therefore, has a pH-buffering capacity of 400 mol OH–/m3. In contrast, concrete with a porosity of 30% and a pore-solution pH of 12.5 (corresponding to a saturated Ca(OH)2 solution), contains only 9.5 mol OH–/m3. Therefore, compacted bentonite can potentially neutralise all the hydroxide ions released from a mass of concrete 40 times its volume. Since the volume of clay materials in the repository will be greater than the volume of cementitious materials, it is likely that all hydroxide ions released from the concrete will be consumed by ion-exchange on the clay minerals before reaching the canister surface.

11
2.2 Definition of possible scenarios Although it seems unlikely that an alkaline plume from cementitious materials could reach the canister, it is difficult, based on present knowledge, to definitively rule out such a possibility. The impact that the alkaline plume might have on the canister depends on the relative rates of the various processes involved in the evolution of the repository environment. Thus, the effect of an alkaline environment on the corrosion behaviour of the canister will depend on whether the increase in pH occurs during the oxic phase or only after all of the trapped oxygen has been consumed and reducing conditions have been established. In addition, the effect of high-pH conditions may be different depending upon whether the increase in pH is preceded by the increase in pore-water salinity, or whether the canister surface is pre-passivated under alkaline conditions prior to the increase in the pore-water chloride concentration. Four possible scenarios can be defined: Case 1: increase in salinity precedes alkaline plume under oxic conditions In this scenario, the increase in both pore-water salinity and pH occur within a few tens-hundreds of years, prior to the consumption of all of the initially trapped oxygen. Since the pore-water chloride concentration is assumed to increase before the increase in pH, the canister will undergo active dissolution at first, but could become passivated as the pH subsequently increases. Case 2: increase in alkalinity precedes the increase in salinity under oxic conditions Case 2 is similar to Case 1, except that the alkaline plume reaches the canister surface prior to the increase in pore-water salinity. Thus, the canister would be initially passivated by the high-pH environment, prior to the increase in chloride concentration. Case 3: increase in salinity precedes alkaline plume under anoxic conditions In this scenario, the increase in pore-water pH and salinity are slow compared with the rate of consumption of the initially trapped oxygen. Consequently, anoxic conditions have been established prior to the increase in salinity, with corrosion being supported by the reduction of water in the presence of sulphide. Case 3 is similar to Case 1 in that the increase in pore-water salinity precedes the increase in pH, so the canister undergoes a period of corrosion in a near-neutral sulphidic chloride environment prior to possible passivation as the pH increases. Case 4: increase in alkalinity precedes the increase in salinity under anoxic conditions Case 4 is similar to Case 3, except that the pore-water pH is assumed to increase before the increase in salinity. Thus, the canister is initially exposed to an alkaline sulphide-dominated environment, with a subsequent increase in pore-water salinity. Of these four cases, some are more likely to occur than others. Given the pH-buffering capacity of the bentonite discussed above, it is likely that the alkaline plume will only increase the pore-water pH after the increase in salinity. Therefore, Cases 2 and 4 are less likely to occur in practice than Cases 1 or 3. It is less certain whether the increase in pore-water salinity and pH will occur during the oxic or anoxic phase in the evolution of repository redox conditions. Given that the large pH-buffering capacity of the clay should delay the

12
arrival of the alkaline plume, it is, perhaps, more likely that anoxic conditions will be established prior to any change in pore-water pH or salinity (Case 3). There are, of course, a number of intermediate situations, with the increase in pore-water salinity (or pH) occurring during the oxic phase and the increase in pH (or salinity) delayed until the establishment of anoxic conditions. In addition, for Cases 1 and 2, the environment will eventually become anoxic and dominated by sulphide species. For the present purposes, however, these four scenarios will be used to assess the possible impact of high-pH saline conditions on the corrosion of copper canisters (see chapter 5).

13
3 Thermodynamic stability, solubility and speciation of copper in alkaline solutions
3.1 Potential-pH diagrams Potential-pH (Pourbaix) diagrams can be used to predict the relative stability of solid and dissolved species as a function of redox conditions and pH. Figure 3-1 shows a series of simplified Pourbaix diagrams for the system Cu-Cl–-H2O at 25oC for chloride concentrations ranging from 10–3 mol/kg to 1 mol/kg. In these simplified diagrams, only the most stable species (solid or dissolved) is shown for any combination of E and pH. The boundary between dissolved and solid species has been defined for a total dissolved copper concentration of 10–6 mol/kg. The appearance of the Pourbaix diagrams depends on the solid and dissolved species considered. The solid species considered here include: Cu, Cu2O, CuO, and Cu(OH)2. A notable species absent from the thermodynamic database used /Outokumpu 1999/ is basic cupric chloride CuCl2⋅3Cu(OH)2. The dissolved species considered here include: Cu+, Cu2+, CuCl2
–, CuCl32–, CuCl+, CuCl3
–, CuCl42–, CuO2
2–, and HCuO2–.
Figure 3-1(a) shows the predicted areas of stability for the species considered for a chloride concentration of 10–3 mol/kg. (An identical diagram is obtained for lower chloride concentrations). At such low chloride concentrations, none of the predominant solid and dissolved species contains chloride. At the natural pH of bentonite pore-water (~pH 8.6), the stable Cu solid is either Cu2O or CuO, depending upon the redox potential. Cupric oxide is more stable that the corresponding hydroxide (Cu(OH)2), even though the latter is usually observed during short-term experiments (see chapter 4). In the moderately alkaline range, Cu2O and CuO are in equilibrium with dissolved Cu+ and HCuO2
–, respectively. With increasing pH, the stability field of Cu2O shifts to more reducing potentials. At more positive redox potentials, the solubility of Cu(II) increases with pH due to the formation of HCuO2
– and CuO2
2–. For a total dissolved copper concentration of 10–6 mol/kg, the boundary between solid CuO and dissolved CuO2
2– occurs at ~pH 13.9, so that at extremely high pH solid CuO will not form unless the dissolved copper concentrations exceeds 10–6 mol/kg. For the thermodynamic database used here, HCuO2
– is predicted to predominate at 9.2 < pH <13.8, with Cu2+ stable at lower pH and CuO2
2– stable at higher pH values. Increasing chloride concentration has a relatively modest effect on the stability of solid and dissolved copper species, especially in the range of alkaline pH values of interest here. Figures 3-1(b) to 3-1(d) illustrate the effect of increasing chloride concentrations up to 1 mol/kg. Chloride ions have the largest effect at neutral and acidic pH, with dissolved Cu(I) becoming stabilised as CuCl2
– and CuCl+ becoming more stable than Cu2+ at a chloride concentration of between 0.1 and 1 mol/kg. In the moderately alkaline range (pH 7–9), the major effect of increasing chloride concentration is to increase the solubility of Cu2O. The pH at which Cu2O will precipitate from a solution containing 10–6 mol/kg dissolved copper increases from pH 6.4 for 0.01 mol/kg Cl–, to pH 8.4 in 0.1 mol/kg Cl–, and to pH 10.6 in 1 mol/kg Cl–.

14
(a) 10–3 mol/kg chloride
(b) 0.01 mol/kg chloride
14121086420
2.0
1.5
1.0
0.5
0.0
-0.5
-1.0
-1.5
-2.0
Cu - Cl - H2O - System at 25.00 C
C:\MY DOCUMENTS\2001_02\SKB ALKALINE CHLORIDE\CUCL25.IEP pH
Eh (Volts)
Cu
CuO
Cu2O
Cu(+2)
CuCl2(-)
CuO2(-2)
14121086420
2.0
1.5
1.0
0.5
0.0
-0.5
-1.0
-1.5
-2.0
Cu - Cl - H2O - System at 25.00 C
C:\MY DOCUMENTS\2001_02\SKB ALKALINE CHLORIDE\CUCL25.IEP pH
Eh (Volts)
Cu
CuO
Cu2O
Cu(+2)CuO2(-2)

15
(c) 0.1 mol/kg chloride
(d) 1 mol/kg chloride
Figure 3-1. Potential/pH (Pourbaix) diagrams for the system Cu/Cl–/H2O at 25oC for various chloride concentrations. (a) 10–3 mol/kg, (b) 0.01 mol/kg, (c) 0.1 mol/kg, (d) 1 mol/kg chloride. All diagrams constructed for a total dissolved copper concentration of 10–6 mol/kg using the Outukumpu thermodynamic database /Outokumpu 1999/. Solid species considered: Cu, Cu2O, CuO, Cu(OH)2; dissolved species considered: Cu+, Cu2+, CuCl2
–, CuCl32–, CuCl+,
CuCl3–, CuCl4
2–, CuO22–, and HCuO2
–. In the diagrams, the number in parentheses indicates the charge of dissolved ions.
14121086420
2.0
1.5
1.0
0.5
0.0
-0.5
-1.0
-1.5
-2.0
Cu - Cl - H2O - System at 25.00 C
C:\MY DOCUMENTS\2001_02\SKB ALKALINE CHLORIDE\CUCL25.IEP pH
Eh (Volts)
Cu
CuO
Cu2O
CuCl(+)
CuCl3(-2)
CuO2(-2)
14121086420
2.0
1.5
1.0
0.5
0.0
-0.5
-1.0
-1.5
-2.0
Cu - Cl - H2O - System at 25.00 C
C:\MY DOCUMENTS\2001_02\SKB ALKALINE CHLORIDE\CUCL25.IEP pH
Eh (Volts)
Cu
CuO
Cu2O
Cu(+2)
CuCl2(-)
CuO2(-2)

16
The absence of CuCl2⋅3Cu(OH)2 from the thermodynamic database has little effect on the predicted stability of CuO in the alkaline pH range. Even at a chloride concentration of 1 mol/kg, CuO is more stable than CuCl2⋅3Cu(OH)2 for pH >8 /King et al. 2001/. Figure 3-2 shows a simplified E-pH diagram for the Cu-S-H2O system at 25oC for a total copper concentration of 10–6 mol/kg and a total S concentration of 10–3 mol/kg. Bentonite pore-water is predicted to contain up to 9 x 10⁻⁴ mol/L sulphide, based on the groundwater composition at Olkiluoto /King et al. 2001/. The solid and dissolved species considered in the construction of Figure 3-2 were Cu, Cu2O, CuO, Cu2S, CuS, and S, and Cu+, Cu2+, CuO2
2–, HCuO2
–, H2S, HS–, and S2–. The first and second dissociation constants for H2S are pK = 7.00 and 13.90, respectively, so that dissolved sulphide species exist predominantly as HS– in the alkaline pH range of interest here. Because of the low solubility of both Cu2S and CuS, these precipitated solids dominate over the entire pH and potential ranges expected in a repository. Solid Cu2S is stable at potentials more negative than that at which Cu2O forms. With increasing potential, CuS becomes the stable solid, with CuO only forming at relatively positive redox potentials. Decreasing S concentration has relatively little effect on the appearance of the E-pH diagram, slightly shifting the Cu/Cu2S boundary to higher potentials at lower sulphur concentrations. However, the stability field of Cu2S extends beyond the stability field of H2O, even at a S concentration of 10–5 mol/kg. Thus, H2O will act as an oxidant for the corrosion of Cu even at very low sulphide concentrations.
Figure 3-2. Potential/pH (Pourbaix) diagrams for the system Cu/S/H2O at 25oC for a total sulphur concentration of 10–3 mol/kg. The diagram was constructed for a total dissolved copper concentration of 10–6 mol/kg using the Outukumpu thermodynamic database /Outokumpu 1999/. Solid species considered: Cu, Cu2O, CuO, Cu2S, CuS, and S; dissolved species considered: Cu+, Cu2+, CuO2
2–, HCuO2–, H2S, HS–, and S2–. In the diagrams, the
number in parentheses indicates the charge of dissolved ions.
14121086420
2.0
1.5
1.0
0.5
0.0
-0.5
-1.0
-1.5
-2.0
Cu - S - H2O - System at 25.00 C
C:\MY DOCUMENTS\2001_02\SKB ALKALINE CHLORIDE\CUS25.IEP pH
Eh (Volts)
CuO
CuS
Cu
Cu2S
Cu(+2)CuO2(-2)

17
Figure 3-3. Expanded view of the potential/pH diagram for the Cu/S/H2O system at 25oC for a total sulphur concentration of 10–5 mol/kg. Total dissolved copper concentration of 10–6 mol/kg. There is evidence that copper is thermodynamically stable in alkaline solutions at low S concentrations. Figure 3-3 shows an expanded view of the E-pH diagram for a total S concentration of 10–5 mol/kg. Copper metal is predicted to be stable within the stability field of water for pH > 12.5. With decreasing [S] the pH at which copper is stable will also decrease and the potential range will shift to more-positive values. Figures 3-2 and 3-3 differ from those predicted by other authors /e.g., Puigdomenech and Taxén 2000/, which show a second stability range for Cu metal between that for copper sulphides and copper oxide. These differences are presumably a consequence of using different thermodynamic databases. However, the potential/pH diagram given in /Puigdomenech and Taxén 2000/ also suggests that Cu metal is stable in water for pH > 13. 3.2 Solubility and speciation of dissolved copper The concentration and composition of dissolved copper depends on the nature of the copper solid and the pH, chloride concentration, and temperature. Since Cu2O and CuO are the thermodynamically favoured solids in alkaline solution (Figure 3-1), the following analysis considers the solubility and corresponding speciation of dissolved copper in contact with one or other of these solids.
1413121110
0.0
-0.1
-0.2
-0.3
-0.4
-0.5
-0.6
-0.7
-0.8
-0.9
-1.0
Cu - S - H2O - System at 25.00
C:\MY DOCUMENTS\2001_02\SKB ALKALINE CHLORIDE\CUS25.IEP pH
Eh (Volts)
CuS
Cu
Cu2S

18
For the solubility of Cu2O, the following dissolved copper species are considered: Cu+, CuOH, Cu(OH)2
–, CuCl2–, Cu2+, CuOH+, Cu(OH)2, Cu(OH)4
2–, and CuCl+. Cupric species are assumed to be produced by the disproportionation of Cu(I), according to Cu2O + 2H+ = Cu2+ + H2O + Cu 3-1 No other redox reactions are considered. In the case of the solubility of CuO, only dissolved Cu(II) species are considered; namely: Cu2+, CuOH+, Cu(OH)2, Cu(OH)4
2–, and CuCl+. Figures 3-4 to 3-6 show the effect of pH, chloride concentration, and temperature on the solubility of Cu2O and speciation of dissolved copper. The solubility displays a minimum in the alkaline pH range, the exact pH of the minimum being a function of chloride concentration and temperature (Figure 3-4). At pH values below the minimum, the solubility of Cu2O is a strong function of the chloride concentration, due to the predominance of dissolved CuCl2
– in this region (Figure 3-5). At pH values greater than the minimum, the solubility is independent of the chloride concentration, because the most predominant species are Cu(OH)2
– and, to a lesser extent, Cu(OH)2. The position of the pH minimum shifts with increasing chloride concentration. Thus, in 10–3 mol/L Cl–, the minimum solubility of Cu2O occurs at a pH of ~8.8 at 25oC (Figure 3-4(a)), but increases to ~pH 12 in the presence of 1 mol/L Cl–. Temperature affects both the total solubility and the position of the pH minimum. At pH values below the minimum solubility, the solubility is relatively insensitive to temperature, presumably because of the lack of temperature-dependence of the stability of CuCl2
– (Figure 3-4(b)). However, because of the increase in stability of Cu(OH)2
– and Cu(OH)2 with increasing temperature, the solubility of Cu2O in alkaline solution (i.e., at pH values above the minimum solubility) increases with temperature. There is a corresponding shift in the pH of minimum solubility to lower values with increasing temperature. The data from Figure 3-4(a) have been re-plotted to illustrate the effect of chloride concentration on the solubility of Cu2O in alkaline solutions (Figure 3-6). In strongly alkaline solutions (pH12 and 14), the solubility of Cu2O is relatively independent of chloride concentration because the predominant species are the hydroxyl complexes of Cu(I) and Cu(II) (Figure 3-5). In less-alkaline solutions (pH 8 and 10), the solubility of Cu2O exhibits a minimum with increasing chloride concentration. At low chloride concentrations (less than ~10–3 mol/L), complexation of Cu(I) and Cu(II) by chloride is minimal, but increasing chloride concentration results in increasing solubility due to the stabilisation of CuCl2
– and, to a much lesser degree, CuCl+. The solubility of CuO also displays a pH minimum (Figure 3-7). Unlike Cu2O, however, the pH minimum is relatively insensitive to chloride concentration, being in the range pH 8–9 for chloride concentrations of 10–3–1 mol/L. The solubility of CuO is predicted to decrease with increasing chloride concentration at all pH values. In dilute solutions (10–3 mol/L Cl–), the predominant dissolved species are Cu2+ below the pH minimum and Cu(OH)2 above the pH minimum. In contrast, CuCl+ predominates below the pH minimum in 1 mol/L Cl– solution, with Cu(OH)2 predominant above the pH minimum (Figure 3-8). (Note: unlike the case for Cu2O for which both Cu(I) and Cu(II) species were considered, CuO is assumed here to dissolve only as Cu(II)).

19
(a) 25oC
(b) 75oC Figure 3-4. Dependence of the solubility of Cu2O on pH as a function of chloride concentration. (a) 25oC, (b) 75oC. Dissolved species considered: Cu+, CuOH, Cu(OH)2
–, CuCl2
–, Cu2+, CuOH+, Cu(OH)2, Cu(OH)42–, and CuCl+.
-10
-8
-6
-4
-2
0
2
2 4 6 8 10 12 14
pH
Lo
g to
tal d
isso
lved
co
pp
erco
nce
ntr
atio
n (m
ol/L
)
1e-3 M Cl
0.01 M Cl
0.1 M Cl
1 M Cl
-10
-8
-6
-4
-2
0
2
2 4 6 8 10 12 14
pH
Lo
g to
tal d
isso
lved
co
pp
erco
nce
ntr
atio
n (m
ol/L
)
1e-3 M Cl
0.01 M Cl
0.1 M Cl
1 M Cl

20
(a) 10–3 mol/L chloride
(b) 1 mol/L chloride Figure 3-5. Speciation of dissolved copper in equilibrium with Cu2O as a function of pH at 25oC. (a) 10–3 mol/L chloride, (b) 1 mol/L chloride.
-25
-20
-15
-10
-5
0
5
2 4 6 8 10 12 14
pH
Lo
g c
on
cen
trat
ion
(m
ol/L
)
Cu+CuOHCu(OH)2-CuCl2 -Cu++CuOH+Cu(OH)2Cu(OH)4- -CuCl+
-25
-20
-15
-10
-5
0
5
2 4 6 8 10 12 14
pH
Lo
g c
on
cen
trat
ion
(m
ol/L
)
Cu+CuOHCu(OH)2-CuCl2 -Cu++CuOH+Cu(OH)2Cu(OH)4- -CuCl+

21
Figure 3-6. Dependence of the solubility of Cu2O on chloride concentration in alkaline solution at 25oC. Figure 3-7. Dependence of the solubility of CuO on pH as a function of chloride concentration at 25oC. Dissolved species considered: Cu2+, CuOH+, Cu(OH)2, Cu(OH)4
2–, and CuCl+.
-10
-9
-8
-7
-6
-5
-4
-3
-2
-6.0 -5.0 -4.0 -3.0 -2.0 -1.0 0.0
Log chloride concentration (mol/dm3)
Lo
g to
tal d
isso
lved
co
pp
erco
nce
ntr
atio
n (m
ol/d
m3 )
pH 8 pH 10
pH 12 pH 14
-10
-8
-6
-4
-2
0
2
2 4 6 8 10 12 14
pH
Lo
g t
ota
l dis
solv
ed c
op
per
con
cen
trat
ion
(m
ol/L
) 1e-3 M Cl
0.01 M Cl
0.1 M Cl
1 M Cl

22
Figure 3-8. Speciation of dissolved copper in equilibrium with CuO as a function of pH in the presence of 1 mol/L chloride at 25oC. Figure 3-9. Dependence of the solubility of CuO on chloride concentration in alkaline solution at 25oC.
-10
-9
-8
-7
-6
-5
-4
-3
-2
-6 -5 -4 -3 -2 -1 0
Log chloride concentration (mol/L)
Lo
g t
ota
l dis
solv
ed c
op
per
con
cen
trat
ion
(m
ol/L
)
pH 8
pH 10
pH 12
pH 14
-25
-20
-15
-10
-5
0
5
2 4 6 8 10 12 14
pH
Lo
g c
on
cen
trat
ion
(m
ol/L
)
Cu++CuOH+Cu(OH)2Cu(OH)4- -CuCl+

23
Because of the predominance of dissolved Cu(OH)2 in alkaline solutions, the solubility of CuO decreases with increasing chloride concentration at pH values above the pH minimum (Figure 3-9). Increasing chloride concentration results in greater stabilisation of CuCl+ which, in turn, results in lower Cu(OH)2 concentrations. The solubility of Cu2S and the speciation of dissolution copper are functions of pH and sulphide concentration. Figure 3-10 shows the dependence of the solubility of Cu2S on pH based on the data of /Mountain and Seward 1999/. The dissolved copper species considered were CuHS, Cu(HS)2
–, and Cu2S(HS)22–. Unlike the solubility of Cu2O and CuO, Cu2S
displays a solubility maximum in the acid-neutral pH solutions. In acidic solutions, the solubility is independent of pH but varies with [HS–]0.5. In this pH range the speciation is dominated by dissolved CuHS (Figure 3-11) formed according to /Mountain and Seward 1999/ Cu2S + HS– + H+ = 2CuHS(aq) 3-2 In the near-neutral pH range, the predominant speciation depends on the sulphide concentration. Dissolved CuHS continues to predominate over the entire pH range in dilute sulphide solutions (e.g., 10–5 mol/L, Figure 3-11(a)), but Cu(HS)2
– predominates over the range pH 6–12.5 at a sulphide concentration of 0.001 mol/L Cu2S + 3HS– + H+ = 2Cu(HS)2
– 3-3
Figure 3-10. Dependence of the solubility of Cu2S on pH and sulphide concentration from the data of /Mountain and Seward 1999/. Dissolved species considered: CuHS, Cu(HS)2
–, and Cu2S(HS)2
2–. Total sulphide concentrations from 10–5 mol/L to 0.001 mol/L.
-13
-12
-11
-10
-9
-8
2 4 6 8 10 12 14
pH
log
10 s
olu
bili
ty o
f C
u2S
(m
ol/L
)
1e-3 mol/L S
1e-4 mol/L S
1e-5 mol/L S

24
(a) 10–5 mol/L total sulphide
(b) 0.001 mol/L total sulphide
Figure 3-11. Dependence of the speciation of dissolved copper in sulphide solutions on pH. Total sulphide concentrations of (a) 10–5 mol/L and (b) 0.001 mol/L.
-16
-14
-12
-10
-8
2 4 6 8 10 12 14
pH
log
10 c
on
cen
trat
ion
(m
ol/L
) [Cu(HS)2-]
[Cu2S(HS)22-]
[CuHS]
-16
-14
-12
-10
-8
2 4 6 8 10 12 14
pH
log
10 c
on
cen
trat
ion
(m
ol/L
)
[Cu(HS)2-]
[Cu2S(HS)22-]
[CuHS]

25
This leads to a maximum in the solubility of Cu2S in 0.001 mol/L sulphide at ~pH 7. In highly alkaline solutions (pH > 12.5), Cu2S(HS)2
2– predominates in concentrated sulphide solutions Cu2S + 2HS– = Cu2S(HS)2
2– 3-4 In both 10–5 mol/L and 0.001 mol/L sulphide, the solubility of Cu2S decreases significantly above ~pH 13 as HS– is replaced in solution by S2–.

27
4 Behaviour of copper in alkaline environments 4.1 Passivation in alkaline solutions 4.1.1 Passivation in absence of carbonate The passivation of copper in alkaline solutions has been studied in great detail. In many ways, the Cu/Cu2O/CuO, Cu(OH)2 system has been a model electrochemical system for study, as well as being of some practical importance. There is general agreement that passivation is accompanied by the formation of a duplex Cu2O/Cu(II) film, with the Cu(II) layer (either CuO or Cu(OH)2) responsible for passivity. There are differences in some of the detailed mechanisms proposed for the formation and dissolution of these layers, as discussed below. A wide range of experimental techniques has been used to study the passivation of copper in alkaline solutions. The most commonly used electrochemical technique employed is cyclic voltammetry, with virtually all investigators using this method to control the electrochemical potential of the surface /Abd El Hayeem and Ateya 1981; Abrantes et al. 1984; Adeloju and Duan 1994a; Ambrose et al. 1973a,b; Brisard et al. 1995; Burke et al. 1990; Burleigh 1989; Collisi and Strehblow 1990; Deutscher and Woods 1986; Dong et al. 1992; Gennero de Chialvo et al. 1984; Hamilton et al. 1986; Sander et al. 1981; Shirkanzadeh et al. 1990; Shoesmith et al. 1976, 1977, 1983; Strehblow and Speckmann 1984; Strehblow and Titze 1980; Wilhelm et al. 1982/. Some workers have also used potentiostatic techniques to study the passivation of copper /Ambrose et al. 1973a,b; Burstein and Newman 1981/. Potentiostatic measurements have the advantage that film formation occurs under steady-state conditions, so that the nature of the film formed at a given potential can be definitively identified. Unfortunately, relatively few studies have been performed at the open-circuit potential with the potential determined by the presence of dissolved oxygen or other oxidants /Adeloju and Duan 1994a; Kruger 1961; Shoesmith et al. 1977; Sutter et al. 1993/. These latter conditions are most relevant to the behaviour of copper canisters in a repository. Voltammetric techniques have been combined with the use of rotating ring- and split-ring disc electrodes to study the role of soluble copper species during film formation and dissolution /Gennero de Chialvo et al. 1984; Shirkanzadeh et al. 1990; Strehblow and Speckmann 1984/. A number of surface analytical techniques have been used to help identify the nature of the corrosion product films. Various investigators have used in situ techniques to avoid problems with transferring air-sensitive surface films through the atmosphere, including photo-electrochemistry /Abrantes et al. 1984; Aruchamy and Fujishima 1989; Bertocci 1978; Burleigh 1989; Collisi and Strehblow 1986, 1990; Liu et al. 1993; Modestov et al. 1995; Sutter et al. 1993; Sathiyamarayanan et al. 1992/, X-ray absorption fine structure (EXAFS) /Druska and Strehblow 1992/, photo-acoustic spectroscopy /Sander et al. 1981; Strehblow and Speckmann 1984/, Raman and surface-enhanced Raman spectroscopy /Hamilton et al. 1986; Niaura 2000/; ellipsometry /Kruger 1961/, and probe beam deflection /Brisard et al. 1995/. Other authors have used ex situ techniques, either rapidly transferring the samples through air to the vacuum chamber or using special evacuated transfer chambers to protect the surface films from oxidation. The ex situ techniques have included: ion back-scattering analysis

28
Figure 4-1. Typical cyclic voltammogram of the formation and reduction of surface oxide/hydroxide films on copper in alkaline solution /Collisi and Strehblow 1990/. /Strehblow and Speckmann 1984; Strehblow and Titze 1980/, X-ray photoelectron spectroscopy (XPS) /McIntyre et al. 1981; Strehblow and Speckmann 1984; Strehblow and Titze 1980/, and X-ray diffraction combined with EDX analysis /Shoesmith et al. 1976/. Figure 4-1 shows a typical cyclic voltammogram reported for the formation and reduction of surface oxides/hydroxides on copper in alkaline solutions /Collisi and Strehblow 1990/. Starting from a cleaned copper surface (at a potential more negative than –0.8 VSHE for the scan in Figure 4-1), two major oxidation peaks are observed as the potential is scanned to more positive potentials. These two peaks are associated with the formation of Cu2O (AI) and Cu(II) (AII), respectively. As discussed in more detail below, various pre-peaks and fine structure are reported for either or both peaks, as seen on the cathodic side of peak AII in Figure 4-1. A third stage of oxidation to Cu2O3 is reported at potentials close to that for oxygen evolution (ca. +0.8 VSHE), but this occurs at potentials far more positive than those of interest here. When the potential scan is reversed after the formation of the two anodic peaks, two cathodic peaks are observed (CI and CII), corresponding to the reduction of the surface films formed during the anodic potential scan. It is generally reported that peaks AI and CI are coupled, as are peaks AII and CII, inferring that the two cathodic peaks correspond to the reduction of Cu2O (peak CI) and Cu(II) (peak CII), respectively. However, again as discussed in more detail below, different interpretations have also been offered. All investigators concur that peak AI corresponds to the formation of Cu2O via the general reaction 2Cu + 2OH– → Cu2O + H2O + 2e– 4-1

29
The film thickness observed during cyclic voltammetry is thin, limited to a few monolayers. /Abd El Haleem and Ateya 1981/ suggest that the film thickness increases with pH, being ~1 monolayer thick in 0.1 mol/L NaOH (~pH 13) and ~2 monolayers thick in 1 mol/L NaOH (~pH 14). /Abrantes et al. 1984/ argue that, because the Cu2O film is a p-type semiconductor and film growth at potentials below the flat-band potential involves the migration of Cu+ cations against the electric field in the film, the film thickness is effectively limited to a few monolayers. The film is reported to grow via a solid-state mechanism /Shoesmith et al. 1983/, although rotating ring- and split-ring disc electrode studies have shown the presence of soluble Cu(I) species at potentials around peak AI suggesting the involvement of dissolution processes as well /Strehblow and Speckmann 1984; Gennero de Chialvo et al. 1984; Shirkanzadeh et al. 1990/. The Cu2O film is clearly protective to some degree, since the current falls significantly following film formation /Burke et al. 1990/. Some authors report pre-peaks at potentials more cathodic to peak AI and/or fine structure in the main oxidation peak /Burstein and Newman 1981; Gennero de Chialvo et al. 1984; Shirkanzadeh et al. 1990/. These features are attributed to the formation of pre-cursor species, such as Cu + OH– → CuOHADS + e– 4-2 By introducing various potential arrests during the potential scan in the region of peak AI, /Gennero de Chialvo et al. 1984/ were able to produce fine structure in peak AI which they attributed to different types of surface site. The size of the different fine structure peaks depended on the hold time, leading the authors to suggest that the more-energetic of the different pre-cursor species (identified as Cu*OHADS and Cu2
*O) could age and transform into the less-energetic species CuOHADS and Cu2O. Support for the overall mechanism defined by reaction 4-1 comes from the probe beam deflection studies of /Brisard et al. 1995/. In this technique, the deflection of a laser beam angled close to the electrode surface is used to indicate changes in refractive index (ri), corresponding to changes in the concentration of the solution. Thus, in alkaline solution, a decrease in the refractive index (concentration) indicates the consumption of OH– or the production of H2O, and an increase in the r.i. indicates an increase in concentration. The observed deflection of the beam away from the electrode in the region of peak AI in 0.01–1 mol/L KOH is caused by a decrease in concentration, both because of the consumption of OH– and because of the production of H2O (equation 4-1). If the potential is reversed prior to the formation of peak AII, only one cathodic peak (CI) is observed. This indicates that peak CI is due to the reduction of Cu2O via the reverse of reaction 4-1 /Burke et al. 1990; Strehblow and Titze 1980/ Cu2O + H2O + 2e– → 2Cu + 2OH– 4-3 The nature of peak AII and the mechanism of film formation is more uncertain than for peak AI. First, the species responsible for passivation has been variously identified as Cu(OH)2 /Brisard et al. 1995; Sander et al. 1981; Shoesmith et al. 1976; Strehblow and Titze 1980/ or CuO /Shoesmith et al. 1976/. Whilst CuO is the thermodynamically stable species, it is apparent that the formation of Cu(OH)2 is kinetically favoured /Burke et al. 1990; Shoesmith et al. 1976/. It is difficult to distinguish between CuO and Cu(OH)2 using many of the in situ

30
techniques used to investigate the passivation of copper and, of course, samples examined by ex situ high-vacuum techniques are prone to dehydration prior to analysis. However, photo-acoustic spectroscopy in 0.1 mol/L KOH strongly suggests the formation of Cu(OH)2, rather than CuO /Sander et al. 1981/. The formation of CuO tends to be favoured by slow rates of oxidation /Shoesmith et al. 1976/. /Burke et al. 1990/ propose the formation of a hydrous Cu(II) oxide with an open porous structure, and suggest a formula of 2CuO(OH)0.5. The second issue concerning peak AII is whether the Cu(II) film forms from the direct oxidation of Cu metal or from the oxidation of the underlying Cu2O film, or both: Cu2O + 2OH– + H2O → 2Cu(OH)2 + 2e– 4-4 and/or Cu + 2OH– → Cu(OH)2 + 2e– 4-5 The consensus of opinion appears to be that the Cu(II) film is at least partially formed from the oxidation of the pre-existing Cu2O film /Abd El Haleem and Ateya 1981; Abrantes et al. 1984; Ambrose et al. 1973a,b; Brisard et al. 1995; Burke et al. 1990; Deutscher and Woods 1986; Strehblow and Titze 1980/. The outer Cu(II) film forms by a dissolution-precipitation mechanism and leaves a porous, partially dissolved underlying Cu2O layer in contact with the copper surface. An increase in the electrode capacitance as the Cu(II) layer forms has been explained as being due to an increase in the porosity of the underlying Cu2O layer /Abrantes et al. 1984/. /Brisard et al. 1995/ have suggested a change in mechanism between pH 12 and pH 13. Based on probe beam deflection studies, they were able to demonstrate that, at pH 12, the underlying Cu2O film is converted to Cu(OH)2 via reaction 4-4, rather than to CuO via Cu2O + 2OH– → 2CuO + H2O + 2e– 4-6 The change in r.i. of the solution around peak AII was smaller than that associated with peak AI, suggesting a smaller change in OH– concentration as a consequence of film formation. Reaction 4-4 results in the consumption of one H2O molecule for every two hydroxide ions consumed, thus minimising any concentration change, whereas reaction 4-6 produces H2O, thus further diluting the solution near the surface. More complicated behaviour was observed in the region of peak AII at pH 13–14, but based on a fit of the observed probe beam deflection data to a simple model, /Brisard et al. 1995/ suggest the formation of Cu(II) in highly alkaline solutions proceeds via direct oxidation of copper: Cu → Cu2+ + 2e– 4-7(a) Cu2+ + 2OH– → Cu(OH)2 ↔ CuO + H2O 4-7(b) Cu + 2OH– → CuO + H2O + 2e– 4-7(c) Thus, at sufficiently high pH, it is suggested that Cu(II) forms from the direct oxidation of copper metal, as opposed to the oxidation of Cu(I) observed at more-moderate pH.

31
The structure of the precipitated Cu(OH)2 layer depends on the conditions under which it is formed /Shoesmith et al. 1976/. As the Cu2O layer oxidises to Cu(II), the inner layer becomes more porous and permits direct dissolution of the underlying copper surface as Cu(II) /Shoesmith et al. 1983/. Precipitation of Cu(OH)2 eventually blocks the pores of the underlying Cu2O layer, resulting in passivation. At more positive potentials, corresponding to faster rates of formation, the Cu(OH)2 film comprises a larger number of randomly orientated crystals. At more negative potentials, a smaller number of highly–ordered crystals are observed, along with a greater propensity for CuO formation. Since the Cu(II) film is primarily responsible for the passivity of copper in alkaline solutions /Strehblow and Titze 1980/, it is likely that slowly grown films are more protective than rapidly formed layers. /Shoesmith et al. 1976/ suggested the Cu(OH)2 film has a bi-layer structure, with a base layer of Cu(OH)2 crystals formed by a solid-state mechanism and an outer layer formed by dissolution-precipitation. The processes responsible for peak CII have not been completely resolved. Because peak CII appears to be strongly coupled to peak AII, most investigators believe that the reduction peak simply represents the reverse process 2Cu(OH)2 + 2e– → Cu2O + 2OH– + H2O 4-8(a) or 2CuO + H2O + 2e– → Cu2O + 2OH– 4-8(b) Confirmatory evidence for this comes from photo-acoustic spectroscopy measurements, which clearly show the reduction of Cu(OH)2/CuO prior to the reduction of Cu2O /Sander et al. 1981/. The Cu2O so formed, plus any remaining Cu2O formed during the oxidation cycle, is then reduced during peak CI, with the charge associated with peak CI being much larger than that associated with peak CII as a consequence. Others suggest that peak Cu2O is reduced prior to Cu(OH)2/CuO on the reverse scan /Burke et al. 1990; Deutscher and Woods 1986; Shoesmith et al. 1983/, because the intermediate Cu2O film is electrically insulating and reduction of the outermost Cu(II) layer is not possible until the inner Cu2O layer is partially reduced itself. In addition to electrochemical reduction during the cathodic potential scan, precipitated films can also be “chemically” dissolved from the surface. Cupric species become increasingly soluble with increasing pH (see section 3.2), due to the formation of HCuO2
– and CuO22–.
The charge associated with peaks AI and AII is invariably greater than that associated with the reduction peaks CI and CII, since part of the precipitated films dissolves prior to its electrochemical reduction. Because of the importance of the precipitated Cu(OH)2 in imparting passivity, /Shoesmith et al. 1977/ have studied the dissolution of Cu(OH)2 in some detail. After formation of a duplex Cu(OH)2 film (comprising a porous base layer and an upper crystalline layer) under potentiostatic conditions in 1 mol/L LiOH, the film was allowed to dissolve at the open-circuit potential (OCP) in solutions of various pH. The OCP was observed to go through a transition (Figure 4-2), with the time of the transition increasing with decreasing pH. The pre-transition potential was close to the equilibrium potential for the couple Cu2O/Cu(OH)2 at the particular pH, whereas the post-transition potential was close to that for the Cu/Cu2O

32
Figure 4-2. Time dependence of the open-circuit potential of a copper electrode covered by a duplex Cu(OH)2 film upon dissolution in LiOH solutions of various concentration at 20oC /Shoesmith et al. 1977/. The numbers on the curves correspond to the concentration of LiOH in mol/L. Potential given with respect to the saturated calomel electrode. couple. A reductive dissolution mechanism was proposed, involving the disproportionation of dissolved Cu(II)-hydroxide complexes: Cu(OH)2 + (n-2)OH– = [Cu(OH)n
2-n]surf 4-9(a) [Cu(OH)n
2-n]surf → [Cu(OH)n2-n]bulk 4-9(b)
[Cu(OH)n
2-n]surf + Cu = 2[Cu(OH)2–]surf + (n-4)OH– 4-9(c)
2[Cu(OH)2
–]surf → Cu2O + H2O + OH– 4-9(d) The upper- and base-layers of the precipitated Cu(OH)2 film dissolve as soluble Cu(II)-OH– complexes (reaction 4-9(a)), the rate of dissolution increasing with increasing pH and/or increasing rate of mass transport (reaction 4-9(b)). Once copper metal is exposed at the base of pores in the film, disproportionation occurs, resulting in the formation of soluble Cu(I)-OH– complexes (reaction 4-9(c)). Precipitation of Cu2O is then possible (reaction 4-9(d)) if the concentration exceeds the solubility. Once sufficient underlying copper has been exposed, the potential is controlled by the Cu/Cu2O couple. The time to pass through the transition depends on the time to expose copper at the base of pores in the film. Dissolution of Cu(OH)2 accompanied by the formation of Cu2O only occurs above a certain pH. Figure 4-3 shows the dependence of the dissolved Cu(II) concentration on pH, both for the solubility of Cu(OH)2 and for the equilibrium between Cu(II) and Cu2O. At pH <12.2, the maximum concentration of Cu(II) produced by the dissolution of Cu(OH)2 is less than that required for the precipitation of Cu2O, so that Cu(OH)2 will dissolve chemically but not by the reductive-disproportionation reaction (equations 4-9(c) and 4-9(d)). At higher pH, Cu(OH)2 is sufficiently soluble that Cu2O does precipitate, and dissolution occurs via both mechanisms.

33
Figure 4-3. Comparison of the pH-dependence of the solubility of Cu(OH)2 and of the equilibrium concentration of Cu2+ in contact with Cu2O. Cuprous oxide films on copper are semi-conducting. The nature of the semi-conducting properties is dependent on the manner in which the film is prepared. Films produced anodically by externally holding or scanning the potential invariably exhibit p-type semi-conductivity /Abrantes et al. 1984; Bertocci 1978; Burleigh 1989; Collisi and Strehblow 1990; Sathiyanarayanan et al. 1992/. In addition to being of limited thickness (see above), p-type semi-conducting Cu2O films also inhibit cathodic reactions at potentials more positive than the flat-band potential /Bertocci 1978/. When formed from the deposition of Cu(II) from solution, Cu2O tend to exhibit n-type behaviour /Aruchamy and Fujishima 1989; Bertocci 1978/, although p-type behaviour has also been reported when Cu2O is deposited from CuO2
2– in 5 mol/L OH– /Collisi and Strehblow 1990/. Prior to emplacement in the repository, the canister surface will be covered by a thermally grown film /King et al. 2001/. /Deutscher and Woods 1986/ suggest that Cu2O is the stable form of oxide when grown at temperatures <200oC, with CuO formed at higher temperatures. Interestingly, these authors reported that a Cu2O film formed at 125oC for 16 hrs exhibited exactly the same reduction potential as an anodically grown film, suggesting that much of the information derived from electrochemical studies is also relevant to thermally grown films. Relatively few studies have been reported in which copper oxide/hydroxide films have been grown under open-circuit conditions in the absence of external potential control. Such conditions are directly relevant to the conditions a canister will be exposed to in the repository, as opposed to the possibly artificial conditions introduced when using an external device to control the potential. /Adeloju and Duan 1994a/ report the growth of films on copper in aerated solution with pH values between pH 5 and pH 13.5. Only Cu2O was observed after 7 days exposure at the lowest pH studied, with increasing amounts of CuO
-8
-6
-4
-2
10 11 12 13 14
pH
Co
pp
er(
II) c
on
cen
trat
ion
(m
ol/L
)
Solubility of Cu(OH)2
[Cu(II)] in equilibrium with Cu2O
pH of Ca(OH)2
saturated solution

34
reported with increasing pH. /Kruger 1961/ grew passive films on copper in H2O equilibrated with various O2 atmospheres (1 vol.%, 10 vol.% and 100 vol.%). (Although the bulk solution was nominally at ~pH 7, the interfacial pH would have been significantly higher due to the reduction of O2 to OH–). Both Cu2O and CuO were observed, the latter being more prevalent the higher the O2 partial pressure but was not observed with 1 vol.% O2. The thickness of the Cu2O layer decreased with increasing O2 concentration, because of the greater propensity for passive Cu(II) film formation at the higher oxygen concentration. 4.1.2 Effect of carbonate on passivation Of the various other species in bentonite pore-water, the only one likely to affect the passivity of copper in alkaline solutions (apart from chloride ions) is carbonate. /Pérez Sánchez et al. 1990, 1993/ have studied the passivation of copper in alkaline carbonate solutions in the pH range pH 8.5–11. Contrary to the behaviour in neutral solutions /King et al. 2001/, the addition of carbonate to alkaline environments reduces the range of passivity of copper. Close to peak AI, CuCO3 can be formed from the oxidation of Cu(OH)ADS and/or Cu2O / Pérez Sánchez et al. 1993/. At more positive potentials (close to peak AII), basic cupric carbonates are formed (malachite CuCO3⋅Cu(OH)2 and azurite 2⋅CuCO3⋅Cu(OH)2). The formation of cupric carbonate species presumably interferes with the passive Cu(OH)2 layer, since the degree of passivity is less in carbonate than in NaOH solution of the same pH. As a consequence, a relatively high background current is observed at potentials more positive than peak AII. One consequence of the reduced passivity in carbonate solutions, however, is a smaller pit density compared with non-carbonate solutions at the same pH /Pérez Sánchez et al. 1990/. At lower pH, the presence of carbonate may promote passivation of Cu. /Adeloju and Duan 1994b/ suggest that the increased protectiveness is a consequence of pH buffering by HCO3
– which stabilises the Cu2O film, rather than the formation of basic cupric carbonate species. 4.2 Effect of chloride ions on copper corrosion in
alkaline solutions 4.2.1 Pitting of copper in alkaline chloride solutions Chloride ions have long been associated with the pitting of copper (King et al. 2001). Much of this association stems from the extensive studies of the pitting of copper water pipes in dilute potable water of near-neutral pH /Campbell 1974; Lucey 1967; Mattsson 1980; Pourbaix et al. 1967/, but there have also been a number of studies of the pitting of copper in alkaline concentrated chloride solutions /Agarwal et al. 1993; Drogowska et al. 1992, 1994; Duthil et al. 1996; Figueroa et al. 1986; Gad Allah et al. 1991; Gennero de Chialvo et al. 1985; Imai et al. 1996; Mankowski et al. 1997; Nishikata et al. 1990; Qafsaoui et al. 1993; Sridhar and Cragnolino 1993; Thomas and Tiller 1972a,b/. One method of studying pitting is through the measurement of the pitting, or breakdown, potential EB. The breakdown potential is characterised by a sudden increase in current in the passive region as the potential is scanned in the positive direction during cyclic voltammetry.

35
On the reverse potential scan, the dissolution current for the pitted surface is higher than that for the passive surface, resulting in a current hysteresis loop. Because the active dissolution of copper in chloride solutions also leads to a rapid increase in current at a characteristic potential, care must be taken to avoid confusing rapid active dissolution with film breakdown and localised corrosion /King and Kolar 2000; King et al. 2001/. The best way of distinguishing between active dissolution and pitting is the absence of a positive hysteresis loop in the former but its presence in the latter. In fact for active dissolution, the current is generally lower on the reverse potential scan because of passivation of the surface by a precipitated CuCl layer. Excluded from the discussion below are any studies in which the authors appear to have confused the increase in the rate of active dissolution for pitting corrosion. All EB data reported here have been corrected for the effects of scan rate (v) (i.e., extrapolated to zero potential scan rate), either by the authors themselves or by the present author based on a linear dependence of dEB/dv = 92 mV/(mV/s) /Drogowska et al. 1992; Gennero de Chialvo et al. 1985/. The most extensive and systematic study of the pitting of copper in alkaline chloride solutions is that of Gad Allah et al. (1991). Figure 4-4 shows the reported dependence of EB on [Cl–] for pH values between 7.26 and 13. An increase in the chloride concentration results in a decrease in EB, with a linear relationship between EB and log[Cl–]. However, the results suggest a complex dependence of EB on [Cl–] and pH since the various curves exhibit different slopes and intersect one another. /Gad Allah et al. 1991/ suggested this apparently complex behaviour was a consequence of differences in the extent of adsorption of borate ions (added to the solution as a pH buffer) with pH. Comparison with the results of other studies, as discussed below, suggests that the complex behaviour is instead a result of changes in the passive film properties at ~pH 9. Figure 4-4. Dependence of the breakdown (or pitting) potential EB on chloride concentration as a function of pH /Gad Allah et al. 1991/.
0
200
400
600
800
1000
1200
0.01 0.1 1 10
Chloride concentration (mol/L)
EB (m
VS
CE)
pH 7.26
pH 9.24
pH 10.18
pH 13

36
Figure 4-5. Compilation of literature studies of the breakdown potential for copper as a function of chloride concentration in solutions of different pH. The linear dependence of EB on log[Cl–] observed by /Gad Allah et al. 1991/ is confirmed by the results from other studies. Figure 4-5 shows the values of EB, compiled from several studies, as a function of chloride concentration for pH values between 8 and 11. At both pH 9 and pH 11, EB decreases with increasing [Cl–], although the dependence is somewhat smaller at the higher pH. The data of /Drogowska et al. 1992/ at pH 8 are misleading because the solutions contained equal concentrations of Cl– and HCO3
– ions, and the increase in EB with increasing concentration reflects the passivating properties of the HCO3
– ion rather than the aggressiveness of the Cl– ions. Both the studies of /Gad Allah et al. 1991/ and those in Figure 4-5 indicate a dependence of the aggressiveness of the chloride ion (as measured by the slope dEB/dlog[Cl–]) on pH. Figure 4-6 shows the dependence of the slopes from Figures 4-4 and 4-5 on pH. Under moderately alkaline conditions (7 < pH < 10.5), the chloride ion appears to become progressively aggressive with increasing pH. The increased aggressiveness with pH is presumably a measure of the properties of the passive film, rather than any effect of pH on the properties of the Cl– ion itself. Above a certain pH value (here at ~pH 10), the aggressiveness of the Cl– ion decreases significantly, or rather the protectiveness of the passive film increases. Chloride ions are apparently much more benign with respect to pitting in solutions of pH 11 and 13.
pH 8
-100
0
100
200
300
400
500
600
700
800
0.001 0.01 0.1 1 10
Chloride concentration (mol/L)
EB (m
VS
CE)
Drogowska et al. (1992)
pH 9
-100
0
100
200
300
400
500
600
700
800
0.001 0.01 0.1 1 10
Chloride concentration (mol/L)
EB (m
VS
CE)
Figueroa et al. (1986)
Gennero de Chialvo et al. (1985)
Qafsaoui et al. (1993)
pH 11
-100
0
100
200
300
400
500
600
700
800
0.001 0.01 0.1 1 10
Chloride concentration (mol/L)
EB (m
VS
CE)
Nishikata et al. (1990)

37
Figure 4-6. Variation of the dependence of the breakdown potential for the pitting of copper on chloride concentration with pH. The magnitude of the slope dEB/dlog[Cl–] is taken as a measure of the aggressiveness of the chloride ion. This change in film properties with pH in chloride-containing solutions is also seen in the dependence of EB on pH (Figure 4-7). In the absence of Cl– (Figure 4-7(a)), EB appears to increase gradually with increasing pH by ~17 mV/unit. However, in chloride-containing solution, EB increases rapidly at a critical pH value of ~9 (Figures 4-7(b) to 4-7(e)). At lower pH values EB is independent of pH and exhibits a value of ~200±100 mVSCE. At higher pH values, EB is also independent of pH, but displays a much higher vale of 400–800 mVSCE. The value of the upper potential plateau appears to decrease with increasing chloride concentration. The transition at ~pH 9 is less apparent at the highest [Cl–] illustrated in Figure 4-7 (1 mol/L, Figure 4-7(f)). Thus, the apparently complex behaviour observed by /Gad Allah et al. 1991/ (Figure 4-4) can be rationalised based on the pH-dependence of the passive film properties. /Figueroa et al. 1986/ studied the temperature dependence of EB in chloride-containing solutions at pH 9 (room temperature pH). The value of EB decreased with increasing temperature up to ~15oC, but then increased again at higher temperatures (Figure 4-8). The authors attributed this behaviour to an increasing rate of film breakdown with increasing temperature below 15oC, but increasing film protectiveness with temperature above 15oC, possibly associated with differing degrees of hydration of the surface film in the different temperature ranges. The dependence displayed in Figure 4-8 is in contrast to the reported temperature dependence of EB in dilute chloride solutions at pH 8.6 (0.01 mol/L HCO3
– + 0.01 mol/L Cl–) /Thomas and Tiller 1972b/. These authors reported that EB decreased with increasing temperature, although in chloride-free solution they found EB to increase with temperature (over the range 25–90oC) as observed by /Figueroa et al. 1986/.
0
100
200
300
400
500
600
700
7 8 9 10 11 12 13 14
pH
-dE
B/d
log
[Cl- ]
(mV
)
Gad Allah et al. (1991)
Nishikata et al. (1990)
Gennero de Chialvo et al. (1985)
Figueroa et al. (1986)

38
(a) (b) (c) (d) (e) (f) Figure 4-7. Dependence of the breakdown potential for the pitting of copper on solution pH for various chloride concentrations.
0.05 mol/L Cl-
0
200
400
600
800
1000
7 8 9 10 11 12 13 14
pH
EB (m
VS
CE)
Drogowska et al. (1992)
Gad Allah et al. (1991)
Gennero de Chialvo et al. (1985)
0.1 mol/L Cl-
0
200
400
600
800
1000
7 8 9 10 11 12 13 14
pH
EB (m
VS
CE)
Drogowska et al. (1992)Gad Allah et al. (1991)Gennero de Chialvo et al. (1985)Nishikata et al. (1990)Qafsaoui et al. (1993)
0.2 mol/L Cl-
0
200
400
600
800
1000
7 8 9 10 11 12 13 14
pH
EB (m
VS
CE)
Figueroa et al. (1986)
Gad Allah et al. (1991)
Gennero de Chialvo et al. (1985)
0.5 mol/L Cl-
0
200
400
600
800
1000
7 8 9 10 11 12 13 14
pH
EB (m
VS
CE)
Figueroa et al. (1986)
Gad Allah et al. (1991)Gennero de Chialvo et al. (1985)
Nishikata et al. (1990)
1 mol/L Cl-
0
200
400
600
800
1000
7 8 9 10 11 12 13 14
pH
EB (m
VS
CE)
Gad Allah et al. (1991)
Gennero de Chialvo et al. (1985)
Nishikata et al. (1990)
0 mol/L Cl-
0
200
400
600
800
1000
7 8 9 10 11 12 13 14
pH
EB (m
VS
CE)
Gonzalez et al. (1993)
Laz et al. (1992)

39
Figure 4-8. Temperature dependence of EB in pH 9 solution at two different chloride concentrations /Figueroa et al. 1986/. An alternative representation of the extent of pitting is through the pit generation rate λ0 as used by Mankowski and co-workers /Duthil et al. 1996; Mankowski et al. 1997; Qafsaoui et al. 1993/. The copper electrode is typically pre-passivated by a duplex Cu2O/CuO layer formed at an anodic potential for a given period of time, after which Cl– and/or SO4
2– ions are added to the solution. The pit generation rate is then derived from the distribution of initiation times (defined as the time to reach a given current density) from 100 samples /Qafsaoui et al. 1993/. Studies to date have been limited to pH 9 solutions. Figure 4-9 shows a summary of the results of /Duthil et al. 1996/ in Cl–/SO4
2– mixtures. Contrary to general opinion, sulphate was found to be more aggressive than Cl–. Three regions were distinguished, based on the relative effects of Cl– and SO4
2–. Region I corresponds to dilute solutions with a chloride concentration ≤5 x 10⁻⁴ mol/L, with the transition from Region II to Region III occurring at a constant [Cl–]:[SO4
2–] ratio of ~5. Based partly on the morphology of the pits (sulphate ions always resulting in hemispherical pits, but chloride producing coalesced non-hemispherical pitting /Mankowski et al. 1997/), sulphate ions were reported to be responsible for pitting in Regions I and II. In Region I, chloride ions enhance the aggressiveness of SO4
2– resulting in higher pit generation rates, whereas in Region II chloride inhibited pit generation, possibly due to incorporation of Cl– ions in the passive film. Only in Region III was chloride found to be primarily responsible for the localised corrosion. The authors suggested that sulphate ions are ~60 times more aggressive than Cl–, although based on the relative pit generation rates and the respective threshold concentrations for pitting, a factor of 15–20 times seems more appropriate.
200
300
400
500
600
700
800
0 10 20 30 40 50 60
Temperature (oC)
EB (m
VS
CE)
0.2 mol/L Cl
0.5 mol/L Cl

40
Figure 4-9. Dependence of the pit generation rate λ0 for pre-passivated copper on chloride concentration in pH 9 chloride-sulphate solutions /Duthil et al. 1996/. (a) 0.01 mol/L SO4
2–, (b) 0.02 mol/L SO4
2–, (c) 0.05 mol/L SO42–. The horizontal dashed line in each figure
represents the pit generation rate in chloride-free solutions. /Qafsaoui et al. 1993/ studied the effect of the pre-polarisation time on the pit generation rate. Longer pre-polarisation times resulted in lower pit generation rates and more-positive breakdown potentials (as indicated by the range of values in Figure 4-7(c)). This implies that thicker oxides are more resistant to pitting. /Mankowski et al. 1997/ used XRD and XPS to deduce the sequence of events involved in the pitting of pre-passivated copper in chloride and sulphate solutions. In Cl– solutions, the outer CuO layer of the duplex Cu2O/CuO passive film first dissolves, possibly as CuCl+ species, the rate of dissolution increasing with [Cl–]. The exposed underlying Cu2O layer is then partly converted to CuCl. Based on the time dependence of the current density, both the original CuO layer and the CuCl conversion layer are more protective than the underlying Cu2O film. In sulphate solutions, the outer CuO layer dissolves as in Cl– solutions, but there is no corresponding incorporation of sulphur species into the underlying Cu2O layer.

41
/Gennero de Chialvo et al. 1985/ also proposed a stepwise pitting mechanism for copper in chloride-containing solutions that involved the formation of CuCl. Unlike the mechanism of /Mankowski et al. 1997/, the upper passivating CuO/Cu(OH)2 layer was not dissolved prior to pitting attack. Instead, the first stage in pitting attack was stated to be the nucleation of precipitated CuCl at weak points in the underlying Cu2O film. These salt nuclei were then thought to grow in the depth-wise direction until they penetrated to the Cu2O/Cu interface (Stage 2). Direct localised dissolution of the underlying Cu was then proposed to occur, either in the presence of a discontinuous (Stage 3) or continuous (Stage 4) CuCl film, dissolution occurring as cuprous (CuCl2
– and/or CuCl32–) and cupric (CuCl+) species. These processes
were thought to proceed under the (non-adherent) Cu(OH)2 layer. 4.2.2 Effect of chloride on passive films on copper As stated in the Introduction, Cl– and OH– ions have opposite effects on the dissolution behaviour of copper. Chloride promotes active dissolution, whereas OH– promotes film growth and passivation. It is to be expected, therefore, that a transition in behaviour will be observed as the pH increases and/or as the [Cl–] decreases. The question is where does this transition occur, and what are the consequences of changing from active to passive behaviour, and vice versa? 4.2.2.1 Voltammetric behaviour Figure 4-10 shows a comparison of the anodic current density (i)-potential (E) behaviour for copper in chloride solutions at different pH values. The linear dependence of log i on E at pH 7 is taken from the active-dissolution model of /King et al. 1995/ for 1 mol/L Cl–. The data at pH 10.5–12 are taken from the work of /Nishikata et al. 1990/ in “concentrated Na2CO3-NaCl solution,” believed by the current author to contain 0.5 mol/L CO3
2– plus 1 mol/L Cl–. /Nishikata et al. 1990/ defined two Tafel regions (marked as Tafel I and Tafel II on Figure 4-10) and two anodic peaks (designated as AI and AII). Other authors have reported similar behaviour, e.g., /Drogowska et al. 1987/ in carbonate-free NaCl at pH 12 and /Gennero de Chialvo et al. 1985/ at pH 9. Under some conditions a third anodic peak (AIII) is observed at potentials between that for AI and AII /Gennero de Chialvo et al. 1985/. The processes responsible for these various features, and the corresponding [Cl–] and pH dependences, are a strong function of pH, as described in more detail below and as summarised in Table 4-1. Tafel slopes are observed at potentials more negative than about –300 mVSCE in both neutral and alkaline solutions (Tafel I). In both cases the reported slope is close to 60 mV/dec, but the processes responsible are entirely different. In acidic and neutral solutions, dissolution occurs as the soluble CuCl2
– species and the current is proportional to [Cl–]2 and independent of pH (table 4-1). In alkaline solutions, the current is higher than at pH 7 and is independent of [Cl–] but proportional to [OH–]. The reactions involved in this region involve the formation and dissolution of submonolayer CuOHADS and CuClADS films /Elsner et al. 1988; Gennero de Chialvo et al. 1985; King et al. 1999b/ Cu + H2O = CuOHADS + H+ + e– 4-10(a) Cu + OH– = CuOHADS + e– 4-10(b)

42
Figure 4-10. Comparison of the anodic voltammetric behaviour of copper in 1mol/L chloride solution for various pH values. The pH 7 curve is based on the active dissolution model of /King et al. 1995a/ and the data at pH 10.5–12 are taken from /Nishikata et al. 1990/. Table 4-1. Characteristics of the voltammetric behaviour of copper in chloride solutions as a function of pH. Feature pH 7 pH 9 pH >10 Tafel I 60 mV/dec
∝ [Cl–]2 ∝ [OH–]
60 mV/dec ∝ [Cl–]
∝ [OH–] Peak AI Not present IAI ∝ [Cl–] IAI ∝ [Cl–] Tafel II Not present 40 mV/dec
∝ [Cl–] ∝ [OH–]
∝ [CO32–]
Peak AIII Observed at potentials > 0 mVSCE or under stagnant mass-transport conditions
Observed for [Cl–] ≥ 0.5 mol/L
Not present
Peak AII Not present IAII ∝ [Cl–] EAII shifts to more-positive potentials with increasing [Cl–]
IAII ∝ [Cl–]
-7
-6
-5
-4
-3
-2
-500 -400 -300 -200 -100 0
Potential (mVSCE)
Lo
g c
urr
ent d
ensi
ty (A
/cm
2 )
pH 7
pH 10.5
pH 11
pH 12
Tafel I
Tafel II
AI
AII

43
Figure 4-11. Formation and reduction of CuOHADS, CuClADS and Cu2O during cyclic voltammetry of copper in 0.1 mol/L NaCl at pH 10 /King et al. 1999/. Electrode surface area 0.33 cm2, potential scan rate 100 mV/s, electrode rotation rate 14.3 Hz. Cu + Cl– = CuClADS + e– 4-10(c) CuClADS + OH– = CuOHADS + Cl– 4-10(d) CuOHADS + OH– = Cu(OH)2
– 4-10(e) CuClADS + Cl– = CuCl2
– 4-10(f) 2CuOHADS → Cu2O + H2O 4-10(g) CuClADS → CuCl 4-10(h) The electro-adsorption of H2O, OH– and/or Cl– (reactions 4-10(a)–(c)) show up as small pre-peaks at potentials less positive than that for AI (Figure 4-11). Although Cl– is generally present at a higher concentration than OH–, the electro-adsorption of the latter is faster than that of Cl–. In general, however, there is a competition between Cl– and OH– for adsorption sites (reaction 4-10(d)), with CuClADS dominating in acidic and neutral solutions, and CuOHADS becoming more important in alkaline solutions. /Nishikata et al. 1990/ proposed the following mechanism to explain the observed slope and pH dependence of Tafel I Cu + H2O = CuOHADS + H+ + e– 4-11(a)
-150
-100
-50
0
50
100
-1.4 -1.2 -1 -0.8 -0.6 -0.4 -0.2 0
Potential (VSCE)
Cu
rren
t ( µ µµµ
A) A1' A1
A2
C2
C1
44
CuOHADS → Cu+ + OH– rate-determining step 4-11(b) Although reaction 4-11 would produce the observed dependencies, it is more likely that Cu(I) dissolves as Cu(OH)2
– since the solubility of Cu+ is 1–5 orders of magnitude lower than that of Cu(OH)2
– in this pH range (see Figure 3-3(b)). As in chloride-free solutions (Figure 4-1), peak AI is associated with the formation of several monolayers of Cu2O (reaction 4-10(g)) /Drogowska et al. 1987; Gennero de Chialvo et al. 1985; Nishikata et al. 1990/. Here, there is a clear difference in the effect of Cl– on the peak current IAI as a function of pH (table 4-1). In moderately alkaline solution (pH 9), IAI increases proportionately with [Cl–], due to enhanced dissolution as CuCl2
– /Gennero de Chialvo et al. 1985/. In more-alkaline solutions (pH > 10), however, IAI is independent of [Cl–] suggesting more complete passivation of the surface by the Cu2O layer. A second Tafel region (Tafel II) was reported by /Nishikata et al. 1990/. Because of the dependence of the current on [CO3
2–] in this region (table 4-1), the occurrence of this second Tafel region may be limited to concentrated carbonate solutions only. Under some circumstances, a third anodic peak AIII (not shown in Figure 4-10) is observed at potentials between those for peaks AI and AII. /Gennero de Chialvo et al. 1985/ report the presence of AIII at chloride concentrations ≥ 0.5 mol/L at pH 9. The anodic peak is due to the formation of a thick precipitated CuCl layer (reaction 4-10(h)) and is accompanied by a large cathodic reduction peak on the reverse potential scan. Other factors that influence the formation of AIII are mass transport (faster mass transport enhances dissolution as CuCl2
– and minimises CuCl precipitation) and pH (since no such peak is observed at pH ≥ 10.5, Figure 4-10). In alkaline chloride solutions, passivation of the surface is completed by formation of a CuO/Cu(OH)2 layer (peak AII, Figure 4-10). As with peak AI, the peak current for AII increases proportionately with [Cl–] in pH 9 solution, but is independent of [Cl–] at pH ≥ 10.5. At pH 9, the peak potential for AII also shifts to more-positive potentials with increasing [Cl–], suggesting increased stabilisation of Cu(I) by complexation with Cl– and/or enhanced dissolution of Cu(II) as CuCl+ in moderately alkaline solutions. Indeed, dissolved species are observed at all potentials during the oxidation of Cu in alkaline chloride solutions, Cu(I) being observed at all potentials up to the pitting potential and Cu(II) being formed near peak AII through the passive region and extending to the pitting region /Gennero de Chialvo et al. 1985/. 4.2.2.2 Film properties The protectiveness of the passive film depends on a number of factors, including: the solubility of the precipitated solid; the adherence of the film(s) to the surface; the permeability of the film to mass transport to and from the underlying metal surface; the electrical resistivity and properties of the oxide and/or other crystalline phase; and the mechanical stability of the film (generally more important in flowing systems with high shear stresses) /Adeloju and Duan 1994a/. The transition from passive to active conditions or the localised breakdown of the passive film is often associated with spalling of the protective Cu(OH)2 layer /Gennero de Chialvo et al. 1985/.

45
Table 4-2. Dependence of the composition of the passive film on pH in chloride solutions /Modestov et al. 1995/. pH Composition of passive film pH ≤ 5.7 primarily CuCl pH 8 Cu2O/CuCl pH 8.5 Cu2O/CuCl/CuO
pH 10 Cu2O/CuO pH > 10 Cu2O/CuO, Cu(OH)2
/Modestov et al. 1995/ have determined the composition and structure of the surface film(s) on copper in Cl– solutions as a function of pH using voltammetry and photoelectrochemical techniques (table 4-2). In acidic and neutral solutions, passivation is due to a layer of CuCl. With increasing pH, the passive layer comprises increasing proportions of first Cu2O and then, at sufficiently high pH, CuO and/or Cu(OH)2. Thus, there is a gradual transition in film composition from chloride species in acidic solutions to oxide/hydroxide phases in alkaline solution. There is a transition zone at pH 8–9 in which mixed chloride/oxide surface layers are stable. One of the consequences of the incorporation of Cl– into the passive film in this transition zone is an increase in the passive current density. /Gennero de Chialvo et al. 1985/ report a 10–15 times higher passive current in the presence of 0.5 mol/L Cl– at pH 9. The enhanced current is a result of dissolution supported by the formation of soluble CuCl2
– species. The nature of the photoelectrochemical signal has resulted in some insight into how Cl– interacts with oxide films on the surface. Both /Millet et al. 1995/ and /Modestov et al. 1995/ observed both p-type and n-type photocurrents on copper in chloride-containing solutions. Although CuCl is an n-type semiconductor, both groups of authors attributed both responses to Cu2O only (based on the characteristic shape of the photocurrent spectra). /Millet et al. 1995/ report observing p-type Cu2O formation initially in NaCl solution (up to ~4 hrs), followed by increasing n-type photocurrents as the film thickened. The authors suggested that the thicker films were produced by precipitation from solution, a process typically found to produce n-type Cu2O /Millet et al. 1995/. /Modestov et al. 1995/, on the other hand, considered that the n-type characteristics they observed were due to Cl– doping of the Cu2O layer. They considered two models to explain the interaction between CuCl and Cu2O, one in which a layer of CuCl covered the Cu2O layer and the other in which CuCl “islands” were distributed at weak spots in the Cu2O. The authors favoured the layered structure, as this has a larger contact surface area between the CuCl and Cu2O phases. 4.2.2.3 Film growth Figure 4-12 shows the effect of Cl– (0.5 mol/L) on the growth kinetics of Cu2O films in neutral and moderately alkaline solutions (7 ≤ pH ≤ 8.7) /Deslouis et al. 1988a; Millet et al. 1995; Sutter et al. 1993, 1995/. The film thickens following power-law kinetics in both chloride-free and chloride-containing solution, with the film thickness W (in µm) given by W = 0.0022t0.14 4-12(a)

46
Figure 4-12. Comparative Cu2O growth kinetics in moderately alkaline solutions in the absence and presence of Cl– ions (0.5 mol/L). in the absence of Cl–, and WCl = 0.0043t0.86 4-12(b) in the presence of Cl–, where t is the exposure time (in hrs). The rate of film growth is initially about twice as fast in the chloride solution, but this increases to a factor of ~50 times faster after 96 hrs. There are a number of possible reasons for the observed effect of Cl– on the thickness and growth kinetics of the Cu2O film. In the absence of Cl–, /Abrantes et al. 1984/ have suggested that the thin p-type Cu2O layers that grow by a solid-state process are self-limiting because continued growth at potentials below the flat-band potential would require the transport of Cu+ cations against the electric field in the film. The induced n-type characteristics of Cu2O films in Cl– solutions reported by /Millet et al. 1995/ and /Modestov et al. 1995/ would prevent this self-limiting mechanism. Alternatively, the presence of Cl– may provide an additional mechanism for the formation of Cu2O. In chloride-free solutions, Cu2O formation may be limited to a solid-state process involving the dehydration of CuOHADS surface species (reaction 4-10(g)). In Cl– solutions, however, copper also dissolves as CuCl2
– species which can produce Cu2O through the hydrolysis reaction 2CuCl2
– + 2OH– → Cu2O + H2O + 4Cl– 4-13 The interfacial [CuCl2
–] will be enhanced by the increased passive current density observed in Cl– solutions /Gennero de Chialvo et al. 1985/.
0
0.05
0.1
0.15
0.2
0.25
0.3
0 20 40 60 80 100
Time (hrs)
Film
thic
knes
s ( µ µµµ
m)
Sutter et al. (1993) no Cl-
Deslouis et al. (1988)
Millet et al. (1995)
Sutter et al. (1995)

47
4.2.2.4 Conditions for active-passive transition Several authors have considered the conditions under which an actively dissolving Cu surface could become passivated. Both /Bianchi et al. 1978/ and /Faita et al. 1975/ have suggested that copper will passivate when the environmental conditions are suitable for the precipitation of Cu2O according to reaction 4-13. Based on chemical equilibrium arguments, it was suggested that the active-passive transition satisfies the expression
2
41 2
sp 2 2CuCl2
[Cl ]K K K
[CuCl ] [OH ]−
−− −
− −= = 4-14
where Ksp is the solubility product of Cu2O, given by Ksp = [Cu+]2[OH–]2 4-15 and KCuCl2– is the stability constant of CuCl2
–, given by
2
22CuCl
[CuCl ]K
[Cu ][Cl ]−
−
+ −= 4-16
Figure 4-13 shows the conditions under which equation 4-14 is satisfied for various [Cl–], pH, and [CuCl2
–], based on the thermodynamic data of /Bianchi et al. 1978/. As expected, active behaviour is favoured by higher [Cl–] and lower pH, with passive behaviour favoured by low Figure 4-13. Conditions for the precipitation of Cu2O and the transition from active to passive behaviour for copper in chloride solution /after Bianchi et al. 1978/.
-3
-2
-1
0
1
2
3
4
7 8 9 10 11 12 13
pH
log
[C
l- ] (m
ol/L
)
[CuCl2-] = 1e-3 mol/L
[CuCl2-] = 1e-4 mol/L
[CuCl2-] = 1e-5 mol/L
[CuCl2-] = 1e-6 mol/L
[CuCl2-] = 1e-7 mol/L
passive
active

48
[Cl–] and/or high pH. At a given pH, precipitation of Cu2O occurs at a higher [Cl–] (and, conversely, at a given [Cl–] precipitation occurs at a lower pH) the higher the concentration of dissolved CuCl2
–. Thus, conditions that favour high interfacial [CuCl2–], such as more-
positive potentials or more-restrictive mass-transport conditions, will also favour the formation of Cu2O. An alternative approach to identifying the active-passive transition was taken by /King and Tang 1996/. These authors were attempting to distinguish two different mechanisms for the formation of Cu2O (Figure 4-14) based on the dependence of the dissolution current of copper in chloride solutions on potential, [Cl–], pH, and the rate of mass transport. Mechanism (a) in Figure 4-14 involves formation of Cu2O by a solid-state mechanism via the dehydration of Cu(OH)ADS (reaction 4-10(g)), accompanied by the dissolution of copper as CuCl2
–. Mechanism (b) involves a dissolution-precipitation process, in which Cu2O is formed from the precipitation of dissolved Cu(OH)2
–, or the hydrolysis of CuCl2– and/or Cu+. These two
mechanisms can be distinguished on the basis of the E-, pH-, and [Cl–]-dependences of the slope and intercept of Koutecky-Levich (K-L) plots (1/i vs. 1/f1/2, where f is the rotation rate of the electrode). The K-L slope is characteristic of the mass-transport component of the dissolution current (due, for example, to the diffusion of CuCl2
– and/or Cu(OH)2– away
from the copper surface), whereas the intercept is characteristic of the preceding interfacial process(es) (such as the formation of CuClADS and/or CuOHADS). If mechanism (a) is correct,
Figure 4-14. Proposed mechanisms for the formation of Cu2O in chloride solutions /King and Tang 1996/. (a) solid-state mechanism, (b) dissolution-precipitation mechanism.

49
Figure 4-15. Dependence of the transport and interfacial reactions for the dissolution of copper on pH in 0.1 mol/L and 1 mol/L NaCl at a potential of –150 mVSCE. Electrode surface area 0.33 cm2. The vertical arrows indicate non-steady-state currents for pH >9.2. then the [Cl–]-dependence of the mass-transport component would be similar to that seen in acidic and neutral solutions /Deslouis et al. 1988a; King et al. 1995a/ and would be independent of pH. Conversely, the interfacial component would be dependent on both [Cl–] and pH. In the case of mechanism (b), the mass-transport term would have a complex pH- and [Cl–]-dependence determined by the relative concentrations of dissolved CuCl2
– and Cu(OH)2
–. /King and Tang 1996/ had expected to observe a gradual transition in the transport and interfacial components with increasing pH. Instead, a sharp change in behaviour was observed at an apparent critical value of ~pH 9.2±0.1. For pH < 9.2, the transport term was independent of pH, but increased proportional [Cl–]1.3 (Figure 4-15). The dependence on [Cl–] is less than the dependence on [Cl–]2 expected for the diffusion of CuCl2
– species, but the independence of the diffusion term on pH appears to exclude Cu(OH)2
– as a likely dissolved species under these conditions. Similarly, the interfacial term is independent of pH but increases with [Cl–]0.86. This chloride dependence is similar to that observed in acidic and neutral solutions /Deslouis et al. 1988a; King et al. 1995a/ and suggests the formation of a CuClADS intermediate species (Figure 4-14(a)). The rapid increase in the interfacial term at pH 9.27 in 0.1 mol/L Cl– (Figure 4-15) may indicate the formation of Cu(OH)ADS. For pH > 9.2±0.1, non-steady-state behaviour was observed. The anodic current decreased with time, consistent with the formation of a passivating surface film. These currents are not explicitly shown in Figure 4-14, since they fell to <1 µA within ~30 minutes, but are indicated by the vertical arrows in the figure. Post-test cathodic stripping voltammetry revealed the presence of precipitated Cu2O. The pH at which this transition from active to passive behaviour occurred was the same for both [Cl–] studied. Overall, therefore, the most likely mechanism at pH < 9.2 appears to be mechanism (a) in Figure 4-14, involving the dissolution of copper as CuCl2
– via a CuClADS intermediate. There is no evidence for a gradual transition in behaviour involving the formation of soluble Cu(OH)2
– species with increasing pH. It is interesting to compare the critical pH for passivation observed by /King and Tang 1996/ with that predicted from the model of /Bianchi et al. 1978/ (Figure 4-13). On the assumption that the interfacial dissolution reaction is close to equilibrium, equation 4-14 predicts a critical
-2.5
-2
-1.5
-1
-0.5
5 6 7 8 9 10
pH
log
10 t
ran
spo
rt c
om
po
nen
t (m
A s
1/2 )
0.1 mol/L Cl-
1 mol/L Cl-
-1.5
-1
-0.5
0
0.5
5 6 7 8 9 10
pH
log
10 in
terf
acia
l co
mp
on
ent
(mA
)
0.1 mol/L Cl-
1 mol/L Cl-

50
pH for Cu2O precipitation in both 0.1 mol/L and 1 mol/L Cl– solution of pH 6.4. The predicted value is ~3 pH units lower than that observed experimentally, due either to kinetic limitations on Cu2O formation or, possibly, due to errors in the thermodynamic parameters used to predict the critical pH. It is interesting to note, however, that the model of /Bianchi et al. 1978/ predicts that Cu2O will form at the same pH in 0.1 and 1 mol/L Cl–, exactly as observed by /King and Tang 1996/. The theoretical predictions of /Bianchi et al. 1978/ and /Faita et al. 1975/ appear to be supported qualitatively by observations from other studies. Thus, /Laitinen et al. 2001/ reported only active dissolution at pH 7.6 in 1.5 mol/L Cl– (compare with Figure 4-13). /Imai et al. 1996/ report a transition from active to passive behaviour, but do not relate this to the pH of the Cl–/HCO3
– solutions used. 4.2.2.5 Behaviour of pre-passivated surfaces A number of experimental studies have been performed in which the copper surface was first pre-passivated before the introduction of Cl– ions /Adeloju and Duan 1994a; Al-Kharafi and El-Tantawy 1982; Mankowski et al. 1997; Thomas and Tiller 1972a/. Duplex Cu2O/CuO, Cu(OH)2 films were formed at the open-circuit potential or using anodic polarisation in solutions of pH 9–14 for various lengths of time. Despite the apparent passivating nature of these films (see chapter 4.1), Cl– ions appear to be able to promote active dissolution if present at a sufficiently high concentration. For example, following pre-passivation for 4.5 days in 1 mol/L NaOH, the addition of between 0.001 mol/L and 0.01 mol/L Cl– was capable of promoting active dissolution /Adeloju and Duan 1994a/. In 0.01 mol/L HCO3
– solution (pH 8.6), /Thomas and Tiller 1972a/ found a transition from passive to active behaviour at a [Cl–] between 0.1 mol/L and 1 mol/L. As discussed above, Cl– promotes active dissolution of pre-passivated copper by first dissolving the protective Cu(OH)2 outer layer, before transforming the underlying Cu2O layer to CuCl /Mankowski et al. 1997/. 4.2.2.6 Effect of Cl– and pH on ECORR The effect of Cl– and pH on the corrosion potential (ECORR) of copper is important in deciding whether freely corroding copper surfaces will actively dissolve, be protected by a stable passive film, or will undergo localised corrosion. The corrosion potential is a kinetic parameter determined by the balance of the rates of the various anodic and cathodic reactions occurring on the surface. Despite the kinetic character of ECORR, the values reported in the literature are close to the thermodynamic equilibrium potentials of various reversible processes. In Cl– solutions, the possible anodic and cathodic reactions involved in determining ECORR at pH 0–14 include: Anodic reactions Cu + 2Cl– → CuCl2
– + e– 4-17(a) 2Cu + 2OH– → Cu2O + H2O + 2e– 4-17(b)

51
Cu2O + H2O + 2OH– → 2Cu(OH)2 + 2e– 4-17(c) Cathodic reactions CuCl2
– + e– → Cu + 2Cl– 4-18(a) Cu2O + H2O + 2e– → 2Cu + 2OH– 4-18(b) 2Cu(OH)2 + 2e– → Cu2O + 2OH– + H2O 4-18(c) 2H+ + 2e– → H2 4-18(d) O2 + 2H2O + 4e– → 4OH– 4-18(e) Note that reactions 4-17(a), (b), and (c) are the reverse of reactions 4-18(a), (b), and (c). Figure 4-16 shows the dependence of ECORR and the open-circuit potential EOC of copper on pH in chloride-free solutions. (Here, we distinguish between a true corrosion potential, in which the rate of anodic dissolution of the metal is balanced by the rate of reduction of an oxidant such as H+ or O2, and the open-circuit potential of a system at redox equilibrium, in which the potential is determined by the balance of the forward and backward rates of a redox couple such as described by reactions 4-17(b) and 4-18(b)). The dashed and dotted lines represent the pH-dependence of the equilibrium potential for the redox reactions Figure 4-16. Dependence of the corrosion and open-circuit potentials of copper on pH in chloride-free solutions at room temperature.
-600
-500
-400
-300
-200
-100
0
0 2 4 6 8 10 12 14
pH
EC
OR
R (
mV
SC
E)
Cu2O/Cu(OH)2
Cu/Cu2O
Aerated 0.1 mol/L NaOAc
Shoesmith et al. (1977) Initial potential
Shoesmith et al. (1977) Final potential
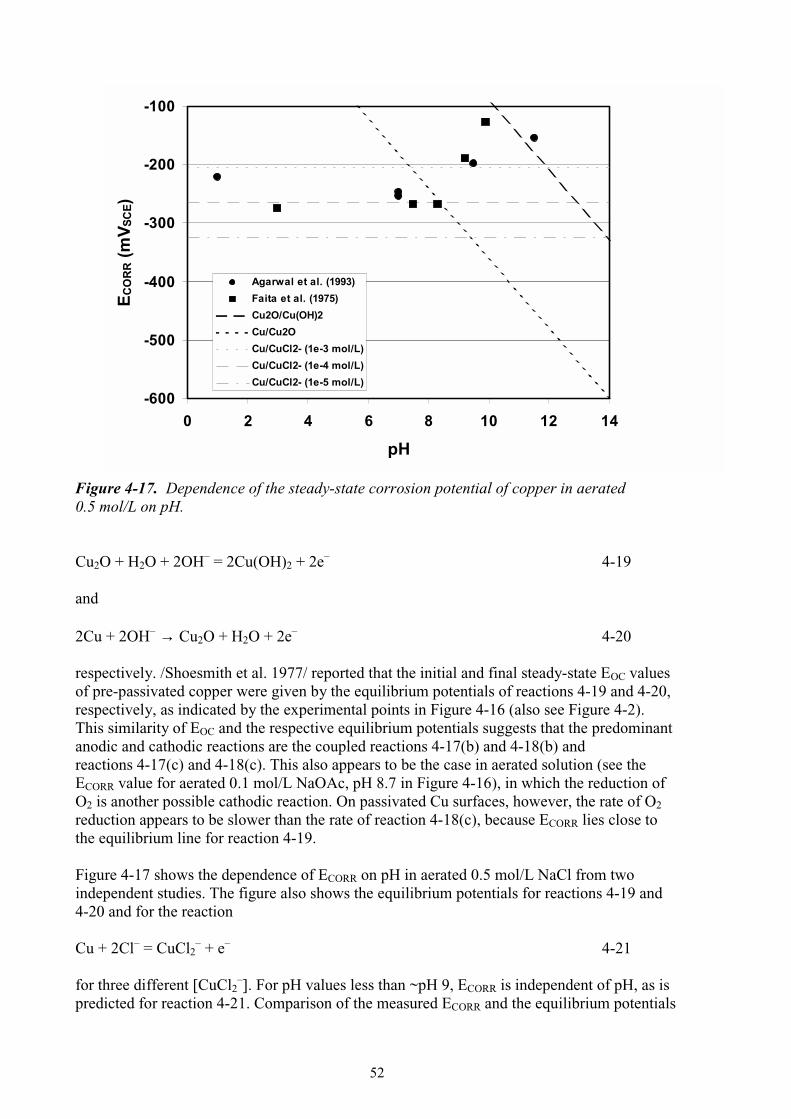
52
Figure 4-17. Dependence of the steady-state corrosion potential of copper in aerated 0.5 mol/L on pH. Cu2O + H2O + 2OH– = 2Cu(OH)2 + 2e– 4-19 and 2Cu + 2OH– → Cu2O + H2O + 2e– 4-20 respectively. /Shoesmith et al. 1977/ reported that the initial and final steady-state EOC values of pre-passivated copper were given by the equilibrium potentials of reactions 4-19 and 4-20, respectively, as indicated by the experimental points in Figure 4-16 (also see Figure 4-2). This similarity of EOC and the respective equilibrium potentials suggests that the predominant anodic and cathodic reactions are the coupled reactions 4-17(b) and 4-18(b) and reactions 4-17(c) and 4-18(c). This also appears to be the case in aerated solution (see the ECORR value for aerated 0.1 mol/L NaOAc, pH 8.7 in Figure 4-16), in which the reduction of O2 is another possible cathodic reaction. On passivated Cu surfaces, however, the rate of O2 reduction appears to be slower than the rate of reaction 4-18(c), because ECORR lies close to the equilibrium line for reaction 4-19. Figure 4-17 shows the dependence of ECORR on pH in aerated 0.5 mol/L NaCl from two independent studies. The figure also shows the equilibrium potentials for reactions 4-19 and 4-20 and for the reaction Cu + 2Cl– = CuCl2
– + e– 4-21 for three different [CuCl2
–]. For pH values less than ~pH 9, ECORR is independent of pH, as is predicted for reaction 4-21. Comparison of the measured ECORR and the equilibrium potentials
-600
-500
-400
-300
-200
-100
0 2 4 6 8 10 12 14
pH
EC
OR
R (
mV
SC
E)
Agarwal et al. (1993)
Faita et al. (1975)
Cu2O/Cu(OH)2
Cu/Cu2O
Cu/CuCl2- (1e-3 mol/L)
Cu/CuCl2- (1e-4 mol/L)
Cu/CuCl2- (1e-5 mol/L)
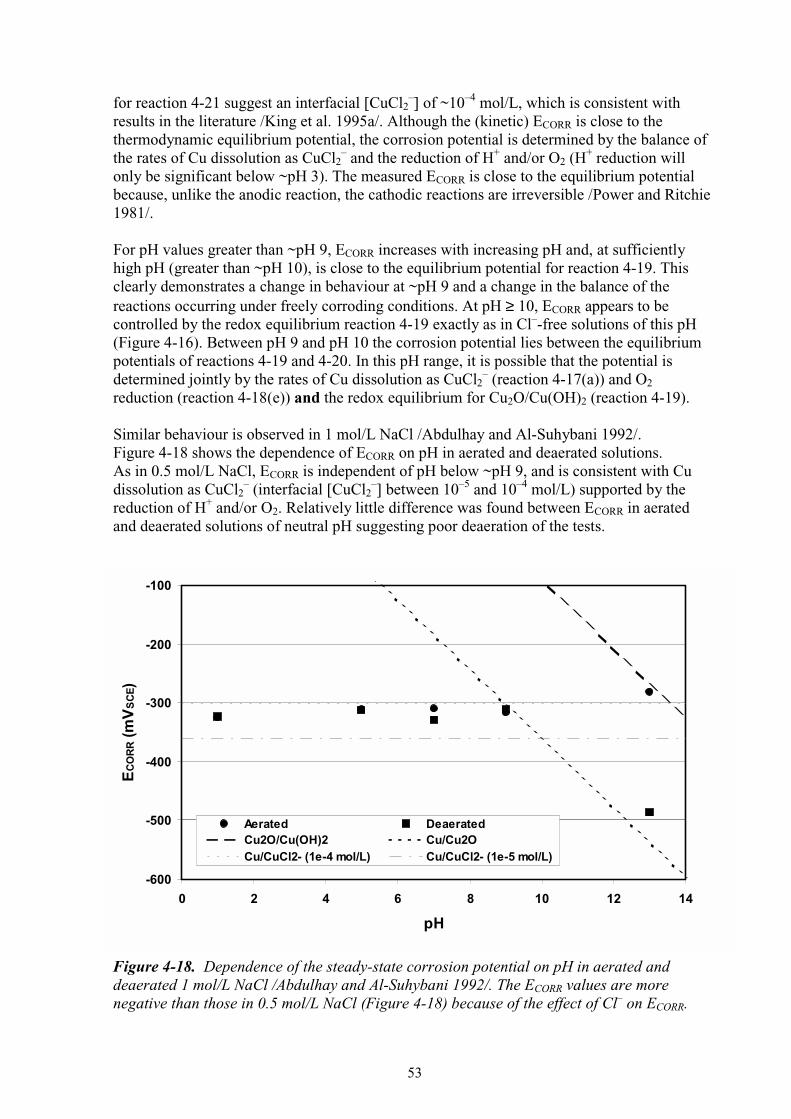
53
for reaction 4-21 suggest an interfacial [CuCl2–] of ~10–4 mol/L, which is consistent with
results in the literature /King et al. 1995a/. Although the (kinetic) ECORR is close to the thermodynamic equilibrium potential, the corrosion potential is determined by the balance of the rates of Cu dissolution as CuCl2
– and the reduction of H+ and/or O2 (H+ reduction will
only be significant below ~pH 3). The measured ECORR is close to the equilibrium potential because, unlike the anodic reaction, the cathodic reactions are irreversible /Power and Ritchie 1981/. For pH values greater than ~pH 9, ECORR increases with increasing pH and, at sufficiently high pH (greater than ~pH 10), is close to the equilibrium potential for reaction 4-19. This clearly demonstrates a change in behaviour at ~pH 9 and a change in the balance of the reactions occurring under freely corroding conditions. At pH ≥ 10, ECORR appears to be controlled by the redox equilibrium reaction 4-19 exactly as in Cl–-free solutions of this pH (Figure 4-16). Between pH 9 and pH 10 the corrosion potential lies between the equilibrium potentials of reactions 4-19 and 4-20. In this pH range, it is possible that the potential is determined jointly by the rates of Cu dissolution as CuCl2
– (reaction 4-17(a)) and O2 reduction (reaction 4-18(e)) and the redox equilibrium for Cu2O/Cu(OH)2 (reaction 4-19). Similar behaviour is observed in 1 mol/L NaCl /Abdulhay and Al-Suhybani 1992/. Figure 4-18 shows the dependence of ECORR on pH in aerated and deaerated solutions. As in 0.5 mol/L NaCl, ECORR is independent of pH below ~pH 9, and is consistent with Cu dissolution as CuCl2
– (interfacial [CuCl2–] between 10–5 and 10–4 mol/L) supported by the
reduction of H+ and/or O2. Relatively little difference was found between ECORR in aerated and deaerated solutions of neutral pH suggesting poor deaeration of the tests. Figure 4-18. Dependence of the steady-state corrosion potential on pH in aerated and deaerated 1 mol/L NaCl /Abdulhay and Al-Suhybani 1992/. The ECORR values are more negative than those in 0.5 mol/L NaCl (Figure 4-18) because of the effect of Cl– on ECORR.
-600
-500
-400
-300
-200
-100
0 2 4 6 8 10 12 14
pH
EC
OR
R (m
VS
CE)
Aerated DeaeratedCu2O/Cu(OH)2 Cu/Cu2OCu/CuCl2- (1e-4 mol/L) Cu/CuCl2- (1e-5 mol/L)

54
Figure 4-19. Temperature dependence of the steady-state corrosion potential in aerated 1 mol/L NaCl at various pH values /Abdulhay and Al-Suhybani 1992/. At higher pH there is a change in mechanism and a significant difference between the ECORR values in aerated and deaerated solution. At pH 13, the reported ECORR values are close to the equilibrium potentials for Cu2O/Cu(OH)2 and Cu/Cu2O in aerated and deaerated solutions, respectively. This behaviour is further evidence that above a critical pH value the rates of Cu dissolution as CuCl2
– and of O2 reduction are slow and that the predominant reactions are those described by reactions 4-19 and 4-20. It is also significant that the nature of the surface films, and hence of the ECORR value, are very dependent on the degree of aeration of the solution. At pH 13 the ECORR values in aerated and deaerated solutions differ by over 200 mV, not because of a difference in the rate of O2 reduction but because of the stabilisation of Cu(OH)2 species in aerated solution but not under deaerated conditions. It is interesting to note that /Abdulhay and Al-Suhybani 1992/ also reported a difference in the time dependence of ECORR as a function of pH. Under film-free conditions in pH 1–9 solution, ECORR decreased with time before reaching a steady-state value, whereas at pH 13 ECORR increased with time. The increase in ECORR with time at pH 13 presumably reflects the time required for formation of the duplex Cu2O/Cu(OH)2 film. The influence of surface films on ECORR is also apparent in the temperature dependence of the corrosion potential /Abdulhay and Al-Suhybani 1992/. Figure 4-19 shows the dependence of ECORR on temperature in aerated 1 mol/L NaCl at various pH values. At pH 1 and pH 7, i.e., at values below the critical pH for film formation, ECORR decreases linearly with increasing temperature by approximately 1.7 mV/oC. This is exactly the dependence expected of the equilibrium potential for Cu dissolution as CuCl2
– (reaction 4-21). At pH 13, however, ECORR exhibits a maximum at a temperature of 30–40oC. This trend is similar, but opposite in direction, to that reported for the temperature dependence of EB (Figure 4-8) and similarly suggests an effect of the temperature dependence of the film structure and degree of hydration.
-320
-300
-280
-260
-240
-220
0 10 20 30 40 50 60
Temperature (oC)
EC
OR
R (m
VS
CE)
pH 1
pH 7
pH 13
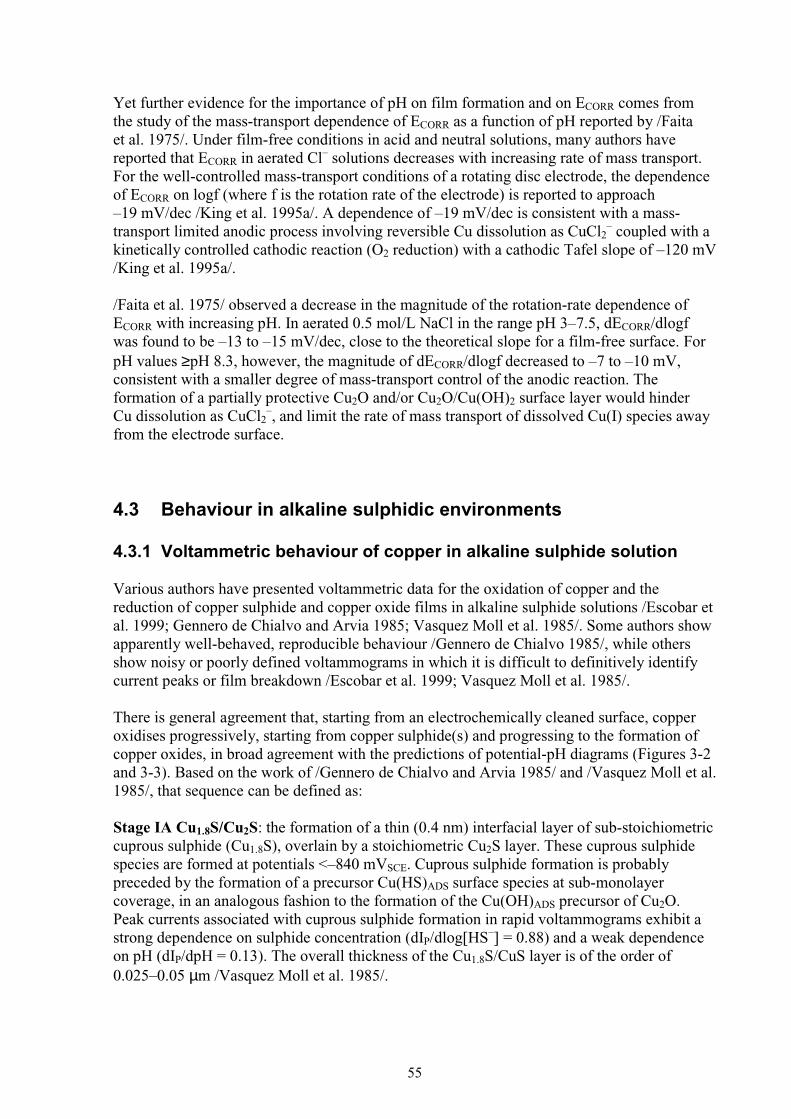
55
Yet further evidence for the importance of pH on film formation and on ECORR comes from the study of the mass-transport dependence of ECORR as a function of pH reported by /Faita et al. 1975/. Under film-free conditions in acid and neutral solutions, many authors have reported that ECORR in aerated Cl– solutions decreases with increasing rate of mass transport. For the well-controlled mass-transport conditions of a rotating disc electrode, the dependence of ECORR on logf (where f is the rotation rate of the electrode) is reported to approach –19 mV/dec /King et al. 1995a/. A dependence of –19 mV/dec is consistent with a mass-transport limited anodic process involving reversible Cu dissolution as CuCl2
– coupled with a kinetically controlled cathodic reaction (O2 reduction) with a cathodic Tafel slope of –120 mV /King et al. 1995a/. /Faita et al. 1975/ observed a decrease in the magnitude of the rotation-rate dependence of ECORR with increasing pH. In aerated 0.5 mol/L NaCl in the range pH 3–7.5, dECORR/dlogf was found to be –13 to –15 mV/dec, close to the theoretical slope for a film-free surface. For pH values ≥pH 8.3, however, the magnitude of dECORR/dlogf decreased to –7 to –10 mV, consistent with a smaller degree of mass-transport control of the anodic reaction. The formation of a partially protective Cu2O and/or Cu2O/Cu(OH)2 surface layer would hinder Cu dissolution as CuCl2
–, and limit the rate of mass transport of dissolved Cu(I) species away from the electrode surface. 4.3 Behaviour in alkaline sulphidic environments 4.3.1 Voltammetric behaviour of copper in alkaline sulphide solution Various authors have presented voltammetric data for the oxidation of copper and the reduction of copper sulphide and copper oxide films in alkaline sulphide solutions /Escobar et al. 1999; Gennero de Chialvo and Arvia 1985; Vasquez Moll et al. 1985/. Some authors show apparently well-behaved, reproducible behaviour /Gennero de Chialvo 1985/, while others show noisy or poorly defined voltammograms in which it is difficult to definitively identify current peaks or film breakdown /Escobar et al. 1999; Vasquez Moll et al. 1985/. There is general agreement that, starting from an electrochemically cleaned surface, copper oxidises progressively, starting from copper sulphide(s) and progressing to the formation of copper oxides, in broad agreement with the predictions of potential-pH diagrams (Figures 3-2 and 3-3). Based on the work of /Gennero de Chialvo and Arvia 1985/ and /Vasquez Moll et al. 1985/, that sequence can be defined as: Stage IA Cu1.8S/Cu2S: the formation of a thin (0.4 nm) interfacial layer of sub-stoichiometric cuprous sulphide (Cu1.8S), overlain by a stoichiometric Cu2S layer. These cuprous sulphide species are formed at potentials <–840 mVSCE. Cuprous sulphide formation is probably preceded by the formation of a precursor Cu(HS)ADS surface species at sub-monolayer coverage, in an analogous fashion to the formation of the Cu(OH)ADS precursor of Cu2O. Peak currents associated with cuprous sulphide formation in rapid voltammograms exhibit a strong dependence on sulphide concentration (dIP/dlog[HS–] = 0.88) and a weak dependence on pH (dIP/dpH = 0.13). The overall thickness of the Cu1.8S/CuS layer is of the order of 0.025–0.05 µm /Vasquez Moll et al. 1985/.

56
Stage IB CuS: at potentials more positive than –840 mVSCE, CuS forms on top of the Cu2S layer. The duplex Cu2S/CuS film so-formed is partially protective, as evidenced by a decrease in current. A mass-transport limited current is observed throughout the potential region for copper sulphide formation and extending to as positive as –440 mVSCE /Gennero de Chialvo and Arvia 1985/. The steady-state current increases with sulphide concentration and the rate of mass-transport, suggesting that the formation of Cu2S and CuS is limited by the rate of supply of sulphide to the electrode surface. No soluble copper species are detectable by a ring-disc electrode at any stage during the oxidation of copper in alkaline sulphide solutions because of the low solubility of copper sulphide (in contrast to the behaviour in sulphide-free alkaline solutions, chapter 4.1). It is suggested that the formation of both the Cu2S and CuS layers is due to a nucleation and growth mechanism, with rate control by the diffusion of sulphide. Stage II film breakdown: at a characteristic potential, the partially protective Cu1.8S/Cu2S/CuS film breaks down and localised corrosion is observed. Film breakdown and pitting is discussed in more detail in the next section. Stage III copper oxide formation: at sufficiently positive potentials (>–500 mVSCE), “copper oxide” formation occurs /Gennero de Chialvo and Arvia 1985; Vasquez Moll et al. 1985/. The nature of the oxide has not been clearly defined, but is suspected to be Cu2O. The ruptured layer also contains CuS and the overall layer is non-protective, resulting in rapid rates of dissolution. As discussed below, the corrosion potential in sulphide environments is several hundred millivolts more negative than that required for copper oxide formation, and this stage in the oxidation sequence is of no relevance for canisters in a repository. It is suggested that the formation of Cu2S and CuS occurs at potentials close to the redox potential for 2Cu + S2– = Cu2S + 2e– 4-22 and Cu + S2– = CuS + 2e– 4-23 respectively /Gennero de Chialvo and Arvia 1985/. These reactions would account for the apparent dependence of the dissolution rate on sulphide concentration but are only pH-dependent in that the concentration of S2– is itself dependent on the pH through the dissociation of H2S. In this latter regard, there is a surprising variation in the values assumed for the dissociation constants of H2S and, therefore, in the relative concentrations of HS– and S2– at a given pH in alkaline solutions. For the first dissociation constant of H2S H2S = HS– + H+ 4-24 most authors agree that pK1 = 7.04±0.05 at 25oC /Gennero de Chialvo and Arvia 1985; Mor and Beccaria 1975; Pourbaix 1974; Pourbaix and Pourbaix 1992/. However, the pK2 value for the second dissociation constant

57
Figure 4-20. Dependence of the film breakdown (pitting) potential for copper as a function of sulphide concentration solution at room temperature /Vasquez Moll et al. 1985/. HS– = S2– + H+ 4-25 reported by various authors varies from 11.96 /Gennero de Chialvo and Arvia 1985/, to 13.90 /Pourbaix 1974/, to 14.006 /Pourbaix and Pourbaix 1992/, to as high as 14.92 /Mor and Beccaria 1975/. Thus, /Gennero de Chialvo and Arvia 1985/ would predict a thousand-fold higher concentration of S2– in solution at a given pH than /Mor and Beccaria 1975/. This discrepancy in pK2 values may have influenced the mechanisms proposed by the various authors. 4.3.2 Pitting of copper in alkaline sulphide environments There is a limited amount of quantitative data on the pitting of copper in alkaline sulphide solutions in the literature. A number of authors report either observations of pitting or single film breakdown values (EB) /Gennero de Chialvo and Arvia 1985/, but only /Vasquez Moll et al. 1985/ give the variation of EB with sulphide concentration. Figure 4-20 shows the variation of EB with sulphide concentration in pH 13 solution at room temperature. (The data have been corrected for scan rate effects and are based on the reported potential in 0.01 mol/L sulphide and the reported dependence of dEB/dlog[HS–] = –60 mV/dec /Vasquez Moll et al. 1985/). As might be expected, EB shifts to more positive values with decreasing sulphide concentration. /Vasquez Moll et al. 1985/ also report a value for EB in 1 mol/L NaHCO3 (pH ~9) of –850 mVSCE, which is also shown in Figure 4-20. The limited amount of data suggests that EB shifts to more positive values with increasing pH (dEB/dpH = 20 mV).
-900
-800
-700
-600
-500
-6 -5 -4 -3 -2 -1
log sulphide concentration (mol/L)
EB (
mV
SC
E)
pH 13
pH 9

58
The pitting mechanism proposed by /Gennero de Chialvo and Arvia 1985/ involves electron transfer mediated by the thin interfacial Cu2S layer. Breakdown takes place following the formation of the duplex Cu2S/CuS layer. The following sequence of events is proposed:
1. Adsorption of HS– on the underlying Cu2S at defects in the upper CuS layer (nCu/Cu2S/zCuS + HS– → nCu/Cu2S(HS–)ADS/zCuS)
2. Internal electron transfer from (HS–)ADS balanced by oxidation of Cu(I) to Cu(II) (nCu/Cu2S(HS–)ADS/zCuS → nCu/Cu2S(HS)ADS/zCuS + e–)
3. Second internal electron transfer involving oxidation of Cu substrate to Cu(I) and oxidation of Cu(I) to Cu(II) plus the formation of a proton (nCu/Cu2S(HS)ADS/zCuS → (n-1)Cu/Cu2S/(z+1)CuS + H+ + e–)
The net effect of these internal electron transfers is the corrosion of the Cu substrate and the thickening of the outer CuS layer. The CuS layer, however, is non-protective and non-adherent at potentials more positive than EB. The local acidification created by the second electron-transfer step helps maintain pitting corrosion. 4.3.3 Behaviour of copper at ECORR in alkaline sulphide solutions A number of authors have reported ECORR data in alkaline solution as a function of sulphide concentration /Escobar et al. 1999; Gennero de Chialvo and Arvia 1985; Mor and Beccaria 1975/. Figure 4-21 shows a comparison of the reported values, along with the equilibrium potentials for reactions 4-26 and 4-27 2Cu + HS– = Cu2S + H+ + 2e– 4-26 and Cu + HS– = CuS + H+ + 2e– 4-27 These reactions were chosen over reactions 4-22 and 4-23 because the latter are independent of pH (except at pH values close to pK2, where [S2–] varies significantly with pH), whereas ECORR is reported to vary with pH as shown by the data of /More and Beccaria 1975/ (Figure 4-21). The standard potentials for reactions 4-26 and 4-27 were calculated from the ∆Gf
o data of /Puigdomenech and Taxén 2000/. Both the experimental ECORR and theoretical equilibrium potentials decrease with increasing sulphide concentration. However, the experimental values not only show a greater dependence on [HS–], but also lie between those for the two equilibrium processes. /Mor and Beccaria 1975/ reported dECORR/dlog[HS–] of between –40 and –55 mV/dec between pH 6.5 and pH 8.6, increasing in magnitude with increasing pH. /Escobar et al. 1999/ report a value of –61 mV/dec at 25oC. In contrast, the equilibrium potentials have a dependence of –30 mV/dec. It seems unlikely, therefore, that ECORR corresponds to the equilibrium potential for either of these reactions. This conclusion is further supported by the difference between the reported pH dependence of ECORR (dECORR/dpH = –34 to –39 mV /Mor and Beccaria 1975/) and that predicted for reactions 4-26 and 4-27 (dEEQ/dpH = –30 mV), although in this case the measured and theoretical dependences are reasonably similar.

59
Figure 4-21. Dependence of the corrosion potential of copper on sulphide concentration in alkaline solution at room temperature. The data of /Mor and Beccaria 1975/ are reported for various pH values. Also shown are the equilibrium potentials for the Cu/Cu2S and Cu/CuS redox couples at pH 9. /King et al. 2001/ suggested that ECORR is more likely to be a mixed-potential due to the coupling of the anodic dissolution of Cu and the cathodic reduction of an oxidant, rather than a redox equilibrium potential. At this stage, the processes controlling ECORR in alkaline sulphide solutions are uncertain.
-1100
-1000
-900
-800
-700
-4 -3 -2 -1
log sulphide concentration (mol/L)
EC
OR
R (
mV
SC
E)
pH 6.5pH 7.2pH 7.9pH 8.6Escobar et al. (1999)Gennero de Chialvo and Arvia (1985)Eeq (Cu/Cu2S)Eeq(Cu/CuS)

61
5 Behaviour of copper canisters in a repository 5.1 Active-passive transition in the repository In the Introduction, it was noted that Cl– and OH– ions have opposite effects on the corrosion of copper, Cl– supporting active dissolution and OH– ions inducing passivity. The available literature information in alkaline chloride solutions makes it possible to identify the conditions under which this active-passive transition will occur. Of the two species, the concentration of OH– ions, i.e., the pH, seems to be more important in determining active vs. passive behaviour than the [Cl–]. There is overwhelming evidence for a critical pH of ~pH 9 for a transition from active dissolution at more acidic pH values to passive behaviour at more alkaline pH. (There is less evidence to indicate whether the corresponding passive-active transition is equally possible, but given the apparent reversibility of many of the reactions involved, it seems reasonable to assume that a passive surface could be rendered active under the appropriate conditions). The evidence for the critical pH for passivation includes: 1. the existence of a solubility minimum at ~pH 9–12 (Figures 3-4 and 3-7), 2. the decrease in aggressiveness of the Cl– ion to pitting of copper at ~pH 10 (based on the
magnitude of dEB/dlog[Cl–], Figure 4-6), 3. the shift in EB to more-positive potentials at ~pH 9 in Cl– solutions (Figure 4-7), 4. the influence of film properties on the effect of temperature on EB at pH 9 (Figure 4-8), 5. differences in the current-potential behaviour at pH 7 and pH 10.5 in chloride solutions
(Figure 4-10), 6. the change in the nature of the passivating film at ~pH 9, from CuCl/Cu2O at more-acidic
pH to predominantly Cu2O/Cu(OH)2 in more-alkaline solution (table 4-2), 7. observation of steady-state currents at pH <9.2 and non-steady-state currents at pH ≥9.2
in 0.1 and 1.0 mol/L NaCl /King and Tang 1996/, 8. the change in the nature of processes controlling ECORR in alkaline Cl– solutions at
~pH 9–10 (Figures 4-17 and 4-18), 9. differences in the temperature dependence of ECORR in aerated 1 mol/L NaCl at pH 7 and
pH 13 (Figure 4-19), 10. differences in the time dependence of ECORR in aerated 1 mol/L NaCl at pH 7 and pH 13
/Abdulhay and Al-Suhybani 1992/, and 11. decreasing influence of mass transport on ECORR in aerated 0.5 mol/L NaCl at pH ≥8.3
/Faita et al. 1975/. It is interesting to note that the critical pH is insensitive to [Cl–], at least between 0.1 and 1.0 mol/L, always being in the range pH 9–10. This observation is consistent with the prediction of /Bianchi et al. 1978/ (chapter 4.2.2.4). It seems reasonable to assume, therefore, that during the evolution in the repository environment, a similar active-passive transition will occur on the canister surface. The natural pH of bentonite pore-water (~pH 8.6, chapter 2.1) is slightly below that necessary to induce passive conditions, although the electrochemical reduction of O2 on the canister surface may result in an increase in the interfacial pH to a value sufficient to promote passivation.

62
Alternatively, a slight increase in pore-water pH due to an alkaline plume from cementitious materials will undoubtedly induce passivation of the canister surface. If an active-passive transition does occur, what are the consequences for canister corrosion? Passivation of the surface will result in a decrease in both the rate of anodic dissolution of copper as CuCl2
– and of the rate of O2 reduction (assuming the latter is not transport limited). Whether these effects will have an effect on the corrosion rate of the canister will depend on the nature of the rate-controlling process. If, as seems likely, the rate of canister corrosion is controlled by the rate of supply of oxidant to the surface, passivation is unlikely to affect the rate of canister corrosion. An exception to this may be in highly alkaline solution (pH >10), where evidence from the pH dependence of ECORR in aerated NaCl solutions (Figures 4-17 and 4-18) suggests that the rate of O2 reduction is significantly reduced by the presence of a passive Cu2O/Cu(OH)2 film. Under these circumstances, passivation will result in a decrease in both the rate of corrosion and the rate of O2 consumption in the repository. As mentioned above, an increase in the bentonite pore-water pH above ~pH 9 will result in a positive shift in ECORR. This shift in ECORR corresponds to a change in mechanism, but does not necessarily increase the likelihood of pitting corrosion. As discussed in more detail in the next section, the probability of pitting depends on the difference between ECORR and EB, not on the absolute value of ECORR. All of the above discussion is based on the behaviour of copper in alkaline Cl– solutions in the absence of sulphide. There is relatively little information on which to base a similar analysis for sulphide environments. There is no evidence for a critical pH representing a change in electrochemical or corrosion behaviour. Because of the insolubility of dissolved Cu ions in sulphide environments, copper tends to be more-or-less passive in the presence of sulphide regardless of the pH of the solution. 5.2 Pitting of copper canisters due to an alkaline plume As stated above, the probability of pitting corrosion is related to the difference between ECORR and EB. If ECORR ≥ EB, pitting is likely to occur. Pitting is still possible if ECORR < EB because EB is a statistically distributed parameter and the measured value of EB may not represent the minimum value at which pitting can occur. However, for cases in which ECORR is less than EB, the larger the difference between the two potentials the less likely pitting is to take place. Figures 5-1 to 5-5 show comparisons of ECORR and EB under various conditions taken from data presented elsewhere in this report. Figures 5-1 to 5-3 show the pH dependence of ECORR and EB for various chloride concentrations. In Cl–-free environments (Figure 5-1), ECORR is determined by the redox equilibrium between Cu2O and Cu(OH)2 (in aerated solution) or between Cu and Cu2O (under anoxic conditions). Superimposing the EB data from Figure 4-7(a) shows that ECORR is only greater than EB over a narrow range of conditions between ~pH 7 and pH 8. With increasing pH, EB shifts to slightly more-positive potentials (presumably due to improved resistance of the film to localised breakdown), but ECORR shifts to significantly more-negative potentials. Thus at ~pH 11 (the highest pH for which EB data are available), EB exceeds ECORR by ~250 mV, making pitting unlikely. In general, the greatest danger from pitting in Cl–-free environments appears to be at near-neutral pH values,

63
with the probability of pitting decreasing with increasing pH. At the minimum likely pH of bentonite pore water (pH 8.6), EB exceeds ECORR by ~100 mV. Similar behaviour is predicted in the presence of Cl–. Figure 5-2 compares ECORR (from Figure 4-17) and EB (from Figure 4-7(e)) for copper in 0.5 mol/L NaCl as a function of pH. Even in aerated environments, i.e., immediately after emplacement of the canister, there is only a small range of pH values for which ECORR is greater than EB. As in Cl–-free solution, the greatest danger of pitting occurs in the pH range pH 7–8, below that expected in bentonite pore water. At pH 9 (marginally higher than that expected naturally in compacted bentonite), EB exceeds ECORR by ~350 mV. This difference tends to increase with increasing pH and is as much as 875 mV at pH 13. In the presence of Cl–, therefore, increasing pH reduces the probability of pitting. With increasing [Cl–] and/or decreasing [O2], the probability of pitting in alkaline Cl– solutions diminishes even further. Figure 5-3 shows a comparison between ECORR and EB in 1 mol/L NaCl. The ECORR data were taken from Figure 4-18 and were recorded in aerated and deaerated solutions. At this Cl– concentration, there is no region of pitting susceptibility, since ECORR is << EB at all pH values. Thus, at higher [Cl–] copper tends to dissolve actively and breakdown of any film that does form occurs at relatively positive potentials. The absence of EB data at pH <9 probably reflects the active nature of the copper surface at these pH values, rather than simply an absence of experimental data under these conditions. As above, increasing pH decreases the pitting susceptibility, the difference between ECORR (aerated solution) and EB increasing to 840 mV at pH 13. Under deaerated conditions, the difference between EB and ECORR at pH 13 is even greater, amounting to 1040 mV. Thus, as expected, as the repository environment becomes anoxic, the probability of pitting decreases significantly. The temperature dependence of EB (Figure 4-8) and of ECORR (Figure 4-19) exhibit opposite trends at pH values for which the surface is covered by a passive film. Figure 5-4 shows a comparison of these two sets of data, with the EB data determined in 0.2 mol/L and 0.5 mol/L NaCl at pH 9 and the ECORR data measured in aerated 1 mol/L NaCl at pH 13. Unfortunately, data are not available for exactly the same pH and [Cl–], but the trends in the two temperature dependences suggest that pitting is most likely at temperatures between ~15oC (corresponding to the minimum in the EB curves) and ~35oC (corresponding to the maximum in the ECORR curve). In the repository, pitting is less likely to occur the higher the temperature. Thus, the greatest danger of pitting may be early in the canister lifetime during the initial heating period when there will be sufficient O2 available to support localised corrosion. After a few years, however, once the temperature exceeds 40–50oC, the probability of pitting starts to decrease and will remain unlikely for several hundred years (Figure 2-1). By the time the canister cools again, much of the initially trapped O2 will have been consumed and ECORR will be less than that in Figure 5-4. As an aside, Figure 5-4 also illustrates the importance in correctly interpreting the results from full-scale tests under simulated repository conditions. Such tests simulate the initial phase in the evolution of the repository environment. The above discussion suggests that this period may represent the highest probability of pitting attack, so that care should be taken when extrapolating pit information from 10–20 year tests to longer timeframes. It is entirely possible that the maximum pit density will be achieved within the first several years and that no further pit initiation will take place.
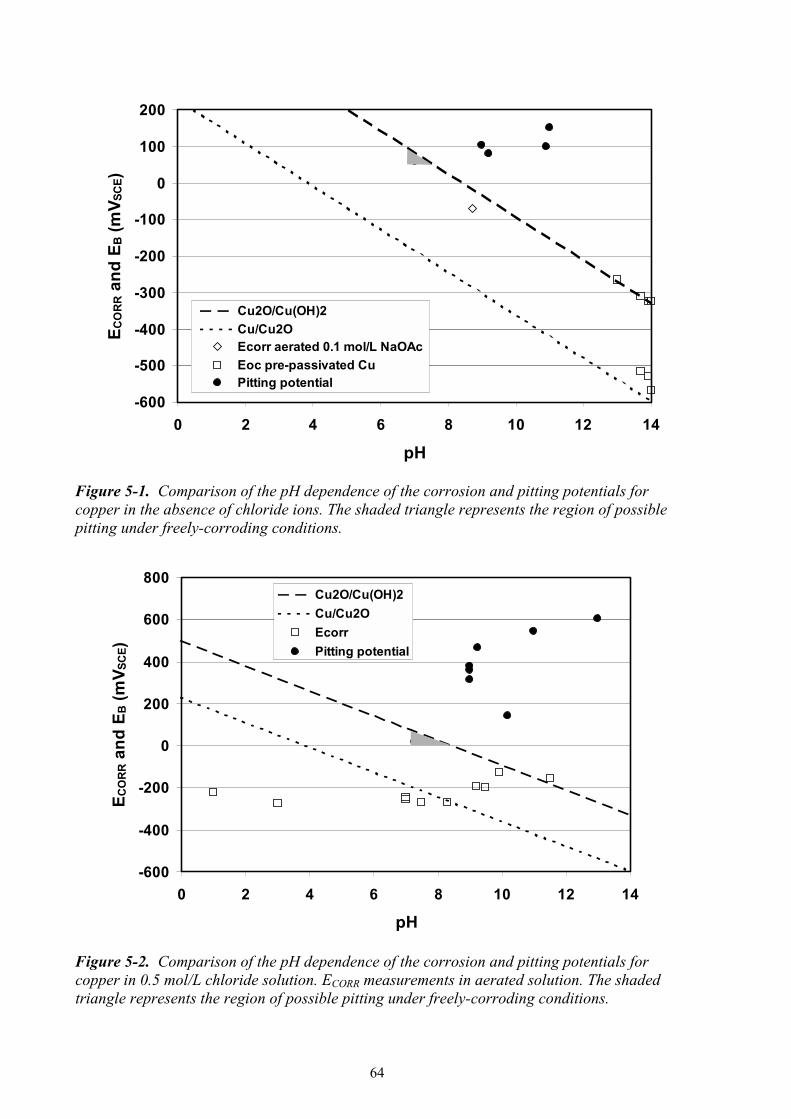
64
-600
-500
-400
-300
-200
-100
0
100
200
0 2 4 6 8 10 12 14
pH
EC
OR
R a
nd
EB (
mV
SC
E)
Cu2O/Cu(OH)2Cu/Cu2OEcorr aerated 0.1 mol/L NaOAcEoc pre-passivated CuPitting potential
Figure 5-1. Comparison of the pH dependence of the corrosion and pitting potentials for copper in the absence of chloride ions. The shaded triangle represents the region of possible pitting under freely-corroding conditions.
-600
-400
-200
0
200
400
600
800
0 2 4 6 8 10 12 14
pH
EC
OR
R a
nd
EB (
mV
SC
E)
Cu2O/Cu(OH)2
Cu/Cu2O
Ecorr
Pitting potential
Figure 5-2. Comparison of the pH dependence of the corrosion and pitting potentials for copper in 0.5 mol/L chloride solution. ECORR measurements in aerated solution. The shaded triangle represents the region of possible pitting under freely-corroding conditions.

65
Figure 5-3. Comparison of the pH dependence of the corrosion and pitting potentials for copper in 1.0 mol/L chloride solution. Figure 5-4. Comparison of the temperature dependence of the corrosion and pitting potentials of copper in alkaline chloride solutions. Pitting potentials determined in 0.2 mol/L and 0.5 mol/L NaCl. ECORR determined in aerated 1 mol/L NaCl.
-600
-400
-200
0
200
400
600
0 2 4 6 8 10 12 14
pH
EC
OR
R a
nd
EB (
mV
SC
E)
Cu2O/Cu(OH)2Cu/Cu2OEcorr aeratedEcorr deaeratedPitting potential
-400
-200
0
200
400
600
800
0 10 20 30 40 50 60
Temperature (oC)
EC
OR
R a
nd
EB (
mV
SC
E)
Eb 0.2 mol/L Cl
Eb 0.5 mol/L Cl
Ecorr aerated 1 mol/L Cl

66
Figure 5-5. Comparison of the dependence of the corrosion and pitting potentials on sulphide concentration at various pH values. The lack of EB and, to a lesser extent, ECORR data makes it more difficult to be definitive about the probability of pitting in alkaline sulphide environments. Based on the available evidence (Figure 5-5), both ECORR and EB shift to more negative values with increasing sulphide concentration, but shift in opposite directions with increasing pH. The magnitudes of dECORR/dlog[HS–] and dEB/dlog[HS–] are similar (~60 mV/dec), so pitting is equally as likely at 10–5 mol/L sulphide as at 0.1 mol/L sulphide. However, ECORR decreases with increasing pH (dECORR/dpH = –34 to –39 mV), whereas EB increases with pH (dEB/dpH = 20 mV). Extrapolation of the data in Figure 5-5 suggests that ECORR = EB at pH 8.2. At pH <8.2, EB < ECORR and pitting is possible. At pH > 8.2, ECORR < EB and pitting becomes increasingly unlikely with increasing pH. The difference between ECORR and EB at pH 13 is ~250 mV. Thus, as in sulphide-free environments, the greatest danger of pitting is at pH values less than those expected in compacted bentonite and the probability of pitting decreases with increasing pH.
-900
-850
-800
-750
-700
-3.5 -3 -2.5 -2 -1.5
log sulphide concentration (mol/L)
EC
OR
R a
nd
EB (
mV
SC
E)
Ecorr pH 6.5
Ecorr pH 7.2
Ecorr pH 7.9
Ecorr pH 8.6
Eb pH 13
Eb pH 9

67
5.3 Corrosion behaviour for the four environmental scenarios For the purposes of predicting the corrosion behaviour of the canister, the four environmental scenarios defined in chapter 2.2 will be combined into two; namely, an increase in salinity and pore-water pH prior to the establishment of anoxic conditions and alternatively an increase in salinity and pH after the establishment of anoxic conditions. Based on the evidence presented above, the corrosion behaviour of the canister in the absence of sulphide will be similar regardless of whether the increase in salinity or increase in pore-water pH occurs first. The canister will be in the passive state for pH >9, but will undergo active dissolution at lower pH values. The greatest danger of pitting will occur soon after emplacement as the canister temperature increases and whilst there is still O2 available to support localised corrosion. Once the temperature exceeds ~40oC and/or the pore-water pH increases above pH 9, pitting will become increasingly unlikely. It is not known whether pits initiated at lower temperatures and pH will continue to grow once conditions become more severe for pit initiation. The solubility of precipitated corrosion products will be a complex function of the pore-water [Cl–] and pH. Based on the data in chapter 3.2, the solubility will tend to increase with time as a consequence of the increase in (i) temperature, (ii) chloride concentration, and (iii) pore-water pH. Thus, precipitated corrosion products formed in the buffer in regions of low salinity and or pore-water pH could re-dissolve as the salinity increases and the alkaline plume reaches the near field. It is difficult to predict the effect of evolving salinity and pore-water pH on the corrosion rate of the canister. It is likely that during the oxic phase, the rate of corrosion will be controlled by the rate of supply of O2 to the canister surface. Thus, unless passivation inhibits the rates of the interfacial processes significantly, the nature of the rate-controlling process may not change as the salinity and pore-water pH increase. Alternatively, the formation of a highly protective passive film in alkaline pore-water could result in an anodically limited corrosion process, due to the slow growth of the protective surface film. The time dependence of ECORR is equally difficult to predict. Increasing temperature, [Cl–], and decreasing [O2] will shift ECORR to more-negative values, whereas increasing pH (above pH 9) will cause a shift in the positive direction. The net effects of these opposing processes will depend on the relative rates of change of the various environmental parameters. Under anoxic conditions in the presence of sulphide (scenarios 3 and 4, chapter 2.2), copper will corrode under passive conditions due to the presence of a duplex Cu2S/CuS film. The corrosion rate will be limited by the rate of supply of HS– to the canister surface, regardless of the pH. Increasing salinity is unlikely to cause localised corrosion. As in sulphide-free solutions, pitting is most likely in the pH range pH 7–8, and will become increasingly unlikely as the pore-water pH increases in response to the alkaline plume reaching the canister. The solubility of precipitated corrosion products will decrease with increasing pH, causing increased precipitation in sulphide-containing pore waters as the alkaline plume intercepts the borehole. Under highly alkaline conditions (pH >12–13), it is possible that Cu will become thermodynamically stable.

69
6 Summary and conclusions The available literature information on the corrosion and electrochemical behaviour of copper in alkaline environments has been reviewed. The purpose of the review was to assess the impact of an alkaline plume from cementitious material on the corrosion behaviour of a copper canister in an SKB-3 type repository. The effect of the evolution of the environmental conditions within the repository have been considered, including the effects of temperature, redox conditions, pore-water salinity and pH. If the pore-water pH increases prior to the establishment of anoxic conditions, the canister surface will passivate as the pore-water pH exceeds a value of ~pH 9. Passivation will result from the formation of a duplex Cu2O/Cu(OH)2 film. The corrosion potential will be determined by the equilibrium potential for the Cu2O/Cu(OH)2 couple under oxic conditions, or by the Cu/Cu2O redox couple under anoxic conditions (in the absence of sulphide). Pitting corrosion is only likely to occur early in the evolution of the repository environment, whilst the canister is still relatively cool (<40oC), whilst there is still O2 available to support localised corrosion, and prior to the increase in pore-water pH and salinity. The subsequent increase in canister surface temperature, pore-water pH and salinity, and decrease in [O2] will make pit initiation less likely, although the canister will remain passive provided the pore-water pH is maintained above pH 9. The higher the pore-water pH, the more strongly the canister is passivated and the less likely the surface is to undergo localised attack. If the pore-water salinity increases prior to the increase in pH, there could be a period of active canister corrosion before passivation occurs. Under these circumstances, the corrosion potential will be a true mixed potential, determine by the relative kinetics of Cu dissolution as CuCl2
– and of the reduction of O2. The development of anoxic conditions and an increase in pore-water sulphide concentration will result in passivation of the surface by a duplex Cu2S/CuS film. Increasing pH due to an alkaline plume will tend to enhance the passivity, because of the decrease in solubility of Cu2S. At the same time, pitting corrosion will become less likely, since the corrosion potential will shift to more-negative values and the pitting potential to more-positive values with increasing pH. As in sulphide-free environments, therefore, there appears to be little threat to the integrity of the canister from an increase in pore-water pH. In summary, an increase in pore-water pH due to an alkaline plume from cementitious material will induce passivation of the canister surface. The stability of the passive film, and its ability to prevent localised corrosion, are enhanced by increasing pH. In this regard, there appears to be little negative impact on the integrity of the canister from the use in the repository of cementitious materials with pore fluids in the pH range pH 12–13.

71
References Abd El Haleem S M, Ateya B G, 1981. Cyclic voltammetry of copper in sodium hydroxide solutions. J. Electroanalytical Chem. 117, 309–319. Abdulhay M A, Al-Suhybani A A, 1992. Open circuit potential for copper electrode in 1 M NaCl solutions. Mat. –wiss. u. Werkstofftech. 23, 407–412. Abrantes L M, Castillo L M, Norman C, Peter L M, 1984. A photoelectrochemical study of the anodic oxidation of copper in alkaline solution. J. Electroanal. Chem. 163, 209–221. Adeloju S B, Duan Y Y, 1994a. Corrosion resistance of Cu2O and CuO on copper surfaces in aqueous media. Br. Corros. J. 29, 309–314. Adeloju S B, Duan Y Y, 1994b. Influence of bicarbonate ions on stability of copper oxides and copper pitting corrosion. Br. Corros. J. 29, 315–320. Agarwal P, Moghissi O C, Orazem M E, Garcia-Rubio L H, 1993. Application of measurement models for analysis of impedance spectra. Corrosion 49, 278–289. Ageskog L, Jansson P, 1999. Heat propagation in and around the deep repository. Thermal calculations applied to three hypothetical sites: Aberg, Beberg and Ceberg. SKB Technical Report 99-02. Swedish Nuclear Fuel and Waste Management Co, Stockholm, pp. 1–95. Al-Kharafi F M, El-Tantawy Y A, 1982. Passivation of copper: role of some anions in the mechanism of film formation and breakdown. Corrosion Science 22, 1–12. Ambrose J, Barradas R G, Shoesmith D W, 1973a. Investigations of copper in aqueous alkaline solutions by cyclic voltammetry. Electroanalytical Chem. and Interfacial Electrochem. 47, 47–64. Ambrose J, Barradas R G, Shoesmith D W, 1973b. Rotating copper disk electrode studies of the mechanism of the dissolution-passivation step on copper in alkaline solutions. Electroanalytical Chem. and Interfacial Electrochem. 47, 65–80. Aruchamy A, Fujishima A, 1989. Photoanodic behaviour of Cu2O corrosion layers on copper electrodes. J. Electroanalytical Chem. 272, 125–136. Bertocci U, 1978. Photopotentials on copper and copper alloy electrodes. J. Electrochem. Soc. 125, 1598–1602. Bianchi G, Fiori G, Longhi P, Mazza F, 1978. “Horse shoe” corrosion of copper alloys in flowing sea water: mechanism, and possibility of cathodic protection of condenser tubes in power stations. Corrosion 34, 396–406.

72
Brisard, G M, Rudnicki J D, McLarnon F, Cairns E J, 1995. Application of probe beam deflection to study the electrooxidation of copper in alkaline media. Electrochimica Acta 40, 859–865. Burke L D, Ahern M J G, Ryan T G, 1990. An investigation of the anodic behavior of copper and its anodically produced oxides in aqueous solutions of high pH. J. Electrochem. Soc. 137, 553–561. Burleigh T D, 1989. Anodic photocurrents and corrosion currents on passive and active-passive metals. Corrosion 45, 464–472. Burstein G T, Newman R C, 1981. Reactions of scratched copper electrodes in aqueous solutions. J. Electrochem. Soc. 128, 2270–2276. Campbell HS, 1974. A review: pitting corrosion of copper and its alloys. In Localized Corrosion, (Editors, R.W. Staehle, B.F. Brown, J. Kruger and A. Agrawal), NACE International, Houston, TX, pps. 625–638. Collisi U, Strehblow H-H, 1986. A photoelectrochemical study of passive copper in alkaline solutions. J. Electroanal. Chem. 210, 213–227. Collisi U, Strehblow H-H, 1990. The formation of Cu2O layers on Cu and their electrochemical and photoelectrochemical properties. J. Electroanal. Chem. 284, 385–401. Deslouis C, Tribollet B, Mengoli G, Musiani M M, 1988a. Electrochemical behaviour of copper in neutral aerated chloride solution. I. Steady-state investigation. J. Appl. Electrochem. 18, 374–383. Deslouis C, Tribollet B, Mengoli, G, Musiani M M, 1988b. Electrochemical behaviour of copper in neutral aerated chloride solution. II. Impedance investigation. J. Appl. Electrochem. 18, 384–393. Deutscher R L, Woods R, 1986. Characterization of oxide layers on copper by linear potential sweep voltammetry. J. Applied Electrochem. 16, 413–421. Dong S, Xie Y, Cheng G, 1992. Cyclic voltammetry and spectroelectrochemical studies of copper in alkaline solution. Electrochimica Acta 37, 17–22. Drogowska M, Brossard L, Ménard H, 1987. Anodic copper dissolution in the presence of Cl– ions at pH 12. Corrosion 43, 549–552. Drogowska M, Brossard L, Ménard H, 1992. Copper dissolution in NaHCO3 and NaHCO3 + NaCl aqueous solutions at pH 8. Journal Electrochemical Society 139, 39–47. Drogowska M, Brossard L, Ménard H, 1994. Comparative study of copper behaviour in bicarbonate and phosphate aqueous solutions and effect of chloride ions. Journal Applied Electrochemistry 24, 344–349. Druska P, Strehblow H-H, 1992. In-situ examination of electrochemically formed Cu2O layers by EXAFS in transmission. J. Electroanalytical Chem. 335, 55–65.

73
Duthil J-P, Mankowski G, Giusti A, 1996. The synergetic effect of chloride and sulphate on pitting corrosion of copper. Corrosion Science 38, 1839–1849. Elsner C I, Salvarezza R C, Arvia A J, 1988. The influence of halide ions at submonolayer levels on the formation of oxide layer and electrodissolution of copper in neutral solutions. Electrochim. Acta 33, 1735–1741. Escobar I S, Silva E, Silva C, Ubal A, 1999. Study of the effect of sulfide ions on the corrosion resistance of copper for use in containers for high-level waste. Proc. Fourth International Conference Copper 99-Cobre 99, G.A. Eltringham, N.L. Piret and M. Sahoo (eds.), Vol. I, 371–386. Faita G, Fiori G, Salvadore D, 1975. Copper behaviour in acid and alkaline brines-I. Kinetics of anodic dissolution in 0.5M NaCl and free-corrosion rates in the presence of oxygen. Corros. Sci. 15, 383–392. Figueroa M G, Salvarezza R C, Arvia A J, 1986. The influence of temperature on the pitting corrosion of copper. Electrochimica Acta 31, 665–669. Gad Allah A G, Abou-Romia M M, Badawy W A, Rehan H H, 1991. Effect of halide ions on passivation and pitting corrosion of copper in alkaline solutions. Werkstoffe und Korrosion 42, 584–591. Gennero de Chialvo M R, Marchiano S L, Arvia A J, 1984. The mechanism of oxidation of copper in alkaline solutions. J. Applied Electrochem. 14, 165–175. Gennero de Chialvo M R G, Arvia A J, 1985. The electrochemical behaviour of copper in alkaline solutions containing sodium sulphide. J. Appl. Electrochem. 15, 685–696. Gennero de Chialvo M R, Salvarezza R C, Vasquez Moll D, Arvia A J, 1985. Kinetics of passivation and pitting corrosion of polycrystalline copper in borate buffer solutions containing sodium chloride. Electrochimica Acta 30, 1501–1511. Hamilton J C, Farmer J C, Anderson R J, 1986. In situ Raman spectroscopy of anodic films formed on copper and silver in sodium hydroxide solution. J. Electrochem. Soc. 133, 739–745. Imai H, Fukuda T, Akashi M, 1996. Effects of anionic species on the polarization behavior of copper for waste package material in artificial ground water. Materials Research Society Symposium Proceedings Vol. 412, (Materials Research Society, Pittsburgh, PA), p. 589–596. Johnson L H, LeNeveu D M, King F, Shoesmith D W, Kolár M, Oscarson D W, Sunder S, Onofrei C, Crosthwaite J L, 1996. The disposal of Canada's nuclear fuel waste: A study of postclosure safety of in-room emplacement of used CANDU fuel in copper containers in permeable plutonic rock: volume 2: vault model. Atomic Energy of Canada Limited Report, AECL-11494-2, COG-96-552-2. Karnland O, 1997. Cement/bentonite interaction. Results from 16 month laboratory tests. Swedish Nuclear Fuel and Waste Management Co. Report, Technical Report TR-97-32.
74
Karnland O, 2001. High pH effects on buffer and backfill. Letter report supplied by L. Werme, SKB, April 2002. King F, Litke C D, Quinn M J, LeNeveu D M, 1995a. The measurement and prediction of the corrosion potential of copper in chloride solutions as a function of oxygen concentration and mass-transfer coefficient. Corrosion Science 37, 833–851. King F, Quinn M J, Litke C D, 1995b. Oxygen reduction on copper in neutral NaCl solution. Journal Electroanalytical Chemistry 385, 45–55. King F, Tang Y, 1996. Unpublished data, discussed in King and Kolar 2000. King F, Greidanus G, Jobe D J, 1999. Dissolution of copper in chloride/ammonia mixtures and the implications for the stress corrosion cracking of copper containers. Atomic Energy of Canada Limited Report, AECL-11865, COG-97-412-I. King F, Kolar M, 2000. The copper container corrosion model used in AECL's second case study. Ontario Power Generation, Nuclear Waste Management Division Report 06819-REP-01200-10041-R00. Toronto, Ontario. King F, Ahonen L, Taxén C, Vuorinen U, Werme L, 2001. Copper corrosion under expected conditions in a deep geologic repository. Swedish Nuclear Fuel and Waste Management Co. Report, Technical Report TR-01-23. Kruger J, 1961. The oxide films formed on copper single crystal surfaces in water. II. Rate of growth at room temperature. J. Electrochem. Soc. 108, 503–508. Laitinen T, Mäkelä K, Saario T, Bojinov M, 2001. Susceptibility of copper to general and pitting corrosion in highly saline groundwater. Swedish Nuclear Power Inspectorate Report, SKI Report 01:2. Lee H P, Nobe K, 1986. Kinetics and mechanisms of Cu electrodissolution in chloride media. Journal Electrochemical Society 133, 2035–2043. Liu X-Y, Zhou G-D, Yang M-Z, Cai S-M, Loo B H, 1993. A simple method for monitoring the inhibition of copper corrosion based on photopotential measurements. J. Electroanalytical Chem. 361, 265–267. Lucey V F, 1967. Mechanism of pitting corrosion of copper in supply waters. British Corrosion Journal 2, 175–185. Mankowski G, Duthil J P, Giusti A, 1997. The pit morphology on copper in chloride- and sulphate-containing solutions. Corrosion Science 39, 27–42. Mattsson E, 1980. Corrosion of copper and brass: practical experience in relation to basic data. British Corrosion Journal 15, 6–13.

75
McIntyre N S, Sunder S, Shoesmith D W, Stanchell F W, 1981. Chemical information from XPS – applications to the analysis of electrode surfaces. J. Vac. Sci. Technol. 18, 714–721. Millet B, Fiaud C, Hinnen C, Sutter E M M, 1995. A correlation between electrochemical behaviour, composition and semiconducting properties of naturally grown oxide films on copper. Corrosion Science 37, 1903–1918. Modestov A D, Zhou G-D, Ge H-H, Loo B H, 1995. A study by voltammetry and the photocurrent response method of copper electrode behaviour in acidic and alkaline solutions containing chloride ions. J. Electroanal. Chem. 380, 63–68. Mor E D, Beccaria A M, 1975. Behaviour of copper in artificial sea water containing sulphides. Br. Corros. J. 10, 33–38. Mountain B W, Seward T M, 1999. The hydrosulphide/sulphide complexes of Cu(I): experimental determination of stoichiometry and stability at 22oC and reassessment of high temperature data. Geochimica et Cosmochimica Acta 63, 11–29. Muurinen A, Lehikoinen J, 1999. Porewater chemistry in compacted bentonite. Posiva 99-20. Posiva Oy, Helsinki, Finland, pp. 1–46. Niaura G, 2000. Surface-enhanced Raman spectroscopic observation of two kinds of adsorbed OH– ions at copper electrode. Electrochimica Acta 45, 3507–3519. Nishikata A, Itagaki M, Tsuru T, Haruyama S, 1990. Passivation and its stability on copper in alkaline solutions containing carbonate and chloride ions. Corrosion Science 31, 287–292. Outokumpu, 1999. HSC Chemistry, Version 4.1. Outokumpu Research Oy, Pori, Finland. Pérez Sánchez M, Barrera M, González S, Souto R M, Salvarezza R C, Arvia A J, 1990. Electrochemical behaviour of copper in aqueous moderate alkaline media containing sodium carbonate and bicarbonate and sodium perchlorate. Electrochimica Acta 35, 1337–1343. Pérez Sánchez M, Souto R M, Barrera M, González S, Salvarezza R C, Arvia A J, 1993. A mechanistic approach to the electroformation of anodic layers on copper and their electroreduction in aqueous solutions containing NaHCO3 and Na2CO3. Electrochimica Acta 38, 703–715. Pourbaix M, Van Muylder J, Van Laer P, 1967. Sur la tension d'electrode du cuivre en presence d'eau de Bruxelles: influence de la lumière et des conditions de circulation de l'eau. Corrosion Science 7, 795–806. Pourbaix M, 1974. Atlas of Electrochemical Equilibria in Aqueous Solutions, 2nd. edition. NACE International, Houston, TX. Pourbaix M, Pourbaix A, 1992. Potential-pH diagrams for the system S-H2O from 25 to 150oC: Influence of access of oxygen in sulphide solutions. Geochim. Cosmochim. Acta 56, 3157–3178.

76
Power G P, Ritchie I M, 1981. Mixed potential measurements in the elucidation of corrosion mechanisms- 1. Introductory theory. Electrochimica Acta 26, 1073–1078. Puigdomenech I, Taxén C, 2000. Thermodynamic data for copper. Implications for the corrosion of copper under repository conditions. Swedish Nuclear Fuel and Waste Management Co. Report, Technical Report TR-00-13. Qafsaoui W, Mankowski G, Dabosi F, 1993. The pitting corrosion of pure and low alloyed copper in chloride-containing borate buffered solutions. Corrosion Science 34, 17–25. Raiko H, Salo J-P, 1999. Design report of the disposal canister for twelve fuel assemblies. Helsinki, Finland: Posiva Oy, Report POSIVA-99-18. Sander U, Strehblow H-H, Dohrmann J K, 1981. In situ photoacoustic spectroscopy of thin oxide layers on metal electrodes. Copper in alkaline solution. J. Phys. Chem. 85, 447–450. Sathiyanarayanan S, Manoharan S, Rajagopal G, Balakrishnan K, 1992. Characterisation of passive films on copper. Br. Corrosion J. 27, 72–74. Shirkanzadeh M, Thompson G E, Ashworth V, 1990. A study of the initial stages in oxidation of copper in alkaline solutions. Corrosion Science 31, 293–298. Shoesmith D W, Rummery T E, Owen D, Lee W, 1976. Anodic oxidation of copper in alkaline solutions. I. Nucleation and growth of cupric hydroxide films. J. Electrochem. Soc. 123, 790–799. Shoesmith D W, Rummery T E, Owen D, Lee W, 1977. Anodic oxidation of copper in alkaline solutions. 2. The open-circuit potential behavior of electrochemically formed cupric hydroxide films. Electrochimica Acta 22, 1403–1409. Shoesmith D W, Sunder S, Bailey M G, Wallace G J, Stanchell F W, 1983. Anodic oxidation of copper in alkaline solutions. Part IV. Nature of the passivating film. J. Electroanalytical Chem. 143, 153–165. Sridhar N, Cragnolino G A, 1993. Effects of environment on localized corrosion of copper-based, high-level waste container materials. Corrosion 49, 967–976. Strehblow H-H, Titze B, 1980. The investigation of the passive behaviour of copper in weakly acid and alkaline solutions and the examination of the passive film by ESCA and ISS. Electrochim. Acta 25, 839–850. Strehblow H-H, Speckmann H-D, 1984. Corrosion and layer formation of passive copper in alkaline solutions. In Proc. Int. Congress on Metallic Corrosion, Toronto, June 3–7 1984, Vol. 1. National Research Council, Ottawa, ON, Canada, 114–121. Sutter E M M, Fiaud C, Lincot D, 1993. Electrochemical and photoelectrochemical characterization of naturally grown oxide layers on copper in sodium acetate solutions with and without benzotriazole. Electrochimica Acta 38, 1471–1479.

77
Sutter E M M, Millet B, Fiaud C, Lincot D, 1995. Some new photoelectrochemical insights in the corrosion-passivation processes of copper in aqueous chloride solution under open-circuit conditions. J. Electroanal. Chem. 386, 101–109. Thomas J G N, Tiller A K, 1972a. Formation and breakdown of surface films on copper in sodium hydrogen carbonate and sodium chloride solutions. I. Effects of anion concentrations. British Corrosion Journal 7, 256–262. Thomas J G N, Tiller A K, 1972b. Formation and breakdown of surface films on copper in sodium hydrogen carbonate and sodium chloride solutions. II. Effects of temperature and pH. British Corrosion Journal 7, 263–267. Vasquez Moll D, de Chialvo M R G, Salvarezza R C, Arvia A J, 1985. Corrosion and passivity of copper in solutions containing sodium sulphide. Analysis of potentiostatic current transients. Electrochim. Acta 30, 1011–1016. Wersin P, Spahiu K, Bruno J, 1994. Kinetic modelling of bentonite-canister interaction. Long-term predictions of copper canister corrosion under oxic and anoxic conditions. Swedish Nuclear Fuel and Waste Management Company Technical Report, TR 94-25. Wilhelm S M, Tanizawa Y, Liu C-Y, Hackerman N, 1982. A photo-electrochemical investigation of semiconducting oxide films on copper. Corrosion Science 22, 791–805.

ISSN 1404-0344CM Digitaltryck AB, Bromma, 2002