Corrosion of Aluminum Alloy Metal Matrix Composites in ... · concerning the application of metal...
12
TECHNICAL ARTICLE—PEER-REVIEWED Corrosion of Aluminum Alloy Metal Matrix Composites in Neutral Chloride Solutions Roland Tolulope Loto . Adeyinka Adeleke Submitted: 4 May 2016 / in revised form: 14 July 2016 Ó ASM International 2016 Abstract The electrochemical behavior of UNS A0332.00S, UNS A0332.20S, UNS A0359.00S, and UNS A0359.20S aluminum alloys were studied in NaCl media through weight loss, potentiodynamic, and cyclic polar- ization techniques. UNS A0332.20S and UNS A0359.20S were reinforced with SiC, 20% by volume while the other two samples were not reinforced. Scanning electron microscopy and energy dispersive spectroscopy were used to analyze the role of intermetallic phases in both the corroded and non-corroded aluminum alloy samples. Results showed that unreinforced alloys have lower cor- rosion rates compared to the reinforced alloys. Pits on the reinforced alloys were significantly more numerous, shal- lower, and widespread than on the monolithic alloys. Al/ SiC interface particles and intermetallic phases were observed to form at the mouth of the pits especially in alloys reinforced with SiC particles which might have contributed significantly to the weakening of regions where localized corrosion occurs. The result shows that inter- metallic phases may directly influence the corrosion behavior of the aluminum alloys. Keywords Corrosion Aluminum Composite materials Pitting Introduction Metal matrix composites are the focus of attention of automobile, electronics, aerospace, and military industrial complex due to their high-temperature applications, strength-to-weight ratio, stiffness, and dimension stability on thermal recycling. There has been lots of enthusiasm concerning the application of metal matrix composites in corrosive environments. Aluminum alloys such as 2024, 5052, 6061, and 7071 have been largely employed as matrix materials with silicon carbide (particles) as their major alloying element. Al/SiC composites undergo more rapid deterioration due to localized corrosion than their homogeneous counterparts [1, 2]. The localized corrosion which occurs at preferential sites can be attributed to fac- tors, such as the unstable silicon carbide matrix, existence of crevices, cracks, and pores, processing routes, existence of secondary phases, and the percentage volume of rein- forcement of SiC. A number of small volume intermetallic precipitates forms on the composite in comparison to the alloy. This suggests the probability of the formation of a significant number of secondary phases being accelerated by silicon carbide. A higher volume fraction of the com- posite has been observed to increase the likelihood of localized corrosion reactions. Past research on alloy 6013- 20 SiC, shows the presence of localized corrosion on sec- ondary phases [2]. The duplex nature of the composites aggravates corro- sion on the alloy surface and within the matrix compared to their homogeneous alloys [3–6]. This limits the service R. T. Loto (&) Department of Mechanical Engineering, Covenant University, Ota, Ogun State, Nigeria e-mail: [email protected] A. Adeleke Corrosion & Materials Engineer, Houston, TX, USA A. Adeleke Department of Mechanical Engineering, King Fahd University of Petroleum & Minerals, Dhahran 31261, Kingdom of Saudi Arabia 123 J Fail. Anal. and Preven. DOI 10.1007/s11668-016-0157-3
Transcript of Corrosion of Aluminum Alloy Metal Matrix Composites in ... · concerning the application of metal...

TECHNICAL ARTICLE—PEER-REVIEWED
Corrosion of Aluminum Alloy Metal Matrix Compositesin Neutral Chloride Solutions
Roland Tolulope Loto . Adeyinka Adeleke
Submitted: 4 May 2016 / in revised form: 14 July 2016
� ASM International 2016
Abstract The electrochemical behavior of UNS
A0332.00S, UNS A0332.20S, UNS A0359.00S, and UNS
A0359.20S aluminum alloys were studied in NaCl media
through weight loss, potentiodynamic, and cyclic polar-
ization techniques. UNS A0332.20S and UNS A0359.20S
were reinforced with SiC, 20% by volume while the other
two samples were not reinforced. Scanning electron
microscopy and energy dispersive spectroscopy were used
to analyze the role of intermetallic phases in both the
corroded and non-corroded aluminum alloy samples.
Results showed that unreinforced alloys have lower cor-
rosion rates compared to the reinforced alloys. Pits on the
reinforced alloys were significantly more numerous, shal-
lower, and widespread than on the monolithic alloys. Al/
SiC interface particles and intermetallic phases were
observed to form at the mouth of the pits especially in
alloys reinforced with SiC particles which might have
contributed significantly to the weakening of regions where
localized corrosion occurs. The result shows that inter-
metallic phases may directly influence the corrosion
behavior of the aluminum alloys.
Keywords Corrosion � Aluminum �Composite materials � Pitting
Introduction
Metal matrix composites are the focus of attention of
automobile, electronics, aerospace, and military industrial
complex due to their high-temperature applications,
strength-to-weight ratio, stiffness, and dimension stability
on thermal recycling. There has been lots of enthusiasm
concerning the application of metal matrix composites in
corrosive environments. Aluminum alloys such as 2024,
5052, 6061, and 7071 have been largely employed as
matrix materials with silicon carbide (particles) as their
major alloying element. Al/SiC composites undergo more
rapid deterioration due to localized corrosion than their
homogeneous counterparts [1, 2]. The localized corrosion
which occurs at preferential sites can be attributed to fac-
tors, such as the unstable silicon carbide matrix, existence
of crevices, cracks, and pores, processing routes, existence
of secondary phases, and the percentage volume of rein-
forcement of SiC. A number of small volume intermetallic
precipitates forms on the composite in comparison to the
alloy. This suggests the probability of the formation of a
significant number of secondary phases being accelerated
by silicon carbide. A higher volume fraction of the com-
posite has been observed to increase the likelihood of
localized corrosion reactions. Past research on alloy 6013-
20 SiC, shows the presence of localized corrosion on sec-
ondary phases [2].
The duplex nature of the composites aggravates corro-
sion on the alloy surface and within the matrix compared to
their homogeneous alloys [3–6]. This limits the service
R. T. Loto (&)
Department of Mechanical Engineering, Covenant University,
Ota, Ogun State, Nigeria
e-mail: [email protected]
A. Adeleke
Corrosion & Materials Engineer, Houston, TX, USA
A. Adeleke
Department of Mechanical Engineering, King Fahd University
of Petroleum & Minerals, Dhahran 31261,
Kingdom of Saudi Arabia
123
J Fail. Anal. and Preven.
DOI 10.1007/s11668-016-0157-3

lifespan and cause accelerated degradation of their excep-
tional mechanical properties, the main purpose for which it
is designed. Currently there is strong interest in the cor-
rosion behavior and electrochemical properties of complex
aluminum alloys prepared by special techniques, such as
rapid solidification processing, laser surface melting, and
surface modification of the ion beam technique [7–11].
B/Al composite experienced 50% deterioration in the
transverse strength after immersion in 3.5 wt.% NaCl for
six hours [12]. Al 6061/SiC shows a higher magnitude of
pitting corrosion compared to the corresponding unrein-
forced aluminum alloy [13, 14]. The pits were observed to
be shallower, but more numerous than the unreinforced
alloy [15]. The silicon carbide/Al interface is presumed to
be the preferred site for pit initiation and propagation [16].
Extruded composites were observed to have mild corrosion
damage due to the absence of flaws such as gas pores and
greater homogeneous distribution of the particles [17]
compared to the unreinforced alloys. Research has shown
that the presence of SiC alters the growth of corrosion pits
[18]. The market potential of Al6061/SiC makes it the most
widely used test material for corrosion investigation in
recent years.
SiC has been shown to be the preferred site for corrosion
on Al 6061/SiC and Al 6013/SiC from previous work
[19, 20]. The wrought alloy has a lower number of pits
formed compared to the composite alloys. Composites tend
to corrode faster than the main alloy matrix with the attack
confined to the interface. Some researchers suggest that
pitting corrosion initiates at SiC particles, while others
suggest that SiC is not the preferred site for pit initiation.
Research has shown that SiC causes microstructural
changes in the alloy matrix, which influences the corrosion
reaction mechanism [18–20]. The microstructure plays a
major role in the electrochemical characteristics of Al/SiC
composites. Pits in Al 5456/SiC have been shown to
nucleate at microstructural secondary phases within the
metal matrix [14]. Energy dispersive spectroscopy analysis
of a pitted region in Al 5456 showed the presence of
intermetallic precipitates consisting of major alloying ele-
ments including Mg, Cr, Al, Mn, and Fe as impurity.
Observation shows that the composite (Al 5456/SiC)
contained a significantly larger volume of smaller inter-
metallic precipitate than the wrought alloy [21].
The susceptibility of composites to localized corrosion
is consistent with the inherent tendency of duplex systems
to experience accelerated corrosion, thus controlling the
number of suspected sites of localized corrosion that can
possibly minimize corrosion of composites. The challenge
for greater application of composites, in particular Al 6061/
SiC, has increased with focus on service life and resistance
to environmental degradation. This can be realized through
understanding of the corrosion processes, the intriguing
nature of silicon carbide particles, and their influence on
the secondary phases and microstructure. This investiga-
tion aims to establish the role of secondary phases in
relation to silicon carbide particles and microstructures in
the localized corrosion processes as a step further to
incorporate corrosion control in design and make these
alloys more viable for technological applications.
Experimental Procedure
Material
Four samples of aluminum alloy samples were used for the
experiment. Their percentage elemental compositions are
shown in Table 1. Two of the alloy samples were rein-
forced with SiC particles, while the other two were not.
The reinforced samples have contained about 98% SiC
with particle size distribution of 12.8 lm ± 1.0 lm.
The mechanical properties of the aluminum samples
before exposure are presented in Table 2. The manufac-
turing process conditions for each material are also
indicated.
Test Environment
3.5 wt.% NaCl solution in the deaerated condition was
used throughout the experiment. Deaeration was achieved
by passing nitrogen gas, (N2), through the solution until it
became saturated with 99.5% N2.
Table 1 Composition of the aluminum alloy samples
Alloy sample
% Composition
Si Fe Cu Mn Ni Ti Zn Sr Pb Others Al SiC
UNS A0359.00S 9.5–10.5 0.8–1.0 3.0–3.5 0.5–0.8 1.0–1.5 0.20 max 0.03 0.005–0.015 … 0.10 Remain 0.0
UNS A0359.20S 9.5–10.5 0.8–1.0 3.0–3.5 0.5–0.8 1.0–1.5 0.20 max 0.03 0.005–0.015 … 0.10 Remain 19.0–22.0
UNS A0332.00S 9.5–10.5 0.2 max 2.8–3.2 0.8–1.2 1.0–1.5 0.20 max 0.05 0.000 … 0.10 Remain 0.0
UNS A0332.20S 9.5–10.5 0.2 max 2.8–3.2 0.8–1.2 1.0–1.5 0.20 max 0.05 0.000 … 0.10 Remain 18.0–22.0
J Fail. Anal. and Preven.
123

Sample Dimensions and Preparation
The sample dimensions for weight loss analysis were
20 mm 9 20 mm for each specimen. The exposed area
was 9.6 cm2. Potentiodynamic and cyclic polarization
analyses were performed on samples with circular dimen-
sion of 16 mm diameter. The exposed surface area was
1 cm2, calculated with an accuracy ±1%. The same sample
dimension was used for micro-analytical studies (scanning
electron microscopy and energy dispersive spectroscopy).
Grinding and polishing processes were performed on all the
specimens to remove some minor scratches present on the
surfaces. The samples for weight loss were washed in a hot
detergent for five minutes and then rinsed with distilled
water before exposure to solution containing potassium
dichromate, 28 ml of phosphoric acid, and de-mineralized
water to make 1 l of solution and then degreased. Cleaning
was performed in an ultrasonic cleaner in distilled water.
The samples were later dried in a desiccator for 24 h after
cleaning. The dried samples were weighed with an ana-
lytical balance with an accuracy of ±0.5 mg. This
procedure was followed after each test period for the cor-
roded samples in accordance with ASTM standard G572
(85).
Circular disk specimens for the polarization experiments
were ground with 320, 400, and 600 grit silicon carbide, in
sequential order, to remove the coarse scratches. Polishing
was carried out with 0.3 lm silicon carbide abrasive par-
ticles and final polishing was done with 0.05 lm abrasive
particles. The specimens were then treated with boiling
benzene and 5% acetic acid for five to ten minutes, rinsed
in acetone, washed with de-mineralized water, air dried,
and stored in a desiccator for 24 h prior to the com-
mencement of the experiment.
Weight Loss Experiment
The effects of corrosion on the alloys were evaluated by
weight loss method at 25 �C within an accuracy of ±3 �C.The amount of metal removed was determined by weighing
the specimens before and after exposure. Weight loss was
determined after every 200 h of exposure. The maximum
period of exposure was 1600 h. As recommended by
ASTM standard (G31-72), the experiments were performed
under static conditions in a de-aerated solution. The cor-
rosion rate is calculated from the weight loss and exposure
time data. The corrosion rate (R) was calculated from Eq 1
below:
R ¼ 87:6W
DAT
� �ðEq 1Þ
W is the weight loss (g), D is the density (g/cm2), A is the
surface area in cm2, and T is the exposure time (h).
Potentiodynamic and Cyclic Polarization
A potentiostat Model EG & G 273 A, interfaced with IBM
PC 286 computer was used to evaluate the pitting resis-
tance of the alloys being investigated. A polarization cell
consisting of a reference, auxiliary, and working electrodes
was connected to the potentiostat. All potentials were
determined with respect to a saturated calomel electrode
(SCE). A high-density graphite electrode was used as a
counter electrode. The working electrode comprised the
specimen holder, mounting rod, and the electrode holder.
Both potentiodynamic and cyclic polarization analyses
were carried out under the same experimental conditions.
After maintaining a constant open circuit potential, the
experiment began. Initial potential, for the potentiody-
namic, was fixed at �0.25 mV (SCE) with scan rate of
about 0.5 mV/s. Final potential was equally fixed at
0.8 mV (SCE). For cyclic polarization analysis, forward
scan was fixed from �0.5 to 1.5 V (SCE) with scan rate of
5 mV/s and reverse scan was fixed from 1.5 to �0.8 V
(SCE) with scan rate of 2.5 mV/s. The pitting potential
(Ep), in each case, was determined by the extrapolation of
polarization curve. In cyclic polarization, the protection
potential (Epp) was computed from the cyclic polarization
scans when the reverse scan coincides with the forward
scan closing the throughput loop. The corrosion current
(icorr), corrosion current density (Icorr), and corrosion
potential (Ecorr) were determined from the Tafel plots of
potential versus log Icorr. The corrosion rate (R) was cal-
culated from Eq 2;
Table 2 Mechanical properties of materials used (measured values)
Alloy identification
Ultimate tensile
strength (Mpa)
Modulus of
elasticity (Gpa)
Yield
strength (MPa) Elongation % Temper
UNS A0359.00S 324 87 262 0.6 T6
UNS A0359.20S 359 98.6 332 0.4 T6
UNS A0332.00S 240 94 172 0.3 T5
UNS A0332.20S 283 101 269 0.2 T5
T5 Artificially aged only, T6 solution heat treated and artificially aged
J Fail. Anal. and Preven.
123

R ¼ 0:00327� Icorr � Eq
D; ðEq 2Þ
where Icorr is the current density (lA/cm2), D is the density
(g/cm3), Eq is the specimen equivalent weight (g).
Results and Discussion
Weight Loss Measurements
The comparative plots of corrosion rates versus exposure
time in 3.5% NaCl solution for the aluminum alloys UNS
A0359.20S, UNS A0359.00S, UNS A0332.20S, and UNS
A0332.00S, are shown in Fig. 1. The results are summa-
rized in Tables 3, 4, 5, and 6. Observation of the plots
shows an initial increase in corrosion rate with respect to
time. At specific time periods, the plots attain the maxi-
mum level followed by a sudden decrease in corrosion rate
with respect to time. The latter section of the curves shows
a substantial, but generally constant corrosion rate over a
specified time period. The initial behavior of this process
can be attributed to the gradual response of aluminum alloy
constituents to Cl� ions in the NaCl solution [22–27]. This
occurs for alloys that passivate in aggressive environments.
The formation of the oxide film on the alloy surface occurs
gradually resulting in the initial increase in corrosion rate
with respect to time. With the formation of the protective
film, increase in corrosion rate ceases. At a certain stage the
protective oxide film undergoes rupture, when the film
breakage is faster than the rate of repassivation which leads
to relatively constant corrosion rate with respect to time.
This rupture phenomenon is assumed to have occurred due
to residual tension created between the oxide film layer and
aluminum matrix [28]. The corrosion on the aluminum
alloy surface tends to be localized as a result of the redox
electrochemical solution resistance. The basic reaction at
the anode is metal degradation:
Al ! Al3þ þ 3e� ðEq 3Þ
While the cathodic reactions are oxygen reduction:
O2 þ 2H2O þ 4e� ! 4OH ðEq 4Þ
and or hydrogen reduction within a pit environment as a
result of aluminum ion hydrolysis:
Table 3 Weight loss result for UNS A0359.20S
Sample
Weight
loss (mg)
Weight loss
average (mg)
Exposure
time (h)
Corrosion rate
mpy mm/year
1a 0.0023 0.0019 200 1.2312 0.0313
1b 0.0014 200
2a 0.0036 0.0040 400 1.3310 0.0332
2b 0.0044 400
3a 0.0073 0.0080 600 1.7747 0.0451
3b 0.0087 600
4a 0.0118 0.0125 800 2.0797 0.0528
4b 0.0132 800
5a 0.0080 0.0108 1000 1.4442 0.0367
5b 0.0137 1000
6a 0.0138 0.0126 1200 1.3976 0.0355
6b 0.0114 1200
7a 0.0143 0.0142 1400 1.3500 0.0343
7b 0.0141 1400
8a 0.0104 0.0158 1600 1.3102 0.0333
8b 0.0211 1600
Table 4 Weight loss result for UNS A0359.00S
Sample
Weight
loss (mg)
Weight loss
average (mg)
Exposure
time (h)
Corrosion rate
mpy mm/year
1a 0.0003 0.0002 200 0.1331 0.0034
1b 0.0001 200
2a 0.0004 0.0006 400 0.1997 0.0052
2b 0.0008 400
3a 0.0004 0.0014 600 0.3105 0.0078
3b 0.0024 600
4a 0.0018 0.0033 800 0.5488 0.0139
4b 0.0048 800
5a 0.0063 0.0084 1000 1.1180 0.0284
5b 0.0105 1000
6a 0.0125 0.0132 1200 1.4639 0.0372
6b 0.0139 1200
7a 0.0088 0.0097 1400 0.9220 0.0234
7b 0.0106 1400
8a 0.0063 0.0072 1600 0.5990 0.0152
8b 0.0081 1600Fig. 1 Comparison of corrosion rate vs. exposure time graphs for the
four alloys used
J Fail. Anal. and Preven.
123

2Hþ þ 2e� ! H2 ðEq 5Þ
The association between miniature cathodes and anodes
with the alloy matrix results in pitting corrosion, selective
deterioration, intermetallic particle etchout, and corrosion
at the grain boundaries. The oxide protective film that
develops on the aluminum alloy surface is non-
homogeneous, thin, and disordered. It provides an
appreciable level of protection under appropriate
conditions. When exposed to environments with chloride
ions (Cl�) (widely encountered), the oxide film breaks
down at definite sites causing the formation of pits on the
aluminum surface [29]. The solubility of Al3? enables the
degradation of the aluminum substrate metal and enhances
accelerated chloride attack.
Observation of the results shows that UNS A0359.20S
alloy has the highest corrosion rate of about 2.0797 mpy after
800 h of exposure. UNS A0359.00S alloy had a maximum
corrosion rate of 1.4639 mpy after 1400 h. These results show
that UNS A0359.00S alloy forms a protective layer of oxide
earlier than its reinforced counterpart. The same trend of
resultswas observed inUNSA0332.00SandUNSA0332.20S
alloys. UNSA0332.20S alloy had itsmaximum corrosion rate
of 3.898mpy after 1000hrs and UNS A0332.00S alloy had its
maximumcorrosion rate of 2.565 mpy after 600 h.With these
results, UNS A0332.00S alloy forms protective film earlier
enough before UNS A0332.20S alloy. The data above can be
elucidated through consideration of the fact that aluminum
and its alloys react in an unusual manner because they are
amphoterics [30] and [31].
Comparison was made between unreinforced alloys,
UNS A0359.00S and UNS A0332.00S, and the reinforced
alloys, UNS A0359.20S and UNS A0332.20S alloys. The
alloy with least corrosion rate is believed to be the alloy
with highest corrosion resistance. UNS A0359.00S showed
the lowest corrosion rate values, thus the alloy with highest
corrosion resistance (Table 4). The corrosion rate values
prove that it is the most suitable alloy for application in
NaCl environment. Reinforced alloys (UNS A0359.20S
and UNS A0332.20S) displayed the lowest corrosion
resistance in comparison to the unreinforced UNS A0359
and UNS A0332 alloys (Fig. 1; Tables 3, 4, 5, and 6).
These observations are in agreement with previous
research, that alloys reinforced with SiC have lower cor-
rosion resistance coupled with higher strength, than
unreinforced alloys of the same matrix [32–35].
Potentiodynamic Polarization Test
Three different potentiodynamic polarization tests were
performed for each of the aluminum alloys at ambient
temperature to enable reproducibility of results under the
same experimental conditions. Open circuit potential
(OCP) was observed within the range of �0.500 and
�0.557 V for UNS A0359.00S alloy. The range indicates
the stability region of corrosion potential of the particular
alloy. UNS A0359.00S alloy displayed open circuit
potential values between �0.683 V and �0.765. The OCP
values for UNS A0332.00S and UNS A0332.20S were also
found to be in the range of �0.483 to �0.549 V and
�0.497 to �0.564 V, respectively.
Table 5 Weight loss result for UNS A0332.20S
Sample
Weight
loss (mg)
Weight loss
average (mg)
Exposure
time (h)
Corrosion rate
mpy mm/year
1a 0.0042 0.0038 200 1.3289 0.0332
1b 0.0034 200
2a 0.0010 0.0045 400 1.4974 0.0380
2b 0.0080 400
3a 0.0052 0.0062 600 1.5752 0.0400
3b 0.0072 600
4a 0.0191 0.0184 800 2.0599 0.0523
4b 0.0177 800
5a 0.0456 0.0368 1000 3.8981 0.0990
5b 0.0280 1000
6a 0.0324 0.0232 1200 1.5728 0.0399
6b 0.0140 1200
7a 0.0162 0.0128 1400 1.2169 0.0309
7b 0.0094 1400
8a 0.0122 0.0106 1600 0.8818 0.0224
8b 0.0090 1600
Table 6 Weight loss result for UNS A0332.00S
Sample
Weight
loss (mg)
Weight loss
average (mg)
Exposure
time (h)
Corrosion rate
mpy mm/year
1a 0.0033 0.0019 200 0.2454 0.0062
1b 0.0005 200
2a 0.0009 0.0052 400 0.7303 0.0185
2b 0.0095 400
3a 0.0482 0.0296 600 2.5653 0.0651
3b 0.0110 600
4a 0.0169 0.0312 800 2.1886 0.0556
4b 0.0456 800
5a 0.0102 0.0092 1000 0.4224 0.0107
5b 0.0082 1000
6a 0.0086 0.0064 1200 0.3985 0.0101
6b 0.0042 1200
7a 0.0064 0.0050 1400 0.2456 0.0062
7b 0.0036 1400
8a 0.0032 0.0041 1600 0.2325 0.0059
8b 0.0050 1600
J Fail. Anal. and Preven.
123

Tafel and polarization resistance methods were used to
determine the rate of corrosion for each of the aluminum
alloys. In agreement with the results obtained from weight
loss analysis, UNS A0359.00S alloy showed the lowest
corrosion rate (0.762 mpy) compared to the other three
aluminum alloys used from the Tafel approach (Table 7).
This is sequentially followed by UNS A0332.00S with
corrosion rate of 0.93 mpy. UNS A0332.20S and UNS
A0359.20S have the highest corrosion rates with values of
1.489 and 1.688 mpy, respectively. A similar trend of
result was observed with xxthe used of polarization resis-
tance technique (Tables 7, 8, 9, and 10). Interpretation of
the result shows that UNS A0359.00S alloy has the highest
corrosion resistance capability while lowest resistance to
corrosion was displayed in its reinforced counterpart, UNS
A0359.20S alloy.
The corrosion rate results for UNS A0332.20S and UNS
A0359.20S shows that the passive film in the SiC-
reinforced alloys rapidly weakens and deteriorates at
specific sites causing collapse of the protective film and
pitting corrosion due to the presence of the intermetallic
precipitates and its influence on the Cl� interactions on the
oxide film in NaCl solution [36–39]. The intermetallic or
possibly the formation of secondary precipitates serve as
susceptibility sites at the boundaries between grains for
breakdown of the oxide film leading to localized corrosion
reactions [40]. It is suggested that a competitive adsorption
of chloride and hydroxide ions accelerates ion transport at
the local defect sites lead to film thinning. Breakage of the
protective oxide film leads to anion penetration and
migration through the passive film [41–43].
Chloride reactions result in the formation of soluble
chlorinated aluminum hydroxide which hinders the stabil-
ity of the oxide on the aluminum surface [44]. The
presence of Si in conjunction with Mg allows Mg2Si par-
ticles to precipitate [45–48]. Though it increases strength of
the aluminum alloy, it makes the alloy susceptible to
localized corrosion [49]. The recent investigation of the
electrochemical behavior of Mg2Si shows that Mg2Si
undergoes rapid dissolution compared to the matrix in Al
alloys. Si seems to reside along the grain boundary which
eventually leads to intergranular attack and stress corrosion
cracking [50–52]. The presence of Cu within the aluminum
alloy is deleterious to corrosion prevention as a result of the
formation of cathodic sites responsible for prolonging the
oxygen reduction reactions locally such as Al2Cu and
AlCu2Mg. The precise role of Cu in the aluminum alloy
matrix is still debatable. Muller and Galvele [53] reported
an increase in pitting potential value for the elemental
composition of Cu up to 5 wt.%. Cu-containing particles
have also been observed to support sufficient oxygen
reduction reactions [54–57].
Cyclic Polarization Techniques
The results obtained from the cyclic polarization test are
summarized in Table 11 and the hysteresis loops obtained
are shown in Figs. 2 and 3. Observation of the difference
between the pitting potential (Epit) and open
Table 10 Potentiodynamic polarization results for UNS A0332.00S
from Tafel and polarization resistance calculations
Sample
Corrosion current,
Icorr. (lA)OCP
(V)
Ba (V/
dec)
Bc (V/
dec)
Corrosion
rate (mpy)
Tafel
cal.
Rp
cal.
1B-1 0.3804 �0.547 0.1176 0.1955 0.936 3.324
1B-2 0.6524 �0.537 0.2489 0.5462 0.541 2.597
1B-3 0.9735 �0.479 0.1128 0.2266 0.764 2.667
Table 7 Potentiodynamic polarization results for UNS A0359.20S
from Tafel and polarization resistance calculations
Sample
Corrosion current,
Icorr (lA)OCP
(V)
Ba (V/
dec)
Bc (V/
dec)
Corrosion
rate (mpy)
Tafel
cal.
Rp
cal.
1C-1 0.6202 �0.683 0.0603 0.0994 0.347 1.700
1C-2 0.5314 �0.721 0.0689 0.1468 0.886 3.341
1C-3 0.9029 �0.763 0.0654 0.0974 1.688 2.688
Table 8 Potentiodynamic polarization results for UNS A0359.00S
from Tafel and polarization resistance calculations
Sample
Corrosion current,
Icorr (lA)OCP
(V)
Ba (V/
dec)
Bc (V/
dec)
Corrosion
rate (mpy)
Tafel
cal.
Rp
cal.
1B-1 0.8476 �0.500 0.1236 0.2495 0.762 3.734
1B-2 0.6214 �0.553 0.1162 0.3839 0.234 1.123
1B-3 0.4299 �0.539 0.1107 0.3616 0.523 2.510
Table 9 Potentiodynamic polarization results for UNS A0332.20S
from Tafel and polarization resistance calculations
Sample
Corrosion current,
Icorr (lA)OCP
(V)
Ba (V/
dec)
Bc (V/
dec)
Corrosion
rate (mpy)
Tafel
cal.
Rp
cal.
1B-1 0.4476 �0.524 0.1842 0.2578 1.489 3.742
1B-2 0.6722 �0.496 0.2000 0.1952 0.781 2.749
1B-3 0.9541 �0.560 0.2242 0.1950 1.286 3.503
J Fail. Anal. and Preven.
123

circuit/corrosion potential (Ecorr) computed for each alloy
sample shows that the greater the difference between these
two values, the higher the pitting resistance of the
respective alloy. This difference, Ecorr � Epit, is particu-
larly used to determine the service performance of
aluminum alloys in NaCl environments. UNS A0359.00S
alloy has the greatest value of Ecorr � Epit among the four
alloys used (0.1550V). UNS A0332.00S, UNS A0359.20S,
and UNS A0332.20S have respective Ecorr � Epit values of
0.1527, 0.1386, and 0.1236 V. UNS A0359.00S alloy dis-
played superior pitting resistance in NaCl solution
compared to the other alloy samples. As earlier mentioned,
the presence of chloride ions in aqueous media in contact
with aluminum metal or aluminum alloys causes pitting
attack. The cathodic reaction mechanism taking place
during pitting corrosion of aluminum alloys in NaCl
solution reduces oxygen to hydroxyl ion. The analogous
anodic reaction takes place according to the following
equations [58]:
Al þ 3H2O ! Al OHð Þ3þ 3Hþ þ 3e� ðEq 6Þ
Al þ 2H2O ! AlO OHð Þ þ 3Hþ þ 3e� ðEq 7Þ
Al þ 3=2H2O ! Al2O3 þ 3Hþ þ 3e� ðEq 8Þ
The presence of oxygen in the proximity of the
intermetallic compound has a strong influence on the
reduction reaction process; however, in the presence of
chloride ion, the reactions are of the form [59]:
Al OHð Þþ2þCl� ! Al OHð ÞClþ ðEq 9Þ
Al OHð ÞClþ þ H2O ! Al OHð Þ2Cl þ Hþ ðEq 10Þ
The reactions above are responsible for the formation of
corrosion products within the proximity of intermetallic
particles. In the deaerated condition, the cathodic reaction
is as follows (Eq 11):
H2O þ e� ! OH� þ HðadÞ ðEq 11Þ
Under this condition the hydroxide protective layer does
not adhere strongly to the alloy surface, and thus is unable
to prevent the dissolution of the alloy matrix and could not
create suitable resistance for aluminum against corrosion.
The Cl� considerably enhances the initiation and propa-
gation of the pits through an autocatalytic process. Positive
metallic cations accumulate in the pits due to anodic
Table 11 Summary of the results obtained from cyclic polarization experiment
Sample Epit (V) Epp (V) Ecorr. (V) E = Ecorr. � Ep (V) E = Ecorr. � Epit (avg) (V)
UNS A0359.20S-1 �0.5890 �0.7170 �0.4760 0.1110 0.1386
UNS A0359.20S-2 �0.4110 �0.6220 �0.6210 0.2100
UNS A0359.20S-3 �0.4240 �0.6820 �0.5120 0.0880
UNS A0359.00S-1 �0.4880 �0.5120 �0.5930 0.1050 0.1550
UNS A0359.00S-2 �0.4110 �0.6220 �0.6200 0.2090
UNS A0359.00S-3 �0.4100 �0.5020 �0.5620 0.1510
UNS A0332.20S-1 �0.4120 �0.6120 �0.5030 0.0910 0.1236
UNS A0332.20S-2 �0.3960 �0.5570 �0.5250 0.1290
UNS A0332.20S-3 �0.3650 �0.5620 �0.4760 0.1110
UNS A0332.00S-1 �0.5360 �0.5640 �0.6360 0.1000 0.1527
UNS A0332.00S-2 �0.4130 �0.6040 �0.5940 0.1810
UNS A0332.00S-3 �0.5210 �0.6030 �0.6980 0.1770
Fig. 2 Comparison of cyclic polarization curves for UNS A0359.00S
and UNS A0359.20S
Fig. 3 Comparison of cyclic polarization curves for UNS A0332.00S
and UNS A0332.20S
J Fail. Anal. and Preven.
123

dissociation and metal degradation. The Cl� ions also
concentrate in the pits as a result of the metal cations and
facilitate the reaction of the positive cations with H2O to
form OH- corrosion product and H? ions. The pits being
mildly acidic accelerate the corrosion process [60].
Micro-analytical Studies
Micrographs from scanning electron microscopy are pre-
sented in Figs. 4, 5, 6, 7, 8, 9, 10, and 11. Energy dispersive
spectroscopy (EDS) was used to study the elemental
compositions of the pit surroundings for the four aluminum
alloy samples. Four major elements were detected by EDS
in UNS A0332.20S aluminum alloy (Fig. 12). The ele-
ments consist of aluminum (52.62% composition), silicon
(23.47% composition), nickel (10.10% composition), and
copper (13.81% composition). According to Mondolfo [61]
on information guiding the formation of phases in alu-
minum alloys, the elements identified are most likely
Cu4NiAl7 and CuAl2 intermetallic phases around the pit
circumference. Based on this, the site will be anodic rela-
tive to the alloy matrix if these elements only are
responsible for the redox mechanism responsible for alloy
degradation. In another perspective, the areas containing
the suspected intermetallic phases might be cathodic rela-
tive to the entire matrix.
The presence of copper in aluminum alloy is deliber-
ately to improve its corrosion resistance properties, as a
result of which the formation of phases between copper and
other alloying elements are expected to provide adequate
protection against corrosion in NaCl media. Hence, the
other alloying elements or possibly the aluminum matrix
might deteriorate selectively in the NaCl media, thus the
suspected phases are left intact within the pit region. Three
major elements were detected in UNS A0332.00S alloy,
from EDS results in Fig. 13. The elements are aluminum
(76.63% composition), silicon (11.18% composition), and
copper (12.19% composition). There is the possibility of
Fig. 6 Micrograph of non-
corroded UNS A0332.00S
sample
Fig. 4 Micrograph of non-
corroded UNS A0332.20S
sample
Fig. 5 Micrograph of corroded
UNS A0332.20S sample
J Fail. Anal. and Preven.
123
CuAl2 intermetallic phase formation in the pit domain as
earlier mentioned in the reinforced counterpart (UNS
A0332.20S alloy). This is due to the formation of a single
type of intermetallic phase within the pit’s vicinity.
EDS results for the UNS A0359.00S alloy (Fig. 14)
depicts four major elements within the pit’s vicinity. The
elements consist of aluminum (90.47% composition),
silicon (3.06% composition), copper (1.48% composition),
and magnesium (4.99% composition). Three possible
major intermetallic phases can be recognized i.e.,
Cu2Mg8Si6Al5, Mg2Si, and CuMg4Al6 [61]. The possible
roles of these phases are explained in a similar manner as
earlier illustrated. Figure 15 shows the EDS analysis of
surface structure of UNS A0359.20S alloy. The results
Fig. 9 Micrograph of corroded
UNS A0359.00S sample after
weight loss
Fig. 8 Micrograph of non-
corroded UNS A0359.00S
sample
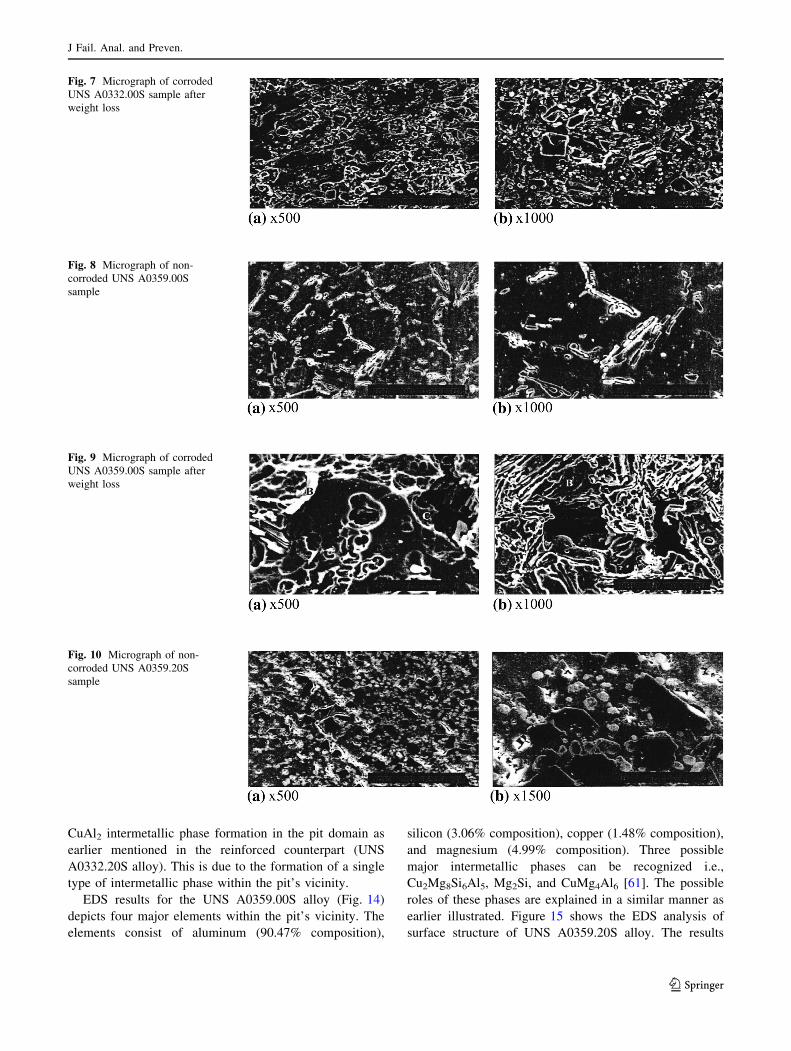
Fig. 10 Micrograph of non-
corroded UNS A0359.20S
sample
Fig. 7 Micrograph of corroded
UNS A0332.00S sample after
weight loss
J Fail. Anal. and Preven.
123

indicate the presence of four major elements in the pit’s
surrounding consisting of aluminum (54.50% composi-
tion), silicon (24.03% composition), iron (21.17%
composition), and magnesium with (0.30% composition).
Fe2SiAl5 and Mg2Si intermetallic phases were possibly
formed in the pit region based on the results.
The composition of the reinforcing particles are shown
with EDS analysis (Fig. 16), consisting of aluminum
(19.03% composition), silicon (70.34% composition), and
carbon (10.63 % composition). A predominant agglomer-
ation of SiC particles were formed in the area of alloy
degradation. This supports the findings of Trazaskoma
Fig. 11 Micrograph of
corroded UNS A0359.20S
sample
Fig. 14 EDS analysis of UNS A0359.00S showing elemental con-
stituents in pit’s surrounding
Fig. 15 EDS analysis of UNS A0359.20S showing elemental con-
stituents in pit’s surrounding
Fig. 12 EDS analysis of UNS A0332.20S showing elemental con-
stituents in pit’s surrounding
Fig. 13 EDS analysis of UNS A0332.00S showing elemental con-
stituents in pit’s surrounding
Fig. 16 EDS analysis of reinforced particles
J Fail. Anal. and Preven.
123

[62]. In addition to the observations, it was found that the
number of pits formed on the reinforced alloys is signifi-
cantly higher than the unreinforced alloys. Aggregate
calculation was achieved through observation of 0.6 cm2
corroded areas, microscopically for each of the alloys. This
investigation confirms that improved corrosion resistance
exhibited by the unreinforced alloys is due to the presence
of lower number of pits compared to the reinforced alloys.
Conclusion
Investigation of the effect of intermetallic phases on the
corrosion of aluminum silicon carbide (Al-SiCp) compos-
ites concludes that aluminum alloys reinforced with SiC
are more susceptible to corrosion attack in NaCl environ-
ments than the reinforced alloys. Comparison of the
corrosion rate of UNS A0359.20S, UNS A0359.00S, UNS
A0332.00S, and UNS A0332.20S alloys from potentiody-
namic polarization tests and weight loss analysis showed
that UNS A0359.00S and UNS A0332.00S both have a
higher corrosion resistance coupled with a lower number of
pits formed on the surface than UNS A0359.20S and UNS
A0332.20S whose corrosion pits appear deeper. Cyclic
polarization results showed that UNS A0359.00S has the
highest differential value between Ecorr (corrosion poten-
tial) and Ep (pitting potential). This is followed sequentially
by values obtained for UNS A0332.00S, UNS A0332.20S,
and UNS A0359.20S alloys. Intermetallic phases observed
in the aluminum alloys appear to represent the weakened
sites on the alloys where localized corrosion occurs. The
result further confirms that intermetallic phases may sig-
nificantly influence the corrosion behavior of the reinforced
alloys compared to the unreinforced counterparts. Silicon-
dominating particles were observed to be present at the
mouth of the pits especially those alloys that are reinforced
with SiC particles. This may have contributed significantly
to the weakening of pit regions.
Acknowledgment The authors express their sincere appreciation to
Mechanical Engineering Department, College of Engineering Sci-
ences and Applied Engineering, King Fahd University of Petroleum
& Minerals, Dhahran, 31261, KSA for the availability of equipment
and services for the research.
References
1. D.M. Aylor, Metals Handbook, 9th edn. (ASM, Metal Park, OH,
1984), pp. 859–863
2. S.V. Nair, J.K. Tien, R.C. Bates, SiC-reinforced aluminum metal
matrix composites. Int. Met. Rev. 30(6), 275–290 (1985)
3. D.M. Aylor, R.M. Kain, Assessing the corrosion resistance of
metal matrix composite materials in marine environments, in:
Recent Advances in Composites in the United States and Japan,
ASTM STP 864, ed. by J.R. Vinson, M. Taya (ASTM, Philadel-
phia, PA, 1983), pp. 632–647.
4. D.M. Aylor, P.J. Moran, Effect of reinforcement on the pitting
behaviour of aluminum-based metal matrix composites. J. Elec-
trochem. Soc. 132, 1277–1284 (1985)
5. M.C. Portal, E.G. Wolff, Advances in structural composites,
Paper No. AC14, presented to Society of Aerospace Materials
Process Engineering, 12th National Symposium, Exhibit, Wes-
tern Period, North Hollywood, CA, 1967
6. N. Deo, T.K.G. Namboodhir, Some corrosion characteristics of
aluminum-mica particulate composites. Corros. Sci. 29(10),1215–1229 (1989)
7. E. McCafferty, G.K. Hubler, P.M. Natishan, Naval research
laboratory surface modification program: ion beam and laser
processing of metal surfaces for improved corrosion resistance.
Mater. Sci. Eng. 86, 1–17 (1987)
8. P.P.M. Natishan, E. McCafferty, G.K. Hubler, The effect of pH of
zero charge on the pitting potential. J. Electrochem. Soc. 133,1061–1062 (1986)
9. W.L. Xu, T.M. Yue, H.C. Man, C.P. Chan, Laser surface melting
of aluminum alloy 6013 for improving pitting corrosion fatigue
resistance. Surf. Coat. Technol. 16–17, 5077–5086 (2000)
10. R.M. Latanision, Corrosion resistance of rapidly quenched alloys,
in: Critical Issues in Reducing the Corrosion of Steels, ed. by H.
Leidheiser, S. Haruyama (NACE, Houston, TX, 1986), p. 182
11. A.H. Al-saffar, V. Ashworth, A.K.O. Balimov, D.J. Chivers,
W.A. Grant, R.P.M. Procter, The effect of molybdenum ion
implantation on the general and pitting corrosion behaviour of
pure aluminum and high strength aluminum alloy. Corros. Sci.
20(1), 127–144 (1980)
12. A.J. Sedriks, J.A.S. Green, D.L. Novak, Corrosion behavior of
aluminum-boron composites in aqueous chloride solutions. Met.
Trans. 2(3), 871–875 (1971)
13. M.S.H. Bhat, M.K. Surappa, Corrosion behaviour of silicon
carbide particle reinforced 6061/Al alloy composites. J. Mater.
Sci. 26(18), 4991–4996 (1991)
14. P.P. Trzaskoma, Pit morphology of aluminum alloy and silicon
carbide/aluminum alloymetal matrix composites. Corrosion
46(5), 402–409 (1990)
15. J. Wu, W. Liu, P. Li, R. Wu, Effect of matrix alloying elements
on the corrosion resistance of C/Al composite materials. J. Mater.
Sci. Lett. 12(19), 1500–1501 (1993)
16. H. Sun, E.Y. Koo, H.G. Wheat, Corrosion Behavior of SiCp/6061
Al metal matrix composites. Corrosion 47(10), 741–753 (1991)
17. R.C. Paciej, V.S. Agarwala, Influence of processing variables on
the susceptibility of metal-matrix composites. Corrosion 44, 680–684 (1988)
18. F.U. Yuechun, S.H.I. Nanlin, Z. Dezhi, Y. Rui, Microstructural
changes of Ti-6Al-4V Matrix by the incorporation of continuous
SIC fibers. J. Mater. Sci. Technol. 22(4), 452–454 (2006)
19. P.P. Trzaskoma, Proceedings on the Effects of Silicon Carbide
Whiskers on the Initiation and Propagation of Pits on Silicon
Carbide/Aluminum Metal Matrix Composites, in: 10th Congress
on Metallic Corrosion, Madras, India, 1987.
20. P.P. Trzaskoma, E. McCafferty, C.R. Crane, Corrosion behaviour
of SiC/Al metal matrix composites. J. Electrochem. Soc. 130,1804–1809 (1983)
21. P.P. Trzaskoma, Localized corrosion of metal matrix composites,
in: Environmental Effects in Advanced Materials, ed. by H.J.
Russell, E.R. Richard (The Minerals, Metals & Materials Society,
Warrendale, PA, 1981), p. 249.
22. M.A. Streicher, Pitting corrosion of 18Cr-8Ni stainless steel. J.
Electrochem. Soc. 103(7), 375–390 (1956)
23. B.E. Wilde, J.S. Armijo, Influence of sulfur on the corrosion
resistance of austenitic stainless steel. Corrosion 23(7), 208–214(1967)
J Fail. Anal. and Preven.
123

24. Z. Szklarska-smialowska, Pitting corrosion of aluminum. Corros.
Sci. 41, 1743–1767 (1991)
25. J.R. Galvele, S.M. Demicheli, Mechanism of intergranular cor-
rosion of Al-Cu alloys. Corros. Sci. 10(11), 795–807 (1970)
26. I.L. Muller, J.R. Galvele, Pitting potential of high purity binary
aluminum alloys—I. Al.Cu alloys. Pitting and intergranular cor-
rosion. Corros. Sci. 17, 179–189 (1977)
27. B. Mazurkiewicz, A. Piotrowski, The electrochemical behaviour
of the Al2Cu intermetallic compound. Corros. Sci. 23, 697–707(1983)
28. Corrosion of Aluminum and Aluminum Alloys, http://www.
totalmateria.com/Article14.htm. Accessed: 11 Feb 2016
29. H. Ezuber, A. El-houd, F. El-shawesh, A study on the corrosion
behavior of aluminum alloys in seawater. Mater. Design 29(4),801–805 (2008)
30. E. Deltombe, M. Pourbaix, The electrochemical behavior of
aluminum—potential pH diagram of the system AI-H2O at 25�C.Corrosion 14(11), 16–20 (1958)
31. B. Zaid, D. Saidi, A. Benzaid, S. Hadji, Effects of pH and
chloride concentration on pitting corrosion of AA6061 aluminum
alloy. Corros. Sci. 50, 1841–1847 (2008)
32. H.M. Zakaria, Microstructural and corrosion behavior of Al/SiC
metal matrix composites. Ain Shams Eng. J. 5(3), 831–838
(2014)
33. F. Gnecco, A.M. Beccaria, Corrosion behaviour of Al–Si/SiC
composite in sea water. Br. Corros. J. 34(1), 57–62 (1999)
34. A. Pardo, M.C. Merino, S. Merino, M.D. Lopez, F.M. Viejo,
Carboneras. Influence of SiCp content and matrix composition on
corrosion resistance in cast aluminum matrix composites in salt
fog. Corros. Eng. Sci. Technol. 39(1), 82–88 (2004)
35. B.J. Shamsul, B.Y. Zamri, R.A. Khairel, Comparative study of
corrosion behavior of AA2014/15 Vol% Al2O3p and AA2009/20
Vol% SiCw. Portug. Electrochim. Acta. 26(3), 291–301
(2008)
36. P.M. Natishana, W.E. O’Grady, Chloride ion interactions with
oxide-covered aluminum leading to pitting corrosion: a review. J.
Electrochem. Soc. 161(9), C421–C432 (2014)
37. P. Schmuki, From Bacon to barriers: a review on the passivity of
metals and alloys. J. Solid State Electrochem. 6(3), 145–164
(2002)
38. G.S. Frankel, N. Sridhar, Review: understanding localized cor-
rosion. Mater. Today 11(10), 38–44 (2008)
39. I. Bennour, V. Maurice, P. Marcus, X-ray photoelectron spec-
troscopy study of the interaction of ultra-thin alumina films on
NiAl alloys with NaCl solutions. Surf. Interface Anal. 42(6-7),581–587 (2010)
40. P. Marcus, V. Maurice, H.H. Strehblow, Localized corrosion
(pitting): a model of passivity breakdownincluding the role of the
oxide layer nanostructure. Corros. Sci. 50, 2698–2704 (2008)
41. C.Y. Chao, L.F. Lin, D.D. MacDonald, A point defect model for
anodic passive films I. Film growth kinetics. J. Electrochem. Soc.
128, 1187–1194 (1981)
42. L.F. Lin, C.F. Chao, D.D. MacDonald, A point defect model for
anodic passive films II. Chemical breakdown and pit initiation. J.
Electrochem. Soc. 128, 1194–1198 (1981)
43. M. Urquidi, D.D. MacDonald, Solute vacancy interaction model
and the effect of minor alloying elements on the initiation of
pitting corrosion. J. Electrochem. Soc. 132, 555–558 (1985)
44. N.L. Sukiman, X. Zhou, N. Birbilis, A.E. Hughes, J.M.C. Mol,
S.J. Garcia, X. Zhou, G.E. Thompson, Durability and corrosion of
aluminum and its alloys: overview, property space, techniques
and developments, in: Aluminum Alloys—New Trends in Fabri-
cation and Applications ed. by Z. Ahmad (InTech, Rijeka, 2012).
45. S.M. Hirth, G.J. Marshall, S.A. Court, D.J. Lloyd, Effects of Si on
the aging behaviour and formability of aluminum alloys based on
AA6016. Mater. Sci. Eng. A. 319–321, 452–456 (2001)
46. M. Usta, M.M.E. Glicksman, R.N. Wright, The effect of heat
treatment on Mg2Si coarsening in aluminum 6105 alloy. Met.
Mater. Trans. A. 35A(2), 435–438 (2004)
47. O. Stelling, A. Irretier, O. Kessler, P. Krug, B. Commandeur,
New light-weight aluminum alloys with high Mg2Si-content by
spray forming. Mater. Sci. Forum. 519–521, 1245–1250 (2006)
48. F. Eckermann, F.T. Suter, P.J. Uggowitzer, A. Afseth, P. Sch-
mutza, The influence of MgSi particle reactivity and dissolution
processes on corrosion in Al–Mg–Si alloys. Electrochim. Acta.
54(2), 844–855 (2008)
49. F.I. Zeng, Z.I. Wei, J.F. Li, C.X. Li, X. Tan, Z. Zhang, Z.Q.
Zheng, Corrosion mechanism associated with Mg2Si and Si
particles in Al–Mg–Si alloys. Trans. Nonferrous Met. Soc. China.
21(12), 2559–2567 (2011)
50. V. Guillaumin, G. Mankowski, Localized corrosion of 2024 T351
aluminum alloy in chloride media. Corros. Sci. 41(3), 421–438(1998)
51. M.H. Larsen, J.C. Walmsley, O. Lunder, R.H. Mathiesen, K.
Nisancioglu, Intergranular corrosion of copper-containing
AA6xxx AlMgSi aluminum alloys. J. Electrochem. Soc. 155(11),C550–C556 (2008)
52. I.L. Muller, J.R. Galvele, Pitting potential of high purity binary
aluminum alloys—II. AlMg and AlZn alloys. Corros. Sci. 17(12),995–1007 (1977)
53. B. Mazurkiewicz, A. Piotrowski, The electrochemical behaviour
of the Al2Cu intermetallic compound. Corros. Sci. 23(7), 697–707 (1983)
54. J.R. Scully, T.O. Knight, R.G. Buchheit, D.E. Peebles, Electro-
chemical characteristics of the Al2Cu, Al3Ta and Al3Zr
intermetallic phases and their relevancy to the localized corrosion
of Al alloys. Corros. Sci. 35(1–4), 185–195 (1993)
55. R.G. Buchheit, Electrochemistry of h(Al2Cu), S(Al2CuMg) and
T1(Al2Cu–Li) and localized corrosion and environment assisted
cracking in high strength Al alloys. Mater. Sci. Forum. 331(II),
(2000).
56. N. Birbilis, M.K. Cavanaugh, R.G. Buchheit, Electrochemical
behavior and localized corrosion associated with Al7Cu2Fe par-
ticles in aluminum alloy 7075-T651. Corros. Sci. 48(12), 4202–4215 (2006)
57. E. Andres, O. Juan, R. Edmundo, H. Francisco, A. Daniela, G.
Juanluis, Oxygen reduction on Cu1, Mn16O4 spinel particles
composite electrodes effect of particles size. J. Chilean Chem.
Soc. (2014). doi:10.4067/S0717-97072014000200023
58. R. Gundersen, K. Nisancioglu, Cathodic protection of aluminum
in seawater. Corrosion 46(4), 279–285 (1990)
59. S.Y. Luo, Y.C. Zheng, M.C. Li, Effect of Cavitation on corrosion
behavior of 20SiMn low-alloy steel in 3% sodium chloride
solution. Corrosion. 59(7), 597–605 (2003)
60. R.T. Loto, Pitting corrosion evaluation of austenitic stainless steel
type 304 in acid chloride media. J. Mater. Environ. Sci. 4(4),448–459 (2013)
61. L.F. Mondolfo, Aluminum Alloys: Structure and Properties
(Butterwort, London, 1976), pp. 534–774
62. P.P. Trzaskoma, Pit morphology of aluminum alloy and silicon
carbide/aluminum alloy metal matrix composites. Corrosion
46(5), 402–409 (1990)
J Fail. Anal. and Preven.
123