
Corrosion Behavior of Solution- Annealed CoCrMo … · Corrosion Behavior of Solution-Annealed...
35
Corrosion Behavior of Solution- Annealed CoCrMo Medical Implant Alloys Pooja Panigrahi Advisor: Laurence D. Marks Mentor: Yifeng Liao MSE 396-2 Instructor: Kathleen Stair Department of Materials Science and Engineering The McCormick School of Engineering and Applied Sciences Northwestern University June 6, 2011
Transcript of Corrosion Behavior of Solution- Annealed CoCrMo … · Corrosion Behavior of Solution-Annealed...
!!!Corrosion Behavior of Solution-Annealed CoCrMo Medical Implant Alloys
Pooja Panigrahi Advisor: Laurence D. Marks Mentor: Yifeng Liao MSE 396-2 Instructor: Kathleen Stair Department of Materials Science and Engineering The McCormick School of Engineering and Applied Sciences Northwestern University June 6, 2011

! ! ""!
Corrosion Behavior of Solution-Annealed CoCrMo Medical Implant Alloys Pooja Panigrahi Department of Materials Science and Engineering The McCormick School of Engineering and Applied Sciences Northwestern University June 6, 2011 Abstract Corrosion behavior of solution annealed high-carbon and low-carbon CoCrMo wrought alloy, commonly used in medical joint implants, was investigated. The surface passivation properties remained similar with and without the various solution anneal conditions, while the rate of corrosion was lower for solution annealed high-carbon CoCrMo. Corrosion was found to target phase boundaries and certain grain boundaries in the high-carbon alloy. This preferential corrosion may be due to chromium depletion at the boundaries, higher grain boundary energy as a function of the misorientation angle between the neighboring grains, or both. These findings suggest that solution annealing the high-carbon CoCrMo alloys may lower the implant’s rate of corrosion in vivo due to the more corrosion-resistant microstructure.
! ! """!
Table of Contents
Abstract
1 - Introduction
2 - Methods and Materials
3 - Results
3.1 - Metallurgy and Microstructural Characterization
3.2 - Electrochemical Tests
3.2.1 - Open Circuit Potentials
3.2.2 - Impedance and Equivalent Circuit
3.2.3 - Potentiodynamic (Cyclic Polarization)
3.3 - White Light Interferometry and SEM After Corrosion
4 - Discussion
4.1 – Corrosion Resistance and Passive Film Behavior
4.2 - Preferential Corrosion
5 - Conclusions
6 - Acknowledgements
References
ii 1 2 6 6 10 10 11 15 18 27 27 28 29 30 30
! ! #!
1 - Introduction
A variety of conditions, most notably osteoarthritis and rheumatoid arthritis, may
result in a patient’s need for prosthetic joint implants at hips and knees. Every year, as
patients live longer, demand is rising with and increasing number of diagnoses [1].
CoCrMo alloys are currently the leading materials for metal-on-metal implant bearings.
These alloys have a superior combination of properties including fracture toughness,
ductility, biocompatibility, strength, and corrosion resistance compared to UHMWPE,
alumina, titanium alloys, and combined ceramic, metal, and polyethylene systems [2].
Despite the superior mechanical performance of the CoCrMo alloys, elevated
levels of cobalt and chromium cations have frequently been detected in the blood of
patients with implants comprised of this material [3]. These ions result from corrosion of
the alloys. Chromium and cobalt cations are known to form metal-protein complexes in
vivo, and these antigens elicit the hypersensitivity responses such as dermatitis, urticarial
vasculitis, metallosis, muscular necrosis, and a variety of other mild to severe medical
conditions [4].
Metal implant corrosion is controlled by both the thermodynamic driving forces
of the redox reactions which cause corrosion and the physical barriers which limit the
kinetics of corrosion [2]. There is both a chemical driving force for oxidation and an
electrical driving force for separating the positive (metal cation) and negative (electron)
charges from one another during corrosion [2]. In the CoCrMo alloy system, the surface
barrier limiting the kinetics of corrosion is in the form of a passive oxide film [2]. The
formation and thickness of this chromium oxide film depend on the electric field across
the oxide, since reduction and oxidation processes occur as necessary to keep the electric

! ! $!
field strength constant [2]. It is generally accepted that in vivo, the Cr2O3 passive film is
2-8 nm in thickness [5].
The bulk microstructure and solution annealing properties of CoCrMo alloys are
well documented. The high-carbon alloys used in surgical implants consist predominantly
of a !Co FCC matrix phase [6, 7], with nanograin precipitates [8] of mixed "
intermetallic (Cr8Co7) [7] and hard carbide phases to increase strength [6, 9]. At
solutionizing temperatures above 1150oC and below incipient melting temperatures of
about 1250oC [9], researchers achieved varying amounts of second phase dissolution [6,
9, 10]. The low-carbon alloys consist of the same matrix phase with no precipitate phases
[11]. As with all wrought alloys, solution anneal heat treatments for both low-carbon and
high-carbon CoCrMo are known to lead to grain coarsening.
While the thermal behavior of CoCrMo alloys has been explored thoroughly and
the phases have been well characterized, very little is known about any differences in
corrosion behavior that these microstructural changes may cause. Here, the corrosion
properties of solution annealed CoCrMo wrought alloys are investigated.
2 - Methods and Materials!
Twenty cylindrical wrought CoCrMo alloy pins, 12 mm in diameter and 7 mm
thick, were obtained from the Rush University Orthopedics Center. Fifteen pins were of
high-carbon (HC) content and five pins were of low-carbon (LC) content, Co-27.63Cr-
6.04Mo-0.7Mn-0.66Si-0.241C-0.18Ni-0.14Fe (wt%) and Co-27.56Cr-5.7Mo-0.6Mn-
0.55Ni-0.38Si-0.19Fe-0.034C (wt%) respectively. Experimental conditions consisted of
solution heat treatments at 1150oC or 1230oC, for 2 or 24 hours, with no replicates (n=1)
! ! %!
for LC and three replicates (n=3) for HC. The low-carbon samples were included only for
general comparison, but it is generally accepted that LC CoCrMo alloys have both poorer
wear and corrosion resistance. Experimental conditions and replicates are summarized in
Table 1. All heat treatments were performed in a box furnace in an air atmosphere, and
surface oxides were removed mechanically using SiC grinding paper.
Table 1. Solution anneal heat treatments performed on CoCrMo samples
Samples Temperature (oC)
Time Annealed (h)
1 LC, 3 HC - - 1 LC, 3 HC 1150 2 1 LC, 3 HC 1150 24 1 LC, 3 HC 1230 2 1 LC, 3 HC 1230 24
Specimens were prepared for microstructural characterization using a mechanical
polishing sequence of 9 µm, 3 µm, and 1 µm polycrystalline water-based colloidal
abrasive solutions on Texmet polishing cloths. Specimens were then etched by a 2-5
minute immersion in a solution of 50 mL H2O and 50 mL HCl with 4 g of K2S5O5 as a
reagent. A Hitachi S3400 SEM was used to obtain micrographs of specimens before and
after electrochemical corrosion, using both secondary electron (SE) and backscattered
electron (BSE) detectors. An accelerating voltage of 20 kV was used with a probe current
of 70 µA.
After initial microstructural characterization, the surfaces of the samples were
ground and re-polished to a mirror finish in preparation for corrosion testing. A Zygo
white light interferometer (20x Mirau objective lens) was used to topographically image
the exposed surfaces prior to corrosion to ensure acceptable average surface roughness
! ! &!
values (less than 50 nm). Each sample was then incorporated into a 4-chamber
electrochemical cell as the working electrode (WE) with a graphite counter electrode
(CE) and SCL reference electrode, all connected to a potentiostat and PC with the Gamry
Electrochemical Analysis software. The corrosion cell was filled with 10 mL of bovine
calf serum (BCS) buffered to a basic pH 7.4 solution, and placed in a hot water bath
maintained at 37oC.
For each sample, the sequence of electrochemical tests began with a brief open
circuit potential test (OCP1) to ensure the circuit was set up correctly. A potentiostatic
test was then run, applying a constant cathodic potential to remove the passive film and
any proteins that may have adsorbed on the metallic surface [12], so that all samples
would have the same “starting point”. A longer open circuit potential test (OCP2) was
run before any corrosion was performed to determine the material’s Eoc.
An electrochemical impedance spectroscopy (EIS) test was conducted to measure
impedance as a function of frequency. Results from this test were used to construct Bode
phase, Bode impedance, and Nyquist plots to qualitatively compare corrosion behavior.
These results were also used to construct equivalent circuits (ECs), modeling the
electrochemical system with a purely electrical circuit. For the ECs, a Randall’s circuit of
a solution resistance Ru in series with a polarization resistance Rp and capacitance Cf in
parallel was used to model the properties of the electrolyte and the metal interface.
A potentiodynamic (cyclic polarization) test was performed to corrode the sample
and measure the current at each applied potential. The resulting potentiodynamic curves
were used to qualitatively compare the corrosion kinetics as they relate to the passive
film. The corrosion potential Ecorr and the current density icorr at this potential were
! ! '!
approximated using the Tafel method. Lastly, another extended open circuit potential test
(OCP3) was performed to measure the open circuit voltage Eoc of the corroded sample
surface. Parameters for each test in this sequence are detailed in Table 2.
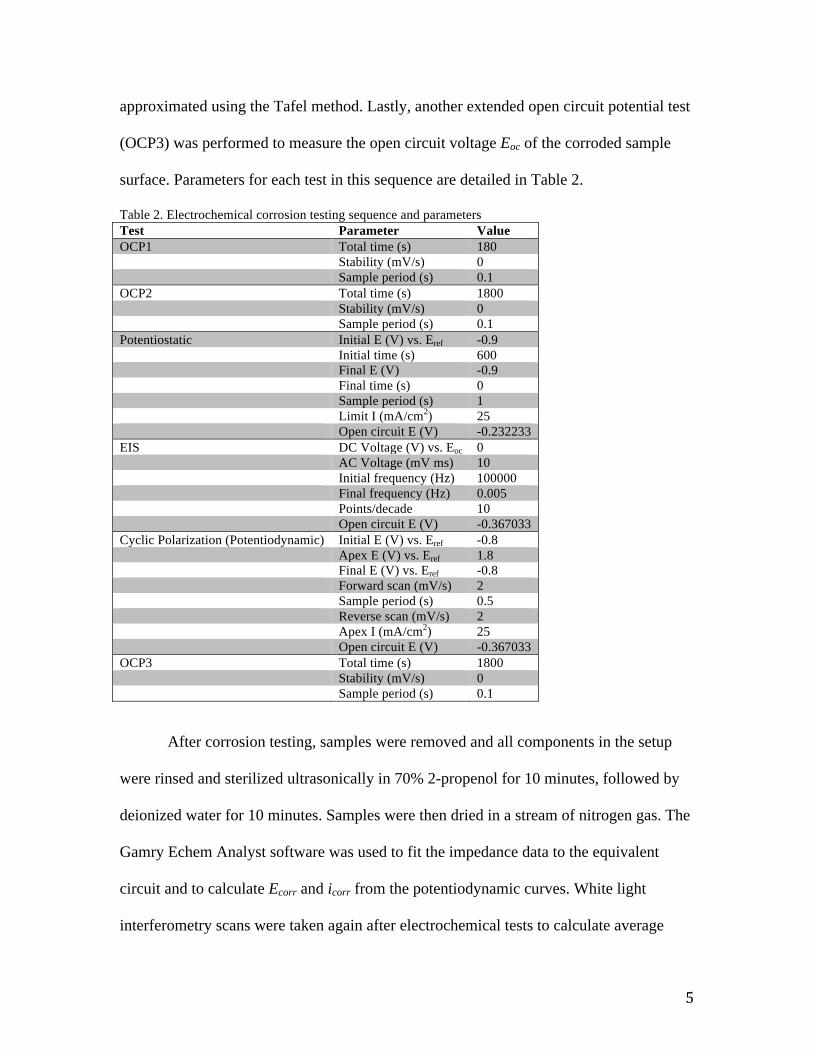
Table 2. Electrochemical corrosion testing sequence and parameters Test Parameter Value OCP1 Total time (s) 180 Stability (mV/s) 0 Sample period (s) 0.1 OCP2 Total time (s) 1800 Stability (mV/s) 0 Sample period (s) 0.1 Potentiostatic Initial E (V) vs. Eref -0.9 Initial time (s) 600 Final E (V) -0.9 Final time (s) 0 Sample period (s) 1 Limit I (mA/cm2) 25 Open circuit E (V) -0.232233 EIS DC Voltage (V) vs. Eoc 0 AC Voltage (mV ms) 10 Initial frequency (Hz) 100000 Final frequency (Hz) 0.005 Points/decade 10 Open circuit E (V) -0.367033 Cyclic Polarization (Potentiodynamic) Initial E (V) vs. Eref -0.8 Apex E (V) vs. Eref 1.8 Final E (V) vs. Eref -0.8 Forward scan (mV/s) 2 Sample period (s) 0.5 Reverse scan (mV/s) 2 Apex I (mA/cm2) 25 Open circuit E (V) -0.367033 OCP3 Total time (s) 1800 Stability (mV/s) 0 Sample period (s) 0.1
After corrosion testing, samples were removed and all components in the setup
were rinsed and sterilized ultrasonically in 70% 2-propenol for 10 minutes, followed by
deionized water for 10 minutes. Samples were then dried in a stream of nitrogen gas. The
Gamry Echem Analyst software was used to fit the impedance data to the equivalent
circuit and to calculate Ecorr and icorr from the potentiodynamic curves. White light
interferometry scans were taken again after electrochemical tests to calculate average
! ! (!
surface roughness measurements and SEM was used as an additional characterization
tool for the corroded surfaces in SE imaging mode.
!
3 - Results
3.1 – Metallurgy and Microstructural Characterization
Solution anneals generally resulted in dramatic grain coarsening of various
degrees, dependent on carbon content, anneal time, and anneal temperature, for both LC
and HC CoCrMo wrought alloys.
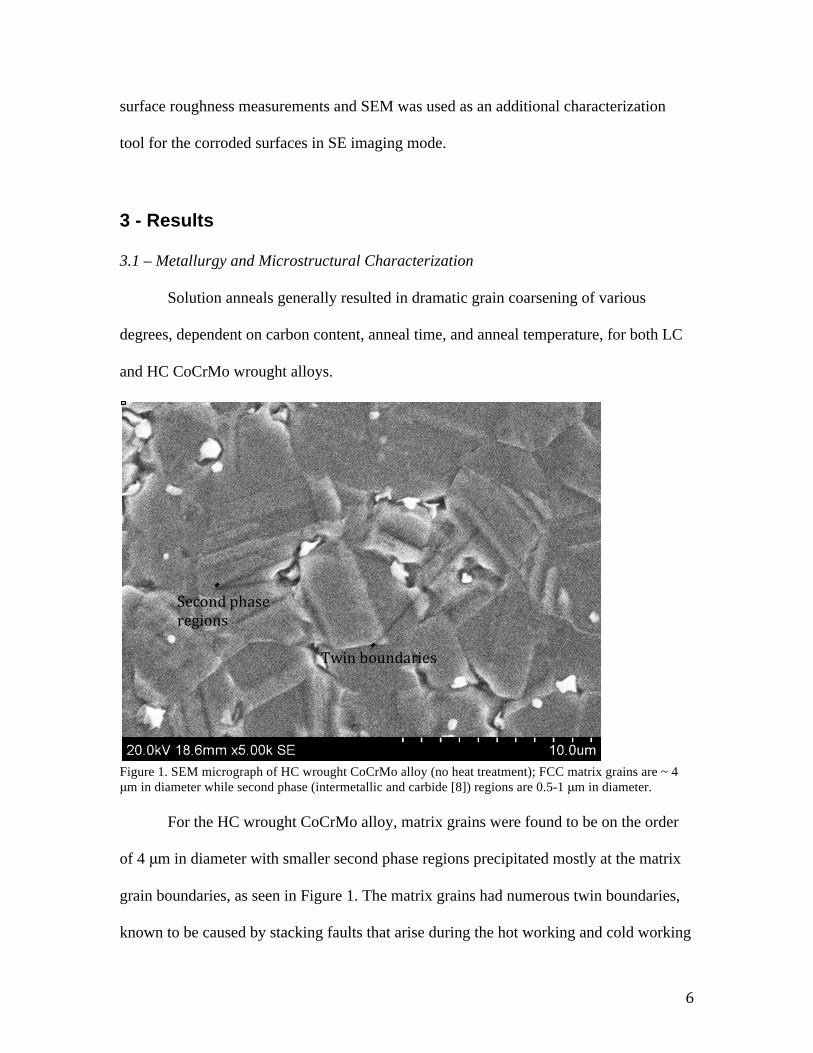
Figure 1. SEM micrograph of HC wrought CoCrMo alloy (no heat treatment); FCC matrix grains are ~ 4 !m in diameter while second phase (intermetallic and carbide [8]) regions are 0.5-1 !m in diameter.
For the HC wrought CoCrMo alloy, matrix grains were found to be on the order
of 4 !m in diameter with smaller second phase regions precipitated mostly at the matrix
grain boundaries, as seen in Figure 1. The matrix grains had numerous twin boundaries,
known to be caused by stacking faults that arise during the hot working and cold working
)*+,-.!/012*!3*4",-2!!! ! ! 56"-!7,8-.13"*2!
! ! 9!
processes used to get the material to the wrought state [8]. These stacking faults result in
twinning more frequently when there is a lower stacking fault energy, leading to higher
work hardening rates [13].
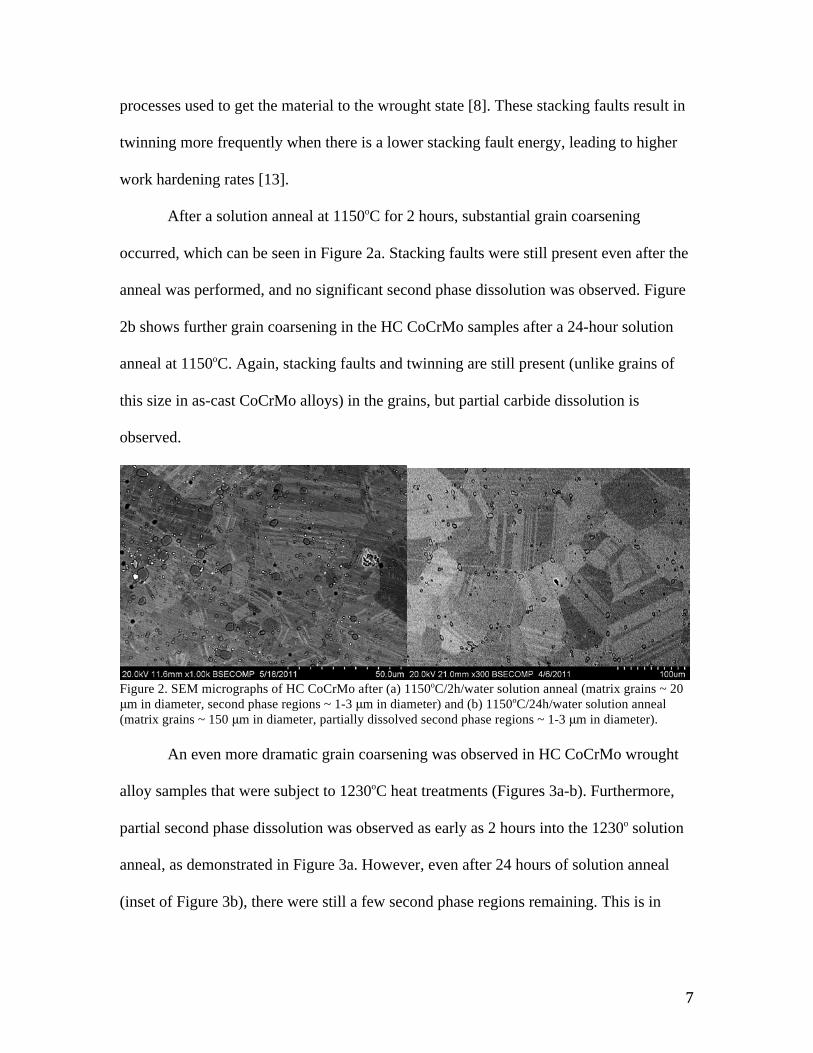
After a solution anneal at 1150oC for 2 hours, substantial grain coarsening
occurred, which can be seen in Figure 2a. Stacking faults were still present even after the
anneal was performed, and no significant second phase dissolution was observed. Figure
2b shows further grain coarsening in the HC CoCrMo samples after a 24-hour solution
anneal at 1150oC. Again, stacking faults and twinning are still present (unlike grains of
this size in as-cast CoCrMo alloys) in the grains, but partial carbide dissolution is
observed.
Figure 2. SEM micrographs of HC CoCrMo after (a) 1150oC/2h/water solution anneal (matrix grains ~ 20 !m in diameter, second phase regions ~ 1-3 !m in diameter) and (b) 1150oC/24h/water solution anneal (matrix grains ~ 150 !m in diameter, partially dissolved second phase regions ~ 1-3 !m in diameter). An even more dramatic grain coarsening was observed in HC CoCrMo wrought
alloy samples that were subject to 1230oC heat treatments (Figures 3a-b). Furthermore,
partial second phase dissolution was observed as early as 2 hours into the 1230o solution
anneal, as demonstrated in Figure 3a. However, even after 24 hours of solution anneal
(inset of Figure 3b), there were still a few second phase regions remaining. This is in
! ! :!
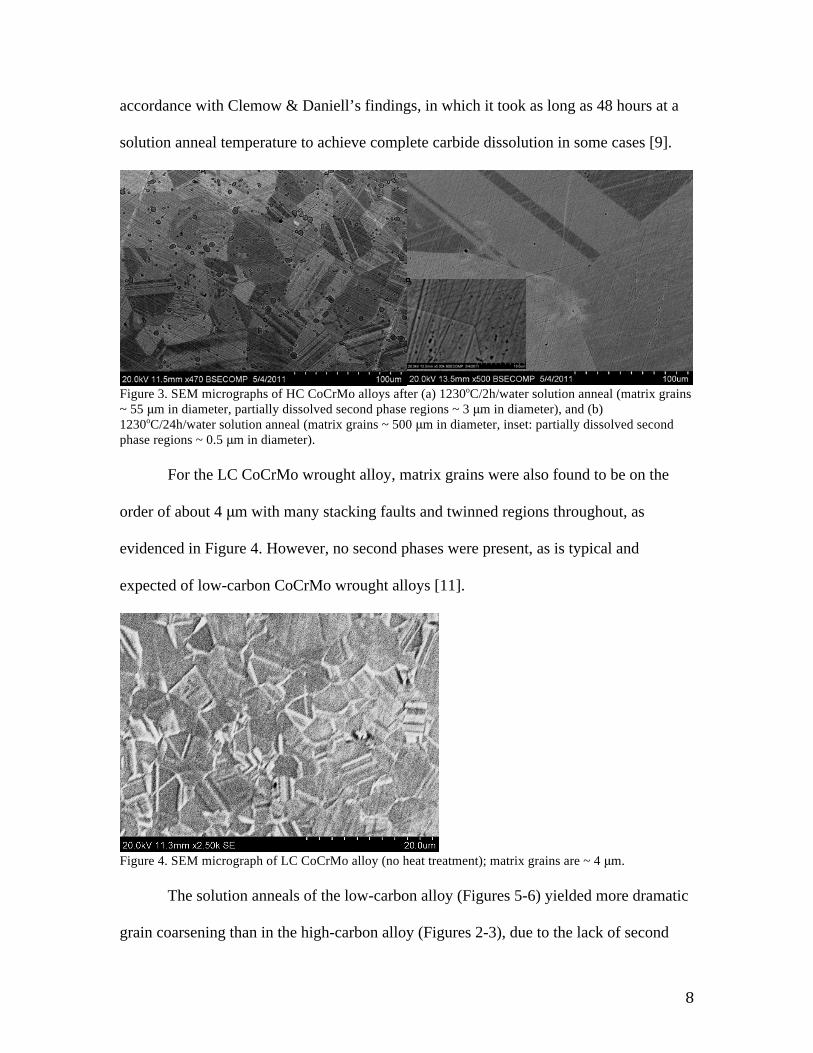
accordance with Clemow & Daniell’s findings, in which it took as long as 48 hours at a
solution anneal temperature to achieve complete carbide dissolution in some cases [9].
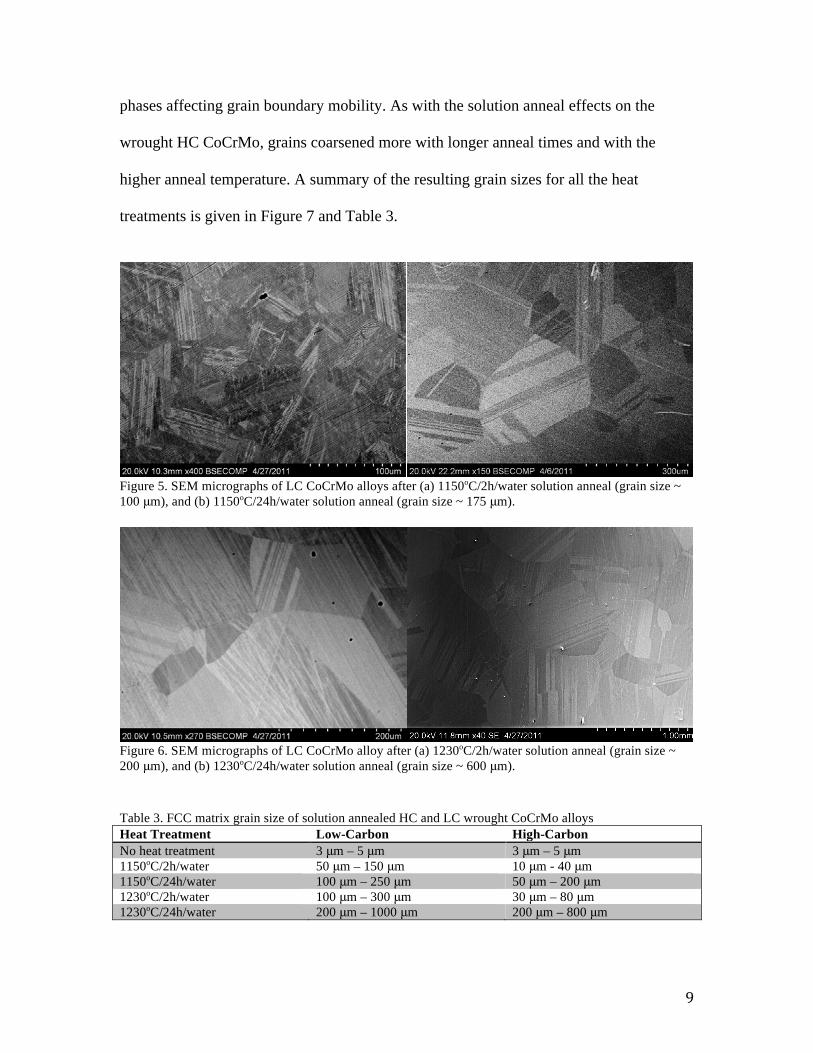
Figure 3. SEM micrographs of HC CoCrMo alloys after (a) 1230oC/2h/water solution anneal (matrix grains ~ 55 !m in diameter, partially dissolved second phase regions ~ 3 !m in diameter), and (b) 1230oC/24h/water solution anneal (matrix grains ~ 500 !m in diameter, inset: partially dissolved second phase regions ~ 0.5 !m in diameter). For the LC CoCrMo wrought alloy, matrix grains were also found to be on the
order of about 4 !m with many stacking faults and twinned regions throughout, as
evidenced in Figure 4. However, no second phases were present, as is typical and
expected of low-carbon CoCrMo wrought alloys [11].
Figure 4. SEM micrograph of LC CoCrMo alloy (no heat treatment); matrix grains are ~ 4 !m. The solution anneals of the low-carbon alloy (Figures 5-6) yielded more dramatic
grain coarsening than in the high-carbon alloy (Figures 2-3), due to the lack of second
! ! ;!
phases affecting grain boundary mobility. As with the solution anneal effects on the
wrought HC CoCrMo, grains coarsened more with longer anneal times and with the
higher anneal temperature. A summary of the resulting grain sizes for all the heat
treatments is given in Figure 7 and Table 3.
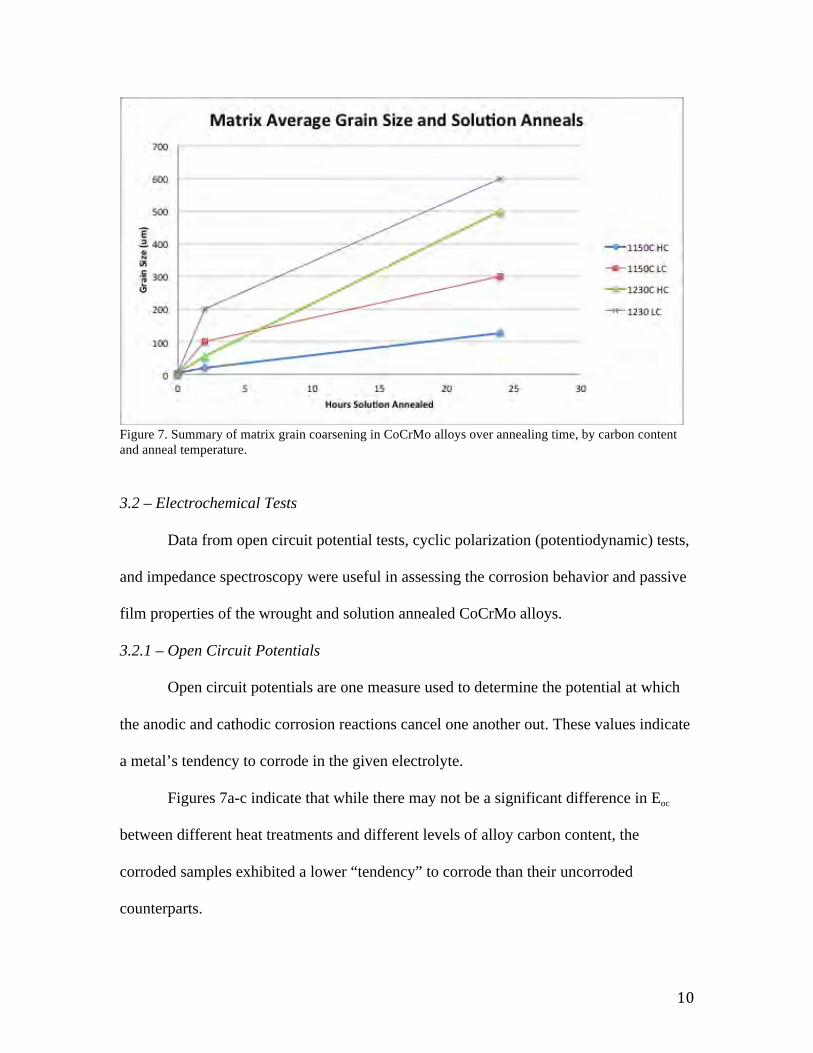
Figure 5. SEM micrographs of LC CoCrMo alloys after (a) 1150oC/2h/water solution anneal (grain size ~ 100 !m), and (b) 1150oC/24h/water solution anneal (grain size ~ 175 !m).
Figure 6. SEM micrographs of LC CoCrMo alloy after (a) 1230oC/2h/water solution anneal (grain size ~ 200 !m), and (b) 1230oC/24h/water solution anneal (grain size ~ 600 !m). Table 3. FCC matrix grain size of solution annealed HC and LC wrought CoCrMo alloys Heat Treatment Low-Carbon High-Carbon No heat treatment 3 !m – 5 !m 3 !m – 5 !m 1150oC/2h/water 50 !m – 150 !m 10 !m - 40 !m 1150oC/24h/water 100 !m – 250 !m 50 !m – 200 !m 1230oC/2h/water 100 !m – 300 !m 30 !m – 80 !m 1230oC/24h/water 200 !m – 1000 !m 200 !m – 800 !m
! ! #<!
Figure 7. Summary of matrix grain coarsening in CoCrMo alloys over annealing time, by carbon content and anneal temperature. 3.2 – Electrochemical Tests
Data from open circuit potential tests, cyclic polarization (potentiodynamic) tests,
and impedance spectroscopy were useful in assessing the corrosion behavior and passive
film properties of the wrought and solution annealed CoCrMo alloys.
3.2.1 – Open Circuit Potentials
Open circuit potentials are one measure used to determine the potential at which
the anodic and cathodic corrosion reactions cancel one another out. These values indicate
a metal’s tendency to corrode in the given electrolyte.
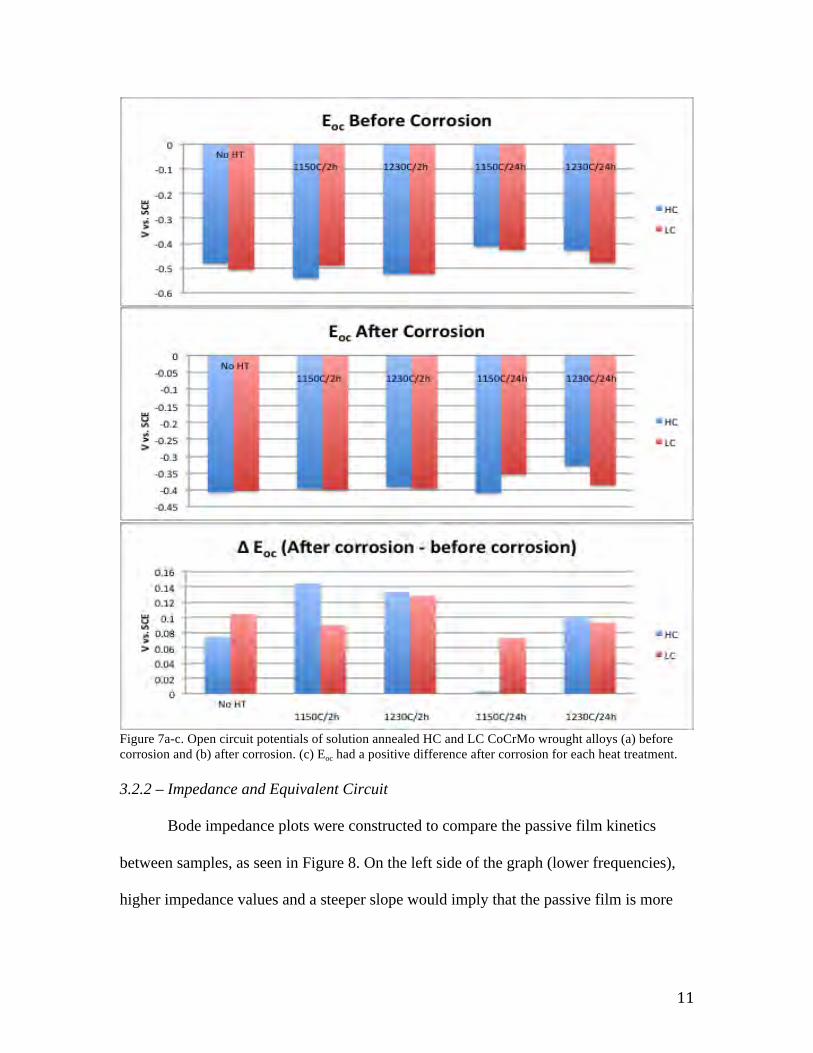
Figures 7a-c indicate that while there may not be a significant difference in Eoc
between different heat treatments and different levels of alloy carbon content, the
corroded samples exhibited a lower “tendency” to corrode than their uncorroded
counterparts.
! ! ##!
Figure 7a-c. Open circuit potentials of solution annealed HC and LC CoCrMo wrought alloys (a) before corrosion and (b) after corrosion. (c) Eoc had a positive difference after corrosion for each heat treatment. 3.2.2 – Impedance and Equivalent Circuit
Bode impedance plots were constructed to compare the passive film kinetics
between samples, as seen in Figure 8. On the left side of the graph (lower frequencies),
higher impedance values and a steeper slope would imply that the passive film is more
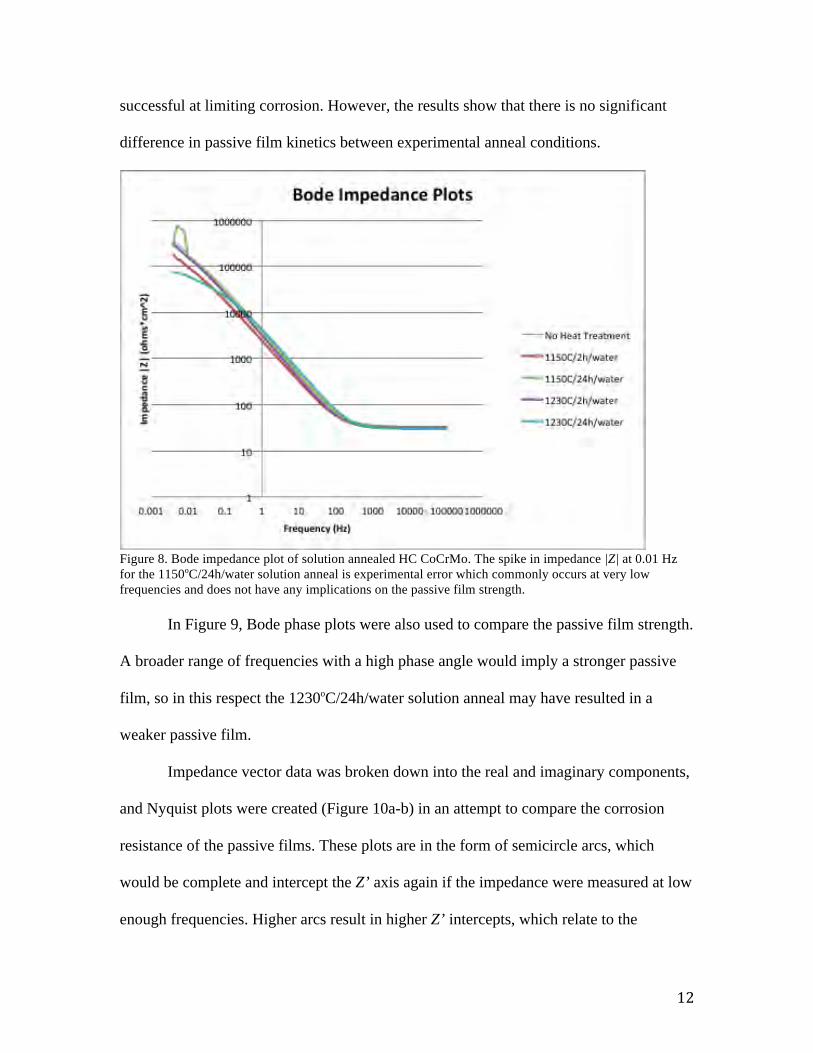
! ! #$!
successful at limiting corrosion. However, the results show that there is no significant
difference in passive film kinetics between experimental anneal conditions.
Figure 8. Bode impedance plot of solution annealed HC CoCrMo. The spike in impedance |Z| at 0.01 Hz for the 1150oC/24h/water solution anneal is experimental error which commonly occurs at very low frequencies and does not have any implications on the passive film strength. In Figure 9, Bode phase plots were also used to compare the passive film strength.
A broader range of frequencies with a high phase angle would imply a stronger passive
film, so in this respect the 1230oC/24h/water solution anneal may have resulted in a
weaker passive film.
Impedance vector data was broken down into the real and imaginary components,
and Nyquist plots were created (Figure 10a-b) in an attempt to compare the corrosion
resistance of the passive films. These plots are in the form of semicircle arcs, which
would be complete and intercept the Z’ axis again if the impedance were measured at low
enough frequencies. Higher arcs result in higher Z’ intercepts, which relate to the
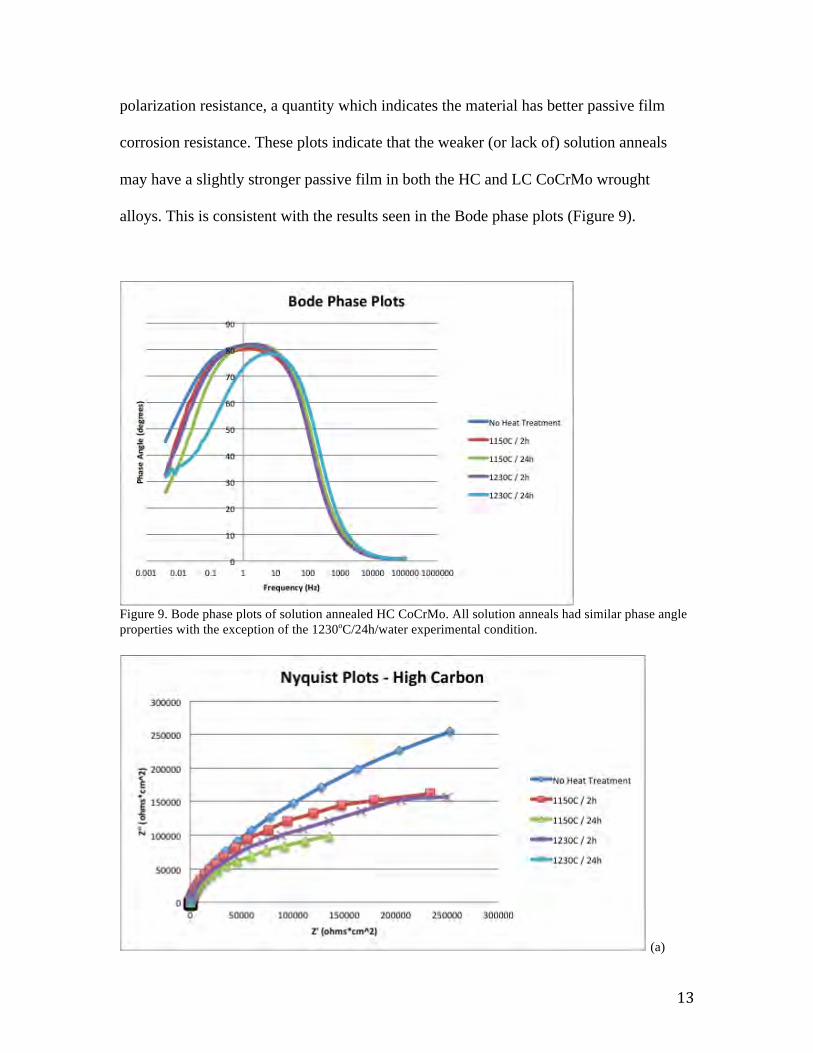
! ! #%!
polarization resistance, a quantity which indicates the material has better passive film
corrosion resistance. These plots indicate that the weaker (or lack of) solution anneals
may have a slightly stronger passive film in both the HC and LC CoCrMo wrought
alloys. This is consistent with the results seen in the Bode phase plots (Figure 9).
Figure 9. Bode phase plots of solution annealed HC CoCrMo. All solution anneals had similar phase angle properties with the exception of the 1230oC/24h/water experimental condition.
(a)

! ! #&!
(b) Figure 10. Nyquist plots of solution annealed (a) HC and (b) LC CoCrMo wrought alloy Finally, the impedance data was fitted to a Randall’s circuit. The solution
resistance Ru values for all samples were very similar, as was expected since the
electrochemical cell setups all used the same pH 7.4 buffered BCS. The polarization
resistance Rp was also similar across all experimental conditions as seen in Figure 11,
indicating the differences seen in the Bode phase plots and Nyquist plots may not be
statistically significant.
Figure 11. Polarization resistance Rp of fitted equivalent Randall’s circuit for solution annealed HC and LC CoCrMo wrought alloys.
! ! #'!
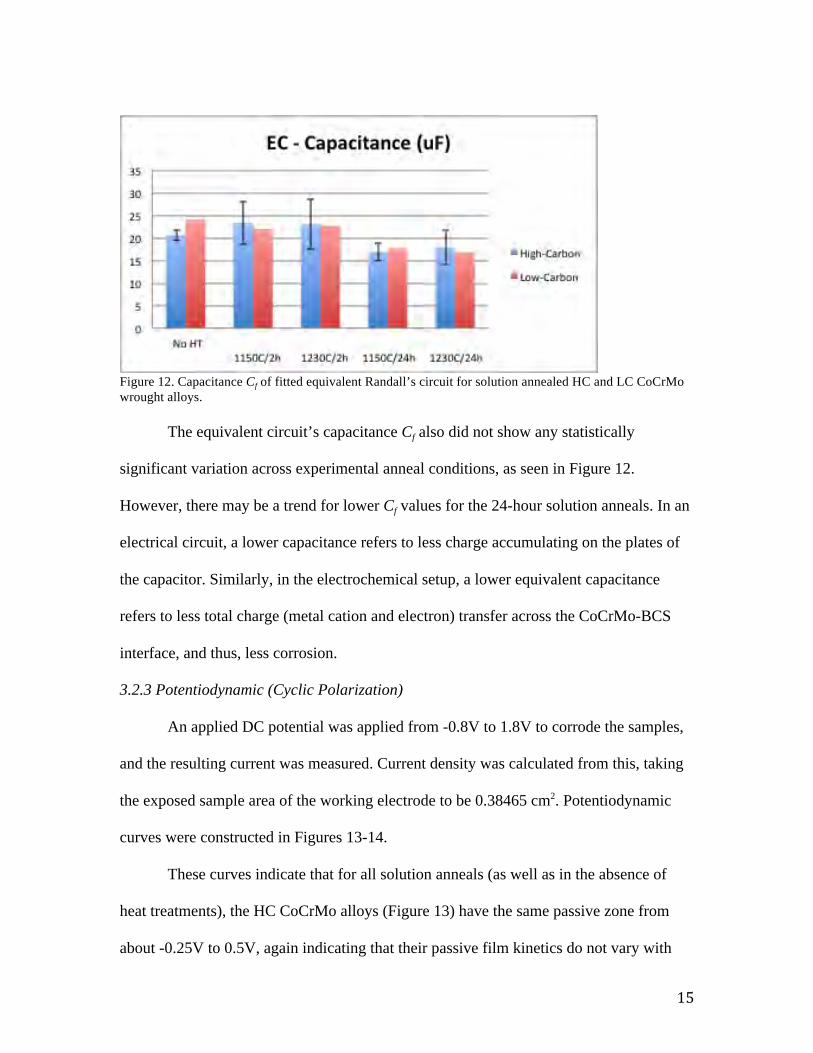
Figure 12. Capacitance Cf of fitted equivalent Randall’s circuit for solution annealed HC and LC CoCrMo wrought alloys. The equivalent circuit’s capacitance Cf also did not show any statistically
significant variation across experimental anneal conditions, as seen in Figure 12.
However, there may be a trend for lower Cf values for the 24-hour solution anneals. In an
electrical circuit, a lower capacitance refers to less charge accumulating on the plates of
the capacitor. Similarly, in the electrochemical setup, a lower equivalent capacitance
refers to less total charge (metal cation and electron) transfer across the CoCrMo-BCS
interface, and thus, less corrosion.
3.2.3 Potentiodynamic (Cyclic Polarization)
An applied DC potential was applied from -0.8V to 1.8V to corrode the samples,
and the resulting current was measured. Current density was calculated from this, taking
the exposed sample area of the working electrode to be 0.38465 cm2. Potentiodynamic
curves were constructed in Figures 13-14.
These curves indicate that for all solution anneals (as well as in the absence of
heat treatments), the HC CoCrMo alloys (Figure 13) have the same passive zone from
about -0.25V to 0.5V, again indicating that their passive film kinetics do not vary with
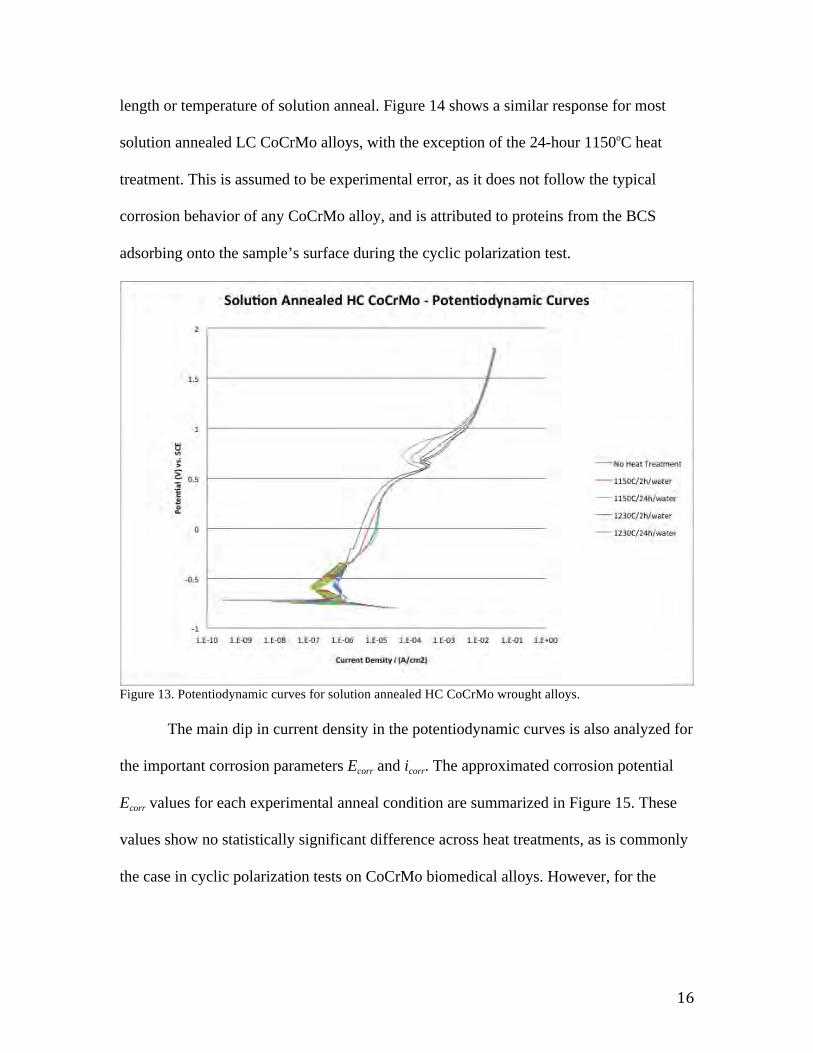
! ! #(!
length or temperature of solution anneal. Figure 14 shows a similar response for most
solution annealed LC CoCrMo alloys, with the exception of the 24-hour 1150oC heat
treatment. This is assumed to be experimental error, as it does not follow the typical
corrosion behavior of any CoCrMo alloy, and is attributed to proteins from the BCS
adsorbing onto the sample’s surface during the cyclic polarization test.
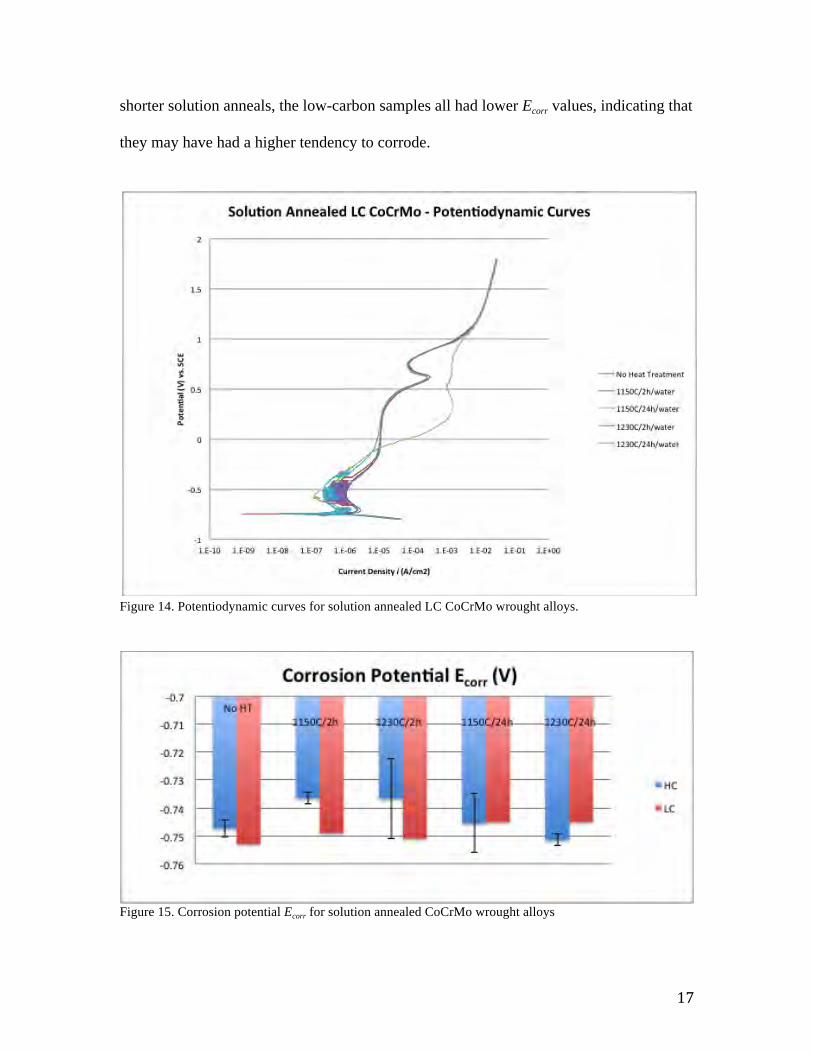
Figure 13. Potentiodynamic curves for solution annealed HC CoCrMo wrought alloys.
The main dip in current density in the potentiodynamic curves is also analyzed for
the important corrosion parameters Ecorr and icorr. The approximated corrosion potential
Ecorr values for each experimental anneal condition are summarized in Figure 15. These
values show no statistically significant difference across heat treatments, as is commonly
the case in cyclic polarization tests on CoCrMo biomedical alloys. However, for the
! ! #9!
shorter solution anneals, the low-carbon samples all had lower Ecorr values, indicating that
they may have had a higher tendency to corrode.
Figure 14. Potentiodynamic curves for solution annealed LC CoCrMo wrought alloys.
Figure 15. Corrosion potential Ecorr for solution annealed CoCrMo wrought alloys
! ! #:!
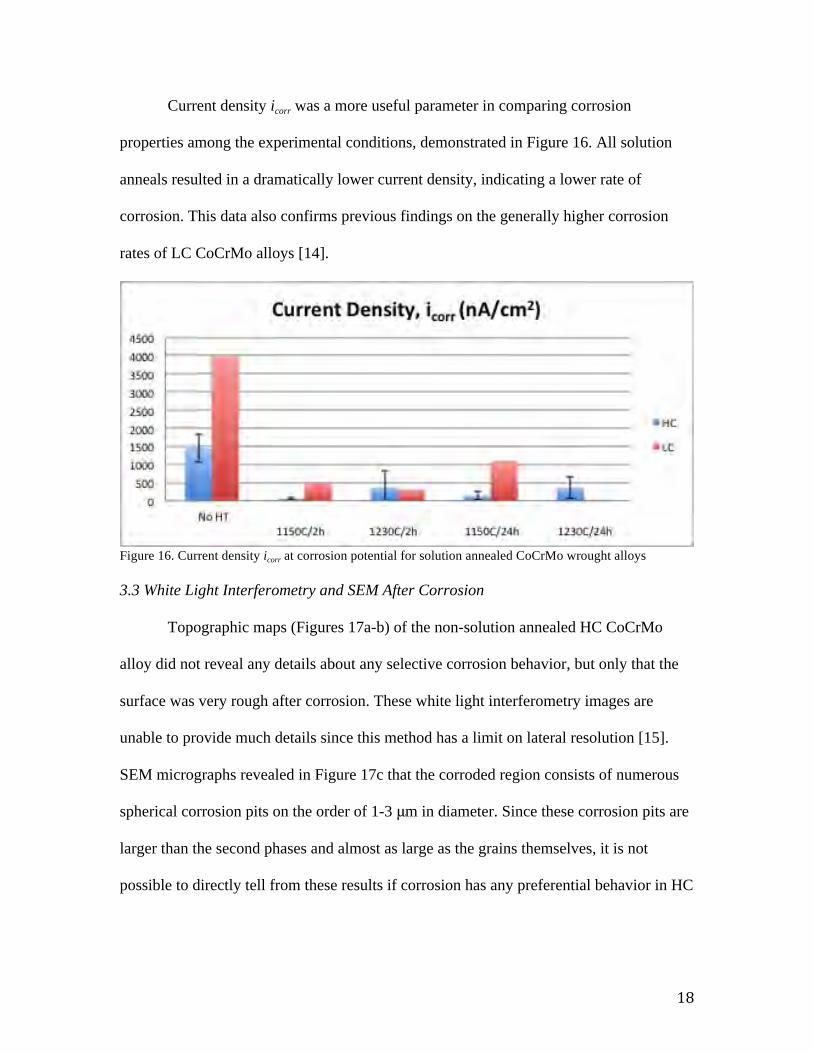
Current density icorr was a more useful parameter in comparing corrosion
properties among the experimental conditions, demonstrated in Figure 16. All solution
anneals resulted in a dramatically lower current density, indicating a lower rate of
corrosion. This data also confirms previous findings on the generally higher corrosion
rates of LC CoCrMo alloys [14].
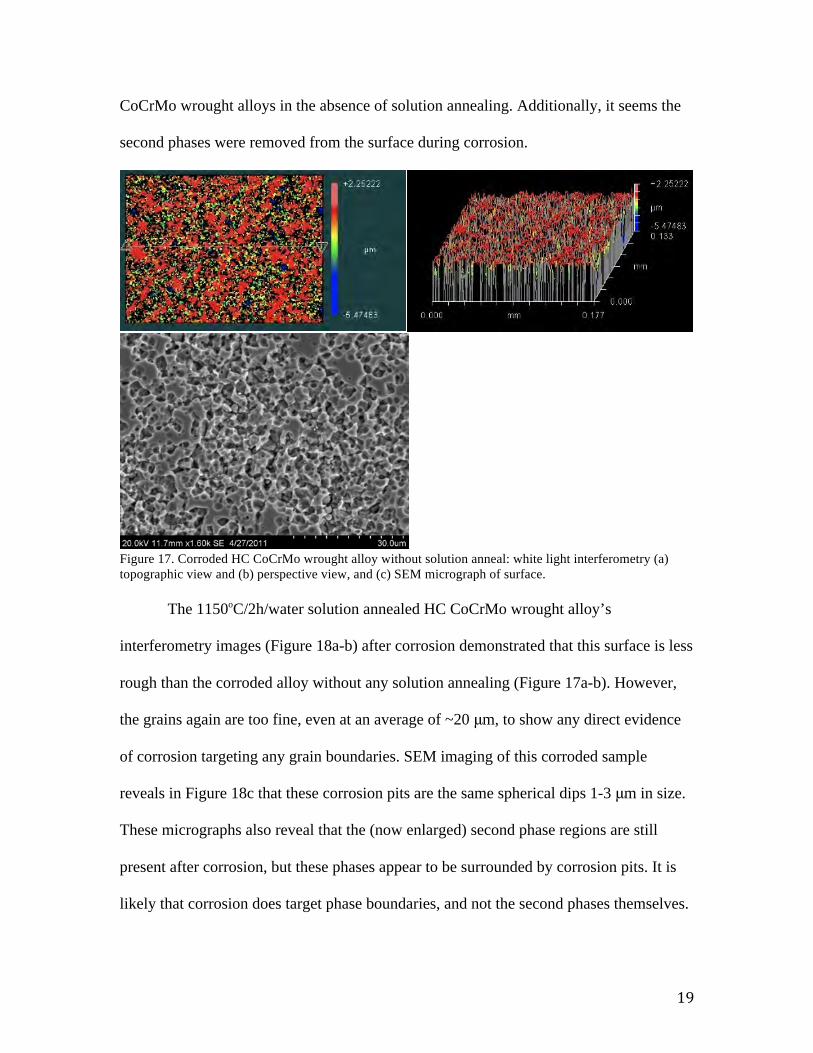
Figure 16. Current density icorr at corrosion potential for solution annealed CoCrMo wrought alloys 3.3 White Light Interferometry and SEM After Corrosion Topographic maps (Figures 17a-b) of the non-solution annealed HC CoCrMo
alloy did not reveal any details about any selective corrosion behavior, but only that the
surface was very rough after corrosion. These white light interferometry images are
unable to provide much details since this method has a limit on lateral resolution [15].
SEM micrographs revealed in Figure 17c that the corroded region consists of numerous
spherical corrosion pits on the order of 1-3 !m in diameter. Since these corrosion pits are
larger than the second phases and almost as large as the grains themselves, it is not
possible to directly tell from these results if corrosion has any preferential behavior in HC
! ! #;!
CoCrMo wrought alloys in the absence of solution annealing. Additionally, it seems the
second phases were removed from the surface during corrosion.
Figure 17. Corroded HC CoCrMo wrought alloy without solution anneal: white light interferometry (a) topographic view and (b) perspective view, and (c) SEM micrograph of surface. The 1150oC/2h/water solution annealed HC CoCrMo wrought alloy’s
interferometry images (Figure 18a-b) after corrosion demonstrated that this surface is less
rough than the corroded alloy without any solution annealing (Figure 17a-b). However,
the grains again are too fine, even at an average of ~20 !m, to show any direct evidence
of corrosion targeting any grain boundaries. SEM imaging of this corroded sample
reveals in Figure 18c that these corrosion pits are the same spherical dips 1-3 !m in size.
These micrographs also reveal that the (now enlarged) second phase regions are still
present after corrosion, but these phases appear to be surrounded by corrosion pits. It is
likely that corrosion does target phase boundaries, and not the second phases themselves.

! ! $<!
This is in contrast to Montero-Ocampo et al.’s conclusions that corrosion targeted the
second phases themselves [16].
Figure 18. Corroded HC CoCrMo wrought alloy after 1150oC/2h/water solution anneal: white light interferometry (a) topographic view and (b) perspective view, and (c) SEM micrograph of surface. Specifics of corrosion behavior were seen more easily in the 1150oC/24h/water
solution annealed HC CoCrMo alloy. The grains in this experimental condition were
large enough to be seen readily in an optical microscope, and white light interferometry
scans in Figures 19a-b show that there are both spherical corrosion pits within matrix
grains and preferential corrosion at some grain boundaries. Furthermore, SEM images of
the corroded surface (Figure 19c) demonstrate that some grain boundaries are corroded
very heavily and others not at all. Preferential grain boundary corrosion in HC CoCrMo
alloys has been documented previously [16], but there was no mention of some grain
boundaries corroding more than others. It is probable that the corrosion pits not at the
grain boundaries are at the phase boundaries of the second phase precipitates.
)*+,-.!/012*2!

! ! $#!
! !
!Figure 19. Corroded HC CoCrMo wrought alloy after 1150oC/24h/water solution anneal: white light interferometry (a) topographic view and (b) perspective view, and (c) SEM micrograph of surface. Similar corrosion behavior was seen in the corroded surfaces of the
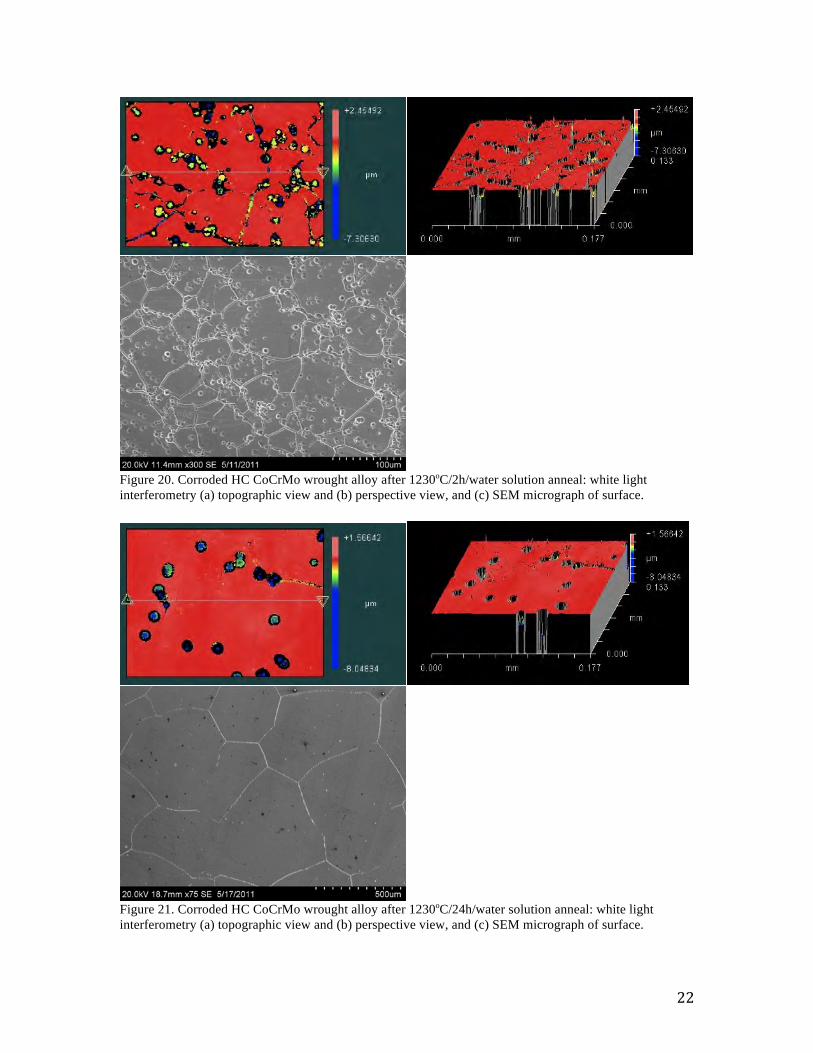
1230oC/2h/water solution annealed HC CoCrMo, shown in Figures 20a-c. Corrosion
specifically attacked some of the grain boundaries, as well as phase boundaries at the
second phases which resulted in corrosion pits within the matrix grains. More spherical
corrosion pits are seen near the grain boundaries in this solution anneal condition, which
corresponds to the lower degree of second phase dissolution for the 1230oC/2h/water heat
treatment (Figure 3a) than for the 1150oC/24h/water heat treatment (Figure 2b).
Samples annealed at 1230oC/24h/water corroded in a similar manner with some
grain boundaries selectively attacked (as seen in Figure 21c). Fewer corrosion pits were
present than for HC samples with any other solution anneal conditions (Figures 21a-c),
most likely due to the partial carbide and intermetallic dissolution seen after this heat
treatment.
=3*>*3*-?"1@@A!+,33,.*.!431"-!7,8-.13"*2!!!B31"-!7,8-.13"*2!6"?0!-,!/3*>*3*-?"1@!+,33,2",-!!!C,33,2",-!/"?2!6"?0"-!431"-2!
! ! $$!
Figure 20. Corroded HC CoCrMo wrought alloy after 1230oC/2h/water solution anneal: white light interferometry (a) topographic view and (b) perspective view, and (c) SEM micrograph of surface.
Figure 21. Corroded HC CoCrMo wrought alloy after 1230oC/24h/water solution anneal: white light interferometry (a) topographic view and (b) perspective view, and (c) SEM micrograph of surface.
! ! $%!
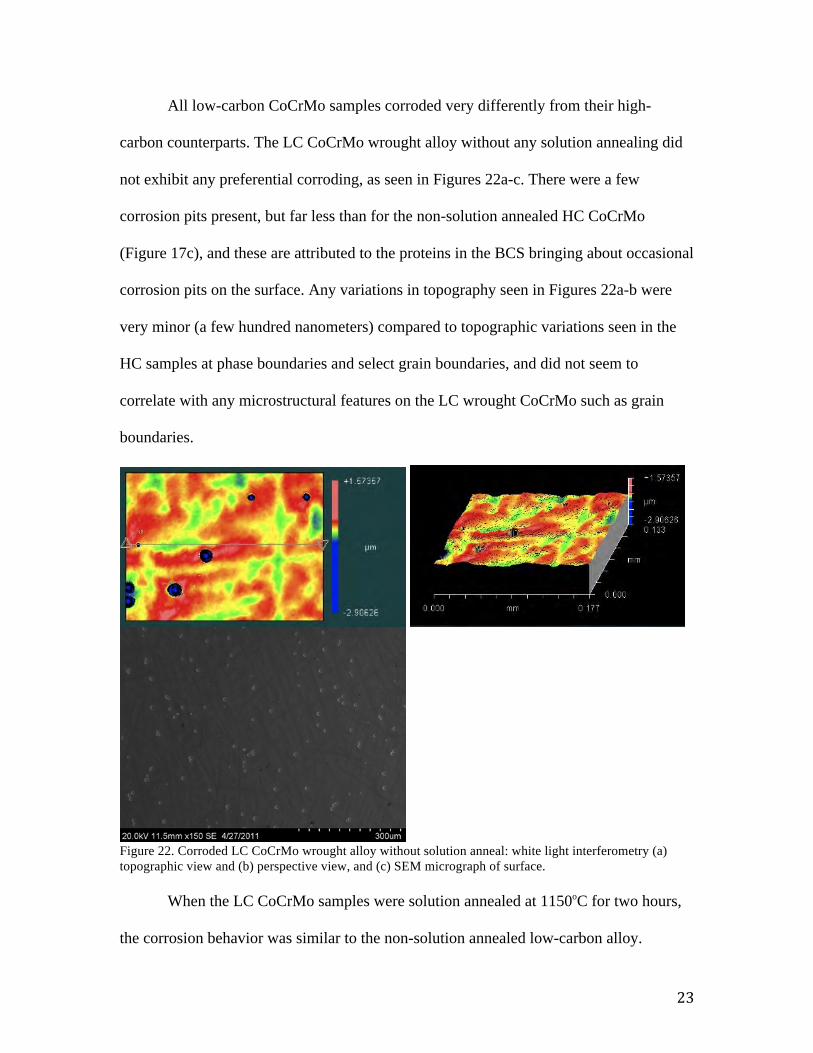
All low-carbon CoCrMo samples corroded very differently from their high-
carbon counterparts. The LC CoCrMo wrought alloy without any solution annealing did
not exhibit any preferential corroding, as seen in Figures 22a-c. There were a few
corrosion pits present, but far less than for the non-solution annealed HC CoCrMo
(Figure 17c), and these are attributed to the proteins in the BCS bringing about occasional
corrosion pits on the surface. Any variations in topography seen in Figures 22a-b were
very minor (a few hundred nanometers) compared to topographic variations seen in the
HC samples at phase boundaries and select grain boundaries, and did not seem to
correlate with any microstructural features on the LC wrought CoCrMo such as grain
boundaries.
! !
Figure 22. Corroded LC CoCrMo wrought alloy without solution anneal: white light interferometry (a) topographic view and (b) perspective view, and (c) SEM micrograph of surface. When the LC CoCrMo samples were solution annealed at 1150oC for two hours,
the corrosion behavior was similar to the non-solution annealed low-carbon alloy.
! ! $&!
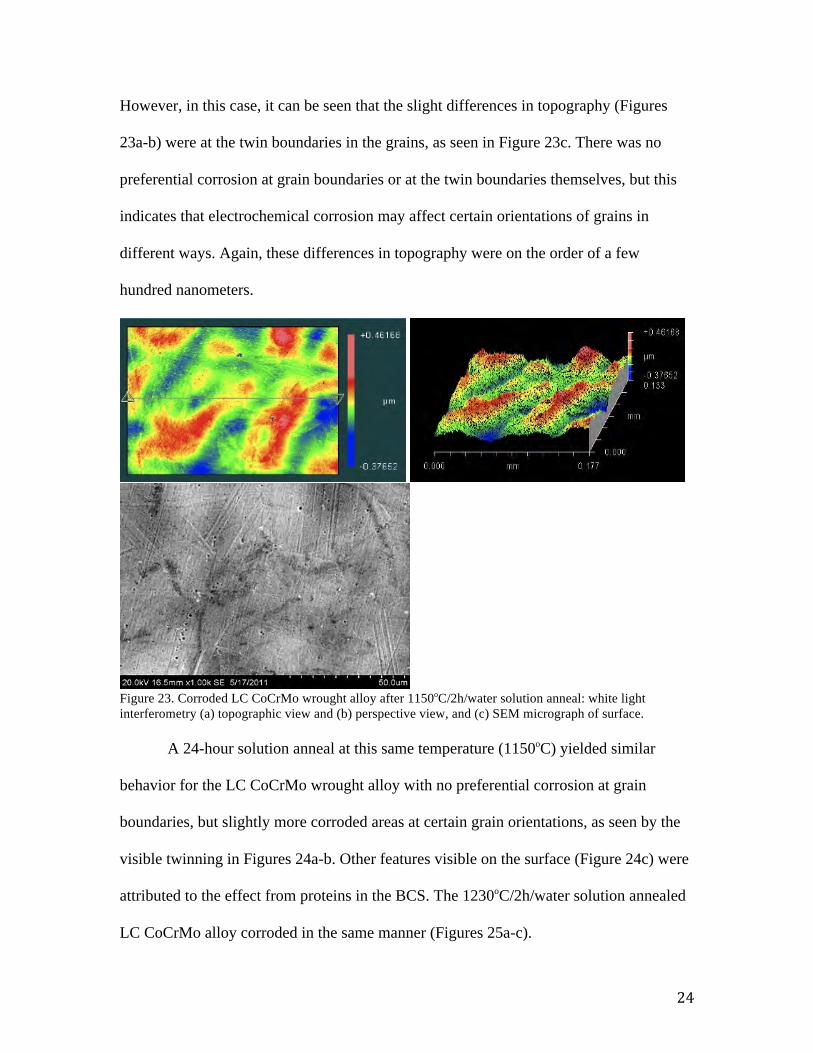
However, in this case, it can be seen that the slight differences in topography (Figures
23a-b) were at the twin boundaries in the grains, as seen in Figure 23c. There was no
preferential corrosion at grain boundaries or at the twin boundaries themselves, but this
indicates that electrochemical corrosion may affect certain orientations of grains in
different ways. Again, these differences in topography were on the order of a few
hundred nanometers.
! !
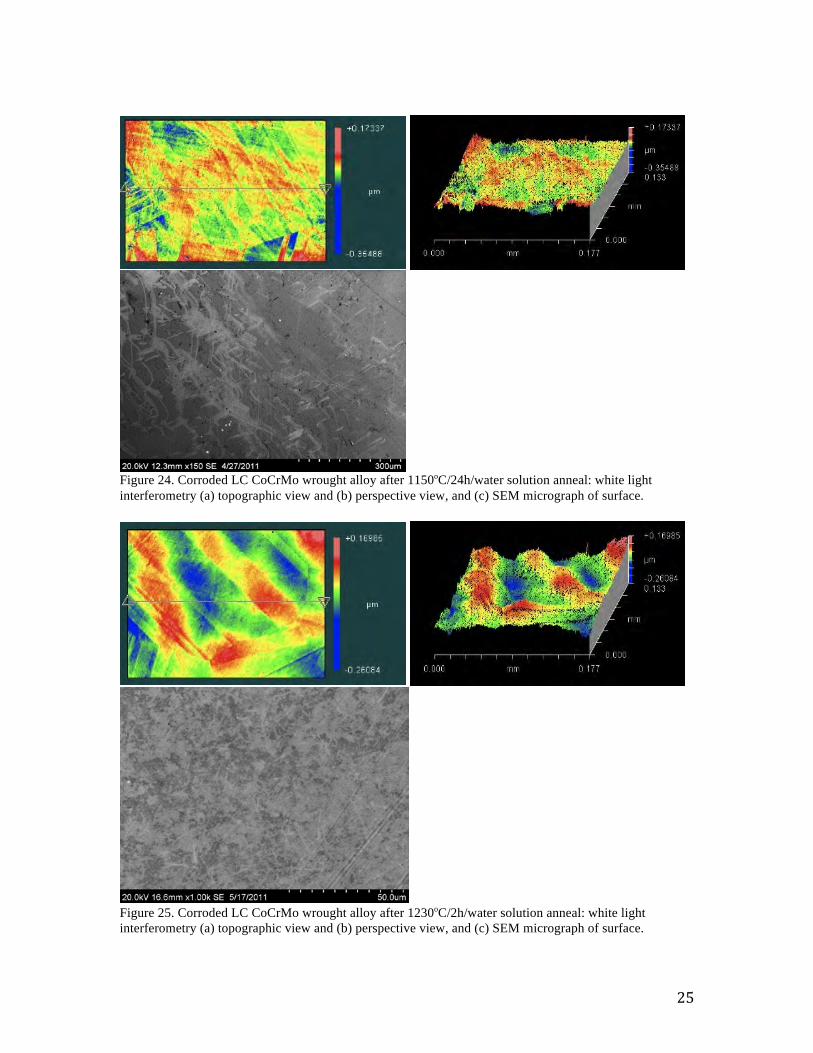
!Figure 23. Corroded LC CoCrMo wrought alloy after 1150oC/2h/water solution anneal: white light interferometry (a) topographic view and (b) perspective view, and (c) SEM micrograph of surface. A 24-hour solution anneal at this same temperature (1150oC) yielded similar
behavior for the LC CoCrMo wrought alloy with no preferential corrosion at grain
boundaries, but slightly more corroded areas at certain grain orientations, as seen by the
visible twinning in Figures 24a-b. Other features visible on the surface (Figure 24c) were
attributed to the effect from proteins in the BCS. The 1230oC/2h/water solution annealed
LC CoCrMo alloy corroded in the same manner (Figures 25a-c).
! ! $'!
! !
!Figure 24. Corroded LC CoCrMo wrought alloy after 1150oC/24h/water solution anneal: white light interferometry (a) topographic view and (b) perspective view, and (c) SEM micrograph of surface.
! !
Figure 25. Corroded LC CoCrMo wrought alloy after 1230oC/2h/water solution anneal: white light interferometry (a) topographic view and (b) perspective view, and (c) SEM micrograph of surface.
! ! $(!
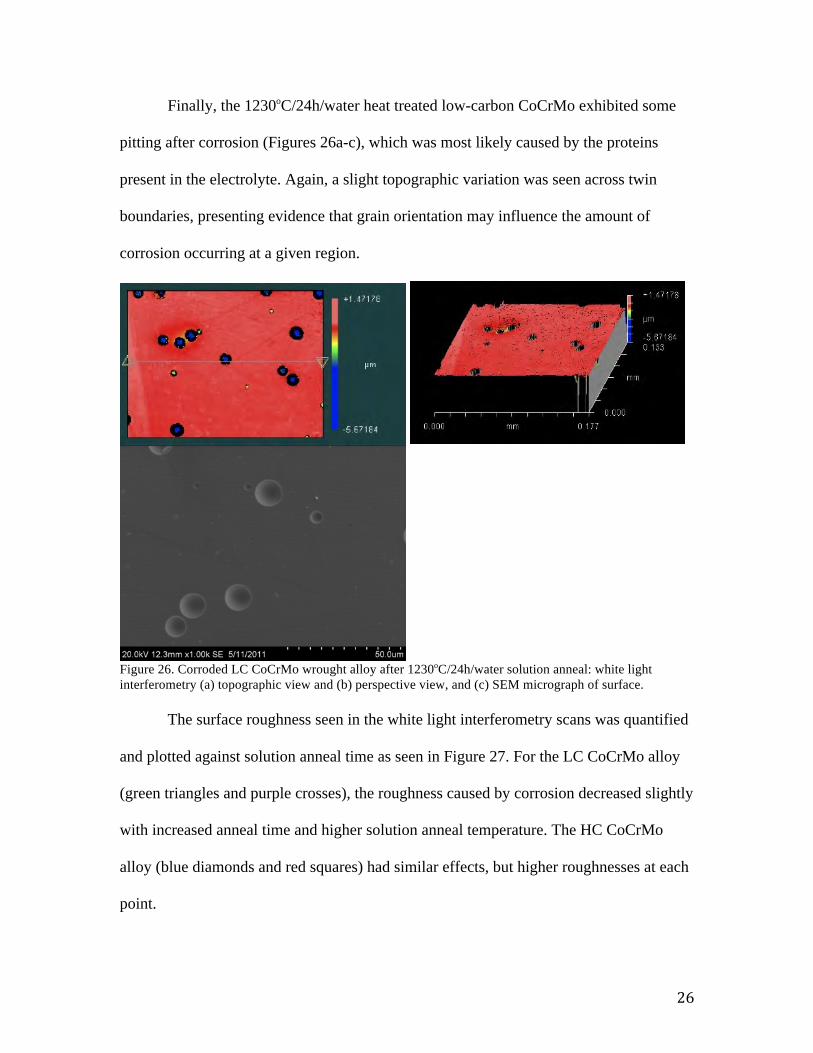
Finally, the 1230oC/24h/water heat treated low-carbon CoCrMo exhibited some
pitting after corrosion (Figures 26a-c), which was most likely caused by the proteins
present in the electrolyte. Again, a slight topographic variation was seen across twin
boundaries, presenting evidence that grain orientation may influence the amount of
corrosion occurring at a given region.
! !
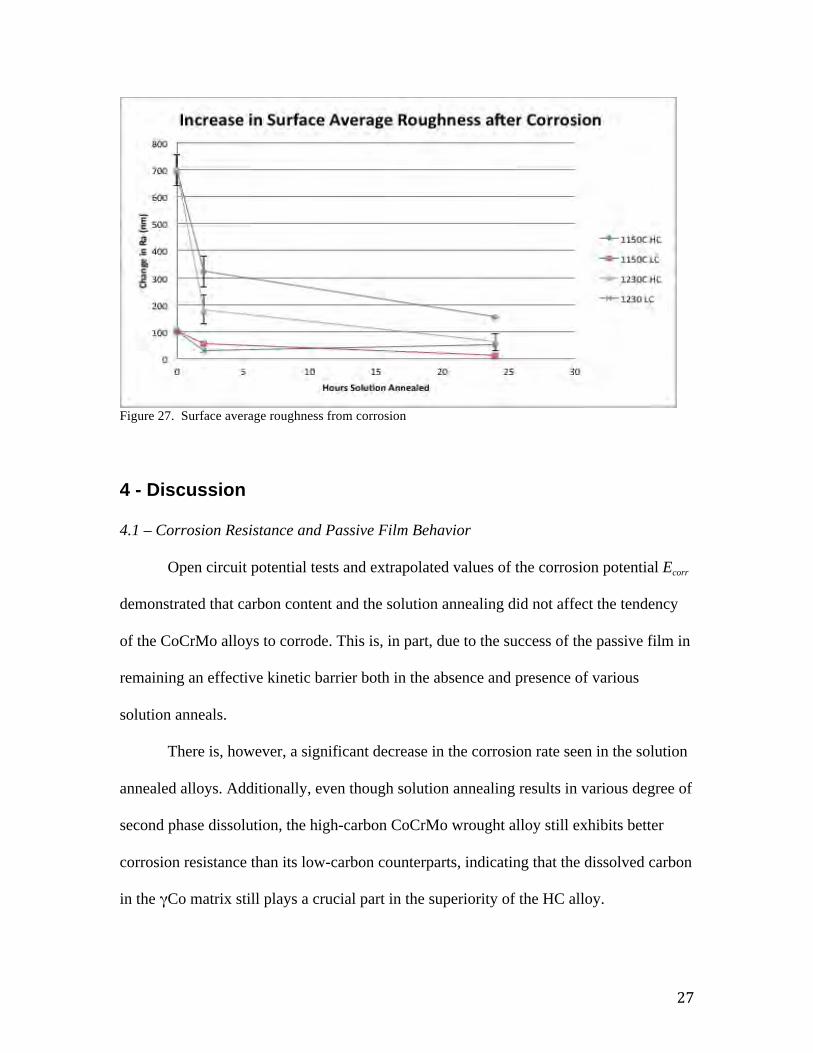
!Figure 26. Corroded LC CoCrMo wrought alloy after 1230oC/24h/water solution anneal: white light interferometry (a) topographic view and (b) perspective view, and (c) SEM micrograph of surface. The surface roughness seen in the white light interferometry scans was quantified
and plotted against solution anneal time as seen in Figure 27. For the LC CoCrMo alloy
(green triangles and purple crosses), the roughness caused by corrosion decreased slightly
with increased anneal time and higher solution anneal temperature. The HC CoCrMo
alloy (blue diamonds and red squares) had similar effects, but higher roughnesses at each
point.
! ! $9!
Figure 27. Surface average roughness from corrosion 4 - Discussion
4.1 – Corrosion Resistance and Passive Film Behavior
Open circuit potential tests and extrapolated values of the corrosion potential Ecorr
demonstrated that carbon content and the solution annealing did not affect the tendency
of the CoCrMo alloys to corrode. This is, in part, due to the success of the passive film in
remaining an effective kinetic barrier both in the absence and presence of various
solution anneals.
There is, however, a significant decrease in the corrosion rate seen in the solution
annealed alloys. Additionally, even though solution annealing results in various degree of
second phase dissolution, the high-carbon CoCrMo wrought alloy still exhibits better
corrosion resistance than its low-carbon counterparts, indicating that the dissolved carbon
in the "Co matrix still plays a crucial part in the superiority of the HC alloy.
! ! $:!
4.2 - Preferential Corrosion
The high-carbon alloys exhibited preferential corrosion at phase boundaries and at
matrix grain boundaries. This may explain the reduced corrosion rates for solution
annealed HC CoCrMo, since once the corrosion pits begin to form, the surface is
unpassivated, removing the main kinetic barrier for corrosion. Montero-Ocampo et al.
also observed preferential grain boundary corrosion in HC cast CoCrMo alloy, but did
not observe any grain boundaries which were not preferentially corroded [16]. This study
highlights the phase boundary corrosion seen next to the carbide and intermetallic phases,
as well as the lack of targeted corrosion at certain grain boundaries.
Multiple authors reported Cr-segregation at phase and grain boundaries of
CoCrMo alloys [17, 18], and this chromium depletion may explain the preferential
corrosion seen at the phase boundaries. However, this is not the main mechanism
explaining the preferential corrosion at the grain boundaries of the HC CoCrMo.
Chromium depletion at grain boundaries has been observed in both high-carbon and low-
carbon CoCrMo [18], and preferential grain boundary corrosion was only seen in the
high-carbon alloys. Additionally, all grain boundaries exhibit chromium segregation, and
not all grain boundaries experienced preferential corrosion.
Therefore, it is more likely that grain boundary corrosion depends on the relative
orientations of the adjacent grains. The mild variation in corrosive attack seen in the low-
carbon alloys at twinned regions suggests that corrosion is sensitive to the
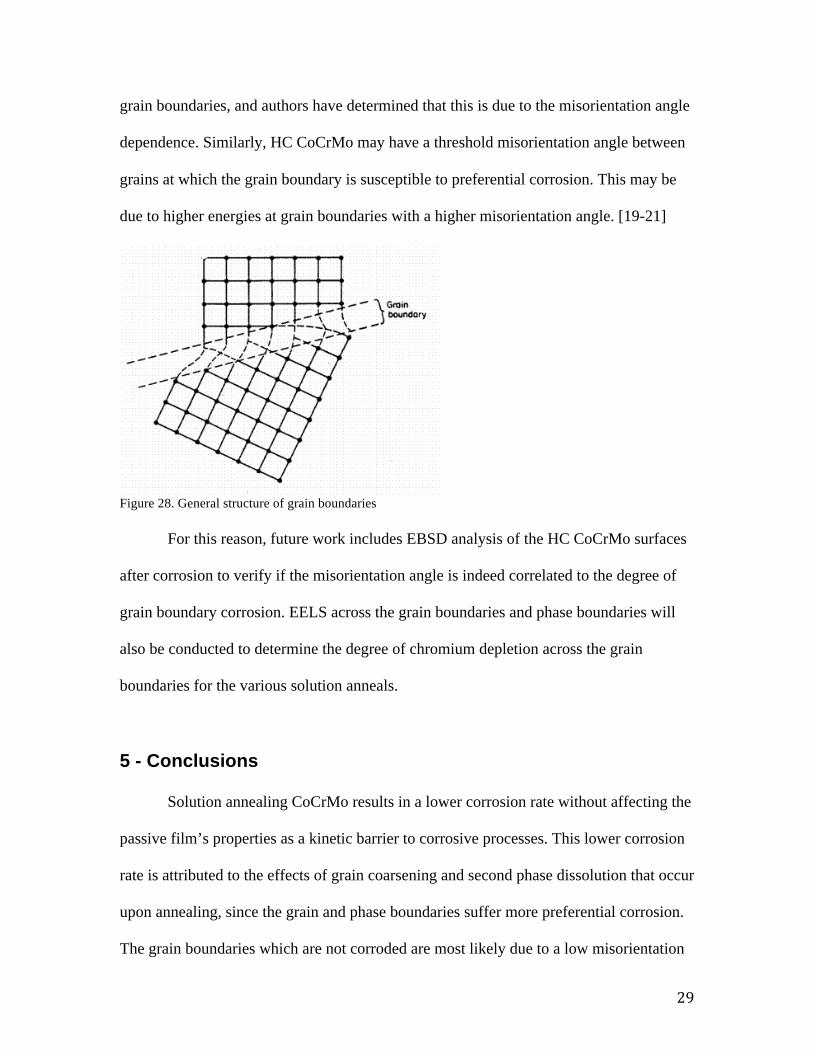
crystallographic orientation. Grain boundaries themselves are a separate phase and are
essentially a distorted section of the lattice, a few unit cells across as seen in Figure 28. In
other metallic materials, preferential inter-grain corrosion was also observed at some
! ! $;!
grain boundaries, and authors have determined that this is due to the misorientation angle
dependence. Similarly, HC CoCrMo may have a threshold misorientation angle between
grains at which the grain boundary is susceptible to preferential corrosion. This may be
due to higher energies at grain boundaries with a higher misorientation angle. [19-21]
Figure 28. General structure of grain boundaries For this reason, future work includes EBSD analysis of the HC CoCrMo surfaces
after corrosion to verify if the misorientation angle is indeed correlated to the degree of
grain boundary corrosion. EELS across the grain boundaries and phase boundaries will
also be conducted to determine the degree of chromium depletion across the grain
boundaries for the various solution anneals.
5 - Conclusions
Solution annealing CoCrMo results in a lower corrosion rate without affecting the
passive film’s properties as a kinetic barrier to corrosive processes. This lower corrosion
rate is attributed to the effects of grain coarsening and second phase dissolution that occur
upon annealing, since the grain and phase boundaries suffer more preferential corrosion.
The grain boundaries which are not corroded are most likely due to a low misorientation
! ! %<!
angle between the adjacent grains. These findings suggest that HC CoCrMo with coarser
grains (and potentially even single-crystal CoCrMo) and dissolved second phases might
be a superior materials choice for medical implants, as these may better resist corrosion.
6 - Acknowledgements
I would like to thank Professor Laurence D. Marks for guidance and instruction in
the work leading up to and pertaining to this project, Dr. Yifeng Liao for timely and
helpful assistance on the scope of this project and beyond, and all the L. D. Marks group
members for their advice and encouragement. I would also like to thank Dr. Markus
Wimmer and Dr. Alfons Fischer of Rush University for permission to use the tribology
lab and equipment, Dr. Mathew T. Mathew for teaching me everything about corrosion,
and Christopher Nagelli for training on electrochemical testing.
This work made use of the Electron Probe Instrumentation Center (EPIC), the
OMM Facility supported by the MRSEC program of the National Science Foundation
(DMR-0520513) at the Materials Research Center of Northwestern University, and the
Tribology lab at the Rush University Orthopedics Center.
References
[1] S. Pramanik, A. K. Agarwal, and K. N. Rai, "Chronology of Total Hip Joint Replacement and Materials Development," Trends in Biomaterials and Artificial Organs, vol. 19, pp. 15-26, 2005.
[2] N. J. Hallab, R. M. Urban, and J. J. Jacobs. Biomaterials in Orthopedics. [3] M. M. Mikhael, A. D. Hanssen, and R. J. Sierra, "Failure of Metal-on-Metal Total
Hip Arthroplasty Mimicking Hip Infection. A Report of Two Cases," The Journal of Bone and Joint Surgery, vol. 91, pp. 443-446, 2009.
[4] N. Hallab, K. Merritt, and J. J. Jacobs, "Metal Sensitivity in Patients with Orthopaedic Implants," The Journal of Bone and Joint Surgery, vol. 83, 2001.
! ! %#!
[5] M. T. Mathew, C. V. Nagelli, M. J. Runa, R. Pourzal, A. Fischer, M. P. Laurent, J. J. Jacobs, and M. A. Wimmer, "Does the Tribolayer on a Metal-on-Metal (MoM) Hip Joint Exhibit Superior Corrosion Resistance?," Rush University Medical Center, Chicago, IL.
[6] M. Caudillo, M. Herrera-Trejo, M. R. Castro, E. Ramirez, C. R. Gonzalez, and J. I. Juarez, "On Carbide Dissolution in an As-Cast ASTM F-75 Alloy," Journal of Biomedical Materials Research, vol. 59, pp. 378-385, 2002.
[7] K. P. Gupta, "The Co-Cr-Mo (Cobalt-Chromium-Molybdenum) System," Journal of Phase Equilibria and Diffusion, vol. 26, pp. 87-92, 2005.
[8] Y. Liao, R. Pourzal, P. Stemmer, M. A. Wimmer, J. J. Jacobs, A. Fischer, and L. D. Marks, unpublished|.
[9] A. J. T. Clemow and B. L. Daniell, "Solution Treatment Behavior of Co-Cr-Mo Alloy," Journal of Biomedical Materials Research, vol. 13, pp. 265-279, 1979.
[10] T. Kilner, R. M. Pilliar, G. C. Weatherly, and C. Allibert, "Phase Identification and Incipient Melting in a Cast Co-Cr Surgical Implant Alloy," Journal of Biomedical Materials Research, vol. 16, pp. 63-79, 1982.
[11] "Standard Specification for Wrought Cobalt-28Chromium-6Molybdenum Alloys for Surgical Implants (UNS R31537, UNS R31538, and UNS R31539)," Designation F 1537-08, ed. West Conshohocken, PA: ASTM International, 2008.
[12] C. V. Vidal and A. I. Munoz, "Study of the adsorption process of bovine serum albumin on passivated surfaces of CoCrMo biomedical alloy," Electrochimica Acta, vol. 55, pp. 8445-8452, 2010.
[13] K. Rajan, "Thermodynamic Assessment of Heat Treatments for a Co-Cr-Mo Alloy," Journal of Materials Science, vol. 18, pp. 257-264, 1983.
[14] Y. Yan, A. Neville, D. Dowson, and S. Williams, "Tribocorrosion in Implants - Assessing High Carbon and Low Carbon Co-Cr-Mo Alloys by In Situ Electrochemical Measurements," Tribology International, vol. 39, pp. 1509-1517, 2006.
[15] R. T. Blunt, presented at the CS MANTECH Conference, Vancouver, British Columbia, Canada, 2006.
[16] C. Montero-Ocampo and E. L. Martinez, "Effect of Carbon Content on the Electrochemical Impedance of As-Cast CoCrMo," ECS Transactions, vol. 19, p. 37, 2009.
[17] Y. Sato, N. Nomura, S. Fukinuma, and A. Chiba, "Microstructure and Mechanical Properties of Hot-Pressed Co-Cr-Mo Alloy Compacts," Advanced Materials Research, vol. 26-28, pp. 769-772, 2007.
[18] B. Valcu and H. N. Bertram, "Effect of Cr concentration gradient on the intergranular exchange in CoCr(Ta,Pt) thin films," Journal of Applied Physics, vol. 91, pp. 764-771, 2002.
[19] L. H. Chan, H. Weiland, S. Cheong, G. S. Rohrer, and A. D. Rollett, unpublished|. [20] X. R. Qian, Y. T. Chou, and E. A. Kamenetzky, "The structure dependence of
grain boundary corrosion in niobium bicrystals," Journal of the Less Common Metals, vol. 134, pp. 179-185, 1987.
[21] Y. Yuan and A. J. Davenport, "Crystallographic effects in intergranular corrosion of an Al-Mg alloy," S. o. M. a. M. The University of Birmingham, Ed., ed. Adgbaston, Birmingham, UK, 2005!!

! ! %$!


![Design and fabrication of CoCrMo alloy based novel structures8].pdf · Design and fabrication of CoCrMo alloy based novel structures for load bearing implants using laser engineered](https://static.fdocuments.net/doc/165x107/5f0bf3837e708231d4330686/design-and-fabrication-of-cocrmo-alloy-based-novel-8pdf-design-and-fabrication.jpg)
