
Correlational designs - Personality Project€¢ This is an example of a simple correlational...
69
Correlational designs Issues of Reliability,Validity, and Causality
Transcript of Correlational designs - Personality Project€¢ This is an example of a simple correlational...

Correlational designs
Issues of Reliability, Validity, and Causality

Alternative Explanatory Variables
• A developmental psychologist has noticed that children with bigger feet tend to have greater vocabularies than children with smaller feet?
• This is an example of a simple correlational design. Can you think of a powerful alternative explanation?

Types of data and correlational designs
• Varieties of data– Direct
• Self report of personality/attitudes/values• Peer/supervisor/subordinate ratings of performance• Ability scales
– Indirect• Implicit measures (e.g., of attitude)• Unobtrusive measures
– Historical, archival

Theory and Theory Testing I:Theory
Construct 1 Construct 2

Theory and Theory Testing II:Experimental manipulation
Construct 1
Manipulation 1
Construct 2
Observation 1
rmo
rc1c2
Fm

Theory and Theory Testing III:Correlational inference
Construct 1
Observation 1
Construct 2
Observation 2
?
rmo
?

Theory and Theory Testing IV:Correlational inference
Construct 1
Observation 1
Construct 2
Observation 2
?
rmo
?
Construct X

Theory and Theory Testing V:Alternative Explanations
Construct 1
Observation 1
Construct 2
Observation 2
?

Theory and Theory Testing VI:Eliminate Alternative Explanations
Construct 1
Observation 1
Construct 2
Observation 2
?

Steps in correlational inference
• Estimate the reliability of the variables– Magnitude of correlation is influenced by the
reliability of the correlation– Varieties of reliability
• Estimate the construct validity of the measures– Convergent, Discriminant, Incremental validity
• Consider alternative explananatory variables

Classic Reliability Theory: How well do we measure what ever we are measuring
X1
X2
X3
L1

Classic Reliability Theory: How well do we measure what ever we are measuring and what is the relationships between latent variables
X1 L1 Y1L2
rxy
pxy
pxl1 pyl2e1 e2
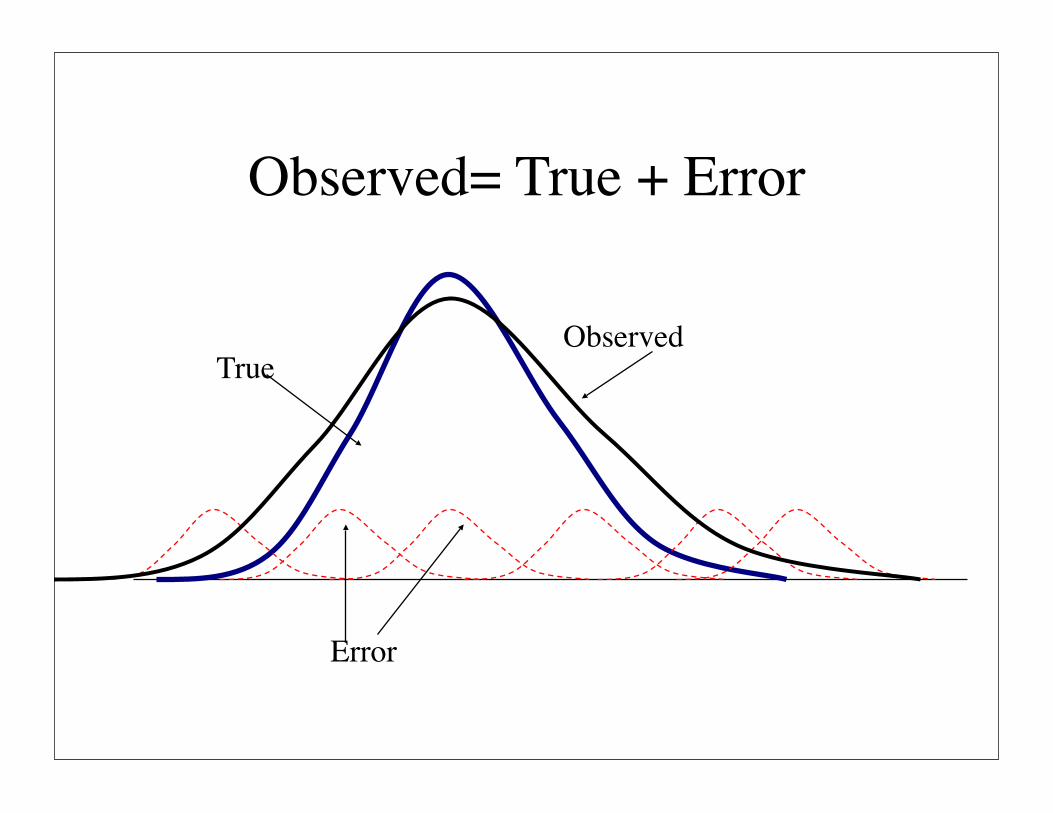
Observed= True + Error
ObservedTrue
Error

Observed= True + Error
ObservedTrue
Error

Estimating true score:regression artifacts
• Consider the effect of reward and punishment upon pilot training:– From 100 pilots, reward the top 50 flyers,
punish the worst 50.– Observation: praise does not work, blame does!– Explanation?

Reliability of measurement(how well does an observation reflect the construct)
Construct 1
Observation 1 Observation 2
r12
rc1 rc2
r12 = rc1* rc2
Assume rc1= rc2 then rc1=sqrt(r12)
E1 E2
Observed Variance 1 = Variance C1 + Variance E1
r12 = Vc/Vx( Vx = Vc + Ve)

Reliability of measurement(how well does an observation reflect the construct)
Construct 1
Observation 1 Observation 2 Observation 3
r13
r12r23
rc1 rc2 rc3E1 E3E2

Domain Sampling theory
• Consider a domain (D) of k items relevant to a construct. (E.g., English vocabulary items, expressions of impulsivity). Let Di represent the number of items in D which the ith subject can pass (or endorse in the keyed direction) given all D items. Call this the domain score for subject I. What is the correlation (across subjects) of scores on an item j with the domain scores?
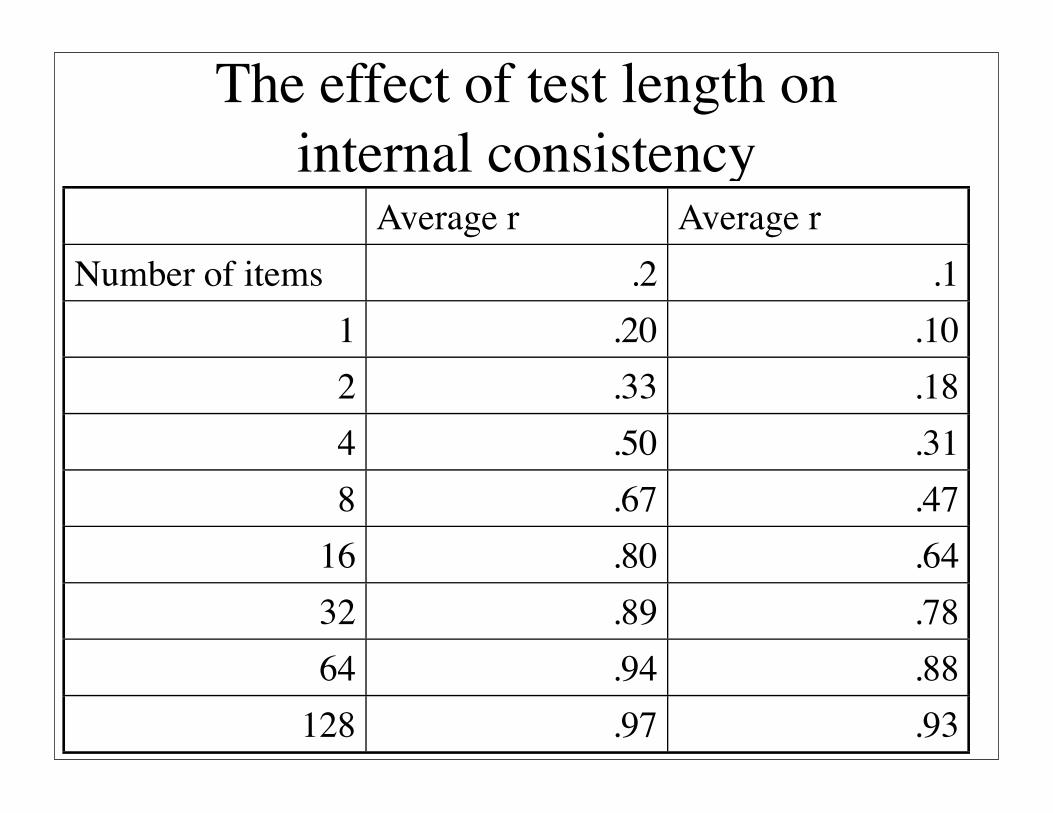
The effect of test length on internal consistency
Average r Average rNumber of items .2 .1
1 .20 .102 .33 .184 .50 .318 .67 .47
16 .80 .6432 .89 .7864 .94 .88
128 .97 .93

Find Alpha from correlations
q_262 q_1480 q_819 q_1180 1742
q_262 1 0.26 0.41 0.51 0.48q_1480 0.26 1 0.66 0.52 0.47
q_819 0.41 0.66 1 0.41 0.65q_1180 0.51 0.52 0.41 1 0.49q_1742 0.48 0.47 0.65 0.49 1

Alpha from correlations
• Total variance = sum of all item correlations– = 14.74570
• total covariances = Vt - ∑item variance – = 9.74570
• average covariance = – (Vt - ∑item variance)/(nvar *(nvar-1)) = .66
• alpha = ((Vt - ∑item variance)/Vt)*(nvar *(nvar-1))– = alpha = .83

Facets of reliability
Across items Domain samplingInternal consistency
Across time Temporal stability
Across forms Alternate form reliability
Across raters Inter-rater agreement
Across situations Situational stability
Across “tests” (facets unspecified)
Parallel test reliability

Types of reliability
• Items in a test of positive affect correlate .3 with other items of positive affect given at the same time.
• An ability test given in 5th grade correlates .6 with an ability test given in college.
• Baseball batting averages correlate .35 from year to year.

Reliability- Correction for attenuation
X1
X2
Y1
Y2
Tx Ty
rxy
rxx ryy
rho
rxtxryty
rxtx= sqrt(rxx) ryty= sqrt(ryy)
Rho = rxy/sqrt(rxx*ryy)

Effect of preschool• A team of educational psychologists examined the effect
of early reading in preschool upon later academic attainment. They randomly selected 20 preschools in Evanston and gave a measure of reading skill to 200 children (mean = 5.0, sd =1.0). They followed the progress of the top 50 students (mean score = 6 ) for a year. At the end of the year they compared their sample students to the mean and found the group was no different from the average. They concluded that preschool hurt these students.

Effect of preschool• A team of educational psychologists examined
the effect of early reading in preschool upon later academic attainment. They randomly selected 20 preschools in Evanston and gave a measure of reading skill to 200 children (mean = 5.0, sd =1.0). They followed the progress of the bottom 50 students (mean score = 4 ) for a year. At the end of the year they compared their sample students to the mean and found the group was no different from the average. They concluded that preschool helped these students. 26

Classic reliability - limitationAll of the conventional approaches are
concerned with generalizing about individual differences (in response to an item, time, form, rater, or situation) between people. Thus, the emphasis is upon consistency of rank orders. Classical reliability is a function of large between subject variability and small within subject variability. It is unable to estimate the within subject precision for a single person.

The New Psychometrics- Item Response Theory
• Classical theory estimates the correlation of item responses (and sums of items responses, i.e., tests) with domains.
• Classical theory treats items as random replicates but ignores the specific difficulty of the item, nor attempts to estimate the probability of endorsing (passing) a particular item

Item Response Theory
• Consider the person’s value on an attribute dimension (θi).
• Consider an item as having a difficulty δj
• Then the probability of endorsing (passing) an item j for person i= f(θi, δj)
• p(correct | θi, δj) = f(θi, δj)• What is an appropriate function?• Should reflect δj- θi and yet be bounded 0,1.

Item Response Theory
• p(correct | θi, δj) = f(θi, δj) = f(δj- θi )• Two logical functions:
– Cumulative normal (see, e.g., Thurstonian scaling)
– Logistic = 1/(1+exp(δj- θi )) (the Rasch model)– Logistic with weight of 1.7
• 1/(1+exp(1.7*(δj- θi ))) approximates cumulative normal

Logistic and cumulative normal
-3
/Users/Bill
-2 -1 0 1 2 3
0.0
0.2
0.4
0.6
0.8
1.0
latent variable
ob
se
rve
d p
rob
ab
ility

Item difficulty and ability
• Consider the probability of endorsing an item for different levels of ability and for items of different difficulty.
• Easy items (δj = -1)• Moderate items (δj= 0)
• Difficulty items (δj= 1)

IRT of three item difficulties
-3
/Users/Bill
-2 -1 0 1 2 3
0.0
0.2
0.4
0.6
0.8
1.0
latent variable
ob
se
rve
d p
rob
ab
ility
difficulteasy moderate

item difficulties = -2, -1, 0 , 1, 2
-3 -2 -1 0 1 2 3
0.0
0.2
0.4
0.6
0.8
1.0
latent variable
ob
se
rve
d p
rob
ab
ility
difficulteasy moderatevery easy
/Users/Bill/Users/Bill
very hard

Estimation of ability for a particular person for known item difficulty
• The probability of any pattern of responses (x1, x2, x3, …. Xn) is the product of the probabilities of each response ∏(p(xi)).
• Consider the odds ratio of a response– p/(1-p) = 1/(1+exp(1.7*(δj- θi ))) /(1- 1/(1+exp(1.7*(δj- θi )))) =– p/(1-p) = exp(1.7*(δj- θi ))) and therefore:– Ln(odds) = 1.7* (δj- θi ) and– Ln (odds of a pattern ) = 1.7∑ (δj- θi ) for known
difficulty

Unknown difficulty
• Initial estimate of ability for each subject (based upon total score)
• Initial estimate of difficulty for each item (based upon percent passing)
• Iterative solution to estimate ability and difficulty (with at least one item difficulty fixed.

Classical versus the “new”
• Ability estimates are logistic transform of total score and are thus highly correlated with total scores, so why bother?
• IRT allows for more efficient testing, because items can be tailored to the subject.
• Maximally informative items have p(passing given ability and difficulty) of .5
• With tailored tests, each person can be given items of difficulty appropriate for them.

Computerized adaptive testing
• CAT allows for equal precision at all levels of ability
• CAT/IRT allows for individual confidence intervals for individuals
• Can have more precision at specific cut points (people close to the passing grade for an exam can be measured more precisely than those far (above or below) the passing point.

Psychological (non-psychometric) problems with CAT
• CAT items have difficulty level tailored to individual so that each person passes about 50% of the items.
• This increases the subjective feeling of failure and interacts with test anxiety
• Anxious people quit after failing and try harder after success -- their pattern on CAT is to do progressively worse as test progresses (Gershon, 199x, in preparation)

Generalizations of IRT to 2 and 3 item parameters
• Item difficulty • Item discrimination (roughly equivalent to
correlation of item with total score)• Guessing (a problem with multiple choice tests) • 2 and 3 parameter models are harder to get
consistent estimates and results do not necessarily have monotonic relationship with total score

-3 -2 -1 0 1 2 3
0.0
0.2
0.4
0.6
0.8
1.0
/Users/Bill
latent variable
ob
se
rve
d p
rob
ab
ility
3 parameter IRTslope, location, guessing

Item Response Theory
• Can be seen as a generalization of classical test theory, for it is possible to estimate the correlations between items given assumptions about the distribution of individuals taking the test
• Allows for expressing scores in terms of probability of passing rather than merely rank orders (or even standard scores). Thus, a 1 sigma difference between groups might be seen as more or less important when we know how this reflects chances of success on an item
• Emphasizes non-linear nature of response scores.

Varieties of Validity
• Face• Concurrent• Predictive• Construct
– Convergent– Discriminant

Face (Faith Validity)
• Representative content• Seeming relevance

Concurrent Validity
• Does a measure correlate with the criterion?• Need to define the criterion.• Assumes that what correlates now will have
predictive value.
X Y

Predictive Validity
• Does a measure correlate with the criterion?• Need to define the criterion.• Requires waiting for time to pass.
X Y
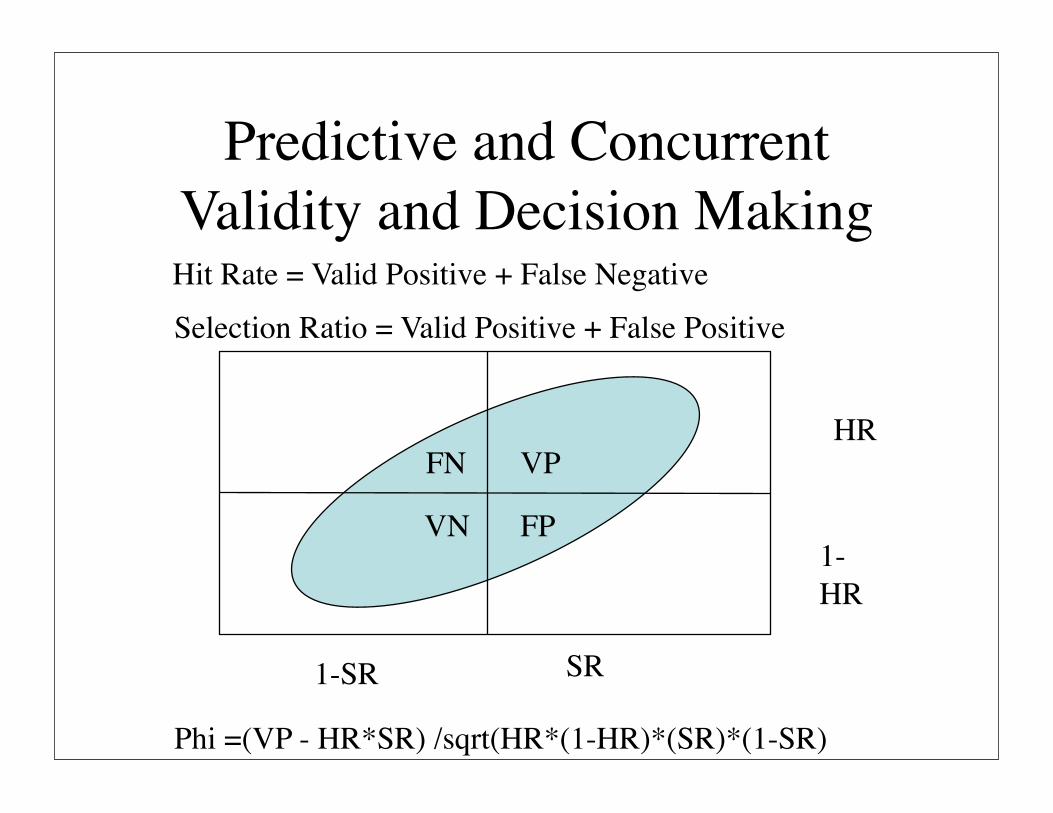
Predictive and Concurrent Validity and Decision Making
VP
FP
FN
VN
HR
1-HR
SR1-SR
Hit Rate = Valid Positive + False NegativeSelection Ratio = Valid Positive + False Positive
Phi =(VP - HR*SR) /sqrt(HR*(1-HR)*(SR)*(1-SR)

0
0.05
0.10
0.15
0.20
0.25
0.30
0.35
0.40
0.45
-4 -3.8 -3.6 -3.4 -3.2 -3 -2.8 -2.6 -2.4 -2.2 -2 -1.8 -1.6 -1.4 -1.2 -1 -0.8 -0.6 -0.4 -0.2 0 0.2 0.4 0.6 0.8 1 1.2 1.4 1.61.800000000000012.000000000000012.200000000000012.400000000000012.600000000000012.800000000000013.000000000000013.200000000000013.400000000000013.600000000000013.800000000000014.00000000000001
Validity as decision making
VP
FPFN
VN

Validity as decision making
0
0.05
0.10
0.15
0.20
0.25
0.30
0.35
0.40
0.45
-4 -3.75-3.5-3.25 -3 -2.75-2.5-2.25 -2 -1.75-1.5-1.25 -1 -0.75-0.5-0.25 0 0.25 0.5 0.75 1 1.25 1.5 1.75 2 2.25 2.5 2.75 3 3.25 3.5 3.75 4

Validity as decision making
0
0.05
0.10
0.15
0.20
0.25
0.30
0.35
0.40
0.45
-4 -3.75-3.5-3.25 -3 -2.75-2.5-2.25 -2 -1.75-1.5-1.25 -1 -0.75-0.5-0.25 0 0.25 0.5 0.75 1 1.25 1.5 1.75 2 2.25 2.5 2.75 3 3.25 3.5 3.75 4
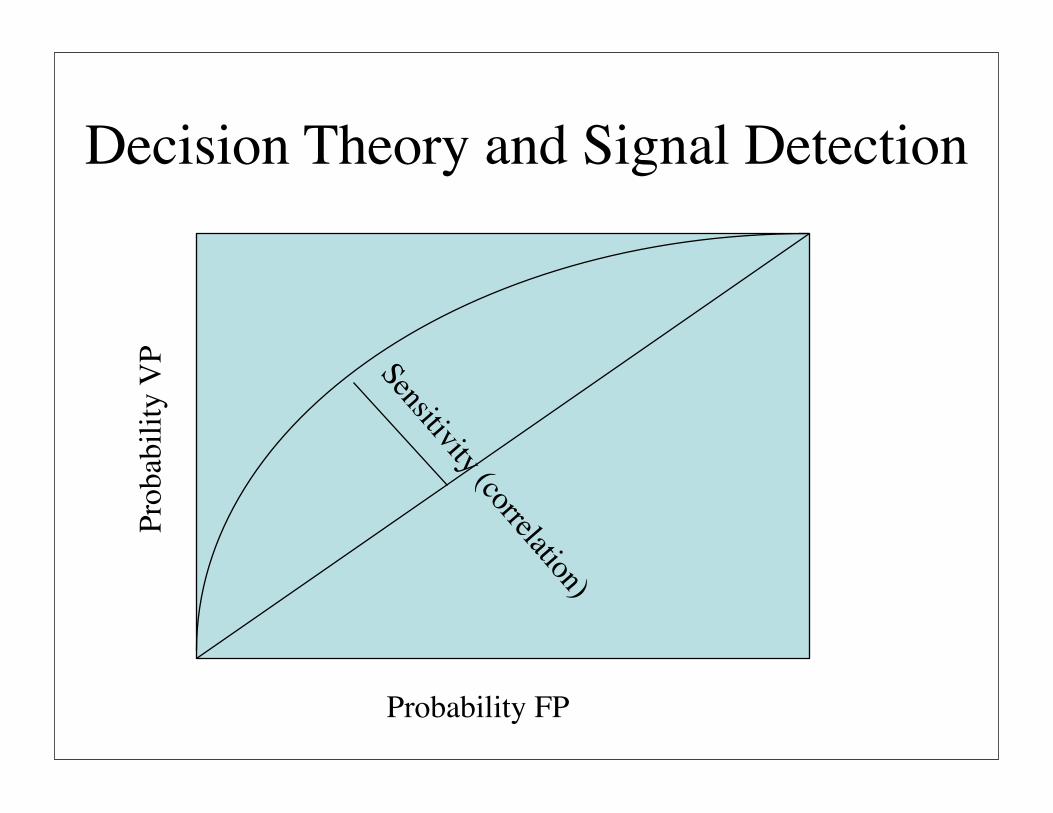
Decision Theory and Signal DetectionPr
obab
ility
VP
Probability FPSensitivity (correlation)

Construct Validity: Convergent, Discriminant, Incremental
X1
X2
X3Y1
Y2
Y3
L1
Y
X4
X5
X6
L2
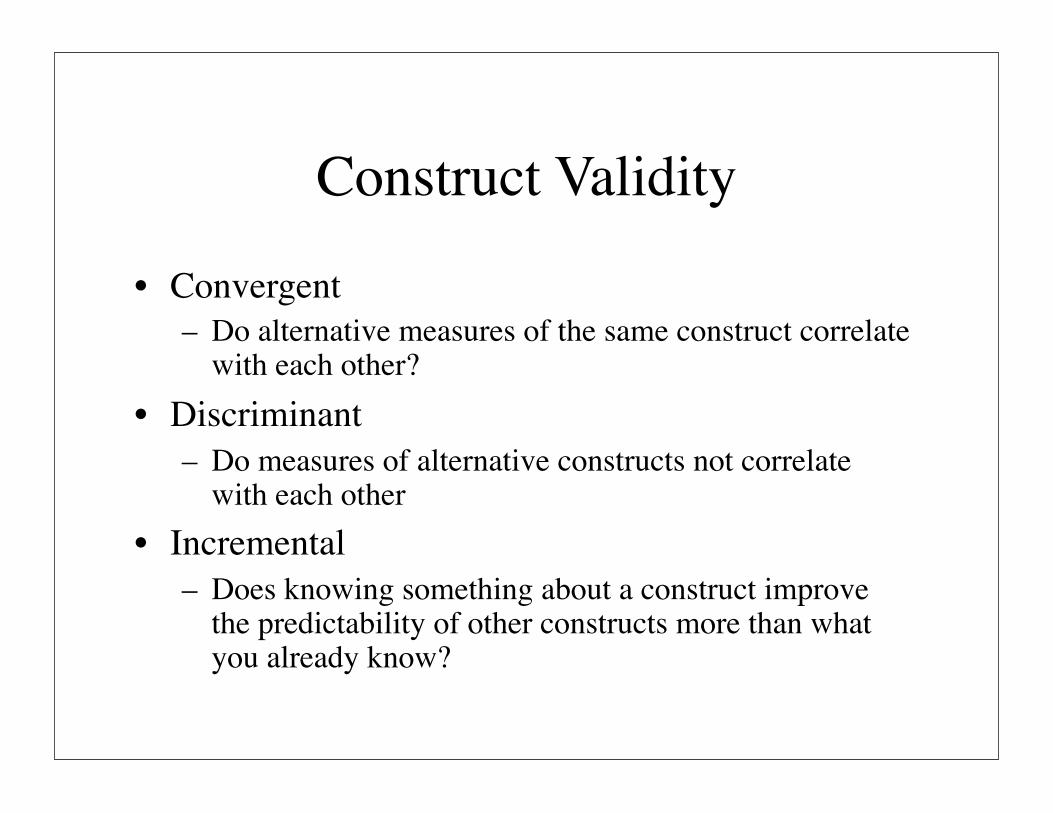
Construct Validity
• Convergent– Do alternative measures of the same construct correlate
with each other?• Discriminant
– Do measures of alternative constructs not correlate with each other
• Incremental– Does knowing something about a construct improve
the predictability of other constructs more than what you already know?

Alternative Explanatory Variables
• A developmental psychologist has noticed that children with bigger feet tend to have greater vocabularies than children with smaller feet?
• This is an example of a simple correlational design. Can you think of a powerful alternative explanation?

Theory and Theory Testing IV:Correlational inference
Construct 1Nutrition
Observation 1Shoe size
Construct 2Intellectual
Ability
Observation 2Vocabulary
?
rmo
?

Theory and Theory Testing IV:Correlational inference
Construct 1Nutrition
Observation 1Shoe size
Construct 2Intellectual
Ability
Observation 2Vocabulary
?
rmo
?
Construct XAge

Alternative Explanatory Variables
• A Social Psychologist did an archival investigation of the relationship between rum drinking and the salaries of ministers. He has found that as the amount paid in salaries to ministers increases, that the price of Puerto Rican rum increases. He interprets this as an example of the law of supply and demand. What other variables should be included?

Theory and Theory Testing IV:Correlational inference
Construct 1demand
Observation 1Salaries
Construct 2supply
Observation 2Rum price
?
rmo
?

Theory and Theory Testing IV:Correlational inference
Construct 1demand
Observation 1Salaries
Construct 2supply
Observation 2Rum price
?
rmo
?
Construct XGeneral inflation

Alternative Explanatory VariablesMany developmental psychopathologists claim that harsh parenting causes psychopathology in adulthood. A recent study reports evidence in favor of this hypothesis: Depressed college students report that their parents were much harsher in the way they treated them than do non-depressed students.
Consider alternative explanations

A correlational study:Depression and harsh parenting
ProbandParenting
style
Recollections of parenting style

A correlational study:Depression and harsh parenting
Proband
Sib
Parentingstyle
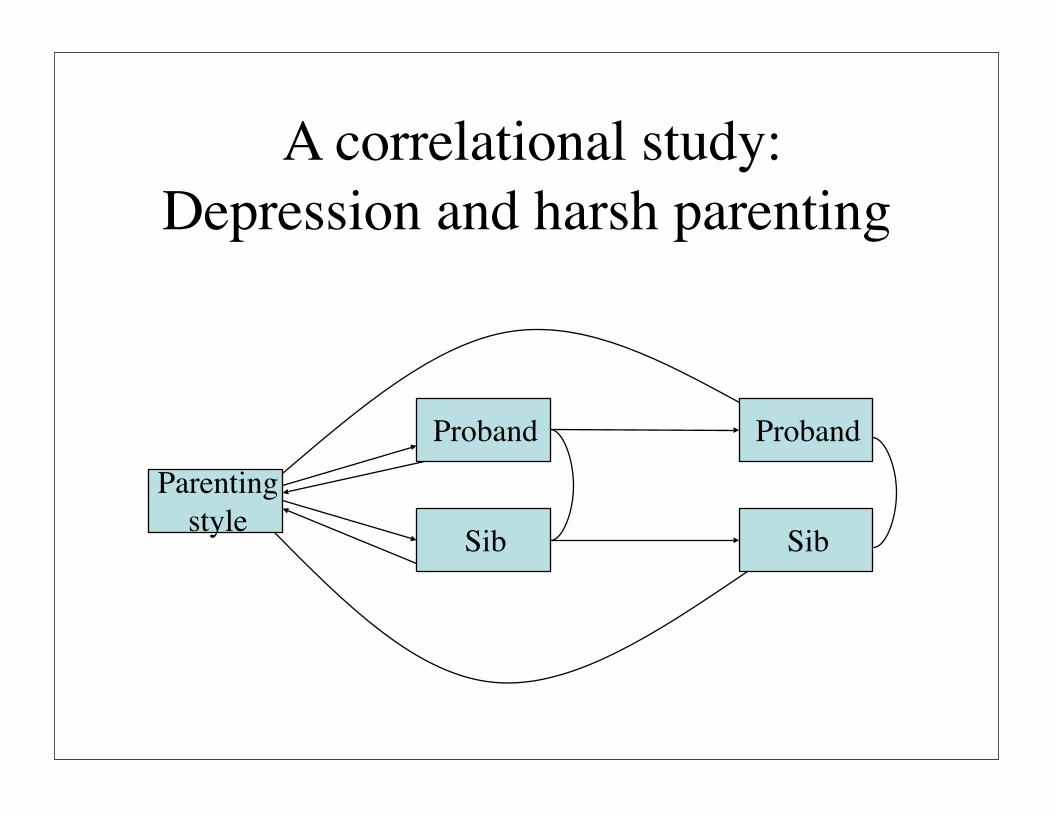
A correlational study:Depression and harsh parenting
Proband
Sib
Parentingstyle
Proband
Sib

A correlational study:Depression and harsh parenting
Proband
Sib
Parentingstyle
Proband
Sib
Genes
Note that Genes and family environment are confounded

A correlational study:Depression and harsh parenting
Proband
DZ twin
Parentingstyle
Proband
DZ twin
Genes
Note that Genes and family environment are confounded
MZ twinMZ twin

Typical Behavior Genetic Design
ECA
Sib 1
ECA
Sib 2
rg = 1,.5, 0 rc = 1,0
A = additive genetic varianceC = Common family environmentE = Unique environment
r s1,s2
a c e a c e
rg = 1 for MZ, .5 for DZrc = 1 for together, 0 apart

A correlational study:Depression and harsh parenting
Proband
BioSib
Parentingstyle
AdoptedSib
Proband
BioSib
AdoptedSib
Genes

A correlational study:Depression and harsh parenting
Proband
BioSib
Parentingstyle
BioSibapart
Proband
BioSib
BioSibapartGenes

Longitudinal environment/genetic study:
Proband
BioSib
Parentingstyle
AdoptedSib
BioSibapart
Proband
BioSib
AdoptedSib
BioSibapartGenes
NowChildhod


![Correlational Research - Article[1]](https://static.fdocuments.net/doc/165x107/577d2ba41a28ab4e1eaaf991/correlational-research-article1.jpg)