Problems Encountered in Three High-Pressure Sodium Highway Lighting Projects in Texas

TTI-2-5-7 4-10-1
TEXAS TRANSPORTATION INSTITUTE
TEXAS HIGHWAY DEPARTMENT
COOPERATIVE RESEARCH
CORRELATION OF THE TEXAS HIGHWAY DEPARTMENT
CONE PENETROMETER TEST WITH UNCONSOLIDATED-UNDRAINED SHEAR STRENGTH OF COHESIVE SOILS
RESEARCH REPORT 10-1
STUDY 2-5-74-10 THO CONE PENETROMETER TEST
II
in cooperation with the Department of Transportation Federal Highway Administration

TECHNICAL REPORT STANDARD TITLE PACf
1. Report No. 2. Government Accession No. 3. Recipient's Catalog No.
~-.~~~~------------~-----------------------+~~~~-----------------· 4. Title and Subtitle 5. Report Date
CORRELATION OF THE TEXAS HIGHWAY DEPARTMENT CONE PENE- AuQust, 1974 TROMETER TEST WITH UNCONSOLIDATED-UNDRAINED SHEAR 6. Performing Organization code
STRENGTH OF COHESIVE SOILS . '· Aumor• s1 8. Performing Organi zotion Report No.
Manaf M. Hamoudi, Harry M. Coyle, and Richard E. Barto-skewitz Research Report 10-1 9. Performing Organization Nome and Address 10. Work Unit No.
Texas Transportation Institute Texas A&M University 11. Contract or Grant No.
College Station, Texas 77843 Research Studv 2-5-7~-10 13. Type of Report ond Period Covered
~~----~---------~~--------------------------~ 12. Sponsoring 'Agency Name and Address September 1973 Interim -Texas Highway Department
11th and Brazos Austin, Texas 78701
15. Supplementary llfotu
August 1974
14. Sponsoring Agency Cod•
Research performed in cooperation with DOT, FHWA Research Study Title: 11 Corre1ation of the THO Cone Penetrometer Test N-Value with
Shear StrenQth of the Soil Tested ... 16. Abstract
Correlations were established between the Texas Highway Department Cone Penetrometer Test and the unconsolidated-undrained shear strength for cohesive soils. Both field and laboratory investigations were conducted to obtain the data necessary to establish the correlations. The field investigations included seven borings taken at four different sites where the Cone Penetrometer Test was conducted and undisturbed soil samples were obtained. The Texas Triaxial Test and the ASTM Triaxial ~exas were used in the laboratory investigation to obtain soil shear strength. Soils ~ere classified and grouped by the Unified Soil Classification System.
A reasonab1y good correlatton was established between the unconsolidated-undrain~d shear strength Cy-values and penetration resistance N-values, particularly for homo~eneous CHand s1lty Cl soils. Constants of proportionality between Cu and N, based pn a linear relationship, were obtained for these soil groups. A correlation was also established for CH soils with secondary structure and for sandy CL soils, but there was more scatter 1n the data for these groups. Equations were developed which relate the unconsolidated-undrained shear strength, Cu , to the Standard Penetration Test resistance value, NsPT' for homogeneous CH, ST silty CL, and sandy CL so1ls.
17, Key Words 18. Distribution Statement
THO Cone Penetrometer, UnconsolidatedUndrained Shear Strength, Texas Triaxial Test, ASTM Triaxi~l Test, Cohesive Soils.
19. Security Clauif. (of this report) 20. Security Claulf. (of this poge)
Unclassified Unclassified Form DOT F 1700.7 ce-at)
21- No. of Pages 22. Price
135


CORRELATION OF THE TEXAS HIGHWAY DEPARTMENT CONE PENETROMETER TEST
WITH UNCONSOLIDATED-UNDRAINED SHEAR STRENGTH OF COHESIVE SOILS
by
Manaf M. Hamoudi Research Assistant
Harry M. Coyle Research Engineer
and
Richard E. Bartoskewitz Engineering Research Associate
Research Report Number 1~-1
Correlation of the THD Cone Penetrometer Test N-Value with Shear Strength of the Soil Tested
Research Study Number 2-5-74-10
Sponsored by The Texas Highway Department
in Cooperation with the U.S. Department of Transporation Federal Highway Administration
August 1974
TEXAS TRANSPORTATION INSTITUTE Texas A&M University
College Station, Texas

DISCLAIMER
The contents of this report reflect the views of the authors who
are responsible for the facts and the accuracy of the data presented
herein. The contents do not necessarily reflect the official views or
policies of the Federal Highway Administration. This report does not
constitute a standard, specification, or regulation.
ii
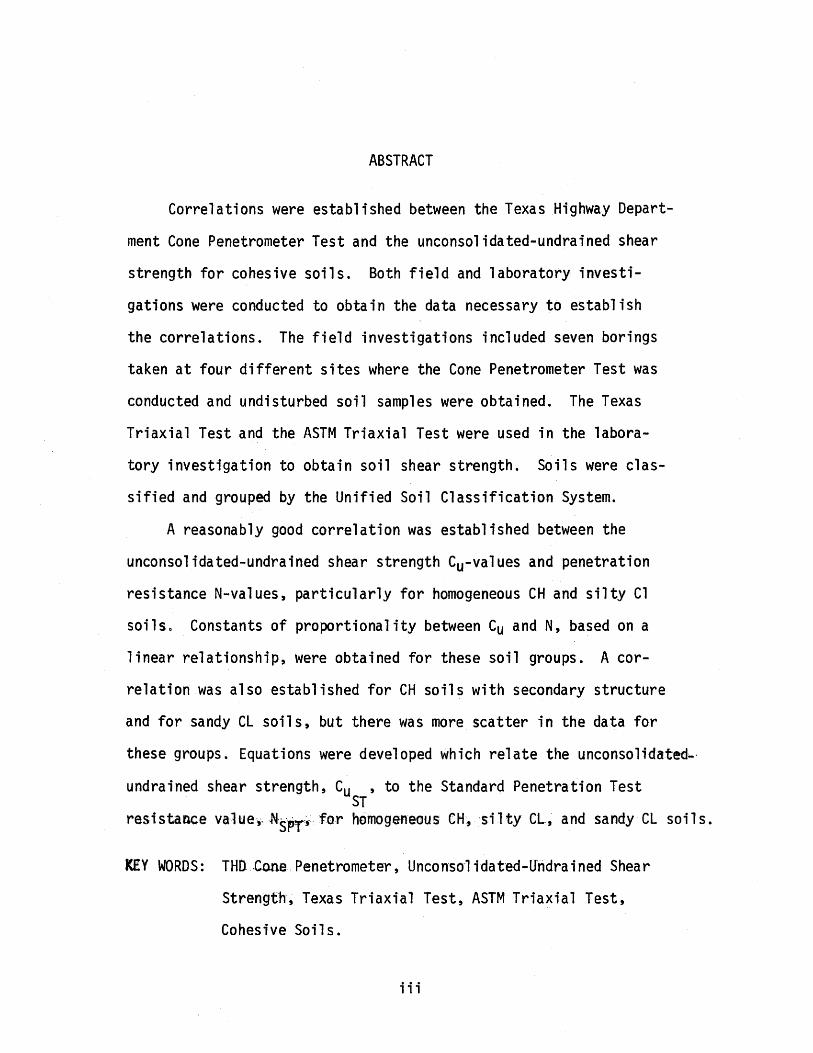
ABSTRACT
Correlations were established between the Texas Highway Depart
ment Cone Penetrometer Test and the unconsolidated-undrained shear
strength for cohesive soils. Both field and laboratory investi
gations were conducted to obtain the data necessary to establish
the correlations. The field investigations included seven borings
taken at four different sites where the Cone Penetrometer Test was
conducted and undisturbed soil samples were obtained. The Texas
Triaxial Test and the ASTM Triaxial Test were used in the labora-
tory investigation to obtain soil shear strength. Soils were clas
sified and grouped by the Unified Soil Classification System.
A reasonably good correlation was established between the
unconsolidated-undrained shear strength Cu-values and penetration
resistance N-values, particularly for homogeneous CH and silty Cl
soils. Constants of proportionality between Cu and N, based on a
linear relationship, were obtained for these soil groups. A cor
relation was also established for CH soils with secondary structure
and for sandy CL soils, but there was more scatter in the data for
these groups. Equations were developed which relate the unconsolidated-·
undrained shear strength, Cu , to the Standard Penetration Test ST
resistance value,. N~iPT'j,. far homogeneous CH, ·silty CL., and sandy CL soils.
KEY WORDS: THO .Cone. Penetrometer, Unconso·l ida ted-Undrained Shear
Strength, Texas Triaxial Test, ASTM Triaxial Test,
Cohesive Soils.
iii
SUMMARY
The information presented in this report was developed during
the first year of a three-year study on the determination of in-situ
soil shear strength by means of dynamic sub-surface sounding tests.
The objective of the research is to develop an improved correlation
between the THO Cone Penetrometer Test N-value and the shear strength
of different soil types including sand, silt, clay, and various
combinations thereof.
A brief historical background of penetrometer tests is presented
together with a description of the THO Cone Penetrometer Test method
and equipment. The geologic histories of test locations are su11n1arized
and underlying soil formations are described.
Field operational methods and procedures used to obtain THO
Cone Penetrometer Test data and undisturbed soil samples are described.
The laboratory test methods used to classify the soil and determine
its unconsolidated-undrained shear strength are discussed. The Texas
Triaxial test was the primary method used for determining shear
strength. ASTM Triaxial and THO Transmatic Triaxial tests were
conducted to determine the shear strength of selected samples.
The various factors affecting the magnitude of the THO Cone
Penetrometer Test N-value and the soil shear strength are analyzed.
The soil shear strength is correlated with the N-value for four
categories of fat and lean clay. Equations are developed which relate
the unconsolidated-undrained shear strength, CuST' to the Standard Penetration
Test resistance value, NSTP' for homogeneous CH, silty CL, and sandy CL soil.
iv
IMPLEMENTATION STATEMENT
Correlations between the THO cone penetrometer test N-value
and the unconsolidated-undrained soil shear strength are used to
predict the bearing capacity of drilled shaft and pile foundations
which support highway bridge superstructures. The data presented in
this report were obtained from testing soils commonly found along
the upper Texas gulf coast region. Correlations were obtained for
four soil types which are based primarily upon the Unified System
of soil classification, the secondary division being made according
to soil structure or grain size content. The information required
to classify the soil is obtained from standard laboratory tests. The
shear strength is determined by Texas Triaxial Test Method Tex-118-E.
Use of the correlations given herein will aid the design engineer
in selecting the most economical pile or shaft diameter and depth
of embedment.
It is recommended that implementation of the results be
limited to similar soils from the same regions and having similar geologic
origins and histories. Also, it should be borne in mind that data
of the nature being obtained in this study ar.e subject to statistical
variation, and the reliability of correlations achieved are directly
dependent on the amount of data obtained. Consequently, any study
findings which are implemented prior to completion of the study should
be considered tentative and subject to change at any time.
v

TABLE OF CONTENTS
INTRODUCTION. . . . . . . . . . . . . . • . • . .
Historical Background of Penetration Test Present Status of the Problem .. Objective. . ....
TEST SITES . . . . . . .
Test Site Locations. Test Site Geology ..
SOIL INVESTIGATIONS . . .
Field Investigation .... Laboratory Investigation .
SUMMARY OF TEST RESULTS ...
Page • 1
. • 1
. . 4 • . 7
• • • 8
. . 8 . 8
. . . 12
.12
.14
. . . . 24
Soil Conditions and Classifications. . ... 24 Groundwa:ter Observations ....•............ 35 Cone Penetrometer N-values and Soil Shear Strength .37
ANALYSIS OF TEST RESULTS .... ·44
Factors Affecting Resistance to Penetration. . . . . .44 Factors Affecting Soil Shear Strength .......... ·48 Correlation of Resistance to Penetration with Soil
Shear Strength. . . . . . . . . . .54
CONCLUSIONS AND RECOMMENDATIONS .
Conclusions .... . Recommendations .. .
APPENDIX I.--REFERENCES .
APPENDIX !I.--DEFINITIONS AND NOTATIONS .
APPENDIX III.--SUMMARY OF TEST DATA.
APPENDIX IV.--MOHR'S DIAGRAMS ....
vi
• Z4 -
. . . . 74 • • • 76
• • • • • • • 7·8
·81
·84
. . 113

LIST OF TABLES
Table Page
1 Summary of Soil Borings. . . . . . . . . . . . . 12
2 Type and Number of Triaxial Tests. . . . 16
3 Type of Test and Procedure . . . . . .23
4 Effect of Soils Stratification on N-value. . . . . . . .47
5 Homogeneous CH Soils . . . . . . . . 57
6 CH Soils with Secondary Structure. . . . . . .62
7 Silty CL Soils . . . . . .65
8 Sandy CL Soils . . . . . . . .68
9 Stratified CL Soils. . . . . . . . .70
10 SC Soils . . . . . . . . . . . . . 71
vii

LIST OF FIGURES
Figure
1 Details of THO Cone Penetrometer
2 Relationship Between Unconsolidated-Undrained Shear Strength an~ Resistance to Penetration
Page
. 3
of THO Cone Penetrometer· · .. · • • . 6
3 General Location of Test Sites . 9
4 Plated 3-Inch Push Barrel. . . • . • 15
5 Effective Overburden Pressure Versus Depth . . . 18
6 Diagrammatic Layout of the Texas Triaxial Test . . . 19
7 Diagrammatic Layout of the ASTM Triaxial Test ~ ·.• . 20
8 Diagrammatic Layout of the Transmatic Triaxial Compression Test . . . . • • • . • . . . . . . . . . . . 21
9 Log of Boring 1, Site A, State Highway 21 and Little Brazos River, Brazos County . . 25
10 Unified Classificaton of Site A. • . • • • • • • 27
11 Log of Boring 2, Site B, Interstate Highway 610 and HB&T Railroad, Houston, Texas. . . . . . . . 28
12 Unified Classification of Site B . . • . . . . . 30
13 Log of Boring 5, Site C, Brays Bayou at State Highway 288, Houston, Texas. . • . . 31
14 Unified Classification of Site C . . . . . . . . . 33
15 Log of Boring 6, Site D, Interstate Highway 45 At Nettleton Street, Houston, Texas. . . . . . . 34
16 Unified Classification of Site D . ~ . . . . . . . 36
17 Boring 1, Site A, Variations of Resistance to Penetration, N, and TAT Shear Strength with Depth. 38
viii

18 Boring 3, Site B, Variations of Resistance to Penetration, N, and TAT Shear Strength with Depth.
19 Boring 4, Site C, Variations of Resistance to Penetration, N, and TAT Shear Strength with Depth.
20 Boring 7, Site D, Variations of Resistance to
.39
.40
Penetration, N, and TAT Shear Strength with Depth •..... 41
21 Relationship Between Texas Triaxial and the ASTM Triaxial Shear Strength . . . . . . . . . . .
22 Correlation Between Unconsolidated-Undrained Shear Strength and Resistance to Penetration for
.53
Homogeneous CH Soils .................•.. 60
23 Correlation Between Unconsolidated-Undrained Shear Strength and Resistance to Penetration for CH Material with Secondary Structure ............ 64
24 Correlation Between Unconsolidated-Undrained Shear Strength and Resistance to Penetrati'on for CL {Silty) Soils ...............•..•... 66
25 Correlation Between Unconsolidated-Undrained Shear Strength and Resistance to Penetration for CL {Sandy Soils) . . . . . • . . . . . . . . • . ••. 69
26 Relationship Between Unconsolidated-Undrained Shear Strength and the Standard Penetration Test Resistance Value .................... 72
ix


INTRODUCTION
Historical Background of Penetration Tests.--The process of
obtaining the variation in penetration resistance of a soil along
vertical lines is known as sub-surface sounding. The tool used to
make the sounding is commonly known as a penetrometer. The use of
the penetrometer evolved from the need of acquiring data on sub
surface soils that were not obtainable by any other means.
For several generations engineers have made crude attempts to
determine the strength of· subsurface soils by driving or pushing
rods or pipes into the ground and recording the resistance to pene
tration. Today, the resistance to penetration is measured both
statically and dynamically.
The static penetration test is widely accepted and used in
Scandinavian and European countries. The method was originally de
veloped in France in 1846 (20)*. A Vicat-type needle one millimeter
(0.039 in.) in diameter, weighing one kg (2.20 lb) was used to esti
mate the cohesion of different types of clay soils at different
consistencies.
The dynamic penetration test has been in use as a sounding
test for the past half century or more in most countries. Around
*NU:rifbers in p~renthesf.S ~~efer to_-ttie.'~references fisted in Appendix I.
1

1920 dynamic penetration tests were initiated in the United States.
One of the most widely used procedures for measuring resistance to
penetration is the Standard Penetration Test (SPT). According to
Desai (6), the penetrometer used with the SPT is the split-spoon that
was developed by Raymond Concrete Pile Company. Several other types
of penetrometers have been more or less standardized. Most of these
use a steel cone drive point.
The Texas Highway Department is currently using a Cone Pene
tration Test. Resistance to penetration is expressed as the number
of blows per foot of penetration caused by a free falling hammer.
The purpose of the test is to obtain an estimate of the in situ pro
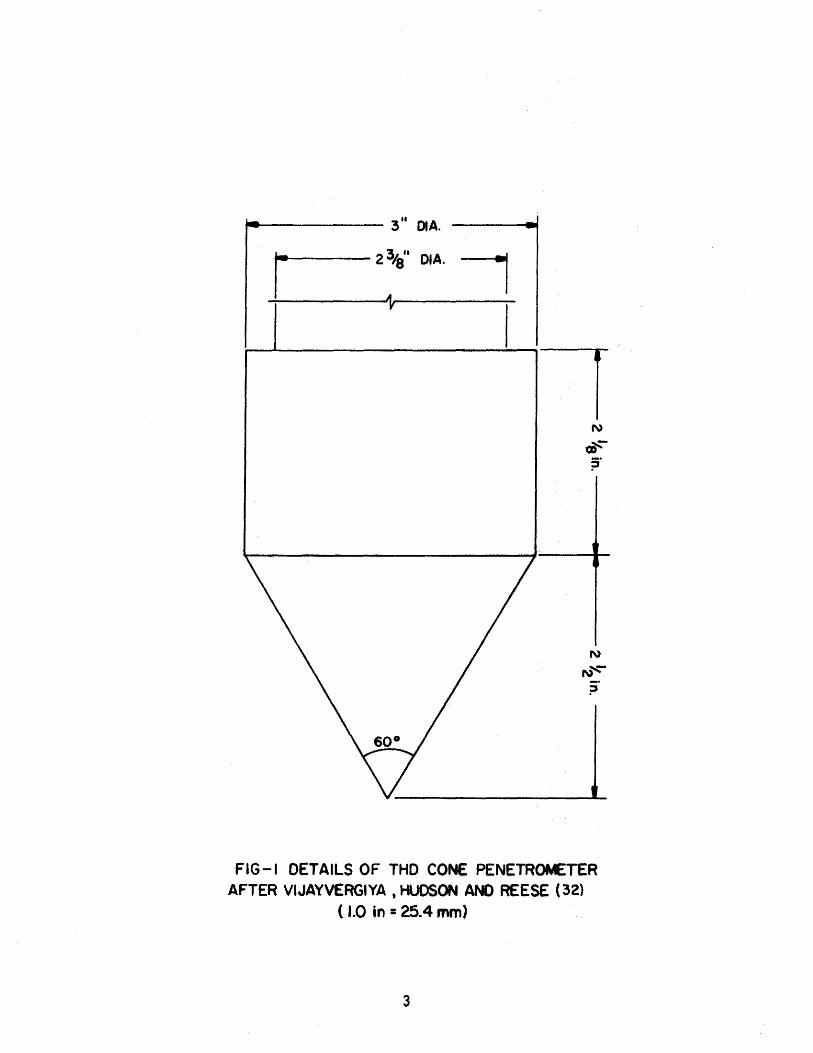
perties of the soil. The cone penetrometer shown in Fig. 1 is used
to perform the test in accordance with Texas Highway Department speci
fications (5). The drilling rod used is a three thread 11 N11 rod with
a wall thickness of 0.281 in. {7.137rTIT1). The hammer weighs 170
pounds {77 kg) and falls freely a distance of 2 ft (0.61 m).
The Texas Highway Department Cone Penetrometer Test is normally
performed in each identifiable soil layer or every 5 ft (1.27m),
whichever is smaller. The cone is lowered to the bottom of a boring
and the tip seated into the undisturbed soil. If the cone penetrates
into the undisturbed soil under its own weight without driving, the
penetration is measured and a zero resistance is recorded. Other
wise, the cone is driven 12 blows in order to properly seat it
in the soil. Then the number of blows of the hammer, which causes
the cone to penetrate an additional 12 in. (304.8mm) into the soil,
2
,....._ _____ 3" OIA. ----.~ r _....__ ___ 2 3ta" DIA. 1 ~-------~~--------
;;·
N :-...-N
?
FIG-I DETAILS OF THO CONE PENETRC».£TER AFTER VIJAYVERGIYA, HUOSON AND REESE (32)
(1.0 in= 25.4 mm)
3

is recorded and is called the N-value.
Present Status of the Problem.--Dynamic penetrometers were
originally designed to obtain qualitative data on the resistance to
penetration of a soil and in particular to determine the compactness
of cohesionless soils which are usually difficult to sample. Today,
their use has been extended to aid in the determination of required
depth of embedment of foundations into a soil bearing strata. Pene
trometer data are used to determine the shear strength parameters
of the soil. These parameters are then used in bearing capacity
equations to determine the depth at which the soil will carry the
required foundation load.
The "quick" or unconsolidated-undrained shear strength of a
cohesive soil is the most commonly used shear strength parameter
for evaluating the bearing capacity in cohesive soils (23). Various
researchers have developed relationships between the dynamic pene
tration resistance, N, from the Standard Penetration Test and the
quick shear strength for cohesive soils (9, 24, 27). The quick
shear strength is measured in the laboratory by the unconfined com
pression test or in the field by the in situ vane.
The Foundation Manual (5) presently used by the Texas Highway
Department includes a correlation between the N-value obtained from
the Texas Highway Department Cone Penetrometer Test and the soil
shear strength. However, this correlation was established for many
soil types and is known to be conservative for some soil types.
4
During recent years research has been conducted at Texas A&M
University, Texas Transportation Institute (TTI), on driven piling and
at the University of Texas, Center for Highway Research (CHR), on
drilled shafts. As part of these research studies, soil shear
strength was obtained in the laboratory from unconfined compression
tests by TTl and from triaxial quick tests by CHR on undisturbed
samples obtained from load test sites (1, 8). Also, theN-values
from the Cone Penetrometer Test were obtat.ned. In addition, simi-
lar data were recently collected randomly from Texas Highway Depart
ment district laboratories. The shear strength collected from the
district laboratories was obtained by either the Texas Triaxial
Test (TAT) or the Texas Transmatic Triaxial Test. Comparison be
tween these data and the Texas Highway Department correlation as
shown in Fig. 2 substantiates that the correlation is conservative.
According to the Texas Highway Department Foundation Manual
(5), the Cone Penetrometer Test is a standard test used to determine
the consistency and load carrying capacity of foundation materials
encountered in bridge foundation work. Furthermore, the f'1lnual (5)
states that:
The load carrying properties of a material are: 1) its shear strength, 2) its bearing strength. These_ properties· are~:.deterrni ned· by one or mote_ of the following tests:
a- Triaxial Test b- Unconfined Compression Test c- THO Cone Penetrometer Test d- In-place Vane Shear Test e- Miniature Vane Shear Test
5

... 82D -~. z 1.8 w
~ ~ 1.6
~ (/) lA 0 LaJ z <l 1.2 ! z y 1.0 0 L&J
~ 0 o.e ::J 0 ~Q6 8 z :::;) 0,4
0 0
0 0
0
• ooe • 06
L.EGENO 0 FROM THO • FROM TAMU, TTl A FROM UT, CHR
0 0 S DESIGN SHEAR STRENGTH
10 20 30 40 50 60 70 80 90 100
PENETRATION RESISTANCE,N, IN BLCMIS/Ft
FIG. 2 .. - RELATIONSHIP BETWEEN UNCONSOLIDATEDUNDRAINED SHEAR STRENGTH AND RESISTANCE TO PENETRATION OF THO CONE PENETROMETER
( 1.0 ft. =.305m., l.Q tsf = 9.58td04 NJm2)
6
The laboratory tests (items a, b, and e above) for determining
soil shear strength are often omitted in routine subsurface inves
tigations because of the additional expense involved. Consequently,
the THO Cone Penetrometer Test is the primary means of determining
soil shear strength at bridge sites. Therefore, a better correlation
between theN-value and soil shear strength could result in signifi
cant financial savings in the design and construction of bridges.
Objective.--The objective of this study is to develop an im
proved correlation between the N-value obtained from the Texas High
way Department Cone Penetrometer Test and the unconsolidated-un
drained shear strength of three different groups of cohesive soils.
According to the Unified Soil Classification System, these soils
are CH, CL, and SC which are defined as follows:
CH - Inorganic clays of high plasticity, fat clays,
CL - Inorganic clays of low plasticity, sandy clays, silty
clays, lean clays,
SC - Clayey sands, sand-clay mixtures.
7

TEST SITES
A preliminary site location survey was conducted in order to
locate a variety of cohesive soils to include CH, CL, and SC. An
effort was made to locate sites where a test load on driven piling
or drilled shafts had been conducted. Four locations yielding a
reasonable variety of cohesive soils were located. These sites are
designated as sites A, B, C, and D, respectively. At three of the
sites (A, B, and C), a test load on drilled shafts had been con
ducted. Figure 3 shows the general location and the geological for
mations of the test sites.
Test Site Locations.---Test site A is located at a new bridge
that crosses the Little Brazos River on State Highway 21, approxi
mately 10 miles (16.1 km) southwest of Bryan, Texas. Test sites B,
C, and Dare located within the city limits of Houston, Texas.
Site B is located at Interstate Highway 610 - HB&T Railroad overpass.
Site C is located at the proposed overpass of State Highway 288 and
Brays Bayou. Site D is located at Interstate Highway 45 and Nettle
ton Street.
Test Site Geology.---According to the United States Department
of Agriculture (16), tes·t site A is located in the flood plain of
the Brazos River. Flood plain deposits are likely to have a fairly
regular structure (27). However, at any point or line of continuity,
these deposits can be broken by bodies of other sediments occupying
troughs or abandoned river channels (14). These flood plain deposits
8

GEOLOGICAL FORMATIONS
I F:·:·:·:·:·:OJ BEAUMONT I LISSIE
fi - ~~~~~~AO,LAZARIO,OAKVILLE,
m l' ·' .>.1 ~~f'N5~eE~E~J\~~~~t~~gcKD4CE, 12'~ TAYLOR, AUSTIN, EAGLE FORO, NAV~RffO ]l .. GRAYSON,DEL RIO,EDVVARD~
WALNUT
scale: 1" = 70 MILES
0 70
FIG. 3 GENERAL LOCATION OF TEST SITES
9
140

are underlain by the Crockett Shale formation (2). This formation
is primarily medium gray, fossiliferous shale of normal marine origin.
However, it is .not known whether, this 'fo·rmation was deposited in
shallow or deep water. The Crockett Shale is often referred to as
the 11 Cook Mountain Shale .. because of its previous inclusion in the
Cook Mountain formation.
Test sites B, C, and D are located within the outcrop of the
Beaumont clay formation. This formation, which was laid down during
the early Wisconsin glacial stage in the form of coalescing alluvial
and deltaic plains, is the youngest of a series of Pleistocene ter
races forming the Gulf Coastal Plain. The formation consists of
poorly bedded plastic clay interbedded with silt and sand lentils
and some more-or-less continuous sand layers (26). As a result of
exposure to weathering during the late Wisconsin glacial stage,
when the sea was more than 400ft (122m) below its present level,
the clays are overconsolidated by desiccation. These oxidized and
leached clays are typically light gray, tan, and red in color with
inclusions of calcar'eous and ferrous nodules. Structurally, the
clay is jointed and frequently contains slickensides created by
nonuniform shrinkage and expansion. The predominant clay mineral
is calcium montmorillonite, and the nonclay minerals are quartz
and feldspar (17).
Just to the north of site B is the Lissie sand formation. ·Be
tweJn the Lissie sand and Beaumont clay is a secondary formation,
locallytermed the second terrace. The divisions of different for-
10

mations in this area are almost indistinguishable, and the for
mations tend to blend together (1).
11

SOIL INVESTIGATIONS
Both field and laboratory investigations were required to ob
tain the i.nformation necessary to achieve the objective of this
study. The informatton required includes the resistance to pene
tration, the correspondi-ng unconsolidated-undrained shear
strength, and the properties needed to classify the soils according
to the Unified So-il Classification System.
Field Investigation.---The purpo-se of the field investigation
was to obtain the resistance to penetration using the THO Cone
Penetrometer Test. At the same time, soil profiles were established
and undisturbed soil samples were taken for use in the laboratory
investigation. Location, boring number, and depth of penetration
of the seven soil borings taken are given in Table 1.
TABLE 1.--Summary of Soil Borings
Boring Site Depth of Location number designation penetration, ft
Brazos County la* A 26 lb A 46
Harris County 2 B 70 3 B 70
Harris County 4 c 30 5 c 30
Harris County 6 D 42 7 D 43.5
1.0 ft = 0.305 m *Boring la was terminated at 26 ft because it was too close to a previously drilled boring.
12

These borings were made using a truck-ncunted Failing-1500 rotary
drilling rig.
The THO Cone Penetrometer Test was conducted in borings 1, 3,
4, and 7 respectively. With the exception of boring 1, the Cone
Test was conducted at 2.5-ft (0.7625-m) intervals. In boring 1 it
was conducted at 5-ft (1.525-m) intervals.
The procedure used to obtain the penetration resistance
is described in detail in the Texas Highway Department Manual (5).
Although the specifications require the penetrometer to "be
driven twelve blows in order to seat it in the soil or rock, ..
this seating process was determined by the driller. Driving
then proceeds in increments of six inches at a rate of 18 to
24 blows per minute. The reported blow count is the number of
blows required to drive the cone a distance of one foot.
When the number of blows required for one foot of penetration
exceeds 100, driving stops and the penetrated distance is recorded.
Careful consideration was given to the cleaning of the
bottom of the bore hole after completion of each ·cone penetrometer
test. This was accomplished by coring the soil at the bottom
of. the hole with a push barrel sampler and slowly extracting the
drill pipe. Although the sample in the barrel was disturbed
because of the penetrometer action, it was extruded and used for
visual classification.
13

In borings 2, 5, and 6 undisturbed samples were taken continu
ously. In boring 1 samples were taken above and below the depth at
which the THD Cone Penetrometer Test was conducted. Soils were
sampled with the push barrel sampler shown in Fig. 4. Each core
was examined in the field by personnel from both the Texas Highway
Department and TTI. Representative portions of each core were
sealed and packaged for transportation to the TTI Soils Laboratory.
The depth to groundwater in the open bore holes was measured
at various times ranging from a few hours to 72 hours following
completion of the boring. Only very slight changes in the depth
to water occurred after the 24-hour reading. The depth to ground
water was recorded on the right corner of the appropriate boring
log.
Laboratory Investigation.--The purpose of the laboratory inves
tigation was to obtain the unconsolidated-undrained strength and
to classify the soils according to the Unified Classification
System. Soil shear strength was determined by using the types of
tests listed in Table 2. Also shown in Table 2 are the numbers of
each type of test conducted for each site.
Since the Texas Highway Department uses both the Texas Triaxial
Test and the Transmatic Triaxial Test, it was necessary to use
these two tests as the means of obtaining soil shear strength. How
ever, the Transmatic Triaxial is limited to a maximum confining pres
sure of 25 psi (172.5 kN/m2) and can only be used with soils that
are firm in consistency. Therefore, the Texas Triaxial Test (TAT)
14

__, U'1
3-112"
3-t/4'
3"
L 41/64" ORI..L41Cl
I I I I I I I
o~-----+----4-----;-r--_-_-_-=-----r I ._ __ - ---- ---'--1
I I I I I I
tzznunzzueur(R((<(«f((wzP · ==10o
l/4"x l/4"x 2'' LONG KEYSTOCK 4 ea., SILVER SOLDER TO BARREL
BARREL- 3- I/4"QO. x 3"1.0. SEAMLESS STL. TUBING
SLEEVE-3-1/2 O.D.x 3·1/4 1.0. SEAMLESS STL. TUBING
FIG.4 PLATED 3" PUSH BARREL stk no. 150770
COURTESY OF Tl£ TEXAS HIGHWAY DEPARTMENT 11n~ ·= 25.41RM .

was the primary test used in this study. Selected samples were
tested in accordance with the procedures specified in ASTM Test
2850-7. The ASTM tests were compared to the TAT test results
in a relative manner similar to the method used by Lumb (15).
TABLE 2.--Type and Number of Triaxial Tests
Number of tests Type of test Site A Site B Site C S·ite D
Texas Triaxial, unconsolidated~undrained,
single-stage 16 20 12 9 multi-stage 2 5 2 1
Transmatic Triaxial Compression, unconsolidated-undrained,
multi-stage 1 1 1 1
ASTM Triaxial unconsolidated-undrained,
single-stage 3 4 5 4 multi-stage 1 5 2 1
Since the loading rate that produces failure of foundations
may occur before any appreciable drainage can take place, it was
considered appropriate to conduct unconsolidated-undrained or quick
strength tests. The quick shear strength of each sample tested in
the single-stage type test was determined by using a confining pres
sure approximately equal to the effective overburden pressure. The
effective overburden pressure was determined from the unit dry
weights and moisture contents of the soils above the depth at
which the sample was obtained, and from the location of the
16
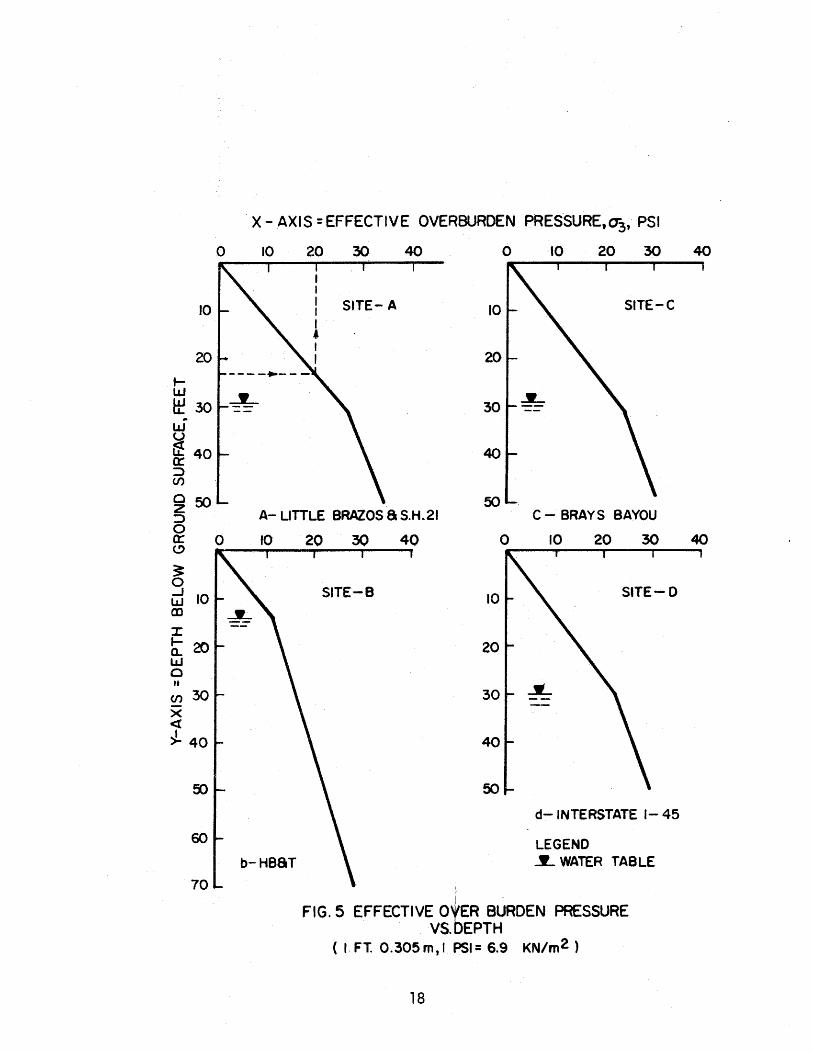
groundwater table. The plot of effective overburden pressure
versus depth for each test site is shown in Fig. 5. For example,
from Fig. 5a, a sotl sample that was recovered from 23ft (7.015-m)
was tested using a confining pressure equal to 20 psi {138 kN/m2).
When conducting the quick test, the deviator stress, that is
the vertical stress minus the confining pressure, at failure is
independent of the magnitude of the confining pressure for saturated
soils (3). This is also known as the ¢ = 0 condition. In order
to investigate whether the ¢ = 0 condition existed for the soils
tested in this study multi-stage triaxial tests were conducted on
selected samples from each soil strata. If the ¢ = 0 condition did
not exist, the soil was either partially saturated or it was a fissured
soil which was tested at a confining pressure less than the overburden
pressure (4). In order to determine the degree of saturation it was
necesary to conduct a specific gravity test on the samples that
were tested in multi-stage tests.
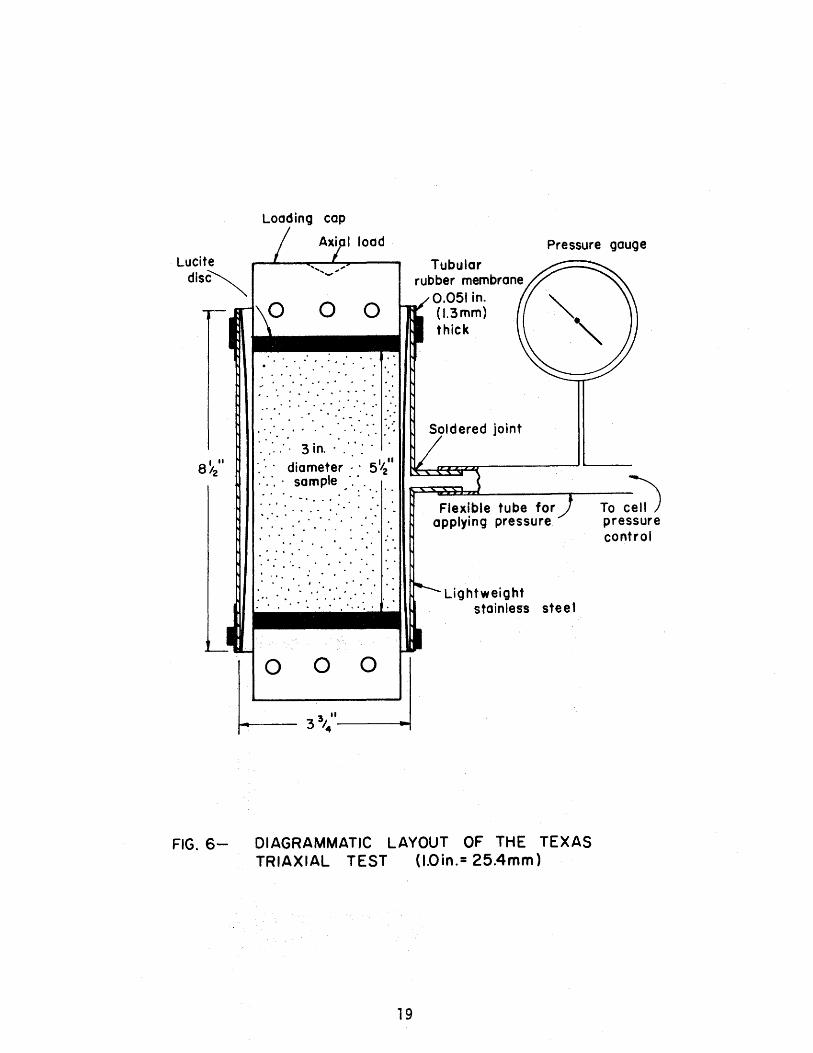
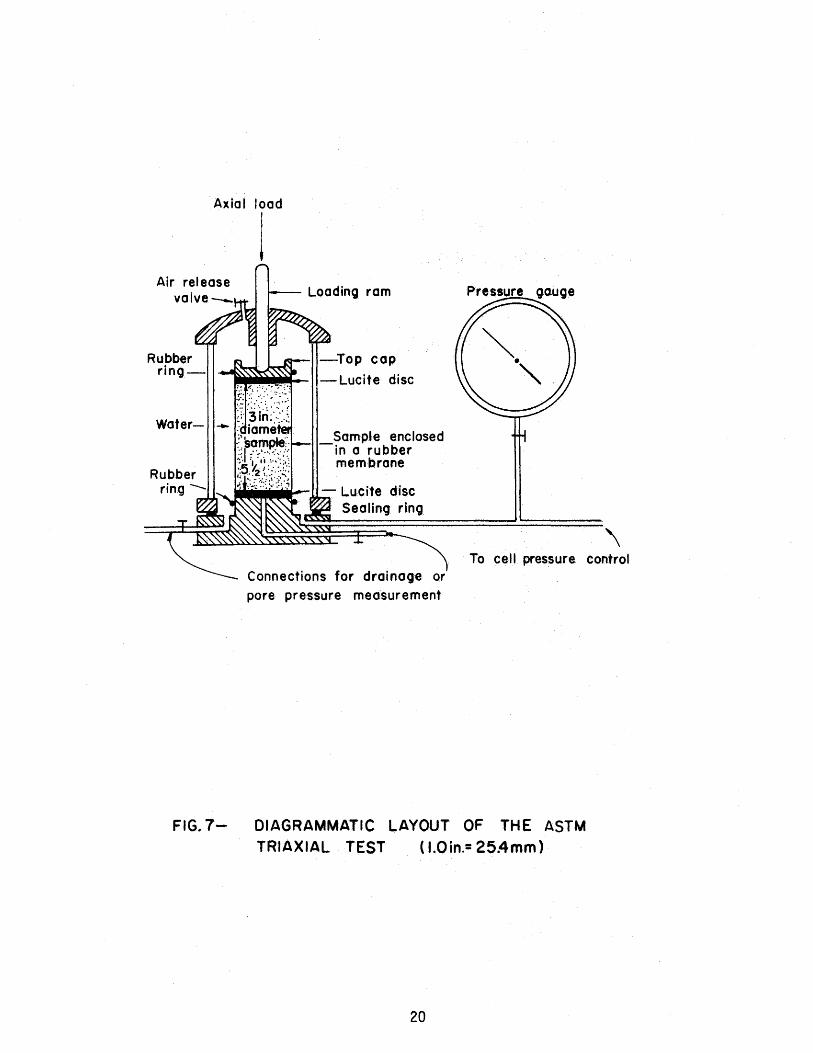
Diagrams of the triaxial test apparatus used in this study are
shown in Figs. 6,7, and 8. The Texas Triaxial Test apparatus that
is shown diagrammatically in Fig. 6 includes a rubber membrane
0.051 in. (1 .3mm) thick that is fitted to a lightweight stainless
steel cylinder. The ASTM Triaxial Test apparatus shown diagrammatically
in Fig. 7 includes a 0.012 in. (0.30mm) thick rubber membrane
which completely seals the sample. The sealed sample is enclosed
in a cell where it can be subjected to either fluid or air pressure~
The Transmatic Triaxial cell is similar to an ASTM
17
0
10
20
~ L&J
~ 30 .. lJJ u ~ 40 cr: ::::> (J')
0 50 z ::::> 0 cr: 0 (!)
~ 0 ..J lJJ aJ
J:
ti:20 UJ 0
. X- AXIS= EFFECTIVE OVERBURDEN PRESSURE,CT3, PSI
10 20 30 40 0 10 20 30
SITE- A 10 SITE-C
20
30
40
50 A- LITTLE BRAZOS 8& S.H~21 C- BRAYS BAYOU
10 20 40 0 10 20 30
b-HBST
SITE-B 10
20
30
40
50
SITE-D
d- INTERSTATE 1- 45
LEGEND .1. WATER TABLE
FIG. 5 EFFECTIVE O~ER BURDEN PRESSURE VS.DEPTH
( I. FT. 0.305 m, I PSI= 6.9 KN/m2)
18
40
40
Pressure gauge Lucite dis~
0 0
........ . .. . " '
...... . . . . . ...... ,. ..
·. ·.· . .-·. 3 in . .' .· ·: ·
·. ·. · diameter ~ · 51411
.·. ·. · sample ·. ·. I • " o -....
... · ..
.. . . .. ...
I • o • • • •
Tubular rubber membrane
0.051 in. (1.3mm) thick
Soldered joint
Flexible tube for applying pressure
Lightweight stainless steel
~o~J 3 II
3 :14
FIG. 6- DIAGRAMMATIC LAYOUT OF THE TEXAS TRIAXIAL TEST (LOin.= 25.4mm)
19
To c::J pressure control
Axial load
Air release
Rubber ring-
Water-
Rubber ring-....
FIG. 7-
I Loadino ram
-Top cop
- Lucite disc
Sample enclosed -in a rubber
membrane
- Lu.eite disc Sealing ring
Pressure
~~~~~~~==\
Connections for drainage or pore pressure measurement
To cell pressure control
OIAGRAMM,ATIC LAYOUT OF THE ASTM
TRIAXIAL TEST ( I.Oin.= 25.4mm)
20

Proving
Rubber
5t 11" dia
4 studs, spaced at 90°, with
wino nuts
Applied load
Base
Movable lucite cell
Soil specimen ------ 3in. diameter
and sll" lono
.. =::!~\ To cell pressure
control
FIG. 8- DIAGRAMMATIC LAYOUT OF THE TRIAXIAL COMPRESSION TEST
TRANSMATIC ( 1.0 in. = 25.4 mm)
21

Triaxial cell, except that the proving ring is placed directly on
top of the soil sample inside the cell· as shown in Fig. 8, and air
pressure is used as the confining pressure. The apparatus used to
conduct the classification tests are the conventional ones that are
normally found in every soil mechanics laboratory.
Water content and unit dry weight determinations were made for
all samples tested. Atterburg Limits and percent passing No. 200
sieve were also determined.
Tests were conducted in accordance with the procedures outlined
in the Texas Highway Department Manual of Testing (28). Table 3
shows the type of test and the corresponding procedure used. The
ASTM Triaxial and the Transmatic Triaxial Test procedures are
not given in the THD Testing Manual (28). However, the procedure
used was essentially the same as that used for the Texas Triaxial
Test. As noted previously, the membrane used to seal the sample
in the ASTM and Transmatic Tests was considerably thinner than
the one used for the TAT Test. Each sample was tested in compression
using the same motorized press assembly geared to travel at a rate
of 0.135 in. (3.429 nm) per minute. Simultaneous readings of load
and deformation were taken at intervals of 0.01 in. (.254 mm) de
formation until the sample failed.
The procedure used to conduct the multi-stage triaxial test
on a soil sample was to confine it initially at a pressure somewhat
less than the effective overburden pressure. The sample was then
loaded in compression at a constant rate of 0.135 in. (3.429 mm)
22

per minute until the load was only increasing about 2 lb (.906 kg)
per 0.01 in. (.254 mm) of deformation. The deviator stress at this
stage was taken as the failure stress under the applied confining
pressure.. The confining pressure was then increased and this pro
cess was repeated for two additional stages. The two additional
confining pressures, one equal to and the other greater than the
in situ effective overburden pressure, were used.
TABLE 3.--Type of Test and Procedure
Type of test Test method US·ed
Texas Triaxial Test (1 ) Tex-118-E
Moisture content Tex-1 03-E
Liquid Limit Tex-104-E
Plastic limit Tex-105-E
Minus No. 200 sieve Tex-111-E
Specific gravity (2) Tex-108-E
(l)The sample dimensions were 3 in. {76.2 mm) in diameter and 5.5 in. (139.7 mm) in length. Confining pressure used equaled the effective overburden pressure.
(2)A partial vacuum was used. The weight of dry sample was determined after test was performed.
23
SUMMARY OF TEST RESULTS
The laboratory test results, except soil shear strength, were
summarized in the form of a boring log for each test site. The
unconsolidated-undrained shear strength and N-values were sum
marized on a separate boring log to facilitate the development of
a correlation between these two parameters. Pertinent soil pro
perties were used to describe the soil conditions. The results
from Atterberg Limits and the particle size tests were used to
classify the soils.
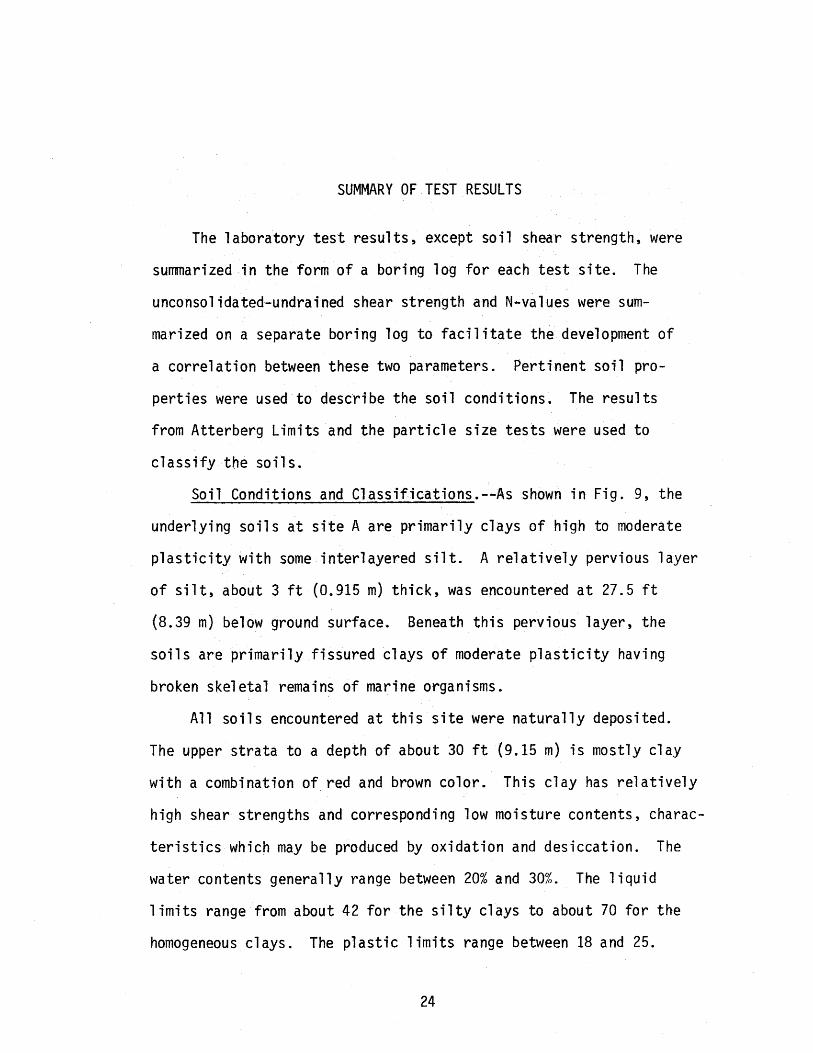
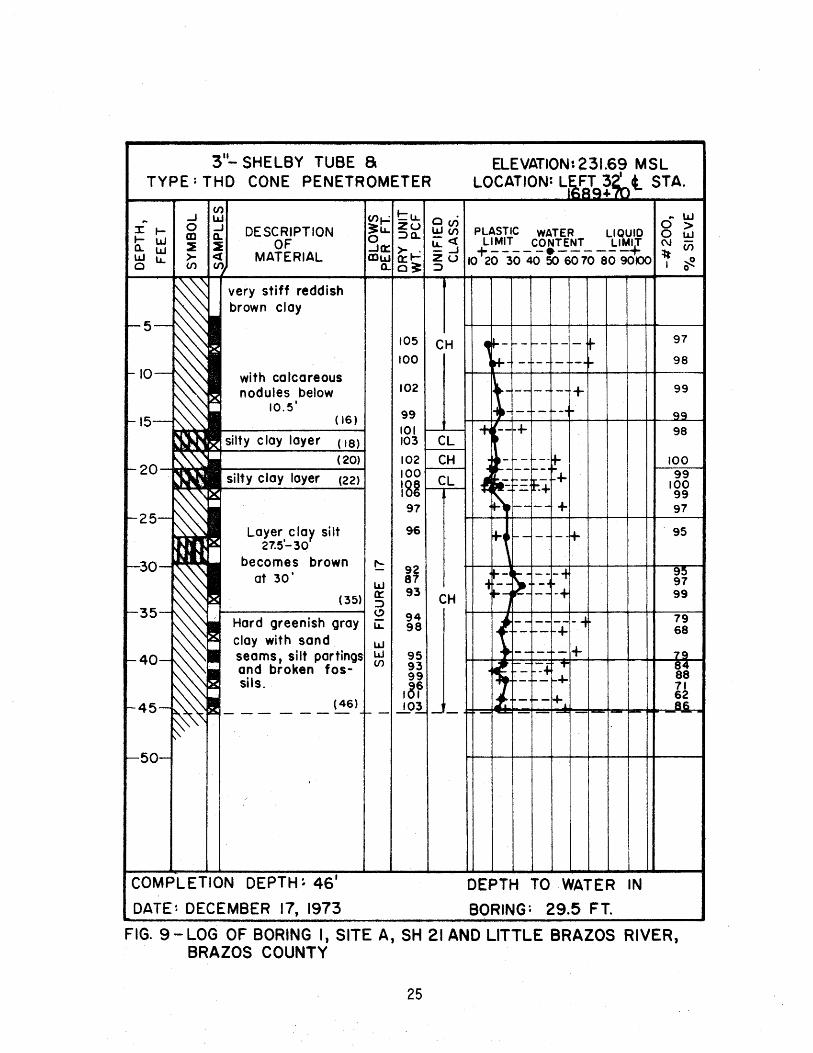
Soil Conditions and Classifications.--As shown in Fig. 9, the
underlying soils at site A are primarily clays of high to moderate
plasticity with some interlayered silt. A relatively pervious layer
of silt, about 3 ft (0.915 m) thick, was encountered at 27.5 ft
(8.39 m) below ground surface. Beneath this pervious layer, the
soils are primarily fissured clays of moderate plasticity having
broken skeletal remains of marine organisms.
All soils encountered at this site were naturally deposited.
The upper strata to a depth of about 30ft (9.15 m) is mostly clay
with a combination of red and brown color. This clay has relatively
high shear strengths and corresponding low moisture contents, charac
teristics which may be produced by oxidation and desiccation. The
water contents generally range between 20% and 30%. The 1 iquid
1 imits range from about 42 for the silty clays to about 70 for the
homogeneous clays. The plastic limits range between 18 and 25.
24
3"- SHELBY TUBE 8 TYPE:THD CONE PENETROMETER
~ 6 ~ :I: I- m DESCRIPTION I- UJ I~ OF UJO.. WLL ~>- I := ~ MATERIAL 0 (/) Cl".
105 CH 100
102
99
101 c·· 103 •1-t-------t
f-_2:_1~~ .·. (20)
102 CH 100 ,83 ~ .., ty :lay layer 1221
97
Loyer clay silt 96 ... ~ 27.5'-30
f-30_~ becomes brown t: 92 at 30' 87
r-35_~~ .· (351 ~ :: CH ~~ Hard greenish gray iL 98
1:8 cloy with sand w f-40-~- seams, silt partings ~ 95
~~ • o~d broken fos- ~i ~~ SIIS. tOf
r-45-~·--- - -- (461_...- ... !..01.--
~ -~ ~o-
COMPLETION DEPTH~ 46'
DATE: DECEMBER 17, 1973
ELEVATION: 231.69 MSL LOCATION: L~A·gt~t STA.
~ ~ 1-- r-- f--1- t ~- ··~
~~- ,_.._ 1-- ·-·+ 1~- "'"--~
...1 _1.
' . I
. t: 1-- tt ~
1--~
·~ t:= t:+ ..... -ft-' -- -- + ~4 -- - +
1- -~
~~ ---+ ..... ..:; 1-- -+
J
~ 1-- ~ I ,..
~~-- ·- ·- I+ ~~---- ·-:-~ T
1-- ~ .... ~- 1+..&. [_1_ - - - ·- -
DEPTH TO WATER IN
BORING: 29.5 FT.
97
98
99
_9_9_
98
100 99
100 99 97
. 95
~~ 99
79 68
79
~; 71 62 86
FIG. 9- LOG OF BORING I, SITE A, SH 21 AND LITTLE BRAZOS RIVER, BRAZOS COUNTY
25

Natural water contents are generally near the plastic limit indi
cating low compressibility. Nearly 100% of the particles pass the
No. 200 sieve, and the degree of saturation ranges between 88% and
100%. The pervious layer with the reddish brown color contained some
sand and exhibited very little resistance to cone penetration. The
clay below the pervious layer is ~ray and green in col~r, and highly
saturated. The natural water content is nearly equal to the plastic
limit which ranges from 25 to 30. The liquid limit varies from
about 51 to 60. The Unified Classification for the soils from site A
are shown in Fig. 10 which reveals that the clays are primarily CH
materials. Detailed test data fo,r site A are given in Table III-1,
Appendix I II.
The significant characteristics of the underlying soils at
site B are given in Fig. 11. This boring log reveals an erratic
variation in the natural soil deposits. A 3-ft (.92-m) layer of
sandy clay and shell fill material was encountered at the surface
of this site. Beneath this fill light gray and tan clayey sand
exists to a 12-ft (3.66-m) depth. The percent of materials that
pass the No. 200 sieve range between 38% to 48%. The natural water
content which is generally near plastic limit ranges between 17%
and 18%. The liquid limit ranges between 25 and 35. This clayey
sand is highly saturated. This layer is underlain by a layer of
silty fine sand which could not be sampled to a depth of 21 ft
(6.4 m) below ground surface. However, the resistance to cone
penetration indicates that this sand is medium dense. Beneath the
26

90 I I
• 0•16 feet
80 ~ 0 16·18 feet
• 18-20 feet 0 20-22 feet e 22-35 feet
..... 70 r 0 35-47 feet
I CH z LLI
~ 60 bJ a..
~50 r CL I ,
X bJ
N ~ 40 ,•o ......,
~0 > 1- •• 0 ~ 30 0 DO .... en 0 C( y OH 8 MH ..J 20 0..
10
0 0 10 20 30 40 50 60 70 eo 90 100 110 120
LIQUID LIMIT, WL 1 PERCENT
FIG.IO- UNIFIED CLASSIFICATION OF SITE- A

TYPE: 3 11 SHELBY TUBE
... J: 1-to..w LaJLaJ ou.
DESCRIPTION OF
MATERIAL
Stiff light gray and ton silty cloy with silt layers (40)
Very stiff red and light gray cloy
-with clay stones to 43
1
- Becomes re'd and slickensided at 46'
---:------- (49.5) silty clay with
(54.5) Very stiff red clay with calcareous nodules -silty clay layer 58.5'-&o' -2"rock at63'
Red .clayey silt with silt toyers (70)
ELEVATION: 65.2 FEET LOCATION~ N. 737. 537
COMPLETION DEPTH :70FT. DEPTH TO WATER IN BORING ~ 12 FT.
78.5
FIG. II-LOG F BORIN 2, SITE 8, INTERSTATE HIGHWAY 610 AND HB8T RAILROAD, HOUSTON, TEXAS
28

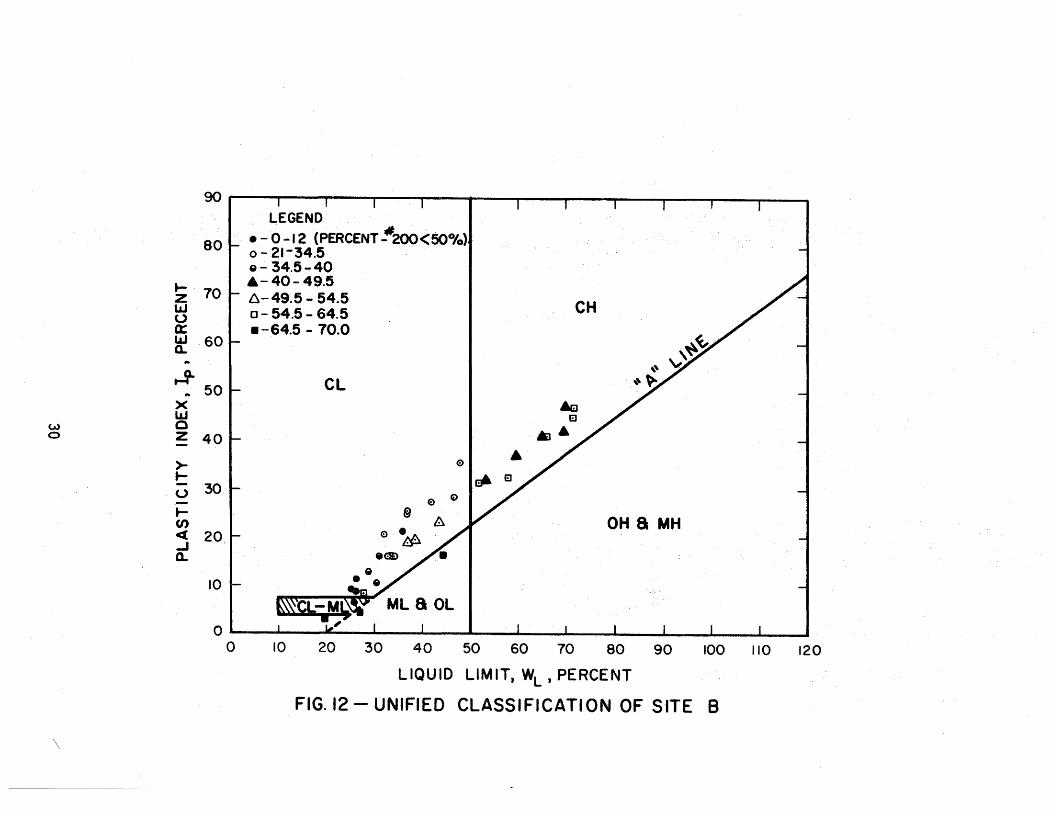
silty sand the soils are primarily clays to a depth of 64.5 ft
(19.67 m). The thitkness of these clays vary, and they contain
layers and seams of cemented soils at various depths. The liquid
limits range from about 31 for the sandy and silty clays to about
72 for the clays that exhibited a slickensided structure. The
plastic limits vary between 15 and 25 and are generally near the
natural water contents. The percent of materials that pass the
No. 200 sieve vary between 51 for the sandy clays to 100 for the
other clays. These clays are underlain by clayey silt to the ter
mination depth of 70ft (21.4 m). The Unified Classification for
the soils from site B are shown in Fig. 12 which reveals that the
clays are both CL and CH materials. All test data for site B are
given in Table III-2 of Appendix III.
As shown in Fig. 13 the stratification at site C consists of
the following: a surface fill of brown and tan sandy clay to a
depth of about 5 ft (1.53 m); 3 ft (0.92 m) of naturally deposited,
light gray and tan, sandy clay containing calcareous nodules; and
4ft (1.22 m) of light brown and light gray clay with calcareous
nodules. Below the depth of 12 ft (3.66 m) lean clays exist that
are silty to a depth of 25ft (7.63 m) and then become sandy to a
depth of 28 ft (8.54 m). At the termination depth of 30 ft (9.15 m)
silty fine sand was encountered. This sand is overlain by a transi
tional 1-ft (.305-m) layer of clayey sand.
The water contents of the natural soils at site C generally
29
90 I I
LEGEND
801-- •-0-12 (PERCENT ... 200<50°/0 )
o-21-34.5 8-34.5-40
t- 6-40-49.5 z 70 16-49.5- 54.5 I CH lLJ
0- 54.5- 64.5 0 a: •-64.5- 70.0 LaJ 60 (L ..
G.
~ 5oL CL X LaJ
w 0 0 z 40
I 01 • >-1-
~ 30 I 0 G) @
8 y OH 8 MH -<( ...J 0.
10
0 0 10 20 30 40 50 60 70 80 90 100 110 120
LIQUID LIMIT, WL, PERCENT
FIG. 12- UNIFIED CLASSIFICATION OF SITE 8
\

TYPE: 3" SHELBY TUBE ELEVATION: 50.3 FEET
LOCATION: ~fP.lJia ..
i ~
~~~ ~~ ~l;j si DESCRIPTION ~~~
OF
~~~ Wp W WL ~n~~ = ~~~ ~c (j· ~ MATERIAL +-----·------+
) ~020 ~0 ~ 0 ~0 6D iO t;O ~"jl('{'
Very Stiff Brown 8 Fll.l Tan Sandy Clay
(5') ~ -- (FILL.)
~ • ¥:~ ~~~. ~iPcJ'; ~it~Y c:· :~ .,.. 8 Fe n~oowes 11~8' .lJU ..1
Ver~ Stiff Li~ht .·~f:'C 8 I J .. :- . r--1 - ~~
lig t Gray Cay· · Cal- · ..... coreous Nodule$ (12') ..l!.ol
::W: .
~ ... ~ VeVc Stiff Ll~ht Gray .....
'"' a an Silty lay ,._ I
r---15- ~~N~ ~ !... lL ,,, ~With Calcareous ·- I"
"' '" ~ules· a Sand Poe- jtft .__
'\~,..._ ets 16-24 .... 1.&. ._20- ~
I" "' " .... Ught Gray 19-21 ::f - ... '\~ \ •. '"' UJ
"'''"' - ' a: ...JJll.. ....... ..... ....... ~ 1\
Becoming Sandy at 25 ::::) r
-25- i~ (!)
G: .J!.U.. :: Very Sandy 26- 29· ~
,.. . Clayey Sond Loyer .....
~ l..l6.0. S·~-. .a!L .....
-30- ~ft ~ r- II~ I SM -.'..a ..t." _.., _,
Light Gray a Red
."2.&::. Silty Fine Sand
..lt.l
~40-
~45-
1-50-
COMPLETION DEPTH: 30 FT. DEPTH TO WATER IN DATE: MARCH 13, 1974 BORING: 29 FT.
FIG.I3-LOG OF BORING 5, SITE C, BRAYS BAYOU AT STATE HIGHWAY 288, HOUSTON, TEXAS
31
ui
~~~ fl. u;
82.4
f=i~.~ f=i~7
59.8 73.4 71.4 75.1 94.7 90.7 72.9 78.2
80.5
74.2 79.4
85.2 87.2
60.3
74.2 58.2 68.1 34.0 24.4
vary betwee'n 10% and 20%. The plastic limits of the clays vary in
the narrow 'range of 11 to 15. The clayey sand plastic 1 imit is
17. The 1 i quid 1 imi ts ·of the c 1 ays vary from 20 to ,35 for the
si 1 ty clays and from .39 to 46 for the sandy clays. The homo-
geneous clay liquid limit is around 60. The amount of material
passing the No. 200 sieve for the .clays varies between 59% for the
sandy clays and 95% for the other clays. The degree of saturation
varies between 75% and 100%. The Unified Classification for the
site C soils is given in Fig. 14. Site C is primarily CL materials.
The data of all tests for ·site C are given in Ta.ble III-3 of Appen
dix III.
The boring log of the underlying soils at site D is presented
in Fig. 15. These soils are of the Beaumont Clay formation. A
highly saturated tan and gray clay was encountered to a depth of
24 ft (7.32 m) below ground surface. This clay is slightly silty
and contains calcareous and ferrous nodules. A 6-in. (152.4-mm)
layer of silt that is underlain by a 12-in. (304.8-nm) layer of
clayey sand was sandwiched in the middle of this clay strata. The
1 iquid 1 imits vary from 58 to 70. The plastic 1 imits range be-
tween 15 and 18. Natural water contents are generally near
plastic limits, indicating low compressibility. Beneath this plas
tic clay there is a silty clay' that becomes sandy clay below the
26-ft (7.93-m) depth to about the 40-ft (12.2-m) depth. These
lean clays contain layers of sand and silt at various depths. The
1 iquid 1 imits are between .25 and 40. The natural water contents
32

90
t- 80 z LLJ u 70 et: LLJ Cl.
.- 60 Cl. .... x 5o LLJ 0
·W z 40
·W
>-t-u 30 t-en <X 20 ...J Q.
10
0 0
0 - 5ft- 8ft. 25ft- 28ft.
• - 12 ft - 25ft. 8. - 8ft - 12ft.
e - 2 ft - 29ft.
CL
.. ,0
CH
8.
~
({), 0
OH 8 MH
10 20 30 40 50 60 70 80 90 100 110 120
LIQUID LIMIT, WL, PERCENT
FIG. 14-UNIFIED CLASSIFICATION OF SITE C

TYPE: 3 11 SHELBY TUBE
:I: ~~ a.w LIJW OLL..
DESCRIPTION OF
MATERIAL
very stiff tan and gra clay slightly sil.ty with calcareous and ferrous nodules
-layer of silt 13'-13.5' -layer clayey sand
13.5'- 14.51
very stiff tan silty clay with calcareous nodules - becomf!S sandy
at 26
-clay silt 34.5'-35' -layer c.layey sand
35'- 36'
J--t;.:;::•:_:·~::.-tJ• -layer sand 39'- 41' -:fiQ.Y~ .§!1Lbelo!_4_L
0 C\1
w w Cf)
ELEVATION: 50.1 FT. LOCATION: N
9.8 CH 106.6
107.1
WP W WL t-- ----·---------+
85.7 59.4
85.3
39.0 ~r-~+-+-+-+-+-+-+-~
95.0
78.5 74.6 60.5
68.0 ~~'P-' ........ +-+-+-+-+-+-~ 62.9
54.0
59.5
~~:1 4~.1 51.1
COMPLETION DEPTH: 42FT. DEPTH TO WATER IN DATE: APRIL 4 1974 BORING: 30 FT.
FIG.I5-LOG OF BORING 6, SITE D, INTERSTATE HIGHWAY 45 AT NETTLETON STREET, HOUSTON, TEXAS
34

of these highly saturated clays are near the plastic limits which
vary between 10 and 20. The percent of materials that pass the
No. 200 sieve varies between 51% and 80%. These clays are under
lain by a tan and gray clayey silt to the termination depth of
42 ft (12.81 m). The Unified Classifications for the site D soils
are given in Fig. 16. This figure indicates that the siteD soils
are both CL and CH materials. All test data for site D are pre
sented in Table III-4 of Appendix III.
Groundwater Observations.--Observations made in the open bore
holes at site A, two days after drilling was completed, showed
that the borings had collapsed at 22ft (6.71 m) and were dry.
Further observations were made approximately two months later in
an open hole during construction of drilled shafts at the same
site. These observations indicated that the depth to water at
site A was 29.5 ft (9.0 m) below ground surface. This depth was
also verified by previous explorations that were made by the Texas
Highway Department.
Observations made in the open bore holes at site B, 18, 24,
and 36 hours after drilling was completed, indicated that ground
water level at this site was at a depth of 12ft (3.7 m) below the
ground surface. The observed groundwater level was the same after
the 24-hour and 36-hour readings.
The water level reported on the boring logs at site C was de
termined from previously drilled borings at the same site. The
reported level was 29 ft (8.85 m). It was impossible to observe
35

w en
90r-~--.---.--.--~r--~~r-~--~--~~~-
80 r· • _ Oft _ 16ft. 1- 0 - 24ft- 30ft.
~ 70
e - 31.5ft- 37ft. u a:: I ( ) Percent - 6 200 ~ 60
a. ........ 50 X LaJ Q z 40•'
>.... 30 0 i= (/) 20 <(
......
Q.
10
CL
0 8
(48.1) jf.39.
CH
=' 0
OH a MH
0 . I K I • • , , 1 1 , , ,
0 10 20 30 40 50 60 70 80 90 100 110 120
LIQUID LIMIT, WL, PERCENT
FIG.I6- UNIFIED CLASSlFICATION OF SITE 0

the groundwater level at this site at the time since the borings
were located on a pedestrian route, and it was necessary to seal
them immediately after the boring operation was completed.
At site D several observations were made to determine the
groundwater level during the same day the drilling was accomplished.
The 2-hour reading indicated that the water level was at about
1.4 ft (0.43 m) below ground surface. This level was not used be
cause the water in the bore hole did not have enough time to stabi
lize with the actual groundwater level. However, two previously
drilled borings by the Texas Highway Department showed that the
groundwater level was at 10ft (3.05 m) and 30ft (9.15 m). These
two borings are in the same vicinity as site D. The water table
level of 10 ft (3.05 m) was probably a perched water. Therefore,
the 30-ft (9.15-m) water level was used.
Cone Penetrometer N-values and Soil Shear Strength.--Since the
objective of this study is to develop a correlation between the
THD Cone Test N-value and the corresponding soil shear strength,
it is appropriate to summarize these data together on a boring log
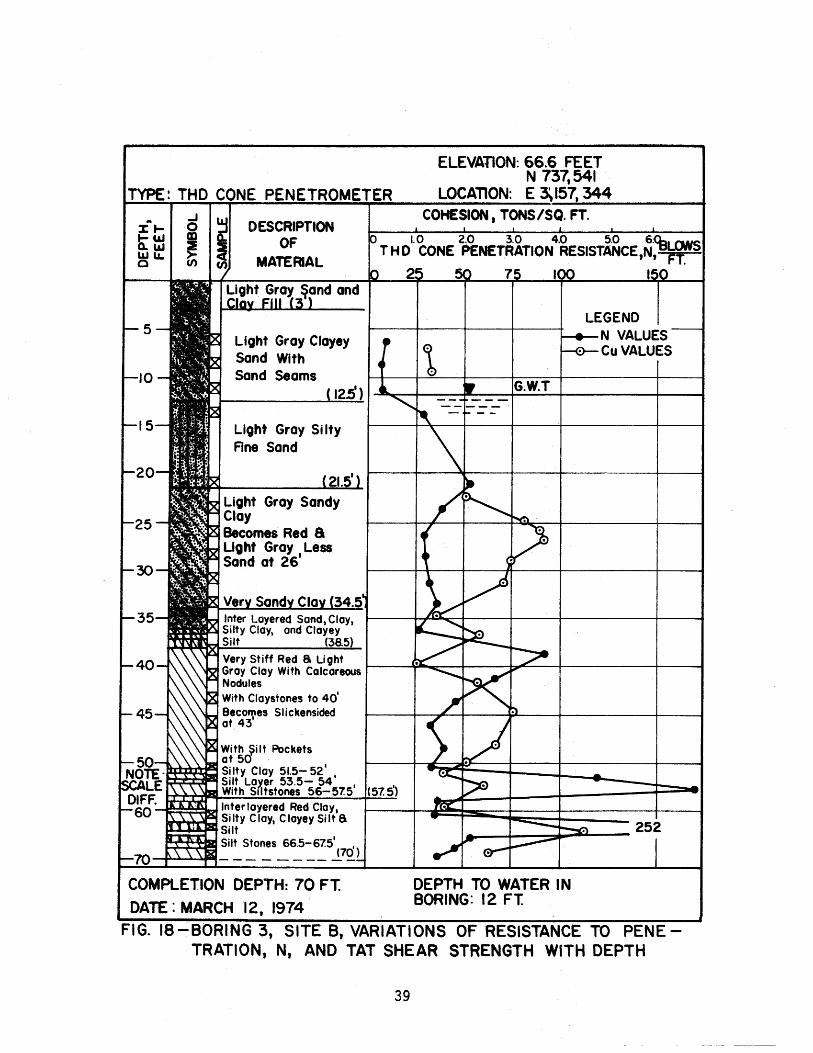
of each test site. Figures 17 through 20 are the profiles of the
resistance to penetration and the unconsolidated-undrained shear
strength. The shear strength was obtained by the Texas Triaxial
Test. The data presented in these figures will be used as the
basis for the correlation of these two parameters. The N-values
that are lower than 100 blows per foot are the actual blow counts
37

ELEVATION·: 231.69 MSL TYPE : THO CONE PENETROMETER LOCATION: LEFT 32' t. STA. 1689+ 70
:r; t-1-Q..W IJ.JW OLJ..
5
...1 C/)
0 ~ CD Q. :! ~ >- <( C/) C/)
DESCRIPTION OF
MATERIAL
very stiff reddish brown clay
-with calcareous nodules below 10.5'
COHESION, Cu, TONS I SQ. FT .
'o '1 '2 13 '4 's 's THO Cone Penetration Resistance N , BLOWS/FT.
0 60 120 180
(16 )f----+----+.......f-----+-----+--.,....f
~~~s71il~ty~cl~a~yl.•a~y~.e~r--~{18~) (20)
si I ty clay Ioyer (22)
becomes brown at 30'
(35)
Hard greenish gray cloy with sand
seams, si It partings
and broken fossi Is.
COMPLETION DEPTH: 46 FT.
DATE: DECEMBER 17, 1973
LEGEND
-+-N VALUES -+-Cu VALUES
DEPTH TO WATER IN BORING: 29.5 FT.
FIG. 17-BORING I, SITE A, VARIATIONS OF RESISTANCE TO PENETRATION, N, AND TAT SHEAR STRENGTH WITH DEPTH
38
TYPE: THO CONE PENETR
DESCRIPTION OF
MATERIAL
Lioht Gray Clayey Sand With Sand Seams
Lloht Gray Silty Ane Sand
Lioht Gray Sandy Clay Becomes Red 8 Ught Gray Less Sand at 26'
Jnter Layered Sand, Clay, Silty Clay, and Clayey Silt
Very Stiff Red 8 Light Gray Clay With Calcareous Nodules With Claystones to 40• Becomes Slickensided at 43'
COMPLETION DEPTH: 70 FT. DATE: MARCH 12, 1974
ELEVATION: 66.6 FEET N 737,541
LOCATION: E 3\157 344
DEPTH TO WATER IN BORING: 12 FT.
LEGEND N VALUES CuVALUES
FIG. 18-BORING 3, SITE B, VARIATIONS OF RESISTANCE TO PENETRATION, N, AND TAT SHEAR STRENGTH WITH DEPTH
39

TYPE: THO CONE PENETROMETER ELEVATION: 50.1 FT. LOCATION: N 700,980
E 3149185 CJ)
~ DESCRIPTION OF
MATERIAL
very stiff light gray and tan sandy cloy(fill)
-I i ght gray with calcareous and ferrous .nodules below ~g·
COMPLETION DEPTH: 31.5'
DATE: MARtH 13, 1974
0 6 THO Cone Penetration Resistance, N, BLOWS /FT.
I I
LEGEND ...e.N VALUES _..CuVALUES
DEPTH TO WATER IN BORING= 29 FT.
FIG.I9-BORING ~r SITE C, VARIATIONS OF RESISTANCE TO PENETRATION, N, AND TAT SHEAR STRENGTH WITH DEPTH
40

ELEVATION: 50.1 FT.
TYPE: THO CONE PENETROMETER N 710 625 LOCATION:. E 3157370
.... I t-tn.w ww CIJ...
DESCRIPTION OF
MATERIAL
very stiff light gray and tan clay slightly
COHESION, C , TONS /SQ. FT.
'o • 1 12 13 14 '5 16
THO Cone Penetration Resistance, N, BLOWS/FT I I
silty with calcareous 1------f-,--------f------+---t and ferrous nodules
-clayey silt 13'-13.5' - c I aye y sand 13.5' -15'1--_ _.,.---..:~f------------1~-----+---1
very stiff light gray f----....._----'~f------------1~-----+---1 and tan sandy clay with co lcareous and ferrous nodules -silty to 24.5'
-very sandy below 30'
light gray clayey sand
G.W.T.
t:·:·.~~::;~·;:·::r--, I ight gray silty -r.::.:}:::~::~::::l8J fine sand
and light gray clay \laye_Ls.!J.!~3'- 43.5'
-~----~----~-----~----1
COMPLETION DEPTH: 42 FT.
DATE: APRIL 5 1974
LEGEND ~N VALUES --+-Cu VALUES
DEPTH TO WATER IN BORING: 30FT.
FIG. 20-BORING 7, SITE 0, VARIATIONS OF RESISTANCE TO PENE
TRATION, N, AND TAT SHEAR STRENGTH WITH DEPTH
41

obtained in the field. However. when N reached 50 blows without
achieving s.ix i~nches penet·ratJon, the. distance penetrated by the
50. b 1 ows was reco.·rde.d-. Si nee~ a numerical value for the full twe 1 ve
i·nches was necessa::ry fo.r the purpose of the correlation, the- fol
lowing equat.i-on wa_s_ used to obtai-n these values_:
N = 5° X 12 i.n. . ·- . . . . . . . . . . . . . . . . . . . . . . . ( 1 )
where N =Penetratio-n re_s·i stance·, in b 1 ows per foot; and 0 = dis ta nee
penetrated. hy 50 blows, in. i·nc.hes.
The values of the unconso li dat:ed .. undrai ned shear strength
which is normally called cohesion,, Cu' we-re computed for the Texas
Triaxial Test as follows:
cu ~ [(::) - "C] X 0.5 ..•••.•.••........•• (2)
where P m = the maximum obs_e_rved lo:ad, i.e.,_ the sum of the vertical
load induced by the- confining pressure and the applied vertical
load in· tons; Ac =·the corrected area in square feet; crc = the con
fining_ pressure in tons_ per square fo_ot; and Cu = the cohesion in
tons per square foot.
The results that are tabula-ted. in Appendix I I I for the other
two types of triaxial tests were obtained using the following
equation:
CU =(::) X 0.5 ........................ {3)
where Pv =the applied vertical load_ in tons; Ac =the corrected
area in square feet; and Cu = the cohesion in tons per square foot
42-

The difference between equation 2 and 3 is due to the initial
state of stress upon confinement. In the case of the Texas Triaxial
Test the initial state of stress is anisotropic. On the other hand,
the initial state of stress for the other two triaxial tests is iso
tropic.
The results of the multi-stage type triaxial tests are pre
sented in Figs. IV-1 through IV-20 in Appendix IV. These figures
show the failure envelope for the unconsolidated-undrained tests.
43

ANALYSIS OF TEST RESULTS
Comparisons of resistance to penetration, N, and the uncon
solidated-undrained shear strength, Cu, have been presented in
Figs. 17 through 20. Since the relationship between these two
parameters is not always constant, it i·s necessary to discuss the
factors influencing each parameter before a correlation is attempted.
Factors Affecting Resistance to Penetration, N.--The magnitude
of the N-value reflects the ease with which the THO cone penetrates
the subsoil. As previously stated, the action of the cone was
examined by recovering the subsoil with a push barrel. The examina
tion of the soils re.covered at sites B, C, and D, respectively,
showed that the moving cone created a cavity. This action probably
caused the soil to have both a lateral and an upward movement. The
amount of these movements is probably dependent upon the soi 1 type,
degree of compactness, the overburden pressure, and the degree of
saturation.
Desai {6) reported that the upward displacement of the subsoil
will occur until a certain depth or surcharge pressure is reached
which will no longer permit such displacement. Furthermore, at
depths where the upward displacement becomes small, the lateral
displacement will form an important part of the total displacement.
Desai (6) therefore concluded that density, structure, depth and
location of the groundwater table will have an effect on the resis
tance to penetration. The available data from this study have been
44

analyzed to investigate the effect of the overburden pressure,
dry unit weight, and the degree of saturation on the magnitude of
the resistance to penetration N-value. In addition, it was ob
served while studying the data that the amount of sand in the soil
influenced the magnitude of the N-value. This was especially true
at site C below the 25-ft (7.625-m) depth, at siteD below the 30-ft
(9.15-m) depth, and at site B between the 21.5-ft (6~56-m) depth and
the 34.5-ft (10.52-m) depth. A definite conclusion concerning the
effect of any one of these properties (overburden pressure, dry
unit weight, degree of saturation, or per cent sand content) is
not possible because of the scatter of the results.
At site A high~values of N, that is, greater than 100 blows
per foot, were obtained below the 30-ft (9.15-m) depth. Although
the clay below this depth has relatively high dry unit weights
and contains 20% to 30% sand, these two factors alone may not
explain the high N-values for the following reasons:
1. The sand is primarily calcium carbonate which is rela
tively soft compared to quartz sand; and
2. High dry unit weight is also found at the 7-ft (2.14-m)
depth at the same site, and the N-value is only 34 blows
per foot even though the degree of saturation is about
the same.
45

Therefore·, the contri:bution of these two factors to the high N-va 1 ue
is small. However, the· cone penetration test was conducted below
the, groundwa·t~er· table when the 30-ft (9.15-m-) dep:th ·was reached,
and this. may explain the high N-values. Gene.ra 1 Ty, at. all sites
an increase in the. N-value was- observed· when the THO Cone Penetro
meter Test wa.s conducted belo.w the· gra:undwater table.. A large
portion of the driving en·ergy is p:roba-bly transmitted to the pore
water and caus·es the N-value: to increase·. According to Sanglerat
(20), in· impervious, saturated cohesive soils below water table the
resistance to: penetration is. mostly due to skin friction and the
resistance of the pore wate.r· under sudden impact. Other researchers
(6, 22) reported that. f-r'iction was· appreciable in saturated loose
sands and all types of clay soils as well a_s in strat·ified deposits.
However, the diameter of the cone used in these studies (6·, 22) was
either equal to or smaller than the drill pipe. which was attached
to the cone, whereas, the THD cone p·enetrometer has a 1 arg·er dia
meter than the drill pipe to which it is attached. Also the side
contact area is relatively smal 1 and. the side· friction is 1 ikely
to be sma 11 compared to point resistance (see- Fig. l). Therefore,
it waul d seem appropriate to correct the N-va 1 ues for the influence
of the water table. However, it was not possible to establish a
correction for the N-value in this study because of the limited
amount of data available.
46
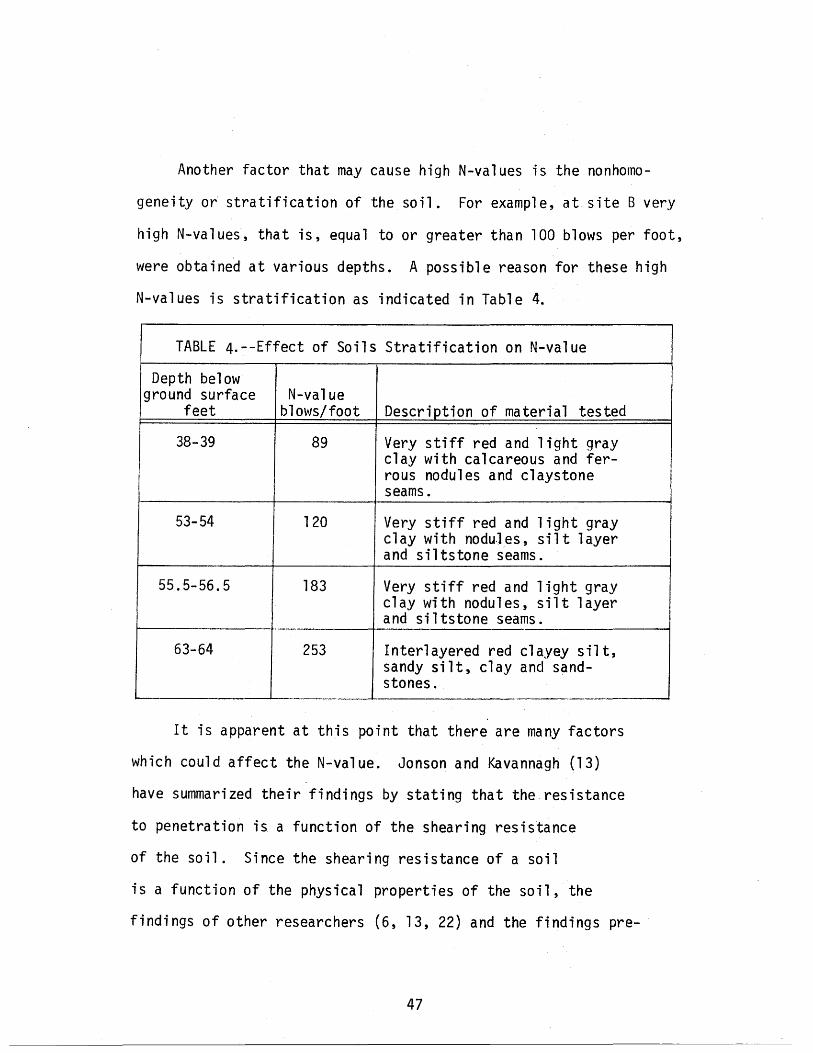
Another factor that may cause high N-values is the nonhomo
geneity or stratification of the soil. For example, at site B very
high N-values, that is, equal to or greater than 100 blows per foot,
were obtained at various depths. A possible reason for these high
N-values is stratification as indicated in Table 4.
TABLE 4.--Effect of Soils Stratification on N-value
Depth below ground surface N-value
feet blows/foot Descri_2tion of material tested
38-39 89 Very stiff red and light gray clay with calcareous and fer-rous nodules and claystone seams.
53-54 120 Very stiff red and light gray clay with nodu-les, silt layer and siltstone seams.
55.5-56.5 183 Very stiff red and light gray clay with nodules, silt layer and siltstone seams.
63-64 253 Interlayered red clayey silt, sandy silt, clay and sand-stones.
It is apparent at this point that there are many factors
which could affect theN-value. Jonson and Kavannagh (13)
have summarized their findings by stating that the resistance
to penetration is a function of the shearing resistance
of the soil. Since the shearing resistance of a soil
is a function of the physical properties of the soil, the
findings of other researchers (6, 13, 22) and the findings pre-
47
sented from this study are consistent. The factors which affect
the N ... value are obviously int,er-related, and it is difficult, if
not impossible, to is.olate a single, most important factor.
Factors Affecting Soil ShearStrength.--The quick test re
s:ults that were obtained in this study indicate that most soils en
countered at the four site.s are primarily stiff to very stiff clays.
Some of these clays are e-ither fissured, as in the case of the clay
at site A below the: 30--ft (9.15-m) depth, or slickensided as in the
case at site B, at various depths. The results of the laboratory
tests used to determine the strength of these soils may not repre
sent the actual strengths of the soils in situ. Apart from the test
method used, the most important factor that influences shear strength
is the soil structure. According to· Hvorslev (11), the average
strength may be subjected to considerable although slowly progressing
change when the stress condition is altered. Laboratory tests will
give low strengths when planes of failure in the test specimen
follow joints or slickensi·des, and high shear strengths when planes
of failure and joints intersect each other.
The results that were obtained by the Texas Triaxial Test will
be compared in a relative way with the results obtained by the
ASTM Triaxial Test which is currently used in most soil mechanics
laboratories. Hhen conducting the ASTM Triaxial T~st, the soil
is failed by increasing the vertical pressure while holding the con
fining pressure constant. The confining pressure causes all surfaces
of the soil sample to be stressed equally. However, when conducting
48
the Texas Triaxial Test, the confining pressure does not cause all
surfaces of the soil sample to be stressed equally. In fact, it
causes the soil sample to be extended because the vertical pressure
is initially less than the confining pressure. It was observed
during testing that the vertical pressure varied linearly with the
confining pressure for a specific type of soil. However, when the
same confining pressure was applied to a different type of soil, the
magnitude of the vertical pressure changed.
During any quick triaxial testing the vertical pressure is in
creased rapidly enough that there is not sufficient time for water
movement to occur as the soil sample is deformed. This is especially
true for low permeable soils such as the clay soils used in this
study. This type of loading was used to obtain the shear strength
data in this study regardless of the type of triaxial test used.
As mentioned previously, this test is called the unconsolidated
undrained triaxial or quick test. During a ·quick· test the
natural water content of a clay soil should not change. However,
it was noted that for 18 of the soil samples tested in this study,
the moisture content after the Texas Triaxial Test was completed was
less than the initial value, indicating a loss of water during
testing. A typical example showing change of water· content can be
found in Appendix III, site B, sample number 38. It was also
observed, especially during testing of the silty clays, that the
fines mixed with water tended to be squeezed out when the confining
pressure was applied and when the vertical pressure was increased.
49
The undrained condition did not occur during the testing
of these 18 specimens. Therefore, the Texas Triaxial Test
does not always provide unconsolidated-undrained conditions.
Normal procedu,re for reducing the data from a multi -stage
triaxial test is to plot the Mohr's circles representing the state
of stress of failure for each confining pressure and then draw the
failure envelope tangent to the Mohr's circles. A horizontal
failure envelope indicates the existence of the ~ = 0 condition.
This was demonstrated when the multi-stage Transmatic Test was per
formed on a highly saturated clay sample as shown in Fig. IV-3 in
Appendix IV. Furthermore, the samples tested in the AST~,1 tri
axial device, as shown in Figs. IV-10, IV-11, IV-13 and IV-16 of
Appendix IV, respectively, show that the ,S = 0 condition existed.
However, for all samples tested in the Texas Triaxial device as a
multi-stage test, the~ = 0 condition did not exist.
In general, the ~ = 0 condition does not occur for a partially
saturated soil. For example, Fig. IV-15 in Appendix IV shows the
results for a sample with 85% saturation tested in the Transmatic
Triaxial device. These results demonstrate the expected Mohr failure
envelope for a partially saturated soil. The deviator stress at
failure is found to increase with increasing confining pressure.
However, this increase becomes progressively smaller as the air in
the voids is compressed and passes into solution and ceases when
the stresses are large enough to cause full saturation (3).
50
It is evident at this point that the TAT allows partial
drainage and does not duplicate the undrained condition. The
magnitude of the shear strength obtained by this test is high when
compared with the ASTM Triaxial results. This comparison is
shown in Table III-5 of Appendix III. The reasons for the higher
values of shear strength obtained by the TAT test are probably
due to a combination of the following:
1. The Texas Triaxial device has a membrane which is
four times as thick as the membrane used with the
ASTM Triaxial device. The thicker membrane
induces extra compressive strength which is a function
of the stiffness of the membrane used.
2. The Texas Triaxial device allows some soils to lose water
during testing. This is particularly true for the CL-Sa and
CL-Si soils. The loss of water will cause a decrease
in water content and a corresponding increase in strength.
3. The friction which occurs between the upper cap and the
membrane causes the observed proving ring reading which
is a function of the confining pressure to be higher. This
induced strength is not a part of the soil shear strength.
A separate correction for each of the above mentioned factors
is beyond the scope of this study, but a cumulative correction
based on the results of the ASTM Triaxial Test can be made. During
this study, a limited number of paired samples were tested by the TAT
and the ASTM methods. Specifically, 3 pairs of CH-H, 5 pairs of
51
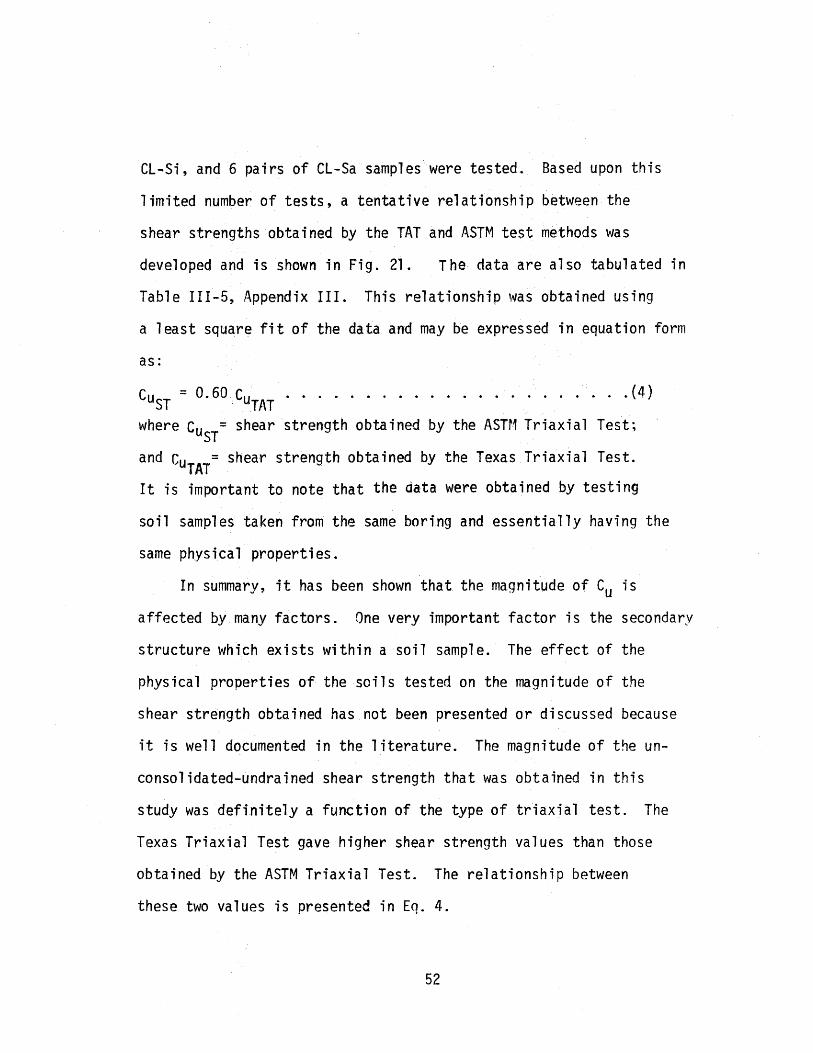
CL-Si, and 6 pairs of CL-Sa samples were tested. Based upon this
limited number of tests, a tentative relationship between the
shear strengths obtained by the TAT and ASTM test methods was
developed and is shown in Fig. 21. The data are also tabulated in
Table III-5, Appendix III. This relationship was obtained using
a 1 east square fit of the data and may be expressed in equation form
as:
C = 0 60 c uST . · UTAT . . . . . . . . . . . . . ( 4)
where Cu =shear strength obtained by the ASTt1 Triaxial Test; ST
and CuTAT= shear strength obtained by the Texas Triaxial Test.
It is important to note that the data were obtained by testing
soil samples taken from the same boring and essentially having the
same phys ica 1 properties.
In summary, it has been shown that the magnitude of Cu is
affected by many factors. One very important factor is the secondary
structure which exists within a soil sample. The effect of the
physical properties of the soils tested on the magnitude of the
shear strength obtained has not been presented or discussed because
it is well documented in the literature. The magnitude of the un
consolidated-undrained shear strength that was obtained in this
study was definitely a function of the type of triaxial test. The
Texas Triaxial Test gave higher shear strength values than those
obtained by the ASTM Triaxial Test. The relationship between
these two values is presented in Eq. 4.
52

5
'+-U)
4 ..... ........ en w 1-
..J 3 <t X <[ -a: 1- 2
:;! 1-en <t II I t;
:::J u
0
---·-·---------------·-'- ------------ --------
SYMBOL SOl L TYPE
0 CH-H
0 CL- Si
0 CL- Sa
Cu ST
= 0.6 cu TAT
r = 0.88
0
0 I. 2 3 4 5
c = UTAT
TEXAS TRIAXIAL TEST, tsf
FIG. 21- RELATIONSHIP BETWEEN TEXAS TRIAXIAL AND ASTM TRIAXIAL SHEAR STRENGTH
( I tsf = 9.58 X I 0 4 N /m 2)
53

Corr-elation of Resistance to Penetration, N, with Soil Shear
Strength, Cu.---As previously indicated in Figs. 17 through 20, when
both N and Cu are· plotted versus depth, a relatively 1 inear rela
tionship exists between these two parameters. This relationship
is not as evident in Fig. 18 for the case of the erratic soil at
site B.
If a linear relationship does exist between Nand Cu, the best
way to correlate these two parameters is to evaluate the constant
of proportionality as given in the following equation:
Cu = KN. • . • • • • • • • • . • . . . . ( 5)
where K = constant of proportionality; N = THD cone resistance to
penetration in blows per foot; and Cu =unconsolidated-undrained
shear strength in tons per square foot.
A statistical procedure was used to evaluate the constant of
proportionality. This was accomplished as follows:
1. The soils were placed into groups of similar properties.
2. Using all available data, plots of Cu versus N were made
for each group.
3. A best fit linear curve was established using the least
square method.
The first step in the correlation was to place the soils into
groups of sim.ilar properties. The Unified Soil Classification System
was employed to group the soils initially, as stated in the objective.
However, analysis of the data revealed that all CH materials could
not be placed into one group. The penetration resistance for CH
54
materials that contain secondary structure such as joints, fissures, or
slickensides in this study were generally in excess of 100 blows per
foot. Also, as mentioned previously, the shear strength values ob
tained in the laboratory for these soils do not necessarily represent
the strength of the soil in situ. On the other hand, the CH materials
that did not contain secondary structure (herein called homogeneous CH)
had N-values that did not in general exceed 50 blows per foot. In
addition the shear strength values determined in the laboratory are
considered an acceptable representation of the in situ soil strength.
Therefore, the CH materials were divided into two subgroups. These
subgroups are the homogeneous CH soils and the CH soils with secondary
structure. As far as the CL materials group was concerned, high N
values were associated with either stratified CL soils or with the
amount of sand present in the sample. Following the practice of group-
ing the soils according to similar properties it was considered
appropriate to divide the CL materials into three subgroups. These are
the silty CL soils, the sandy CL soils, and the stratified CL soils.
The SC soils were not divided into subgroups since only a limited
amount of datawere obtained for SC soils in this study.
The second step in the correlation was to plot Cu versus N for
each subgroup. Cu values obtained in the laboratory from both the
Texas Triaxial Test (TAT) and the ASTM Triaxial Test (ST) were
used. TheN-values were determined by doubling the number of blows
for the 6 inches (152.4 mm) of penetration that occurred in close
proximity of the soil sample used to obtain the C value. The u
55

reasons for determining theN-values in this manner are as follows:
1. Exp:.erience .has shown that, i>n normally consolidated clay, the
number of blows re·quir·ed for the first and second 6 inches
(l52.4 mm) are ~gene:·ra11y the same (5).
2. The sample used to determi·ne .the Cu value represents
approximately six inches (152.4 mm) of the soil tested
by.the THO Cone Penetrometer Test.
3. The ·N-value obtained for a 6-in. (152.4 mm) penetration
can be realistically compared with the Cu value obtained
for a soil sample taken from the same depth in a soil
boring.
All data for the homo:g;eneous CH soils are summarized in Table 5
and plotted in Fig. 22. Also, in Fig. 22the curves representing the
least square fit for both the Texas Tr·iaxial Test and the ASTM
Triaxial Test data are shown. The scatter in the data is probably
due to a combination of the factors affecting both N and Cu as
discussed previously. The slope of the curves represent the constant
of proporti-onality, K, as presented in Eq. 5. The equation
for the TAT data may be written as follows:
Cu = 0. 11 N . . . . . . • • . . . . TAT
. . ( 6)
Equation 6 may be used to predict the shear ·strength based on the
Texas Triaxial Test if the resistance to penetration, N-value, is
available, and provided that the soil tested is a homogeneous CH
soil. In order to predict the shear strength based on the ASTM
56

TABLE 5.--Homogeneous CH Soils
cu values, TSF Site and N-value
sample number blows per foot TAT ST
* 32 4.50 --* 32 -- 3.43
A-3 36 4.54 --
* 32 4.28 --
* 32 -- 2.00
A-4 32 3.17 --
* 32 1.14 --
* 30 -- 2.43
* 22 1.81 --
A-8 22 2.82 --
* 22 4.71 --* 22 -- 1.58
* 22 2.27 --A-9 18 2.32 --* 18 3.01 --
* 20. -- 1.75
* 20 1.92 --* 24 -- 1.78
* 20 1.95 --
* 18 -- 1.19
(Continued)
57

TABLE 5-CONTINUED.--Homogeneous CH Soils
Site and N-value Cu values, TSF
sample number blows per foot TAT ST
A-13 12 1.47 --A-15 18 -- 1.51
A-16 18 2. 21 --* 28 1.50 --* 28 -- 0.93
A-19 14 1.45 -·-
* 14 -- 0.82
* 14 1.94 --A-22 12 1.25 --* 12 -- 0.38
* 12 1.27 -·-
* 12 1.24 -·-
* 20 1.50 --* 18 -- 0.90
A-23 12 0.74 --B-30 28 2.68 --B-39 32 -- 1.33
B-40 32 2.47 --B-43 30 -- 1.62
C-1 10 1.78 --C-6 16 1.99 --
(Continued)
58

TABLE 5-CONTINUED.--Homogeneous CH Soils
Cu values, TSF Site and N-value
sample number blows per foot TAT ST
C-8 20 -- 1.63
C-9 18 2.05 --C-10 18 -- 1.50
D-1 10 1.03 --
D-2 22 -- 1.03
D-3 18 1.80 --D-7 24 1.92 --
*From previous THD research studies
Note: 1ft- .305m; 1 TSF = 9.58 x 10⁴ .. N/m2
59

7.5
"- 70 (f)
1-;; 6.5
0 • ~ 6.0 (!) ~·.
Cu(ST)= 0.07N
z ' .... 55'
LEGEND ...,..TAT ..... sr
a: t(1) 5.0 a: ~ 45 :E (/)
0 4.0 l&J
~ 3.5 <[ a: ~30 :::)
• 0 2.5 LLI
~ 2.0 0 ..J 1.5 0 en z
1.0 0 u z :::) Q5
0 0 20 40 so eo 100 120 140 t6o 1ao 200 220 240
RESISTANCE TO PENETRATION, N, BLOWS PER FOOT
FIG. 22 CORRELATION BETWEEN UNCO.NSOLIDATED UNDRAINED SHEAR.STRENGTH AND RESISTANCE TO PENETRATIO:N FOR HOMOGENEOUS CH SOILS (ITSF=9.58 x lo4Ntm·~ lft.=.305m.)
60

Triaxial Test a constant of proportionality of 0.07 should be
used, and eq. 5 becomes:
C = 0.07 N •••• uST
.(7)
All of the data for the CH soils with secondary structure are
presented in Table 6 and plotted in Fig. 23. There is considerably
more scatter of the data in this case when compared with the homo
geneous CH soils. This is due to the difficulties associated with
determining the shear strength for clays that have a secondary
structure. Also, as noted previously, the majority of the N-values
were obtained below water table. From a practical point of view,
it may not be proper to fit a curve to these data. However, if a
best fit curve is used for the Texas Triaxial Test data the re-
sulting equation is:
C = 0.02 N • uTAT
. . . • • . • ( 8)
The best fit curve for the ASTM Triaxial Test data is represented
by the following equation:
C = 0.018 N • uST
• • . • • . . • . . . • . . • . . ( 9)
These curves and corresponding equations were also obtained using
the least square method.
The data for the silty CL soils are given in Table 7 and
plotted in Fig. 24. The silty CL soils are those clays which con
tain less thM 20% of material retained on the No. 200 sieve and do
not con~in sand or silt seams. The choice of less than 20%
61

TABLE 6.--CH Soils With Secondary Structure
Site and N-value Cu values, TSF
sample number blows per foot TAT ST
A-24 104 -- 0.55
A-25 104 0.44 --* 104 -- 2.09
A-26 134 3.99 --
A-27 172 3.06 --* 120 -- 1.70
A-28 150 3.52 --A-29 150 -- 2.35
* 200 -- 3.52
* 200 3.55 --* 184 -- 2.95
A-31 184 2.71 --* 155 -- 2.96
* 126 4.52 --* 126 -- 4.50
A-30 184 2.93 --A-32 240 4.04 --
A-33 184 2.42 --* 184 --.(_ 3.45
* 212 -- 2.80
(Continued)
62

TABLE 6-CONTINUED.--CH Soils With Secondary Structure
Site and N-value Cu values, TSF
sample number blows per foot TAT ST
* 200 3.63 --* 153 4.34 --* 134 -- 1.66
* 134 4. 24 --* 134 -- 4.40
* 134 -- 3.25
* 121 4.35 --* 108 -- 3.70
B-22 118 2.06 --B-23 70 2.31 --B-25 46 -- 1.67
B-27 40 3.06 --B-37 120 2.44 --B-38 184 2.27 --
*From previous THO research studies
Note: 1 ft - .305m; 1 TSF = 9.58 x 10⁴ N/m2
63

~
:::J u ~ 6.0
J: 1-(!). 5.5 z L&J a: 5.0 ...... V)
a: 4;5 c:s: L&J X 4.0 V)
0 LtJ 3.5 z Ci a: 3.0 0 z :::) 2.5
I Q
LtJ 20 .... c:s: 0
1.5 ..J
~ z J.O 0 0 z Q5 :::)
0 0
•
•
• •
•
.. • •
LEGEND ........_. TAT _.,_ ST
20 40 so eo 100 120 140 tso tao zoo 220 240 260
RESISTANCE TO PENETRATION, N, BLOWS/ FOOT
FIG. 23 CORRELATION BETWEEN UNCONSOLIDATED UNDRAINED SHEAR STRENGTH AND RESISTANCE TO PENETRATION FOR CH MATERIAL WITH SECONDARY STRUCTURE (ITSF = 9.58 x 10⁴ Nlm2 , I ft. =.305m.)
64
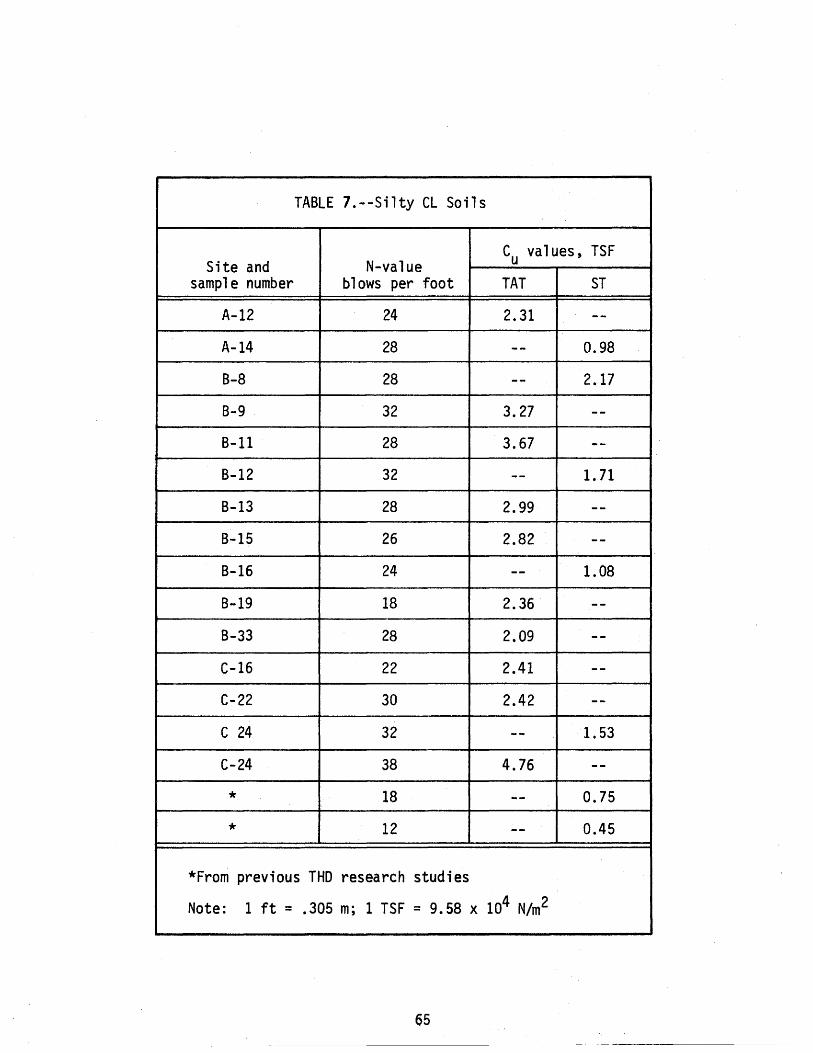
TABLE 7.--Silty CL Soils
Site and N-value Cu values, TSF
sample number blows per foot TAT ST
A-12 24 2.31 --A-14 28 -- 0.98
B-8 28 -- 2.17
B-9 32 3.27 --
B-11 28 3.67 --B-12 32 -- 1.71
B-13 28 2.99 --
B-15 26 2.82 --
B-16 24 -- 1.08
B-19 18 2.36 --B-33 28 2.09 --C-16 22 2.41 --C-22 30 2.42 --
c 24 32 -- 1.53
C-24 38 4.76 --
* 18 -- 0.75
* 12 -- 0.45
*From previous THD research studies
Note: 1 ft = .305m; 1 TSF = 9.58 x 10⁴ N/m2
65
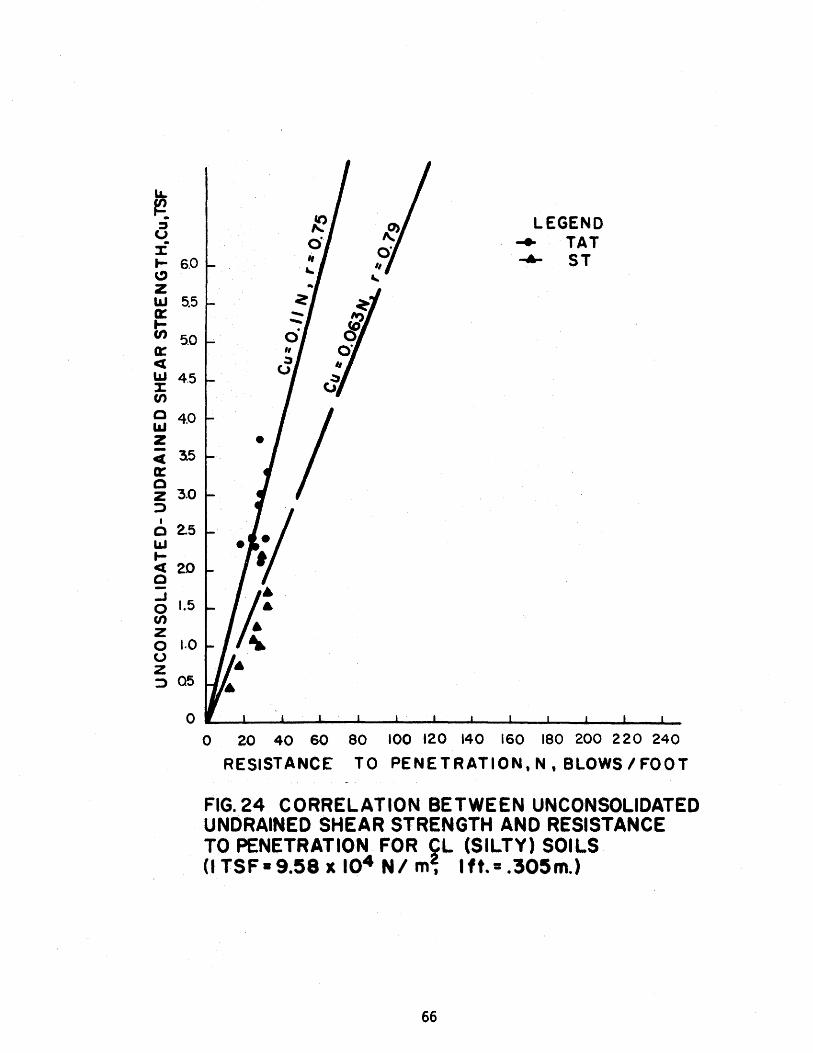
~ ::t u 3! .... 6.0 C)
z LIJ 5.5 Ck: t;
5.0 a: c:r; ~ 4.5 en ~ 4.0 z c 3.5 a:: 0 z 3.0 :::»
I
0 2.5 LaJ t-c:r; 20 0 ..J 0 1.5 Cl)
z 0 1.0 u z ::> 05
LEGEND -+ TAT ....,_ ST
o 20 40 so eo 100 120 140 160 1eo 2oo 220 240
RESISTANCE TO PENETRATION,N, BLOWS/FOOT
FIG. 24 CORRELATION BETWEEN UNCONSOLIDATED UNDRAINED SHEAR STRENGTH AND RESISTANCE TO PENETRATION FOR ~L (SILTY) SOILS (I TSF • 9.58 x 10• N I m, I ft.= .305m.)
66

retained on the No. 200 sieve is based on the data presently available
from this study. This percentage may cha.nge when more data are
available. As shown in Fig. 24 a fairly good linear relationship
exists between Cu and N for the silty CL clays. The linear relation
ship is better for the ASTr~ Triaxial Test data. T·he appropriate
equations obtained using the ·least square method for the silty CL
soils are as follows:
Cu = 0.11 N. TAT
.(10)
Cu = 0.063 N. ST
. . . . . . . . . . . . . . . . . . . . . . .. (11)
The data for the sandy CL soils are given in Table 8. Fig. 25
presents the results of the correlation for the sandy CL soils. The
sandy CL soils are those clays that contain more than 20% of material
retained on the No. 200 sieve and do not contain sand or silt seams.
The appropriate equations for the data available in this subgroup
are as follows:
C = 0.095 N uTAT
.(12)
C = 0.053 N. UST
.(13)
It should be noted that the correlation for the sandy CL soils is
not as good as the correlation for the silty CL soils; that is,
there is more scatter in the data for the sandy CL soils. Also,
for practical purposes, the constant of proportionality is essen
tially the same in both cases. However, the correlation for both
the silty and the sandy CL soils has been presented because the
67
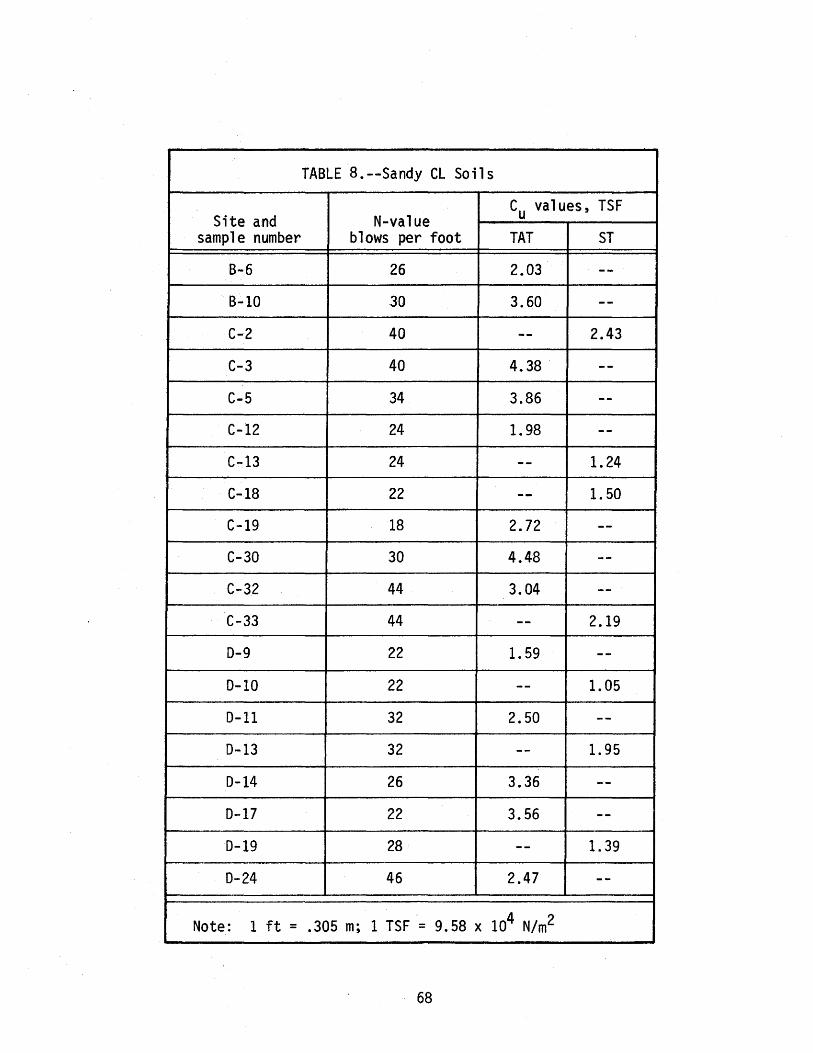
TABLE 8.--Sandy CL Soils
Site and N-value Cu values, TSF
sample number blows per foot TAT ST
8-6 26 2.03 --8-10 30 3.60 --
C-2 40 -- 2.43
C-3 40 4.38 --C-5 34 3.86 --C-12 24 1.98 --
C-13 24 -- 1.24
C-18 22 -- 1.50
C-19 18 2.72 --C-30 30 4.48 --C-32 44 3.04 --C-33 44 -- 2.19
D-9 22 1.59 --
D-10 22 -- 1.05
D-11 32 2.50 --
D-13 32 -- 1.95
D-14 26 3.36 --D-17 22 3.56 --
D-19 28 -- 1.39
D-24 46 2.47 --
Note: 1 ft = .305 m; 1 TSF = 9.58 x 10⁴ N/m2
68
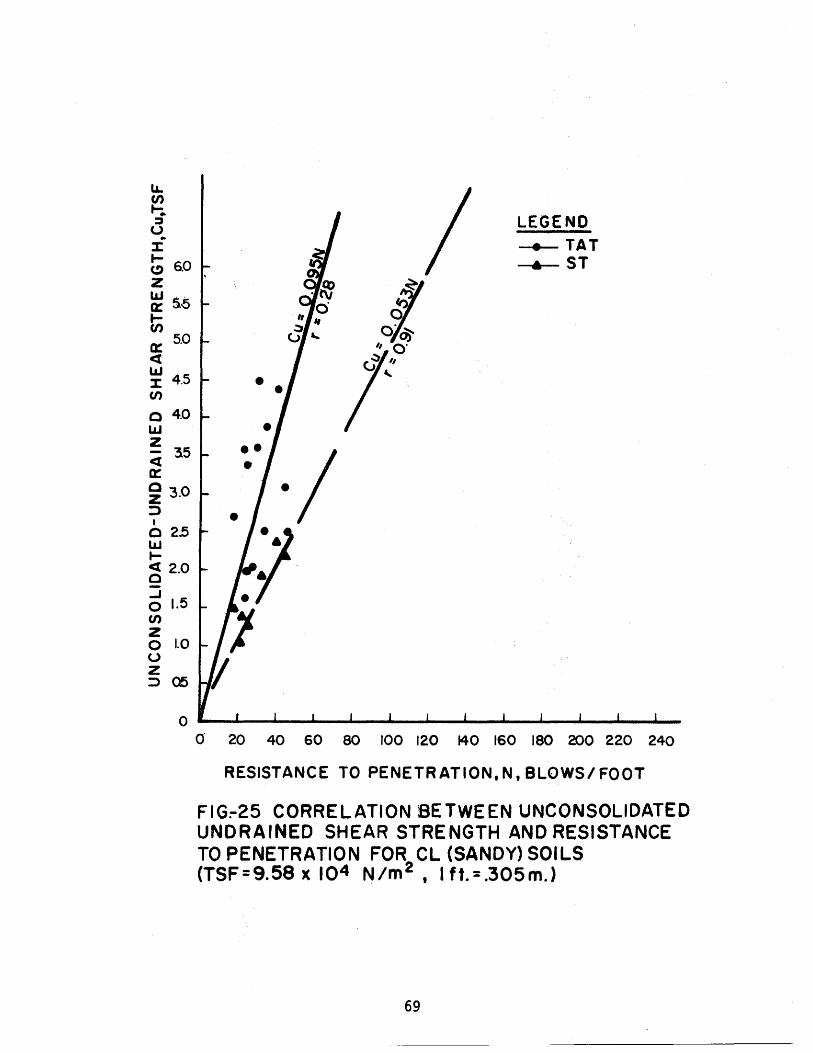
LL (/) t-;. ::I u .. l:
:; 6.0 z ~ 5.5 ..... (/)
a: 5.0 <[ UJ l: 4.5 en 0 4.0 UJ z <i 3.5 a: ~ 3.0 :::» I
0 2.5 L&J ..... <[ 2.0 0 -..J 0 1.5 (/)
z 0 1.0 u z :::>05
LEGEND ~TAT
• ST
0 --~--~~--~--~~--~--~~--~-------0' 20 40 60 80 100 120 140 160 180 200 220 240
RESISTANCE TO PENETRATION,N, BLOWS/FOOT
FIG:-25 CORRELATION BETWEEN UNCONSOLIDATED UNDRAINED SHEAR STRENGTH AND RESISTANCE TO PENETRATION FOR CL (SANDY) SOILS (TSF=9.58 x 10⁴ Nlm 2 , I ft.=.305m.)
69
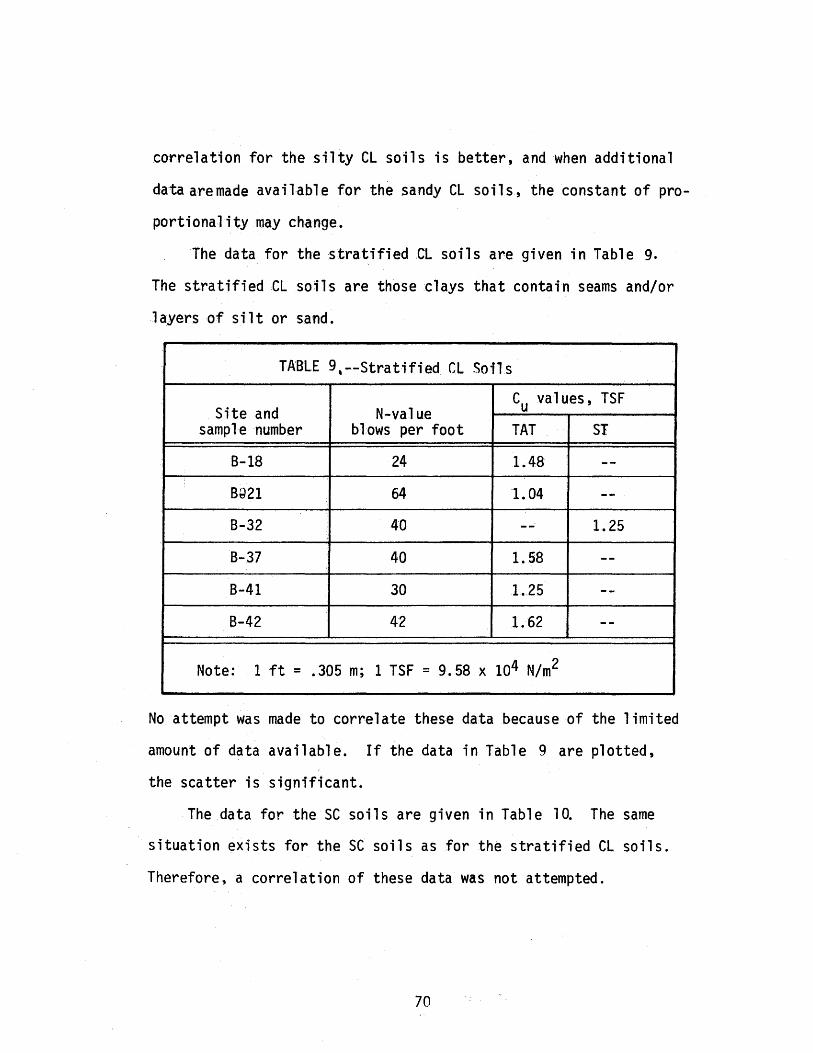
co~rrelation for the silty CL soils is better, and when additional
data aremade available for the sandy CL soils, the constant of pro
portionality may change.
The data for the :stratified CL soils are given in Table 9.
The stratified CL soils are those clays that contain seams and/or
layers of silt or sand.
TJ\BLE 9,--Stratified GL Soils
cu values, TSF Site and N-value
sample number blows per foot TAT SI
B-18 24 1.48 --BQ21 64 1.04 --B-32 40 -- 1.25
B-37 40 1.58 --B-41 30 1.25 --
B-42 42 1.62 --
Note: 1 ft = .305 m; 1 TSF = 9.58 x 10⁴ N/m2
No attempt was made to correlate these data because of the limited
amount of data available. If the data in Table 9 are plotted,
the scatter is significant.
The data for the SC soils are given in Table 10. The same
situation exists for the SC soils as for the stratified CL soils.
Therefore, a correlation of these data was not attempted.
70

TABLE 10.--SC Soils
Site and N-value Cu values, TSF
sample number blows per foot TAT ST
B-1 12 1.23 --B-2 8 1.31 --B-3 8 1.09 --B-4 8 -- 0.98
C-34 54 3.55 --D-6 24 1.51 --D-23 34 -- 2.03
Note: 1 ft = .305 m; 1 TSF = 9.58 x 10⁴ N/m2
Equations 7, 11, and 13 are applicable with N-values obtained
by the THD Cone Penetrometer Test. However, Touma and Reese (30)
have developed a relationship between the N-values obtained by the THO
Cone Penetrometer Test and N-values obtained by the Standard Penetra
tion Test (SPT). For clay soils the relationship is:
NSPT = 0·7 NTHD (14)
By combining .~qs. 7, 11, and 13 with F.q. 14 the followinq
equations are obtained:
CUST = O.l NSPT (homogeneous CH soils) (1 5)
CusT = 0.09 NSPT (silty CL soils) (16)
CusT = 0.076 NSPT (sandy CL soils) (17)
Equations 15, 16, and 17 are shown graphically in Fig. 26.
71
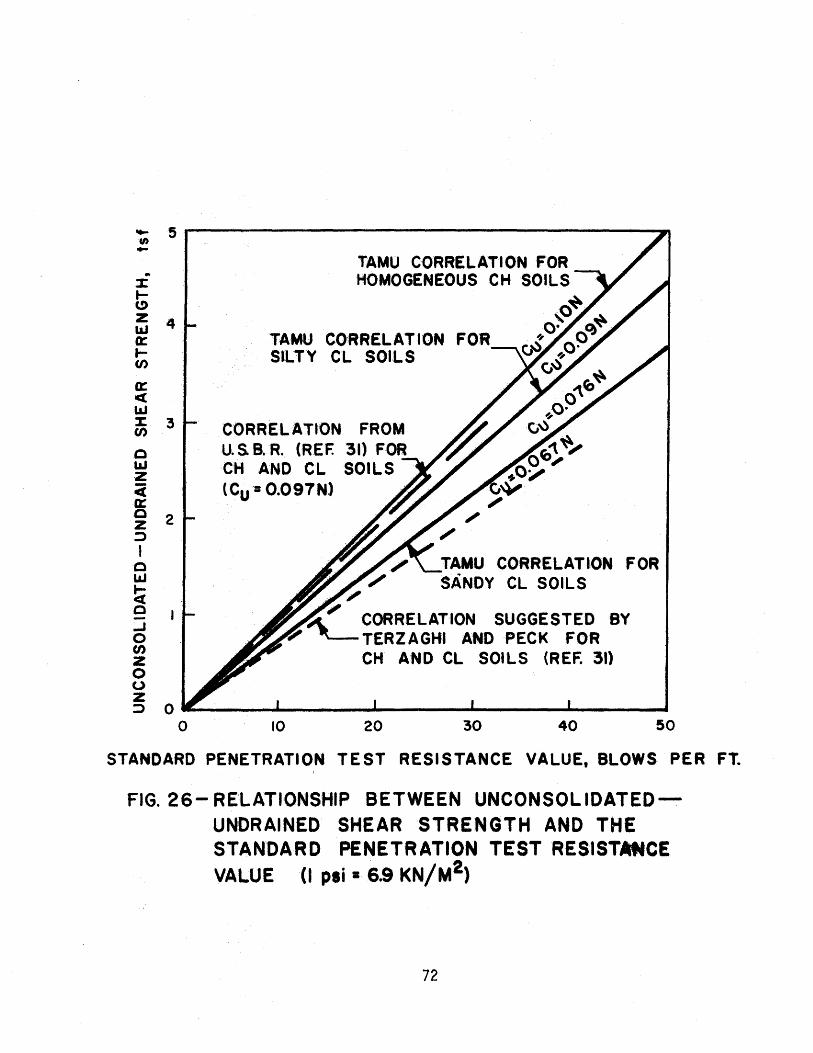
.... 5--------------------.... ., ... ..
X ... C!)
z 4 ~ TAMU CO:RRELATION t;) SILTY CL SOILS
a:: C( LLI ~ 3
0 LLI z Ci 0: 0 2 z ::> I
0 LLI
~ 0 ..J 0 f/) z 0 u z
CORRELATION FROM U.S. B. R. (REF. 31) FOR CH AND CL SOILS (Cu'= 0.097N)
FOR
::> 0 _____ _..... _________ _..... ___ ....._ __ ___
0 10 20 30 40 50
STANDARD PENETRATION TEST RESISTANCE VALUE, BLOWS PER FT. I
FIG. 26- RELATIONSHIP BETWEEN UNCONSOLIDATEDUNDRAINED SHEAR STRENGTH AND THE STANDARD PENETRATION TEST RESISTMfCE VALUE (I psi • 6.9 KN/M2)
72

Also shown in Fig. 26 are a correlation curve developed by U.S.B.R.
(31) and another curve given by Terzagh1 and Peck, both curves
being for CHand CL soils. The lines representing Eqs. 15, 16, and 17
are in good agreement with the correlations of the U.S.B.R. and
Terzaghi and Peck. Equations 15, 16, and 17 were developed so
that the results of this study can be used with N-values obtained
by the Standard Penetration Test. However, it is not recommended
that these results be used in geographical areas where comparative
studies have not been made.
In summary, the soils investigated in this study were divided
into groups according to similar behavior. It has been shown that
a linear relations,hip exists between THD cone penetrometer N-value
and Cu values obtained by either the Texas Triaxial Test or the
ASTM Triaxial Test for several of the soil groups. Using
the least square method K values were determined for use in Eq. 5.
In addition, equati.ons were developed which relate the unconsolidated
undrained shear strength, CusT' to the Standard Penetration Test
resistance value, NSPT' for homogeneous CH, silty CL, and sandy
CL soils. The quick shear strength for these three soil groups
can be predicted using the N-value obtained by either the THO
Cone Penetrometer or the Standard Penetration Test.
73

CONCLUSIONS AND RECOMMENDATIONS
Conclusions--Improved correlations have been developed be
tween the Texas Highway Department Cone Penetrometer Test N-values
and unconsolidated-undrained shear strength for a group of cohesive
soils. The soil shear strength used in the correlation was deter
mined by both the Texas Triaxial Test and the AST~~ Triaxial
Test. It was necessary to group the soils--tested into six subgroups
based on similar behavior. The CH soils were subgrouped into
homogeneous CH soils and CH soils with secondary.structure. The
CL soils were subgrouped into silty CL soils, sandy CL soils and
stratified CL soils. The SC soils were not subgrouped. It
was not possible to develop a correlation for either the SC soils
or the stratified CL soils because of lack of sufficient data. Based
on the data available for this study, the following conclusions are
made:
1. The shear strengths determined by the Texas Triaxial Test
were higher than the shear strengths determined by the
ASTM Tricocial Test on identical samples. A linear rela-
tionship exists between these shear strengths as follows:
cusT = o. 6.0 cuT AT
2. (a) The correlations of the Texas Triaxial Test (TAT)
shear strength with the Texas Highway Department
74

cone penetrometer N-value show that the following equations
can be used to predict this shear strength:
CuTAT = 0.11 N Homogeneous CH soils
CuTAT = 0.02 N - CH soils with secondary structure
CuTAT = 0.10 N- Silty CL soils
CuTAT = 0.095 N - Sandy CL soils
(b) The ASTM Triaxial Test {ST) shear strength can
also be predicted from the THO cone penetrometer N-value.
The equations that can be used to predict this shear
strength are as follows:
CuST = 0.07 N - Homogeneous CH soils
C = 0.018 N CH soils with secondary usT structure
CusT = 0.063 N - Silty CL soils
CuST = 0.053 N - Sandy CL soils
(c) A reasonably good correlation exists for the homo
geneous CH soils and the silty CL soils based on the
smaller amount of scatter observed in the results for
these two types of soils.
3. Equations were developed which can be used to predict
the unconsolidated-undrained shear strength from the
Standard Penetration Test. The results obtained by
Touma and Reese (30) were used to develop the following
equations:
75
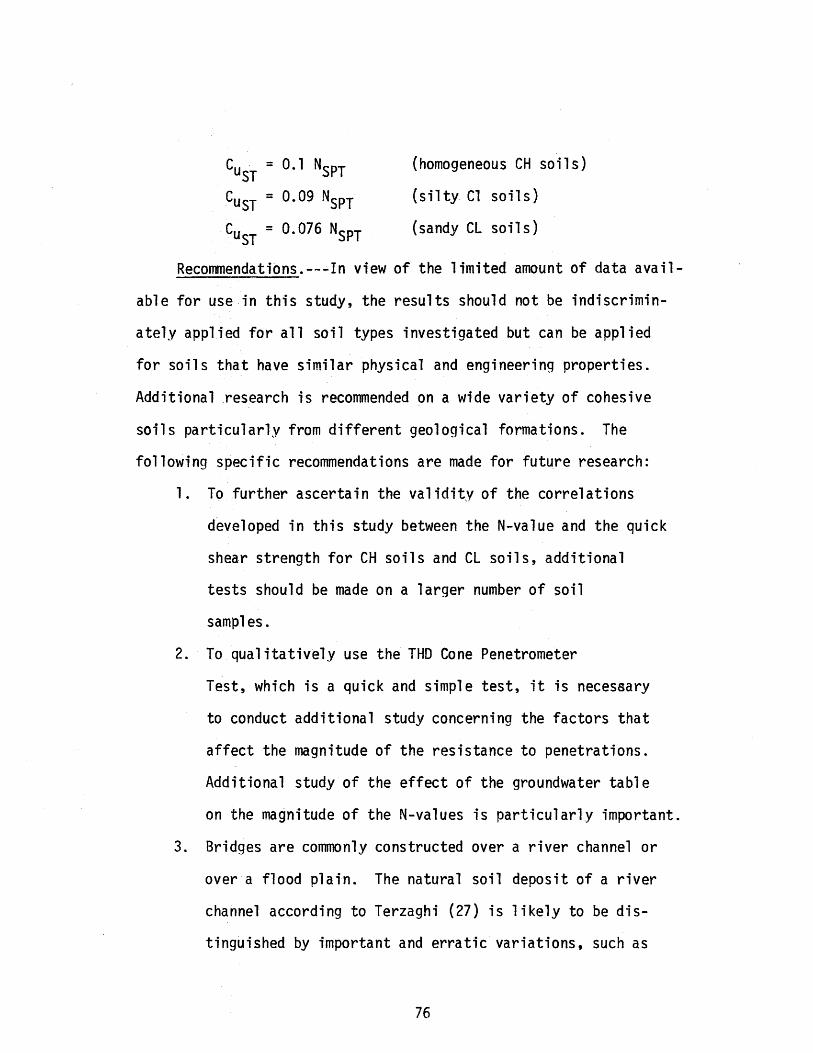
c = 0.1 NSPT (homogeneous CH soils) usr
Cusr = 0.09 NSPT (silty Cl soils)
Cusr = 0.076 NSPT (sandy CL soils)
Recommendations.---In view of the limited amount of data avail-
able for use in this study, the results should not be indiscrimin
ately applied for all soil types investigated but can be applied
for soils that have similar physical and engineering properties.
Additional .research is recommended on a wide variety of cohesive
soils particularly from different geological formations. The
following specific recommendations are made for future research:
1. To further ascertain the validity of the correlations
developed in this study between the N-value and the quick
shear strength for CH soils and CL soils, additional
tests should be made on a larger number of soil
samples.
2. To qualitatively use the THO Cone Penetrometer
Test, which is a quick and simple test, it is necessary
to conduct additional study concerning the factors that
affect the magnitude of the resistance to penetrations.
Additional study of the effect of the groundwater table
on the magnitude of the N-values is particularly important.
3. Bridges are commonly constructed over a river channel or
over a flood plain. The natural soil deposit of a river
channel according to Terzaghi (27) is likely to be dis-
tinguished by important and erratic variations, such as
76

stratified soil. This type of soil is a ,.problem" soil.
In flood plains, hair cracks, joints or slickenside
commonly occur. A soil that contains secondary structure
is also a "problem" soil. Further study concerning these
two types of soils is also needed.
4. Correlation between resistance to penetration and the
quick shear strength of both the SC soils and the sandy
CL soils is needed in order to establish an_accurate
mathematical model that can be used for these two soils.
5. Additional study is needed to determine what modifications
are required to obtain shear strengths from the Texas
Triaxial Test which are in closer agreement with the
strengths obtained from the ASTM Triaxial Test. The study
should include the effects of sample disturbance, the
effects of the confining membrane, and the effects of
friction between the membrane and the upper cap.
77


APPENDIX I.--REFERENCES
1. Barker, W. R., and Reese, L. C., "Behavior of Axially Loaded Drilled Shafts in Beaumont Clay," Research Report No. 89-9, Center for Highway Research, August, 1970.
2. Berg, Robert R., "Stratigraphy of the Claiborne Group," The Geological Society of America, Texas A&M University, 1970.
3. Bishop, Alan W., and Henkel, D. J., "The Measurement of Soil Properties in The Triaxial Test," Edward Arnold Ltd., London, 1957.
4. Bishop, Alan W., and Eldin, Gamal, "Undrained Triaxial Tests on Saturated Sands and Their Significance in the General Theory of Shear Strength," Geotechnigue, London, England, Vol. 2, 1950 1 pp. 13-32.
5. Bridge Division, Texas Highway Department, Foundation Exploration and Design Manual, Second Edition, July, 1972.
6. Desai, M. D., "Subsurface Exploration by Dynamic Penetrometers, S.V.R. College of Engineering, Surat (Gujarat) India, 1970.
7. Fletcher, G. F. A., 11 Standard Penetration Test: Its Uses and Abuses," Journal of Soil Mechanics and Foundation Division, ASCE, July, 1965.
8. Foye, Robert Jr., Coyle, Harry M., Hirsch, T. J., Bartoskewitz, R. E., and Milberger, L. J., "Wave Equation Analysis of FullScale Test Piles Using Measured Field Data," Research Report No. 125-7, Texas Transportation Institute, August, 1972.
9. Gibbs, H. J., Holtz, W. G., and Houston, W. N., "Correlation of Field-~enetration and Vane Shear Tests for Saturated Cohesive Soils," Rept. Bur. Reclamation, Earth Lab., EM 586.
10. Gibbs, H. J., and Holtz, W. G., "Research on Determining the Density of Sands by Spoon Penetration Testing, .. Proceedings, Fourth International Conf. Soil Mech. Found. Engr., London, Vol. 1, 1957, pp. 35-39.
11. Hvorslev, J. J., "Subsurface Exploration and the Sampling of Soils for Civil Engineering Purpose," Engineering Foundation, New York, 1949.
78

12. Jennings, J. E. , "The Theory and Practice of Construction on Partly Saturated Soils as Applied to South African Conditions," Proceedings, International Research and Engineering Conference on Expansive Clay Soils, College Station, Texas 1965.
13. Jonson, Sidney M. and Kavannagh, Thomas C., The Design of Foundations for Buildings, McGraw-Hill Co., New York, 1968.
14. Kolb, C. R., and Shockley, W. G., "Engineering Geology of the Mississippi Va 11 ey, Transactions, ASCE, No. 124, 1959, pp. 633-645.
15. Lumb, P., "Accuracy of Soil Testing," University of Hong Kong, Civil Engineering Department, 1969.
16. Mowery, Irvin C., Oakes, Harvey, Rourke, J.D., Maranzo, F., Hill, H. L., McKee, G. S., and Crozier, B. B., "Soil Survey of Brazos County, Texas, 11 United States Department of Agriculture, June, 1958.
17. O'Neill, Michael W., and Reese, Lymon .. C., "Behavior of Axially Loaded Drilled Shafts in Beaumont Clay," Research Report No. 89-8, Center for Highway Research, December, 1970.
18. Palmer, D.J. and Stuart, J.G., "Some Observations on Standard Penetration Tests and a Correlation of the Test With a New Penetrometer," Proceedings, Fourth International Conference of Soil Mechanics and Foundation Engineering, Vol.!, London, 1957, p. 231.
19. Reese, Lymon C., and O'Neill, Michael W., 11 Criteria for the Design of Axially Loaded DRilled Shafts," Research Report No. 89-llF, Center for Htghway Research, August, 1971.
20. Sanglerat, G., The Penetrometer and Soil Exploration, Elservler Publishing Co., New York, 1972.
21. Schultz, E., and Knansenberger, H., "Experience With Penetrometers, .. Proceedings, Fourth Interantional Conference of Soil Mech. and Found. Engr., Vol. I, London, 1957, pp. 249-255.
22. Sengupta, D. P., and Aggarwal, "A Study Cone Penetration Test," Journal of Indian National Soc. of Soil Mech. and Found. En r.,
966, p 207.
23. Skempton, A. W., "The (J = 0 Analysis of Stability and its Theoretical Basis," Proceedings, Second International Conference of Soil Mechanics, Vol. I, 1948.
79

24. Sowers, G. B., and Sowers, G. F., Introductory Soil Mechanics and Foundation, The Macmillan Co., New York, 1951.
25. Sowers, G. F., "Modern Procedures for Underground Investigations," Proceedings, ASCE, Vol. 80, No. 435; 1~54.
26. Sullivan, R. A., and McClelland, B., "Predicting Heave of Buildings on Unsaturated Clay," Proceedings, International Research and Engr. Conf. on Expansive Clay Soils, College Station, Texas, 1965.
27. Terzaghi, K., and Peck, R. B., Soil Mechanics in Engineering Practice, Second Edition, John Wiley and Sons, New York, 1967.
28. Texas Highway Department, "Manual of Testing Procedures, .. Vol. 1, June, 1962.
29. Texas Highway Department, "Texas, 1974, Official Highway Travel Map," Traveland Information Division, Austin, Texas.
30. Touma, F. T., and Reese, L. C., "The Behavior of Axially Loaded Drilled Shafts in Sands, .. Research Report No. 176-1, Center for Highway Research, March, 1969.
31. United States Department of the Interi.or, .. Correlation of Field Penetration a·nd· Vane Shear Tests for Saturated Cohesive Soils~,." Earth Laboratory Report No·. EM-586, Bureau of Reclamation~ Div-ision of Engineering Laboratories, Denver, Colorado, September 30, 1960.
32. Vijayvergiya, Vasant N., Hudson, W. Ronald, and Reese Lyman C., 11 Load Distribution for a Drilled Shaft in Clay Shale," Research Report No. 89-5, Center for Highway Research, March, 1969.
80


APPENDIX !I.--DEFINITIONS AND NOTATIONS
The symbols and terms used on boring logs are:
CLAY
SOIL TYPE
(shown in symbol column)
SAND S.lliT
Predominant type shown heavy
PUSH BARREL
SAMPLER TYPES
(shown in samples column)
THD CONE
PENETROMETER
NO RECOVERY
FILL
Consistency is rated according to shearing strength, as indicated
by the Standard Triaxial Test:
Description Term
Firm Stiff
Very Stiff Hard
Cohesion, ton/sg ft
0.25 to 0.50 0.50 to 1.00 1.00 to 2.00
2.00 and higher
81

Seam- l/8 in. (3.18 mn) to 3 in. (76.2 rrm) thick
Layer - greater than 3 in. (76.2 mm) thick
Fissured - containing shrinkage cracks, frequently filled with fine sand or silt
Ca 1 careous - containing appreciable qu_anti ties of ca 1 ci urn carbonate
Slickensided - having inclined planes of weakness that are slick and glossy in appearance
Interlayered - composed of alternate layers of different soil types; also called stratified
N - the number of blows required to drive the THO cone pene-trometer one foot; also noted as NTHO
N* - the number of blows required to drive the THO cone penetrometer six inches.
NSPT - the number of blows required to drive the standard split spoon -one foot
0
- the angle of shearing resistance
- the distance, in inches, of the THO cone penetrated by 50 blows.
- the sum of the vertical load induced by the confining pressure and the applied vertical load during the Texas Triaxial Test in tons
- the corrected area in square feet
- the confining pressure in tons per square foot
- the cohesion in tons per square foot
Pv - the applied vertical load in tons
CuTAT- the Standard Triaxial shear strength during a 11 quick 11 test, in tons per square foot
82

C - the Texas T.ri.axiaJ shear s1tr.ength .Our~.Ag a "quick" test, uTAT
in tons per s.quare foot
K -constant of proportionality= Cu/N
Ai - regression coefficient
LL - liquid limit in percent; also noted as WL
PI - plasticity index in percent; also noted as Ip
-200 - percent of the materials that pass the No. 200 sieve
we - percent water content
UDW - unit dry weight in pounds per cubic foot
S - percent saturation
P0
- effective overburden pressure
83


APPENDIX III
SUMMARY OF TEST DATA
The following notations were used to identify soil subgroups:
H - Homogeneous CH soils W - CH soils with secondary
structure Si - Silty CL soils Sa - Sandy CL soils S - Stratified. CL soils
84
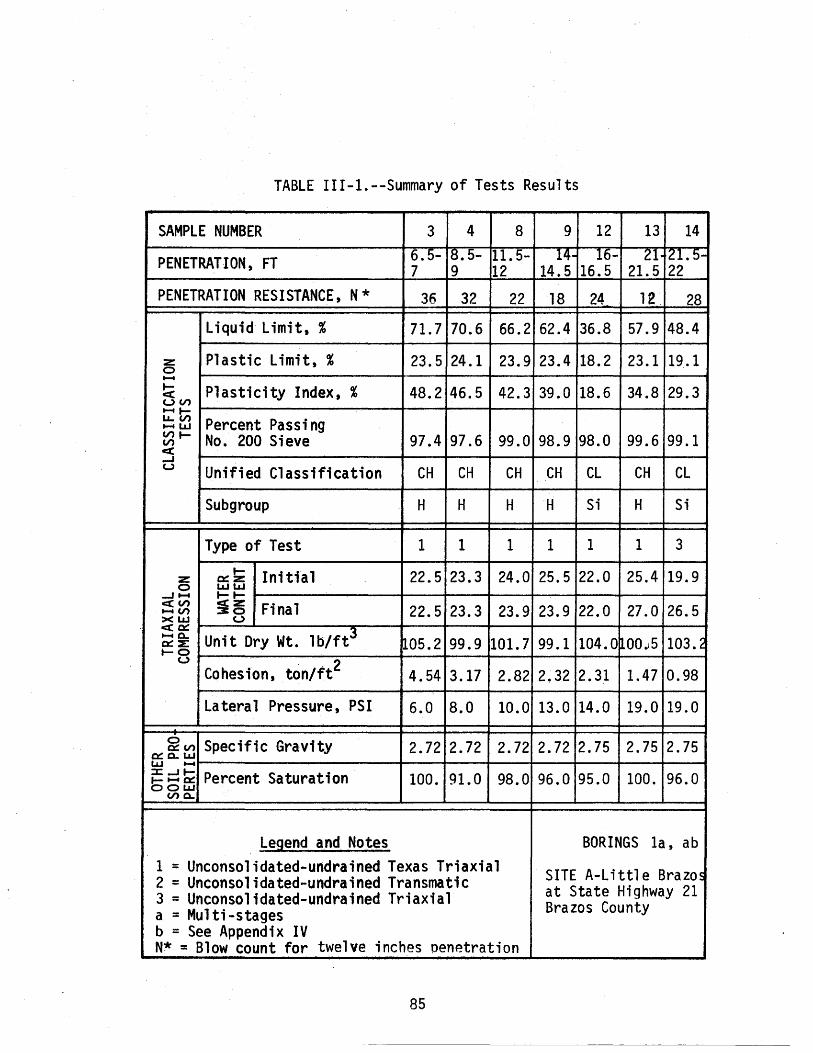
TABLE III-1.--Summary of Tests Results
SAMPLE NUMBER 3 4 8 9 12 13 14
PENETRATION, FT 6. 5- [8. 5- 11.5- 14- 16- 21· 21.5-7 9 12 14.5 16.5 21.5 22
PENETRATION RESISTANCE, N* 36 32 22 18 24 12~ 28
Liquid Limit, % 71.7 70.6 66.2 62.4 36.8 57.9 48.4
z: Plastic Limit, % 23.5 24.1 0
23.9 23.4 18.2 23.1 19.1 ...... ~ Plasticity Index, % 48.2 46.5 42.3 39.0 18.6 34.8 29.3 (..)V) ...... ~ LL. V) Percent Passing ...... L&J V)~ No. 200 Sieve 97.4 97.6 99.0 98.9 98.0 99.6 99.1 V) c:( ...J (..) Unified Classification CH CH CH CH CL CH CL
Subgroup H H H H Si H Si
Type of Test 1 1 1 1 1 1 3 ~ Initial 22.5 23.3 24.0 25.5 22.0 25.4 19.9 z: o:::z:
0 L&J L&J ...J ...... ~~ c:( V) i~ Final 22.5 23.3 23.9 23.9 22.0 27.0 26.5 ...... V)
>< LAJ u <CO:::
lb/ft3 ...... 0.. Unit Dry Wt. 105.2 99.9 101.7 99.1 104.0 100.i5 103.2 CX::E t-O
(..)
Cohesion, ton/ft2 4.54 3.17 2.82 2.32 2.31 1.47 0.98
Lateral Pressure, PSI 6.0 8.0 10.0 13.0 14.0 19.0 19.0
0 Specific Gravity 2.72 2.72 2.72 2.72 2.75 2.75 2.75 ex: V') ex: 0... L&J L&J ....... :z: ...J ~ Percent Saturation 100. 91.0 98.0 96.0 95.0 100. 96.0 ~ ..... ex: OOLAJ
(/) 0..
Legend and Notes BORINGS la, ab 1 = Unconsolidated-undrained Texas Triaxial SITE A-Little Brazos 2 = Unconsolidated-undrained Transmatic 3 = Unconsolidated-undrained Triaxial at State Highway 21 a = Multi-stages Brazos County b = See Appendix IV N* = Blow count for twelve inches penetration
85
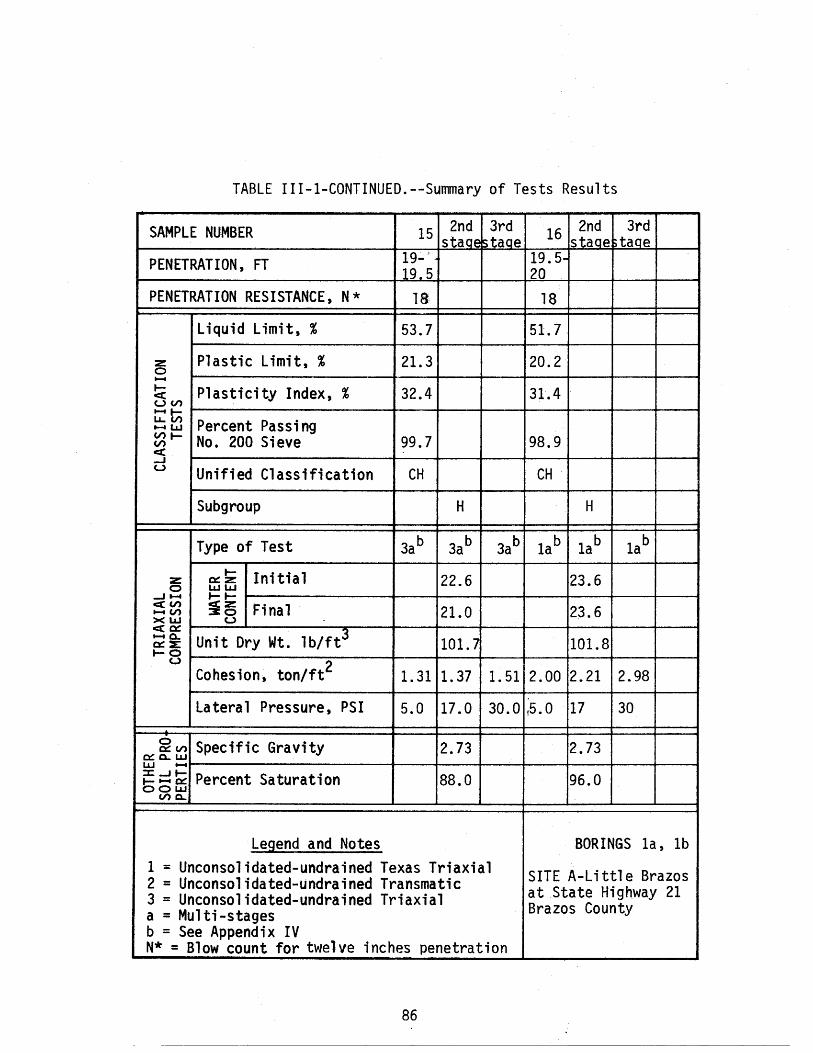
TABLE III-1-CONTINUED.--Summary of Tests Results
SAMPLE NUMBER 2nd 3rd 15 staoelstaae 16 2nd 3rd staaebtaoe
PENETRATION, FT
PENETRATION RESISTANCE, N*
Liquid Limit, %
z Plastic Limit, % 0 ......
19-' 19.5
53.7
21.3
32.4
19.5-20
18
51.7
20.2
31.4 ~ Plasticity Index, % u~ t------------------------+---4----~--+---~--~---+--~ ........... ~~ Percent Passing ~ ..... No. 200 Sieve <3:: -1 u Unified Classification
Subgroup
Type of Test
99.7 98.9
CH CH
H H
z o::!z Initial 22 6 23.6 0 LLJ L&J • _....... ..... ..... ~--------------------~--~---+--~----~--+---~----~
~ ~ :i ~ Fi na 1 21. o 23. 6 XLLJ ~-~u~------------~-----+---~--~---+---4----~--+-~ <3:: 0:: r- . 3 ~~ Unit Dry Wt. lb/ft 101.7 101.8 t-g ~-------------------------~---4----~---+---4----~--+-~
Cohesion, ton/ft2 1.31 1.37 1.51 2.00 2.21 2.98
Lateral Pressure, PSI 5.0 17.0 30.0 ~.0 17 30
~en Specific Gravity 2.73 2.73 0:: 0.. LLJ LLJ ...... ~--------------------+---4---~---+---4----~--+-~
~=~Percent Saturation 88.0 96.0 OOUJ
(/) 0..
Legend and Notes 1 = Unconsolidated-undrained Texas Triaxial 2 = Unconsolidated-undrained Transmatic 3 =Unconsolidated-undrained Triaxial a = Multi-stages b = See Appendix IV N* = Blow count for twelve inches penetration
86
BORINGS 1a, 1b
SITE A-Little Brazos at State Highway 21 Brazos County

TABLE III-1-CONTINUED.--Summary of Tests Results
SAMPLE NUMBER 17 2nd 3rd 19 22 23 24 staae staae PENETRATION, FT 21- 24- ~6.5- 30.5- 32-
21.5 24.5 127 31 132 5 PENETRATION RESISTANCE, N* 14 12 12 104
Liquid Limit, % 43.9 59.0 63.9 59.6 51.8
z: Plastic Limit, % 18.8 0
23.5 24.3 22.8 19.7 -1- Plasticity Index, % 25.1 35.5 39.5 36.8 32.1 ex: UVl -t-Ll... V) Percent Passing - LJ.J Vll- No. 200 Sieve 99.1 97.4 ~4.7 94.9 96.8 V)
ex: ..... u Unified Classification CL CH CH CH CH
Subgroup Si H H H w
Type of Test 2ab 2ab 2ab 1 1 1 3 1- Initial z: 0:: z: 19.6 28.9 27.8 31.2 37.2 0 LJ.J LJ.J .......... 1-1-
CX::Vl :i~ Final 19.5 26.1 ~5.9 30.3 32.0 -V) >< LJ.J u cx::o::
lb/ft3 -o.. Unit Dry Wt. ~5.8 0:: :E: 108.1 96.9 91.8 86.9 1-0 u
Cohesion, ton/ft2 2.57 2.50 2.52 1.45 1.25 0.74 0.55
Lateral, Pressure, PSI 5.0 18.0 30.0 21.0 24.0 26.0 27.0
0 Specific Gravity 2.75 2.75 2.75 2.75 2.71 0:::: V) 0:::: 0.. LJ.J LJ.J ..... ::X: ....II- Percent Saturation 98.0 98.0 ' 93.0 97.0 99.0 t--o:: 0 0 LJ.J
V) 0..
Legend and Notes BORINGS 1a, lb 1 = Unconsolidated-undrained Texas Triaxial
SITE A-Little Brazos 2 =Unconsolidated-undrained Transmatic 3 = Unconsolidated-undrained Triaxial at State Highway 21 a = Multi-stages Brazos County b = See Appendix IV N* = Blow count for twelve inches penetration
87

TABLE III-1-CONTINUED.--Summary of Tests Results
SAMPLE NUMBER 25 26 27 28 29 31 32
PENETRATION, FT 32. 5· 36- 36.5 ~ 39 39.5 41.5- 44-33 36.5 37 39. ~ 40 42 44.'5
PENETRATION RESISTANCE, N * 104 134 172 150 150 184 240
Liquid Limit, % 59.2 70.0 57.8 65.1 62.0 57.5 55.0
z: Plastic Limit, % 20.8 29.0 25.5 28.6 26.1 26.0 25.8 0 ....... t- Plasticity Index, % 38.3 40.9 32.3 36.5 35.8 31.4 29.3 ct: u (/') ...... t-1.1.. (/') Percent Passing ....... ~ V)t- No. 200 Sieve 98.6 79.2 67.8 78.6 88.0 70.6 61.6 (/')
ct: ...J (..) Unified Classification CH CH CH CH CH CH CH
Subgroup w w w w w w w
Type of Test 1 1 1 1 3 1 1 1- Ini tia 1 31.7 29.1 27.4 29.1 28.6 28.3 25.9 z: 0::: :z
0 L&J L&J ...J ....... 1-1-ct: V) §~ Final 36.3 30.3 28.3 28.0 28.0 26.7 24.9 ..... (/') >< L&J u ct: 0:::
lb/ft3 ..... 0.. Unit Dry Wt. 88.1 94.3 97.7 94.9 93.1 96.3 100.7 0::: :E 1-0
(..)
Cohesion, ton/ft2 0.44 3.99 3.06 3.52 2.35 2.71 4.04
Lateral Pressure, PSI 27.0 29.0 29.0 30.0 30.0 31.0 32.0
0 Specific Gravity 2.71 2.69 2.69 2.69 2.69 2.69 2.69 0::: (/') 0::: 0.. L&J LLJ ..... :X: ...J 1- Percent Saturation 100. 100 . 100. 100. 95.0 100. 100. ......... 0::: COLLI
V) 0..
Legend and Notes BORINGS 1a, 1b 1 = Unconsolidated-undrained Texas Triaxial SITE A-Little Brazos 2 = Unconsolidated-undrained Transmatic at State Highway 21 3 = Unconsolidated-undrained Triaxial a = Multi-stages Brazos County b = See Appendix IV N* = Blow count for twelve inches penetration
88
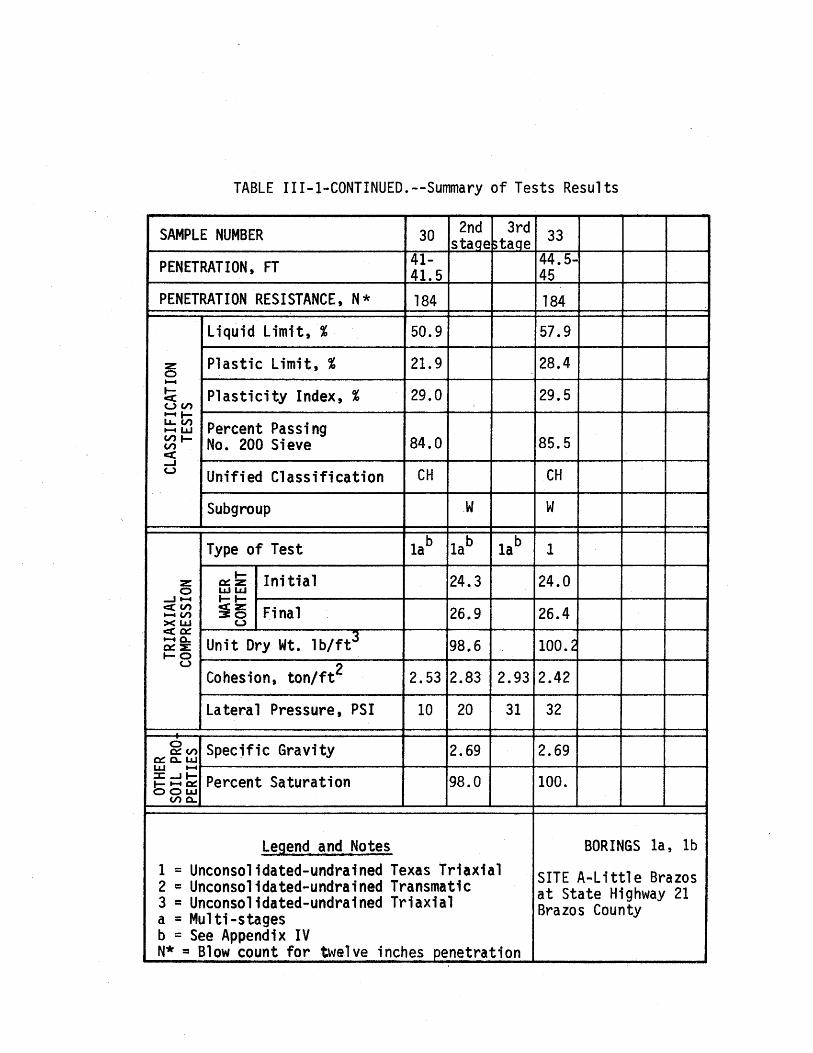
TABLE III-1-CONTINUED.--Summary of Tests Results
SAMPLE NUMBER 30 2nd 3rd 33 stage stage PENETRATION, FT 41- 44.5-
41.5 45 PENETRATION RESISTANCE, N* 184 184
Liquid Limit, % 50.9 57.9
z:: Plastic Limit, % 21.9 28.4 0 t---4
!;;: Plasticity Index, % 29.0 29.5 (..)(I') t---4f-LL. (I') Percent Passing t---4 LJJ (l')f- No. 200 Sieve 84.0 85.5 (I')
C%: --l (..) Unified Classification CH CH
Subgroup .W w
Type of Test lab lab lab 1
1- Initial 24.3 24.0 z:: 0:::: z:: 0 LJJ LJJ
--l ..... 1-1-C%: (I') :i~ Final 26.9 26.4 t---4 (I') >< LJJ u C%:0::::
1 b/ft3 t---4 0.. Unit Dry Wt. 98.6 100.2 0:~ ... 1-0
u Cohesion, ton/ft2 2.53 2.83 2.93 2.42
Latera 1 Pressure, PSI 10 20 31 32
0 Specific Gravity 2.69 2.69 0:::: (I') 0::: 0.. LJJ LJJ ..... :I:...JI-- Percent Saturation 98.0 100 . .......... 0::: 0 0 LJJ
(I') 0..
Legend and Notes BORINGS la, lb 1 =Unconsolidated-undrained Texas Triaxial SITE A-Little Brazos 2 = Unconsolidated-undrained Transmatic at State Highway 21 3 =Unconsolidated-undrained Triaxial a = Multi-stages Brazos County b = See Appendix IV N* = Blow count for twelve inches penetration

TABLE 111-2.--Summary of Tests Results
SAMPLE NUMBER 1 2 3 2nd 3rd 6 8 staqe staqe PENETRATION, FT 6.5- 9- ~.5- 22- 24-
7 9.5 10 22.5 24.5 PENETRATION RESISTANCE, N* 12 8 8 26 28
Liquid Limit, % 35.1 25.7 24.8 31.3 37.1
:z: Plastic Limit, % 13.8 15.2 15.7 11.1 12.0 0 ~
1- Plasticity Index;% 21.3 10.5 9.1 20.2 25.1 ct: uen ~~--LL. en Percent Passing 11-4 LJJ en a- No. 200 Sieve 48.2 39.6 40.8 78.5 84.1 en ct: ...J u Unified Classification sc sc sc CL CL
Subgroup - - - - - Sa Si
Type of Test 1 1 lab lab lab 1 3 1- Initial 16.4 16.5 16.9 13.5 14.3 :z: 0: :z:
0 LJJ LJJ _, 11-4 1-1-ct:en :i~ Final 18.0 17.2 17.5 14.1 14.8 ...... en >< LJJ u c(O:
lb/ft3 11-4 0.. Unit Dry Wt. ~12.0 112.5 110. j ~17.2 119.2 O::::E 1-0
u Cohesion, ton/ft2
1.23 1.31 0.81 1.09 1.50 2.03 2.17
Lateral Pressure, PSI 5.5 8.0 2.5 7.5 17.5 13.5 14.0
0 Specific Gravity 2.70 2.70 2.70 2.73 2.73 o: en 0: 0.. LLJ L&J 11-4 :X: -It- Percent Saturation 92 91 89 83 93 f-11-40: OOLLJ
en o..
Legend and Notes BORINGS 2,3 1 = Unconsolidated-undrained Texas Triaxial SITE 8-Interstate 610 2 =Unconsolidated-undrained Transmatic at HB&T Railroad, 3 = Unconsolidated-undrained Triaxial Houston, Texas a = Multi-stages b = See Appendix IV N* = Blow count for twelve inches penetration
90

TABLE III-2-CONTINUED.--Summary of Tests Results
SAMPLE NUMBER 4 2nd 3rd 5 2nd 3rd 9 staae staqe staqe staqe PENETRATION, FT 11- 11.5- 24.5-
11.5 12 25 ,PENETRATION RESISTANCE, N* 8 32
Liquid Limit, % 24.9 25.2 37.8
z Plastic Limit, % 16.0 17.7 13.5 0 ~
!;( Plasticity Index, % 8.9 7.5 24.3 UVl ~~--LJ.. Vl Percent Passing ~ LIJ Vll- No. 200 Sieve 39.9 37.7 81.3 Vl c:t: _. (..) Unified Classification sc sc CL
Subgroup - - - - - - Si
Type of Test 3ab 3a Jab 2a 2a 2a 1
z o:::!z Initial 16.7 17.6 14.2 0 LIJ LIJ
-~~ 1-1-c:t: Vl :i~ Final 17.0 18.0 15.4 ~Vl X LIJ u <CC:::
lb/ft3 ~o.. Unit Dry Wt. 114.0 110.2 117.4 C::::E 1-0
(..)
Cohesion, ton/ft2 0.84 0.98 1.08 0.41 0.41 0.41 3.27
Lateral Pressure, PSI 4 9 19 4 9 19 14.5
0 Specific Gravity 2.70 2.70 2.73 c::: Vl 0:::: 0.. LIJ LIJ ~
:I: -I 1- Percent Saturation 95 91 90 1-~0::: OOLIJ
Vl 0..
Legend and Notes BORINGS 2, 3 1 =Unconsolidated-undrained Texas Triaxial SITE B-Interstate 610 2 = Unconsolidated-undrained Transmatic at HB&T Railroad, 3 = Unconsolidated-undrained Triaxial a = Multi-stages Houston, Texas b = See Appendix IV N* = Blow count for twe'l ve inches penetration
91

TABLE III-2-CONTINUED.--Summary of Tests Results
SAMPLE NUMBER 10 2nd 3rd 11 12 2nd 3rd staqe staqe staQE staqe
PENETRATION, FT Zo. o· 26.5- 27.5 26 27 28
PENETRATION RESISTANCE, N* 30 28 32
Liquid Limit, % 42.0 36.9 48.0
z Plastic Limit, % 13.2 12.7 12.4 0 ~
1- Plasticity Index, % 28.8 24.2 35.6 <C u (I') ~~--LL. (I') Percent Passing ~ LaJ (I') I- No. 200 Sieve 78.9 81.8 89.0 (I')
<C _. u Unified Classification CL CL CL
Subgroup Sa Si Si
Type of Test lab lab lab 1 3ab 3ab 3ab
1- Initial 14.5 14.5 17.7 z o::::z 0 LaJ LaJ
--~~ 1-1-c:((l') :i~ Final 15.3 15.9 18.9 ~(I')
>< L&J u c(O::::
1 b/ft3 ~o.. Unit Dry Wt. 118.0 117.~ ~10.6 o:::::e:: 1-0
u Cohesion, ton/ft2 3.44 3.60 3.72 3.67 1.45 1.71 1.93
Lateral Pressure, PSI 5 15 25 15 5 15 25
0 Specific Gravity 2.73 2.73 2.67 0:::: V') 0:::: 0.. L&J L&J ~
:X: -II- Percent Saturation 92 92 97 a-~o:::: OOL&J
V') 0..
Legend and Notes BORINGS 2, 3 1 = Unconsolidated-undrained Texas Triaxial SITE B-Interstate 61C 2 = Unconsolidated-undrained Transmatic 3 =Unconsolidated-undrained Triaxial at HB&T Railroad, a = Multi-stages Houston, Texas
b = See Appendix IV N* .= Blow count for twelve inches penetration
92

TABLE III-2-CONTINUED.--Summary of Tests Results
SAMPLE NUMBER 13 15 16 18 19 21 23
PENETRATION, FT ~tl. 5- 31- 33- 34.5- 36.5 .. 39. 5- 41.5-29 31.5 33.5 35 37 40 42
PENETRATION RESISTANCE, N* 28 26 24 24 18 64 70
Liquid Limit, % 46.1 32.5 33.4 28.9 31.1 30.0 68.6
z Plastic Limit, % 17.6 16.4 17.0 15.1 15.5 19.1 26.4 0 ...... ~ Plasticity Index, % 28.5 16.1 16.4 13.8 15.6 10.9 42.2 UV> .......... La.. V) Percent Passing ...... LIJ V>l-- No. 200 Sieve 96.3 81.8 89.4 90.6 83.5 97.8 99.4 V)
ld:: __, u Unified Classification CL CL CL CL CL CL CH
Subgroup Si Si Si Si Si Si w
Type of Test 1 1 3 1 1 1 1 1-- Initial 19.0 17.1 19.4 19.5 19.1 24.4 26.3 z o:z
0 LLJ LLJ __, ...... 1--1--<V> i~ Final 21.5 17.8 20.8 23.4 17.8 25.6 25.4 ...... V) >< LaJ u <O:
lb/ft3 ...... 0. Unit Dry Wt. ~08.0 111.4 106.9 103. f 107.5 97.4 97.3 O::E 1--0
u Cohesion, ton/ft2 2.99 2.82 1.08 1.48 2.36 1.04 2.31
Lateral Pressure, PSI 16.0 17.0 17.0 17.5 18.5 19.0 20.0
0 Specific Gravity 2.67 2.73 2.67 2.67 2.73 2.67 2.75 0:: V) 0::: 0. LLJ LIJ ...... :X:...Jt- Percent Saturation 100. 90 96 94 86 94 93 1-- ...... 0:: OOLaJ
V) c..
Legend and Notes BORINGS 2, 3 1 =Unconsolidated-undrained Texas Triaxial SITE B-Interstate 61C 2 = Unconsolidated-undrained Transmatic 3 = Unconsolidated-undrained Triaxial at HB&T Railroad, a = Multi-stages Houston, Texas b = See Appendix IV N* = Blow count for twelve inches penetration
93

TABLE III-2-CONTINUED.--Summary of Tests Results
SAMPLE NUMBER 22 2nd 3rd 25 2nd 3rd 27 staqe staqe staqe staqe PENETRATION, FT 40.5- 43.5- 44.5-
41 44 45 PENETRATION RESISTANCE, N* 118 70 40
Liquid Limit, % 53.3 69.7 65.2
z Plastic Limit, % 20.3 0
22.9 24.2 ...... ~ Plasticity Index, % 33.0 46.8 41.0 u (.f) ...... t-LL.. (.f) Percent Passing ...... I.JJ cnt- No. 200 Sieve 98.8 99.6 96.9 (.f) c( __. u Unified Classification CH CH CH
Subgroup w w w
Type of Test lab lab lab 3ab 3ab 3ab 1 t- Initial 21.7 24.9 24.5 z 0:::: z
0 I.JJ L&J __. ...... t-t-c( (.f) i~ Final 23.8 25.6 23.2 ...... (.f)
>< I.JJ u c( 0::::
lb/ft3 ...... 0. Unit Dry Wt. 101.8 101.3 102.3 O::::E t-O u
Cohesion, ton/ft2 1.86 2.06 2.22 1.. 62 1.67 1.81 3.06
Lateral Pressure, PSI 9.5 19.5 29.5 10.5 20.5 30.5 21.0
0 Specific Gravity 2.75 2.75 2.75 0:::: (.f) 0:::: 0. LLJ LLJ ...... :X:: -It- Percent Saturation 91 100 97 t- ...... 0:::: OOL&J
(.f) 0.
Legend and Notes BORINGS 2, 3 1 = Unconsolidated-undrained Texas Triaxial SITE B-Interstate 610 2 =Unconsolidated-undrained Transmatic 3 = Unconsolidated-undrained Triaxial at HB&T Railroad, a = Multi-stages Houston, Texas b = See Appendix IV N* = Blow count for twelve inches penetration
94
_______________________________________________________________ j

TABLE III-2-CONTINUED.--Summary of Tests Results
SAMPLE NUMBER 30 32 2nd 3rd 33 36 37 staae staaE PENETRATION, FT 48- 49.5- 50- 52- 54.5-
48.5 50 50.5 52.5 55 PENETRATION RESISTANCE, N * 28 40 40 120
Liquid Limit, % 59.2 36.1 38.6 43.0 65.6
:z Plastic Limit, % 22.0 17.6 19.4 19.8 24.6 0 ...... ~ Plasticity Index, % 37.2 18.5 19.2 23.2 41.0 (..) V) ...... ~ ..... V) Percent Passing ....,. LU V)~ No. 200 Sieve 100 94.2 100 100 100 V) C( _J u Unified Classification CH CL CL CL CH
Subgroup H Si Si w
Type of Test 1 3ab 3ab 3ab 1 1 1 ~ Initial 22.9 21.9 19.0 23.8 29.1 :z 0::: :z
0 LULU _J ...... ~~ C( V) §~ Final 23.0 21.6 22.6 24.0 26.6 ...... V) >< LU (..) C(O:::
lb/ft3 ...... 0.. Unit Dry Wt. 04.4 103.5 106.1 ~01.3 94.7 O:::::E 1-0
(..)
Cohesion, ton/ft2 2.68 1.12 1.25 1.34 2.09 1.58 2.44
Lateral Pressure, PSI 22 12.5 22.5 32.5 22.5 23.0 24.0
0 Specific Gravity 2.75 2.67 2.67 2.67 2.75 0::: V) 0::: 0.. LU LU ...... ::r:::_JI- Percent Saturation 98 95 97 99 94 ........... 0::: OOLU
V) 0..
Legend and Notes BORINGS 2, 3 1 =Unconsolidated-undrained Texas Triaxial SITE B-Interstate 610 2 = Unconsolidated-undrained Transmatic 3 = Unconsolidated-undrained Triaxial at HB&T Railroad, a = Multi-stages Houston, Texas b = See Appendix IV N* = Blow count for twelve inches penetration
95

TABLE 111-2-CONTINUED.--Summary of Tests Results
SAMPLE NUMBER 38 2nd 3rd 39 40 42 46 stage stag~ PENETRATION, FT 55:- 56.5- 57- 59.5- 64.S:
55 5 57 57.5 60 65 PENETRATION RESISTANCE, N* 184 32 32 42
Liquid Limit, % 71.6 ~ 52.2 57.2 33.0 19.8 0 N
::z Plastic Limit, % 26.4 20.7 24.0 17.0 17.2 0 c -~ Plasticity Index, % 45.2 LU 31.5 33.2 16.0 2.6 (..)V) c -t-La.. V) Percent Passing I.LJ
- LLJ V)f-- No. 200 Sieve 100 LU
93.1 95.2 98.9 50.7 V)
cC (..)
....J (..) Unified Classification CH >< CH CH CL ML
LU
Subgroup w - - H H Si .,.
Type of Test 1a 1a 1~ 3 1 1 1 t- Initial 32.3 1- 19.0 24.9 20.8 24.0 ::z 0::: ::z
0 LLJ LLJ c::( ....JI-4 t-1-
::E c(V) :i~ Final 27.2 20.6 23.4 23.5 21.7 1-4(/) >< LLJ (..) 0::: ceo::
lb/ft3 0 1-40.. Unit Dry Wt. 94.6 104.1 101.4 105.~ 104.2 C:::::E 1-0 La..
(..)
Cohesion, ton/ft2 LU 2.27 2.14 1.33 2.47 1.62 4.51 c
Lateral Pressure, PSI 14 24 34 0 24.5 25.5 26.0
0 Specific Gravity 2.75 2.75 2.75 2.67 2.70 0::: V) 0::: 0... LU LJ.J -:::X:....Jt- Percent Saturation 100 85 96 100 100 l-1-40::: COLLI
V) 0...
Legend and Notes BORINGS 2, 3 1 =Unconsolidated-undrained Texas Triaxial SITE B-Interstate 610 2 = Unconsolidated-undrained Transmatic 3 = Unconsolidated-undrained Triaxial and HB&T Railroad, a = Multi-stages Houston, Texas b = See Appendix IV N* = Blow count for twelve inches penetration
96

TABLE III-2-CONTINUED.--Summary of Tests Results
SAMPLE NUMBER 41 2nd 3rd 43 2nd 3rd 47 staqe staqe staqe staqe PENETRATION, FT 58. 5· 61- 66.5-
59 61.5 67 PENETRATION RESISTANCE, N* 30 30
Liquid Limit, % 27.5 71.0 25.2
z Plastic Limit, % 18.6 24.4 19.7 0 ........ 1- Plasticity Index, % 8.9 46 .. 6 5.5 ex: u (/) ..... I-LL (I') Percent Passing ........ UJ (/)f- No. 200 Sieve 95.7 100 64.4 (/) od:: ..J u Unified Classification CL CH CL-Ml
Subgroup s; H
Type of Test lab lab lab 3ab 3ab 3ab 3
z 0:::~ Initial 23.8 25.9 24.6 0 UJW
..J ...... I-f-ct:(l') :i~ Final 22.5 27.0 24.5 ...... (/) ><W u <O:::
lb/ft3 ...... 0.. Unit Dry Wt. 101.4 99.1 ' 97.5 O::::E 1-0 u
Cohesion, ton/ft2 0.94 1.25 1.49 1.55 1.62 1.61 0.49
Lateral Pressure, PSI 15 25 35 16 26 36 27.5
0 Specific Gravity 2.67 2.75 2.7 0::: (/) 0::: 0.. LLJ LLJ ........ :X: ..J .,_ Percent Saturation 96 99 100 ........... 0::: OOLLJ
(/) 0..
Legend and Notes BORINGS 2, 3 1 = Unconsolidated-undrained Texas Triaxial SITE B-Interstate 61C 2 =Unconsolidated-undrained Transmatic 3 = Unconsolidated-undrained Triaxial and HB&T Railroad, a = Multi-stages Houston, Texas b = See Appendix IV N* = Blow count for twelve inch.es penetration
97

TABLE III-2-CONTINUED.--Summary of Tests Results
SAMPLE NUMBER 48
PENETRATION, FT 69-69.5
PENETRATION RESISTANCE, N*
Liquid Limit, % 43.6
z: Plastic Limit, % 26.0 0 t-4
~ Plasticity Index, % 17.6 u V') t-4~ La.. V') Percent Passing t-4 L&J V')~ No. 200 Sieve 100 V')
ct: _J u Unified Classification ML
Subgroup
Type of Test 1 ~ Initial 31.0 z: a: z:
0 L&J L&J _J ..... ~~ ct: V') :i~ Final 31.3 t-4 V')
>< L&J u ct: a:
lb/ft3 92.0 t-4 0... Unit Dry Wt. a::E: 1-0 u
Cohesion, ton/ft2 2.57
Lateral Pressure, PSI 28.5
0 Specific Gravity 2.7 a: V') 0::: 0... L&J LLJ t-4 :c _J ~ Percent Saturation 100 ~t-40::: OOLLJ
V') 0...
Legend and Notes BORINGS 2, 3 1 =Unconsolidated-undrained Texas Triaxial SITE B-Interstate 610 2 =Unconsolidated-undrained Transmatic and HB&T Railroad, 3 = Unconsolidated-undrained Triaxial Houston, Texas a = Multi-stages b = See Appendix IV N* = Blow count for twelve inches oenetration
98

TABLE III-3.--Summary of Tests Results
SAMPLE NUMBER 1 2 3 5 6 2nd 3rd staQE staqe
PENETRATION, FT 3- 5- 5.5- 7.5- 8.5-3.5 5.5 6 8 9
PENETRATION RESISTANCE, N* 10 40 40 34 16
Liquid Limit, % 81.3 39.5 42.8 45.6 61.9
z: Plastic Limit, % 18.7 13.1 11.5 12.7 10.3 0 t-4
1- Plasticity Index, % 62.6 26.4 31.3 32.9 51.6 c:c (..)V)
::tn Percent Passing t-4 LJJ V)f- No. 200 Sieve 82.4 69.9 65.7 59.8 73.4 V)
c:c _J (..) Unified Classification CH CL CL CL CH
Subgroup H Sa Sa Sa H
Type of Test 1 3 1 1 lab lab lab 1- Initial 20.8 12.9 12.3 11.6 16.2 z: 0::: z:
0 LJJ LJJ _J t-4 1-1-c:c t/) :i~ Final 24.7 13.8 12.1 11.9 17.5 t-4 V)
>< LJJ (..) c:co:::
lb/ft3 t-4 0.. Unit Dry Wt. ~04.5 117.~ 119.6 119. f ~12.0 a:x 1-0
(..)
Cohesion, ton/ft2 1.78 2.43 4.38 3.86 1.65 1.99 2.73
Lateral Pressure, PSI 3.5 5 5 6.5 2 7 17
0 Specific Gravity 2.74 2.75 2.75 2.75 2.74 0::: V) 0::: 0.. LJJ LJJ t-4 :t:-lt- Percent Saturation 98 79 77 75 88 f-t-40: OOLJJ
t/) 0..
Legend and Notes BORINGS 4,5 1 ~ Unconsolidated-undrained Texas Triaxial SITE C 2 = Unconsolidated-undrained Transmatic Brays Bayou at State 3 = Unconsolidated-undrained Triaxial Highway 288, Houston a = Multi-stages Texas b = See Appendix IV N* = Blow count for twelve inches penetration
99

TABLE III-3-CONTINUED.--Summary of Tests Results
SAMPLE NUMBER 7 2nd 3rd 8 2nd 3rd 9 stage stage stage stage PENETRATION, FT 9- 9.5- 11-
9 5 10 11._5 PENETRATION RESISTANCE, N* 20 18
Liquid Limit, % 58.6 59.8 62.8
z: Plastic Limit, % 11.7 14.2 17.2 0 1-4
~ Plasticity Index, % 46.9 45.6 45.6 u V') 1-4f-LL. V') Percent Passing 1-4 1.&.1 V')f- No. 200 Sieve 71.4 75.1 94.7 V') c:( ....I (..) Unified Classification CH CH CH
Subgroup H H
Type of Test 2ab 2ab 2ab 3ab 3ab 3ab 1 ...... Initial 18.2 18.3 18.1 z 0:: z:
0 LLJ LLJ ....I 1-4 ............ <( V') :i~ Final 18.0 18.3 20.1 1-4 V') >< LLJ u c:( 0::
lb/ft3 1-4 0.. Unit Dry Wt. 107.8 110.3 109.8 O::::E ...... 0
u Cohesion, ton/ft2 1.91 2.06 2.15 1.63 1.63 1.66 2.05
Lateral Pressure, PSI 2.5 7.5 17.5 3 8 18 9.5
0 Specific Gravity 2.74 2.74 2.74 0:: V') 0::: 0.. LLJ LLJ 1-4 :I: ....It- Percent Saturation 85 94 94 f--1-40:: OOLLJ
V') 0..
Legend and Notes BORINGS 4, 5 1 = Unconsolidated-undrained Texas Triaxial SITE C 2 = Unconsolidated-undrained Transmatic Brays Bayou at State 3 = Unconsolidated-undrained Triaxial a = Multi-stages Highway 288, Houston b = See Appendix IV Texas N* = Blow count for twelve inches penetration
100

TABLE III-3-CONTINUED.--Summary of Tests Results
SAMPLE NUMBER 10 12 13 16 18 19 22
PENETRATION, FT 11.5- 13- 13.5 15.5- 17.5 ~ 18.5- 20.5-12 13.5 14 16 18 19 21
PENETRATION RESISTANCE, N * 18 24 24 22 22 18 30
Liquid Limit, % 60.7 22.2 23.7 31.5 29.7 31.4 33.1
z Plastic Limit, % 14.7 12.5 11.7 11.7 11.9 12.3 11.2 0 t--o4 1- Plasticity Index, % 46.0 9.7 12.0 19.8 17.8 19.1 21.9 c:c UV) t--o4l-LL (I') Percent Passing t--o4 L&J (I') I- No. 200 Sieve 90.7 72.9 78.2 80.5 74.2 79.4 85.2 (I')
c:c ....1 u Unified Classification CH CL CL CL CL CL CL
Subgroup H Sa Sa Si Sa Sa Si
Type of Test 3 1 3 1 3 1 1 1- Initial 19.6 13.8 13.5 13.5 15.9 15.0 16.1 z ~z
0 L&J L&J ....1 t--o4 .......... c:(V) i~ Final 20.0 13.8 14.4 14.3 13.5 14.4 15.9 t--o4 (I')
>< L&J u c:co:: lb/ft3 ..... 0.. Unit Dry Wt. ,.07.2 114.8 115.8 115.3 112.4 115. ~ 113.9 0::~
t-O u Cohesion, ton/ft2 1.50 1.98 1.24 2.41 1.50 2.72 2.42
Lateral Pressure, PSI 9.5 11.0 11.5 13.0 14.5 15.5 17.0 .
0 Specific Gravity 2.74 2.75 2.75 2.75 2.75 2.75 2.75 ~(I') 0:: 0.. LLJ LLJ t--o4 :I: ....II- Percent Saturation 91 77 80 78 77 83 87 l-t--o40:: OOLLJ
(I') 0..
Legend and Notes BORINGS 4, 5 1 = Unconsolidated-undrained Texas Triaxial SITE C 2 = Unconsolidated-undrained Transmatic Brays Bayou at State 3 = Unconsolidated-undrained Triaxial a = Multi-stages Highway 288, Houston
b = See Appendix IV Texas N* = Blow count for twelve inches penetration
101

TABLE III-3-CONTINUED.--Summary of Tests Results
SAMPLE NUMBER 24 26 30 32 2nd 3rd 34 stage ~ta_g_e PENETRATION, FT 21.5 23- 25.5 27- 28.5-
22 23.5 26 27.5 29 PENETRATION RESISTANCE, N* 32 38 30 44 54
Liquid Limit, % 34.3 46.2 43.3 33.7 25.4
z Plastic Limit, % 11.2 12.1 13.3 15.3 16.5 0 1-4
!< Plasticity Index, % 23.1 34.1 30.0 18.4 8.9 u (/) ............ LL. (/) Percent Passing 1-4 ~ (1)1- No. 200 Sieve 87.2 80.3 74.2 58.9 34.0 (/) c:( -l u Unified Classification CL CL CL CL sc
Subgroup Si Si Sa - Sa - -
Type of Test 3 1 1 lab lab lab 1 ..... Initial 15.4 14.3 14.6 13.7 14.3 z a::z
0 ~ LJ.J -l ..... 1-1--c:( (/) :i~ Final 16.7 13.8 14.9 16.7 13.9 1-4 (/)
>< LJ.J u c:(CX::
lb/ft3 1-4 0.. Unit Dry Wt. ~14.9 119.2 117.6 116.5 116.0 CX:::E 1--0
u Cohesion, ton/ft2
1.53 4.76 4.48 2.72 3 .. 04 3.48 3.55
Lateral Pressure, PSI 17.5 19.0 21.0 12 22 32 22.0
0 Specific Gravity 2.75 2.75 2.75 2.75 2.65 a:: (/) a:: 0.. LLJ ~ 1-4 :X:-ll-- Percent Saturation 89 88 88 88 88 .......... 0:: 00~
(/) 0..
Legend and Notes BORINGS 4, 5 1 = Unconsolidated-undrained Texas Triaxial SITE C 2 = Unconsolidated-undrained Transmatic Brays Bayou at State 3 = Unconsolidated-undrained Triaxial Highway 288, Houston a = Multi-stages Texas b = See Appendix IV N* = Blow count for twelve inches penetration
102
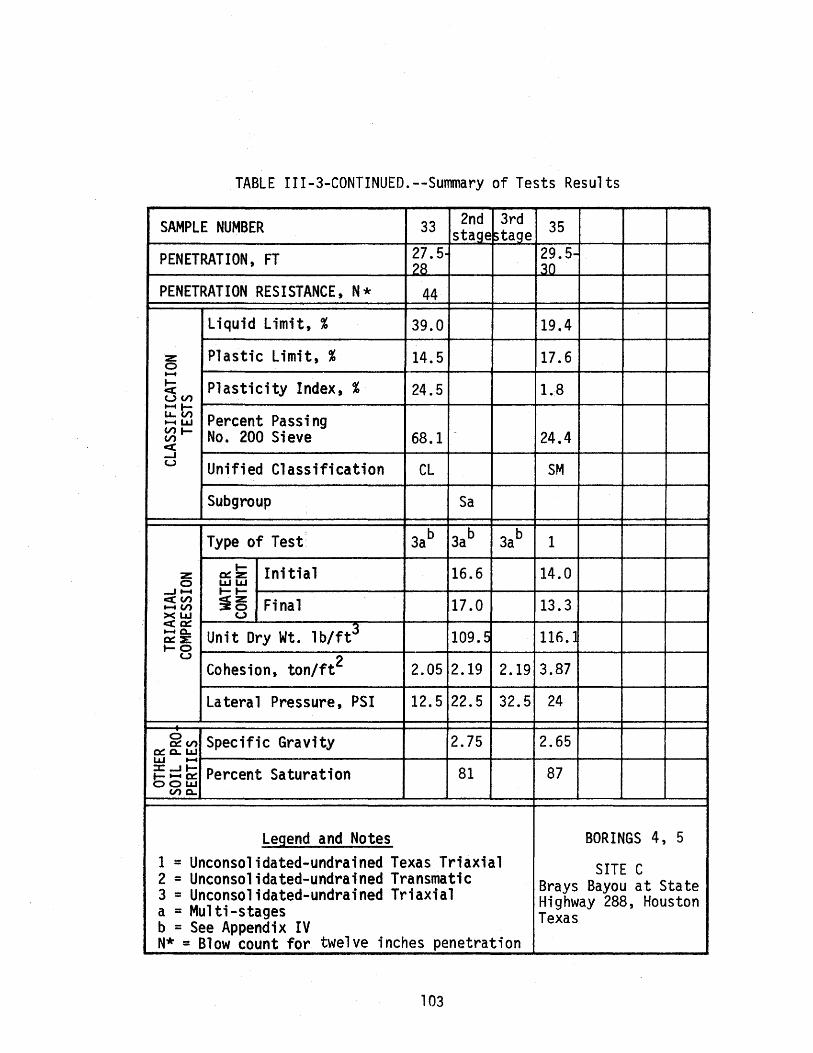
TABLE III-3-CONTINUED.--Summary of Tests Results
SAMPLE NUMBER 33 2nd 3rd 35 stage staqe PENETRATION, FT 27. 5· 29.5-
28 30
PENETRATION RESISTANCE, N* 44
Liquid Limit, % 39.0 19.4
:z: Plastic Limit, % 14.5 17.6 0 ....... t- Plasticity Index, % 24.5 1.8 < (..)(/) ............ LL. (/) Percent Passing .....,. LU V)t- No. 200 Sieve 68.1 24.4 (/) <C --J u Unified Classification CL SM
Subgroup Sa
Type of Test ' 3ab 3ab 3ab 1 t- Initial 16.6 14.0 :z: ~z:
0 LULU --J ....... t-t-<C (/) :i~ Final 17.0 13.3 ....... V)
>< LU (..)
<~
lb/ft3 ....... 0.. Unit Dry Wt. 109.5 116. ~ ~::E: t-O
u Cohesion, ton/ft2 2.05 2.19 2.19 3.87
Lateral Pressure, PSI 12.5 22.5 32.5 24
0 Specific Gravity 2.75 2.65 ~V) ~c.. LLJ LLJ ....... :X:...Jt- Percent Saturation 81 87 ............ ~ OOLLJ
(/) 0..
Legend and Notes BORINGS 4, 5 1 =Unconsolidated-undrained Texas Triaxial SITE C 2 = Unconsolidated-undrained Transmatic Brays Bayou at State 3 = Unconsolidated-undrained Triaxial Highway 288, Houston a = Multi-stages Texas b = See Appendix IV N* = Blow count for twelve inches penetration
103

TABLE III-4.--Summary of Tests Results
SAMPLE NUMBER 1 2 3 6 7 9 10
PENETRATION, FT 6.5- 7.5- 9.5- 14- 15- 24- 125-7 8 10 14.5 16 25 26
PENETRATION RESISTANCE, N* 10 22 18 24 24 22 22
Liquid Limit, % 60.1 59.C 56.4 28. ~ 67.4 32.5 33.6
z Plastic Limit, % 17.4 14.5 0
16.8 13.4 22.1 11.0 12.9 ...... ~ Plasticity Index, % 42.7 44.5 ucn
39.6 14.8 45.3 21.5 20.7 ........... LL. V) Percent Passing ...... LIJ cnt- No. 200 Sieve 85.7 59.4 85.3 39.0 95.0 78.5 74.6 V)
< _J u Unified Classification CH CH CH sc CH CL CL
Subgroup H H H H Sa Sa
Type of Test 1 3 1 1 1 1 3 t- Initial 23.3 22.2 20.5 18.4 24.1 15.7 15.7 z o::z
0 LIJ LIJ _J ...... t-t-c(V) i~ Final 23.3 16.8 21.0 18.0 22.7 16.2 15.4 ...... V)
>< LIJ u <CO::
lb/ft3 ...... 0.. Unit Dry Wt. 98.7 106.6 107.1 107. E 102.8 l12.3 115.7 o::x t-O
u Cohesion, ton/ft2 1.03 1.03 1.80 1.51 1.92 1.59 1.05
Lateral Pressure, PSI 5.0 6.0 7.5 11.0 11.5 18.5 19.5
0 Specific Gravity 2.75 2.75 2.75 2.70 2.75 2.73 2.73 0:: V) 0:: 0.. LLJ LLJ ...... :C:_Jt- Percent Saturation 86 81 96 86 94 84 90 ........... 0:: COLLI
V) 0..
Legend and Notes BORINGS 6, 7 1 =Unconsolidated-undrained Texas Triaxial SITE D 2 = Unconsolidated-undrained Transmatic 3 =Unconsolidated-undrained Triaxial Interstate Highway a = Multi-stages 45 at Nettleton St., b = See Appendix IV Houston, Texas N* = Blow count for twelve incnes penetration
104

TABLE III-4-CONTINUED.--Summary of Tests Results
SAMPLE NUMBER 11 .13 14 17 19 21 2nd stage
PENETRATION, FT 26- -28- 29- 31.5- 33- 34.5-27 29 30 32 33.5 35
PENETRATION RESISTANCE, N * 32 32 26 22 28
Liquid Limit, % 40.7 30.6 33.1 25.0 24.8 23.9
:z: Plastic Limit, % 10.9 16.0 14.8 16.5 17.3 18.1 0 ~
1- Plasticity Index, % 9.8 14.6 18.3 8.5 7.5 5.8 ~ u (/) ~~-LL Cl) Percent Passing ~ L&.l V)f- No. 200 Sieve 60.5 68.0 62.9 54.0 59.5 83.4 V) c:( --l u Unified Classification CL CL CL CL CL CL-ML
Subgroup Sa Sa Sa Sa Sa
Type of Test 1 3 1 1 3 lab lab
1- Initial 15.0 13.5 12.1 15.8 15.6 15.9 :z: cx:z: 0 LIJ LIJ
--l ~ 1-1-~(/) :i~ Final 13.2 14.0 12.6 16.3 16.5 16.6 ~ (/)
>< LLJ (..) ~0::
lb/ft3 ~a.. Unit Dry Wt. 117. t 120.6 l21.1 115. E 113.4 111.5 O:::E: t-O
u Cohesion, ton/ft2 2.50 1.95 3.36 3.56 1. 39 2.35 3.13
Lateral Pressure, PSI 20.0 21.5 23.0 23.0 23.5 14 24
0 Specific Gravity 2.73 2.73 2.73 2.73 2.73 2.70 0::: (/) 0::: 0.. LLJ LLJ ..... ::X::--JI- Percent Saturation 84 90 83 92 87 84 1-~C:: OOL&J
V) 0..
Legend and Notes BORINGS 6, 7 1 =Unconsolidated-undrained Texas Triaxial SITE D 2 = Unconsolidated-undrained Transmatic 3 = Unconsolidated-undrained Triaxial Interstate Highway 45 a = Multi-stages at Nettleton Street, b = See Appendix IV Houston, Texas N* = Blow count for twelve inches penetration
105
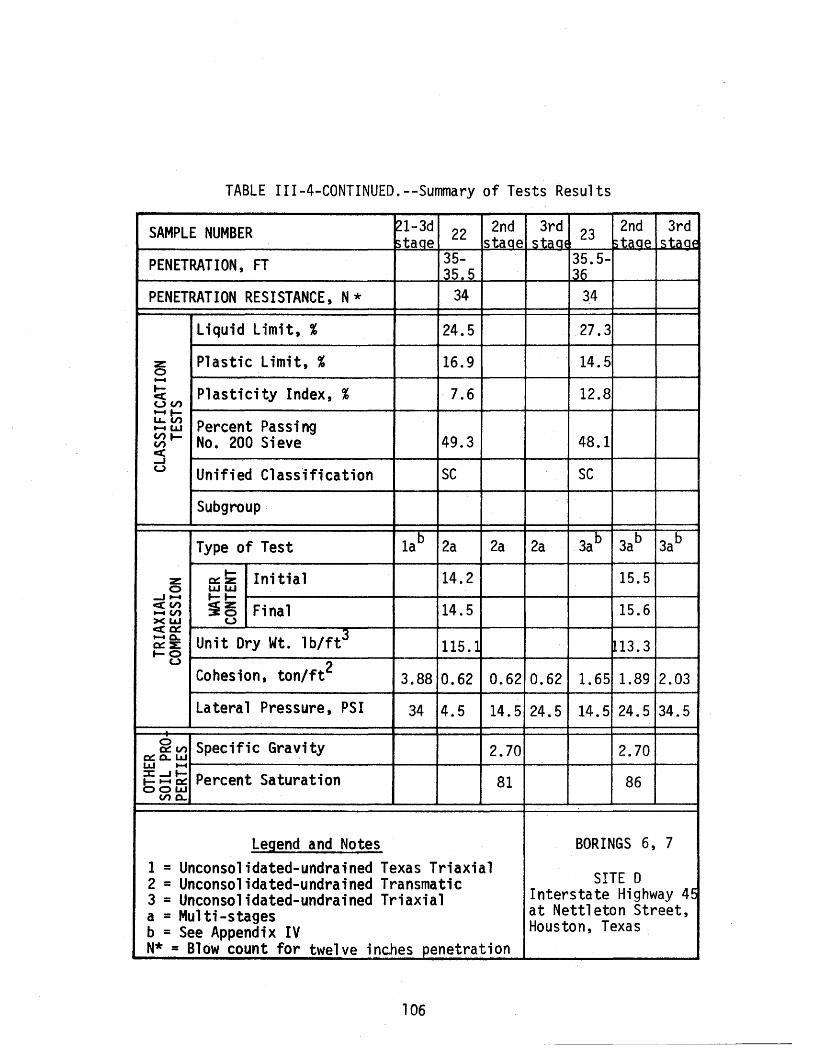
TABLE III-4-CONTINUED.--Summary of Tests Results
SAMPLE NUMBER 21-3d 22 2nd 3rd 23 2nd 3rd staoe staoe staoE staoe staoe
PENETRATION, FT 35- 35.5-35.5 36
PENETRATION RESISTANCE, N* 34 3.4
Liquid Limit, % 24.5 27.3
z: Plastic Limit, % 16.9 14.5 0 ...... ~ Plasticity Index, % 7.6 12.8 u (/') ...... t-LL. Cl') Percent Passing ...... LLJ Vll-- No. 200 Sieve 49.3 48.1 Cl') c:( ..J u Unified Classification sc sc
Subgroup
Type of Test lab 2a 2a 2a 3ab 3ab 3ab
t- Initial 14.2 15.5 z: o::::z 0 LLJ LLJ
..J ...... t-t-c:c (/') :i~ Final 14.5 15.6 ...... Cl') >< LLJ u <0::::
1 b/ft3 ...... 0.. Unit Dry Wt. 115.1 ~13.3 O::::::E t-O
u Cohesion, ton/ft2
3.88 0.62 0.62 0.62 1.65 1.89 2.03
Lateral Pressure, PSI 34 4.5 14.5 24.5 14.5 24.5 34.5
0 Specific Gravity 0:::: Cl') 2.70 2.70 0:::: 0.. LLJ LLJ ...... :::C..Jt- Percent Saturation 81 86 t- ...... 0:::: OOLLJ
Cl') 0..
Legend and Notes BORINGS 6, 7 1 =Unconsolidated-undrained Texas Triaxial SITE 0 2 =Unconsolidated-undrained Transmatic 3 = Unconsolidated-undrained Triaxial Interstate Highway 45 a = Multi-stages at Nettleton Street, b = See Appendix IV Houston, Texas N* = Blow count for twelve inches penetration
106

TABLE III-4-CONTINUED.--Summary of Tests Results
SAMPLE NUMBER 24
PENETRATION, FT 36.5-37
PENETRATION RESISTANCE, N* 46
Liquid Limit, % 24.8
z: Plastic Limit, % 17.5 0 ~
~ Plasticity Index, % 7.3 uen ~~--u. en Percent Passing ~ LLJ ent- No. 200 Sieve 51.1 en c:C _. u Unified Classification CL
Subgroup Sa
Type of Test 1 1- Initial 16.9 z: c: z:
0 I..&J LLJ _. .... 1-1-c:e en :i~ Final 16.6 ~en X LLI u c:CC:
lb/ft3 114.: ......., 0.. Unit Dry Wt. O::::::E: 1-0
u Cohesion, ton/ft2 2.47
Lateral Pressure, PSI 25.0
0 Specific Gravity 2.73 o:::: en 0::: 0.. LLJ LLJ .... :I: -II- Percent Saturation 92 f-t-tO:: OOLLJ
en o..
Legend and Notes BORINGS 6, 7
1 = Unconsolidated-undrained Texas Triaxial SITE D 2 = Unconsolidated-undrained Transmatic Interstate Highway 45 3 = Unconsolidated-undrained Triaxial at Nettleton Street, a = Multi-stages Houston, Texas b = See Appendix IV N* = Blow count for twelve inches penetration
107
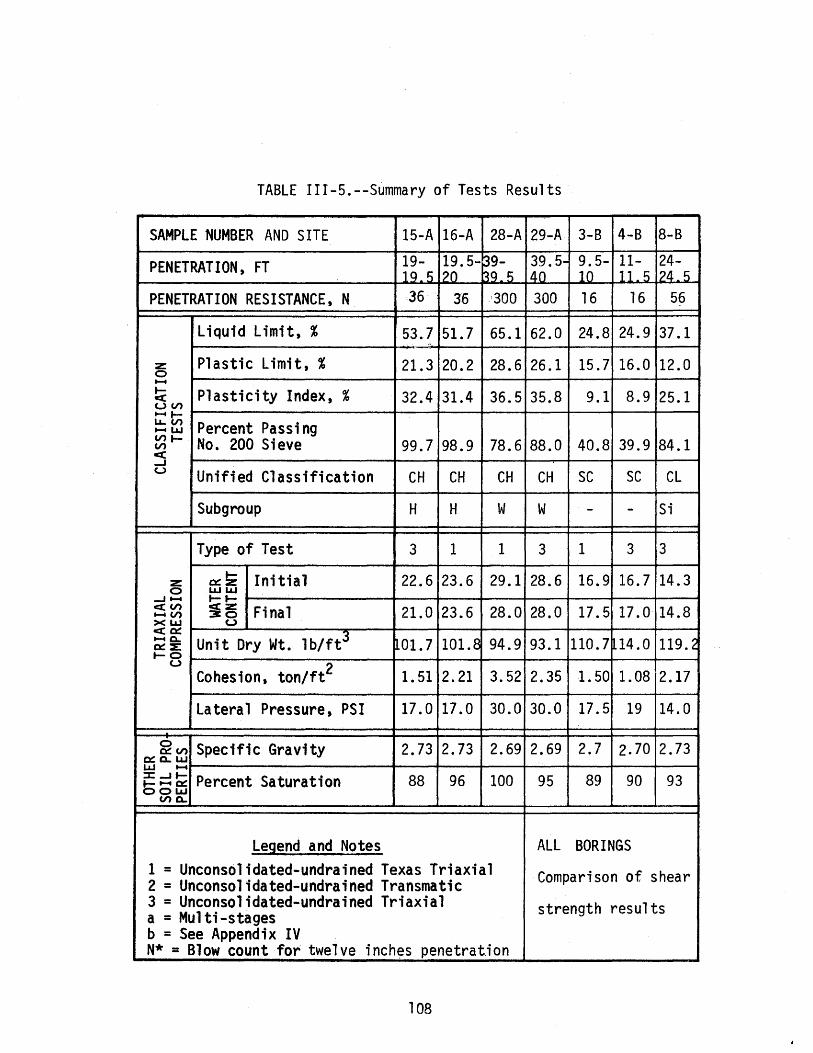
TABLE 111-5.--Summary of Tests Results
SAMPLE NUMBER AND SITE 15-A 16-A 28-A 29-A 3-8 4-B 8-B
PENETRATION, FT 19- 19.5-39- 39.5- 9.5- 11- 24-19 5 20 39 5 40 10 11 5 24 5
PENETRATION RESISTANCE, N 36·- 36 ·300 300 16 16 56
Liquid Limit, % 53.7 51.7 65.1 62.0 24.8 24.9 37.1 -
:z Plastic Limit, % 21.3 20.2 28.6 26.1 15.7 16.0 12.0 0 ...... I- Plasticity Index, % 32.4 31.4 36.5 35.8 9.1 8.9 25.1 c:t: (..)V) ...... I-LL. V) Percent Passing ...... lJJ V)f- No. 200 Sieve 99.7 98.9 78.6 88.0 40.8 39.9 84.1 V)
cc -l u Unified Classification CH CH CH CH sc sc CL
Subgroup H H w w - - Si
Type of Test 3 1 1 3 1 3 3
:z I-
0:: :z Initial 22.6 23.6 29.1 28.6 16.9 16.7 14.3 0 lJJ lJJ
-l ...... I-t-cc V)
=-~ Final 21.0 23.6 28.0 28.0 17.5 17.0 14.8 ...... V) >< LaJ u ceo::
1 b/ft3 ...... c.. Unit Dry Wt. l0l.7 101.8 94.9 93.1 110.7 ~14.0 119.2 0::~ t-O u
Cohesion, ton/ft2 1.51 2.21 3.52 2.35 1.50 1.08 2.17
Lateral Pressure, PSI 17.0 17.0 30.0 30.0 17.5 19 14.0
0 Specific Gravity 2.73 2.73 2.69 2.69 2.7 2.70 2.73 0:: V) 0:: c.. lJJ UJ ...... :1: -l t- Percent Saturation 88 96 100 95 89 90 93 1- ...... 0:: OOUJ
V) c..
Legend and Notes ALL BORINGS 1 = Unconsolidated-undrained Texas Triaxial Comparison of shear 2 = Unconsolidated-undrained Transmatic 3 = Unconsolidated-undrained Triaxial strength results a = Multi-stages b = See Appendix IV N* = Blow count for twelve inches penetration
108
_ ___.

TABLE III-5-CONTINUED.--Summary of Tests Results
SAMPLE NUMBER AND SITE 9-B 12-B 13-B 16-B 18-B 25-B 27-B
PENETRATION, FT · 24. 5· 27.5- 28.5 33- 34.5- 43.5- 44.5-25 28 29 33.5 35 44 45
PENETRATION RESISTANCE, N 64 64 56 48 48 92 80
Liquid Limit, % 37.8 48.0 46.1 33.4 28.9 69.7 65.2
z Plastic Limit, % 13.5 12.4' 17.6 17.0 15.1 22.9 24.2 0 ...... ~ Plasticity Index, % 24.3 35.6 28.5 16.4 13.8 46.8 41.0 ucn ..... t-LL.. V) Percent Passing ...... Ll.l V)f- No. 200 Sieve 81.3 89.0 96.3 89.4 90.6 99.6 96.9 V) c:( -l u Unified Classification CL CL CL CL CL CH CH
Subgroup Si Si Si Si Si w w
Type of Test 1 3 1 3 1 3 1
t- Initial 14.2 1"1-.7 z 0:: z 19.0 19.4 19.5 24.9 24.5 0 Ll.l Ll.l -lt-f .......... c:(V) :i~ Final 15.4 18. 9. ...... V) 21.5 20.8 23.4 25.6 23.2 >< Ll.l u ct:O::
lb/ft3 ...... ~ Unit Dry Wt. ~17.4 110.€ 106. ~ 102.: o::z: 108.0 103.6 101.: .-o u Cohesion, ton/ft2
3.27 1.71 2.99 1.08 1.48 1.67 3.06
Lateral Pressure, PSI 14.5 15 16.0 17.0 17.5 20.5 21.0
0 Specific Gravity 2.73 2.67 2.75 2.75 0:: V) 2.67 2.67 2.67 ex::~ LaJ Ll.l ...... ::X::-lt- Percent Saturation 90 97 94 100 97 .......... 0:: 100 96 0 0 Ll.l
V) 0..
Legend and Notes ALL BORINGS 1 = Unconsolidated-undrained Texas Triaxial Comparison of shear 2 = Unconsolidated-undrained Transmatic 3 = Unconsolidated-undrained Triaxial strength results a = Multi-stages b = See Appendix IV N* = Blow count for twelve i nch.es penetration
109

TABLE 111-5-CONTINUED.--Summary of Tests Results
SAMPLE NUMBER AND SITE 32-B 33-B 2-C 3-C 9-C 10-C 12-C
PENETRATION, FT 49. 5· ·50- 5- 5.5- 11- II.~- 13-50 50.5 5.5 6 11.5 12 13.5
PENETRATION RESISTANCE, N 80 80 80 80 36 36 48
Liquid Limit, % 36.1 38.6 39.5 42.8 62.8 60.7 22.2
z: Plastic Limit, % 0
17.6 19.4 13.1 11.5 17.2 14.7 12.5 ...... ~ Plasticity Index, % 18.5 19.2 26.4 31.3 45.6 46.0 9.7 <.,)(/') ...... t-LL. (/') Percent Passing ...... UJ V)t- No. 200 Sieve 94.2 100 69.9 65.7 94.7 90.7 72.9 (/')
< -I u Unified Classification CL CL CL CL CH CH CL
Subgroup Si Si Sa Sa H H Sa
Type of Test 3 1 3 1 1 3 1 ' t-
z: ~:z Initial 21.9 19.0 12.9 12.3 18.1 19.6 13.8 0 UJ UJ
-I ...... t-t-<(/') :i~ Final 21.6 22.6 13.8 12.1 20.1 20.0 13.8 ...... (/') >< UJ u <~
1 b/ft3 ...... 0.. Unit Dry Wt. 103.5 106.1 117.2 119. f 109.8 107.2 114.8 ~:::E t-0 u
Cohesion, ton/ft2 1.25 2.09 2.43 4.38 2.05 1.50 1.98
Lateral Pressure, PSI 22.5 22.5 5 5 9.5 9.5 11.0
0 Specific Gravity 2.67 2.67 2.75 2.75 2.74 2.74 2.75 0: (/') ~ 0.. UJ LLJ ...... ::C-It- Percent Saturation 95 97 79 77 94 91 77 t- ..... ~ OOL&J
V) Q.
Legend and Notes ALL BORINGS 1 = Unconsolidated-undrained Texas Triaxial Comparison of shear 2 =Unconsolidated-undrained Transmatic 3 = Unconsolidated-undrained Triaxial strength results a = Multi-stages b = See Appendix IV N* = Blow count for twelve ·inches penetration
110

TABLE III-5-CONTINUED.--Summary of Tests Results
SAMPLE NUMBER AND SITE 13-C 16-C 18-C 22-C 24-C 2-D 3-D
PENETRATION, FT 13.5· 15.5-~7.5- 20.5- 21.5- 7.5- 9.5-14 16 tl8 21 22 8 10
PENETRATION RESISTANCE, N 48 44 44 60 64 44 36
Liquid Limit, % 23.7 31.5 29.7 33.1 34.3 59.0 56.4
z: Plastic Limit, % 11.7 11.7 11.9 11.2 11.2 14.5 16.8 0 lo-o4
~ Plasticity Index, % 12.0 19.8 17.8 21.9 23.1 44.5 39.6 (..) (/') 1o-o4l-La..(/') Percent Passing lo-o4 LJJ (1)1- No. 200 Sieve 78.2 80.5 74.2 85.2 87.2 59.4 85.3 (/')
< ...J (..) Unified Classification CL CL CL CL CL CH CH -
Subgroup Sa Sa Sa Si Si H H
Type of Test 3 1 3 1 3 3 1
z: 0::~ Initial 13.5 13.5 15.9 16.1 15.4 22.2 20.5 0 LJJ LJJ
...J lo-o4 t-t-c:(V')
=-~ Final 14.4 14.3 13.5 15.9 16.7 16.8 21.0 ..... (/') >< LJJ (..) <(0::
lb/ft3 lo-o4 0.. Unit Dry Wt. .. 15.8 115.3 112.4 113.9 114.9 106. E 107.1 o:::e: 1-0
(..)
Cohesion, ton/ft2 1.24 2.41 1.50 2.42 1.53 1.03 1.80
Lateral Pressure, PSI 11.5 13.0 14.5 17.0 17.5 6.0 7.5
0 Specific Gravity 2.75 2.75 2.75 2.75 2.75 2.75 2.75 0:: (/') 0:: c.. LJJ LLJ ...... X...JI- Percent Saturation 80 78 77 87 89 81 96 ,_ ..... 0::: OOLJJ
(/')c..
Legend and Notes ALL BORINGS 1 =Unconsolidated-undrained Texas Triaxial Comparison of shear 2 =Unconsolidated-undrained Transmatic 3 = Unconsolidated-undrained Triaxial strength results a = Multi-stages b = See Appendix IV N* = Blow count for twelve inches penetration
111

TABLE III-5-CONTINUED.--Summary of Tests Results
SAMPLE NUMBER AND SITE 9-D 10-D 13-D 14-D 17-D 19-D
PENETRATION, FT 24- 25- 28- 29- 31.5- 33-25 26 29 30 32 33.5
PENETRATION RESISTANCE, N 44 44 64 52 44 56
Liquid Limit, % 32.5 33.6 30.6 33.1 25.0 24.8
z Plastic Limit, % 11.0 12.9 16.0 14.8 16.5 17.3 0 .......
~ Plasticity Index, % 21.5 uen 20.7 14.6 18.3 8.5 7.5 ....... ~ u. en Percent Passing ....... lJJ en~ No. 200 Sieve 78.5 74.6 68.0 62.9 54.0 59.5 en ct: ...J u Unified Classification CL CL CL CL CL CL
Subgroup Sa Sa Sa Sa Sa Sa
Type of Test 1 3 3 1 1 3 ~ Initial 15.7. 15.7 13.5 12.1 15.8 15.6 z ex: z
0 lJJ lJJ ....1 ....... ~~ c:c en :i~ Final 16.2 15.4 14.0 12.6 16.3 16.5 .....,. en >< lJJ u c:(CX:
lb/ft3 ....... 0.. Unit Dry Wt. l12.3 115.7 120.6 121.] 115.6 13.4 CX::::E: ~0 u
Cohesion, ton/ft2 1. 59· 1.05 1.95 3.36 3.56 1.39
Lateral Pressure, PSI 18.5 19.5 21.5 23.0 ' 23.0 23.5
0 Specific Gravity 2.73 2.73 2.73 2.73 2.73 2.73 ex: en ex: 0.. L&J lJJ ....... :X: ....I~ Percent Saturation 84 90 90 83 92 87 ~ ...... ex: OOLJJ
en o..
Legend and Notes ALL BORINGS 1 = Unconsolidated-undrained Texas Triaxial Comparison of shear 2 = Unconsolidated-undrained Transmatic 3 = Unconsolidated-undrained Triaxial strength results a = Multi-stages b = See Appendix IV N* = Blow count for twelve inches penetration
112

APPENDIX IV
MOHR'S DIAGRAMS
113

5~------------------------------------------------------------------------
4 _... ..,: LL.
0 (I)
' (I) z o3 t--(I) Cl) w 0:
_, .... _, '(I) ·~ 2
0: 4 I&J % (/)
SITE-A .
PENETRATION-19-19.5
MATERIAL- CH
UNIT DRY WT. --101.7
DEGREE SAT.- 88°/o-
TYPE OF TEST~ UNDRAINED STANDARD TRIAXIAL
L.L.- 53.7°/o
P.L.- 21.3 °/o P.l ..... 32.4°/o
0/o-200-99.7o/o
0~~----~------~----------------~--------~~--------------------~ 1.0 2.0 3.0 4.0 5.0 6.0 7.0 CONFINING PRESSURE {TONS/SQ.FT.)
FIG.-IV- I TRIAXIAL COMPRESSION TEST RESULTS UNCONSOLIDATED
UNDRAINED MULTIPLE STAGE

__, __, 0'1
5~------------------------------------------------------------------------~
-~ LL
ci U)
' U)
4
~3 .... -U) cl) w 0: t(1)2
0: ct w :z: ({)
SITE-A
PENETRATION-19. 5-20
MATERIAL- CH UNIT DRY WT.- 101.8
DEGREE SAT.- 96°/o
TYPE OF TEST-UNDRAINED TEXAS TRIAXIAL
L.L.- 51.7°/o
P.l.- 20.2 °/o
P.l.- 31.4°/o 0/o -200- 98.9°/o
0~~----~--~--~~------~------~~----~------~~------~------~ 1.0 2.0 3.0 4.0 5.0 6.0 7.0
CONANING PRESSURE (TONS/SQ.FT.}
FIG.-IV-2 TRIAXIAL COMPRESSION TEST RESULTS UNCONSOLIDATEDUNDRAINED MULTIPLE STAGE

--..... --. 0\
5~----------------------------------------------------------------------~
-.,_; LL
0 (/)
' Cl)
4
~3 t--(/)
0 1&1 « t-
'Cl) 2
0:: C(
"' X (/)
SITE- A
PENETRATION- 21-21.5 MATERIAL- CL
UNIT DRY WT.- 108.1 DEGREE SAT. - 98 °/o
TYPE OF TEST-UNDRAINED TRANSMATIC L.L.-43.9°/o
P.L.- 18.8 °/o
P.l.- 25.1 °/o 0/o-200-99.1 °/o
0~-L----~~------~~----~----------~~------~--~--_.~------~~----~ 1.0 2.0 3.0 4.0 5.0 6.0 7.0
CONANING PRE~URE (TONS/SQ.FT.)
FIG.-IV- 3- TRIAXIAL COMPRESSION TEST RESULTS UNCONSOLIDATEDUNDRAINED MULTIPLE STAGE

__. ___,
- .'-J
5~------------------------------------------------------------------~
-,_: LL
a en ' en
4
~3 .... -en cl) &&J 0: ...
\ Cl) 2
0: C( &&J :t: f,f)
SITE- A
PENETRATION- 41-41.5 MATERIAL- CH
UNIT DRY WT.-98.6 DEGREE SAT.- 98°/o
TYPE OF TEST- UNDRAINED TEXAS TRIAXIAL
L.L.- 50.9°/o
P.L.- 21.9 °/o P.l.- 29.0 °/o
0/o-200- 84°/o
0~----~-L--~----L-L-----~--------~------~------~--------~---------1.0 2.0 3.0 4.0 5.0 6.0 7.0
CONFINING PRESSURE (TONS/SQ.FT.)
FlG.-IV-4-TRIAXIAL. COMPRESSION TEST RESULTS UNCONSOLIDATED
UNDRAINED MULTIPLE STAGE
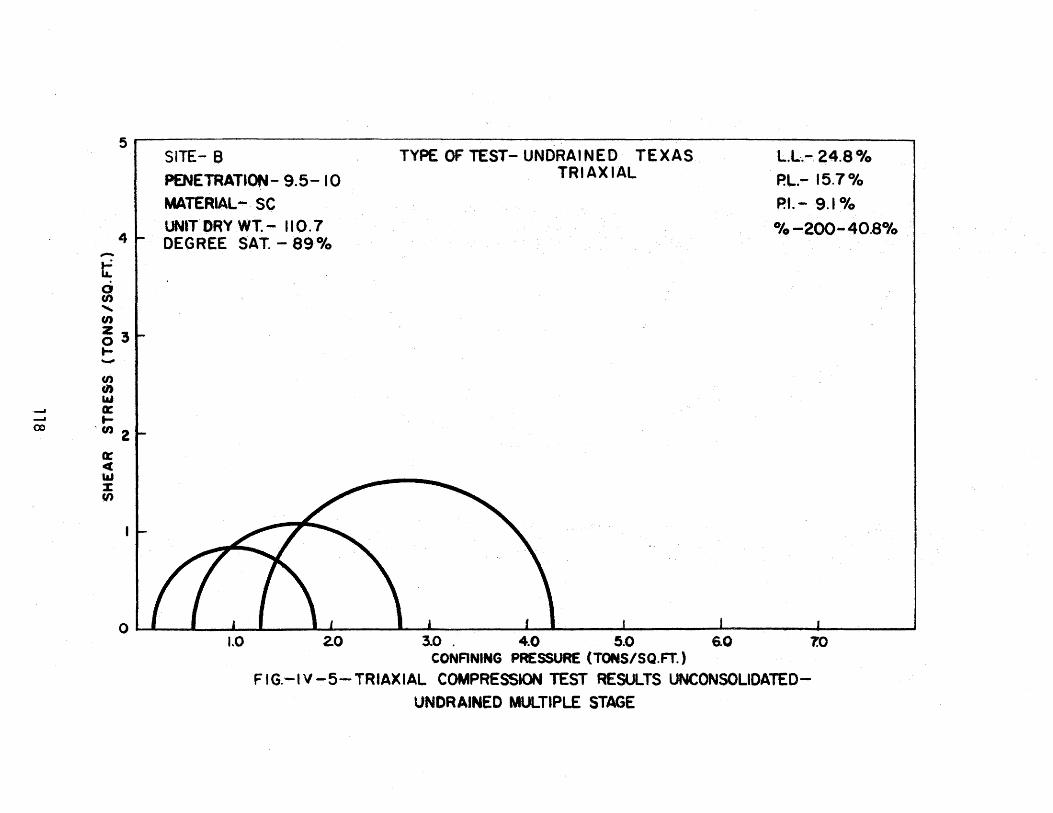
_ __, __, CD
5--------------------------------~--------------------------~------------
-.,_; u. a (/)
' Cl)
4
~3 .... -(/)
0 1&1 0: t-
' Cl) 2
0: c 1&1 % en
SITE- 8 PENETRATION- 9.5- 10 MATERIAL- SC UNIT DRY WT.- 110.7 DEGREE SAT. - 89°/o
TYPE OF TEST- UNDRAINED TEXAS TRIAXIAL
L.L-.-. 24.8 °/o
P.L.- 15.7°/o
P.l.- 9.1 °/o 0/o -200- 40.8°/o
0~--~---L~~--~~----~~~------~~------~------~--------~------~ 1.0 2.0 3.0 . 4.0 5.0 6.0 7.0
CONANING PRESSURE (TONS/SQ.FT.)
FIG.-IV-5-TRIAXIAL COMPRESSION TEST RESULTS UNCONSOLIDATEDUNDRAINED MULTIPLE STAGE

__, __, ~
51 SITE-8 TYPE OF TEST- UNDRAINED STANDARD
TRIAXIAL L.L.-24.9°/o
P.L.- 16.0 •to P.l.- 8.9 °/o
4 -,_; ..... a V) ....... U)
z3 0 t--(/) en ld 0: .... (1)2
a: <( .... X C/)
- PENETRATION- 11-11.5
MATERIAL- SC UNIT DRY WT.- 114.0 DEGREE SAT.- 95°/o
0/o-200-39.9°/o
o~L--L--~-L----~--~--~--~---L------~------~------~~------1.0 2.0 3.0 4.0 ~.0 6..0 lO
CONFINING PRESSURE (TONS/SQ.FT.)
FIG.-IV-6 TRIAXlAL COMPRESSION TEST RESULTS UNCONSOltDATEDUNOR AINED MULTIPLE STAGE
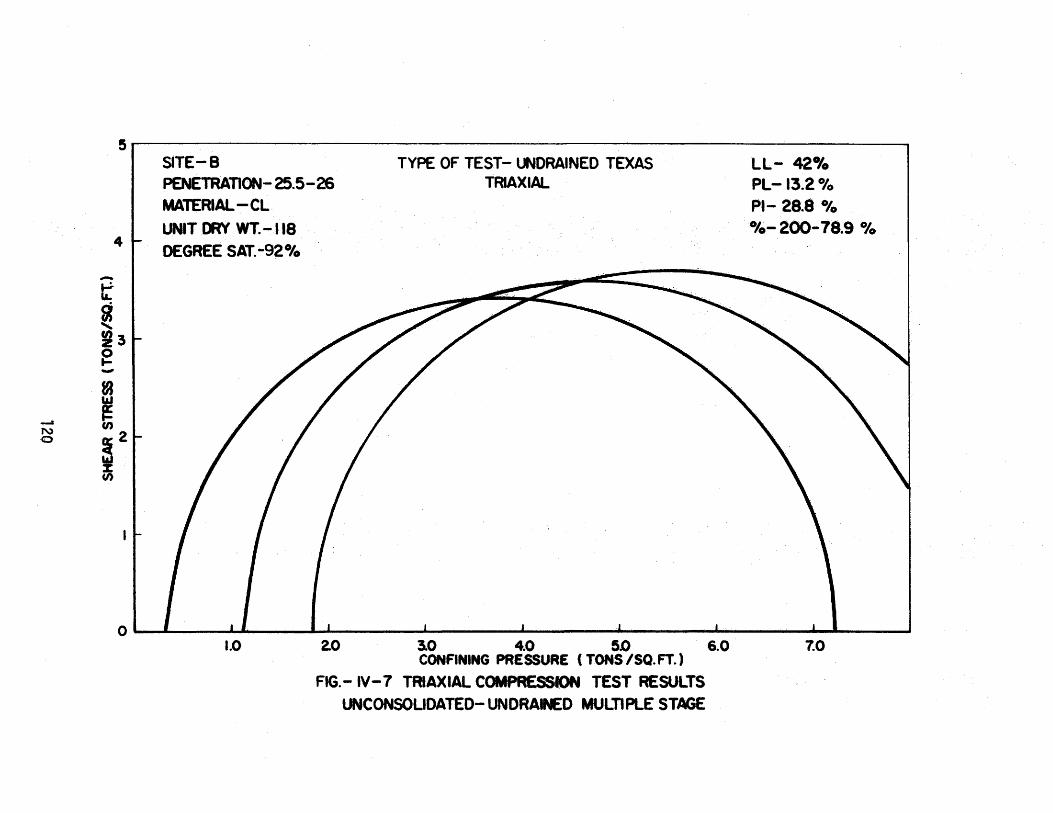
-N 0
5~----------------------------~--------~--------------------------~
4
-tt ~ ' 13 e -81
m a:2 4
~ C/)
SlTE-B PENETRATION- 25.5-26 MATERIAL-CL UNIT DRY WT. -118 DEGREE SAT. •92°/o
TYPE OF TEST- UNDRAINED TEXAS TRIAXIAL
LL- 42°/o PL-13.2 °/o PI- 28.8 °/o 0/o- 200-78.9 °/o
0~~----~~----~~------~--------~----~~--------~----~~~------1.0 2.0 3.0 4.0 5.0 . 6.0
CONFINING PRESSURE ( TONS/SQ.FT.)
FIG.-IV-7 TRIAXIAL COMPRESSION TEST RESULTS UNCONSOLIDATED- UNDRAINED MULTIPLE STAGE
7.0

--A
N __,
5 r------·
..,: u... 0 (/)
' (I)
4
~3 .... .._ Cl) Cl) LtJ « ....
. Cl) 2
cr C( LtJ X f/)
SITE-8
PENETRATION- 27. 5- 28 MATERIAL- CL
UNIT DRY WT.- 110.6
DEGREE SAT.- 97°/o
TYPE OF TEST- UNDRAINED STANDARD TRIAXIAL
L.L.- 48°/o
P.l.- 12.4°/o
P.f.- 35.6°/o 0/o -200-89°/o
01 I J.l I I I
l.O 2..0 3.0 4.0 5.0 6.0 7.0 CONANING PRESSURE {TONS/SQ. FT.)
FIG.-IV-8 TRIAXIAL COMPRESS10N TEST RESULTS UNCONSOLIDATED
UNDRAINED MULTIPLE STAGE

__, . N N
-.-: lL
0 C/'1
' U')
5
4
~3 ... ._... (/)
en "' ~ .... U)2
~ <( 1&1 :X: (/)
SITE- 8 PENETRATION- 40.5- 41
MATERIAL- CH UNIT DRY WT.-101.8 DEGREE SAT. .... 91 °/o
TYPE OF TEST- UNDRAINED TEXAS TRIAXIAL
L.L.- 53.3°/o
P.L.- 20.3 °/o
P.l.- 33.0°/o 0/o-200-98.80fo
0~----~~---L----~~----~--------~--~----~------------~--~------~ 1.0 2.0 3.0 4.0 6.0 6.0 lO
CONFINING PRESSURE (TONS/SQ.FT.)
FIG.-IV-9 TRIAXIAL COMPRESSION TEST RESULTS UNCONSOLIDATEDUNDRAINED MULTIPLE STAGE

I .
__,
"' w
-,_; ~
~ ' (I)
5
4
~3 t--{/) Cl)
1&1 Ct: ....
. (I) 2
0: <[ 1&.1 z f/)
SITE- B
PENETRATION- 43.5-44 MATERIAL- CH
UNIT DRY WT. --101.3
DEGREE SAT. -100 °/o
TYPE OF TEST- UNDRAINED STANDARD TRIAXIAL
L.L.-68.7°/o
P.L.- 22.9°/o
P.l.- 46.8 °/o 0/o -200- 99.6 °/o
0~----~~--~----~~----~------~~----~~----------------~--------1.0 l.O ~0 4.0 5D 6.0 7.0
CONANING PRESSURE (TONS/SQ.FT.)
FIG.-IV-10 TRIAXIAL COMPRESSJON TEST ~SULTS UNCONSOLIDATED
UNDRAINED MULTIPLE STAGE

__, N ~
,......
t: g ' en
5
4
~3 ... -(I) Cl) LLI .&X t-
1 U) 2
~ 4 LLI :X: (/)
SITE.,.. B.
PENETRATION-49.5-50 MATERIAL-CL \.WIT DRY WT. -1035 DEGREE SAT.-95°/o
TYPE OF TEST- UNDRAINED STANDARD TRIAXIAL
L.L:-36.1 °/o P.L.- 17.6°/o P.!.- 18.5°/o
0/o-200-94.2°/o
0~------~-----L--~--~~~~------~~------~--------~--------~--~--~ l.O 2.0 3.0 4.0 5.0 6.0 7.0
CONANING PRESSURE (TONS/SQ.FT.)
FIG.-IV -II TRIAXIAL COMPRESSION TEST RESULTS ~CONSOLIDATED
UNDRAINED MULTIPLE STAGE

__, N <.11
5-----------------------------------------------------------------------
-...,: LL
0 U)
' U)
4
~3 t--U) 0 Ill a: tf/)2
cr <l I&J z q)
SITE- 8
PENETRATION- 58.5-59 MATERIAL- C L UNIT DRY WT.- 101.4 DEGREE SAT.- 96°/o
TYPE OF TEST- UNDRAINED TEXAS TRIAXIAL
L.L.- 27.5°/o
P.L.- 18.6 °/o P.l.- 8.9°/o
0/o -200- 95.7 °/o
o~-------~~-----~~--~---~----------~~~-----~--~--~--------~------~ 1.0 2.0 3.0 4.0 5.0 6.0 7.0
CONANING PRESSURE {TONS/SQ.FT.)
FtG.-1\1-12-TRIAXIAL COMPRESSION TEST RESULTS UNCONSOLIDATED
UNDRAINED MULTIPLE STAGE
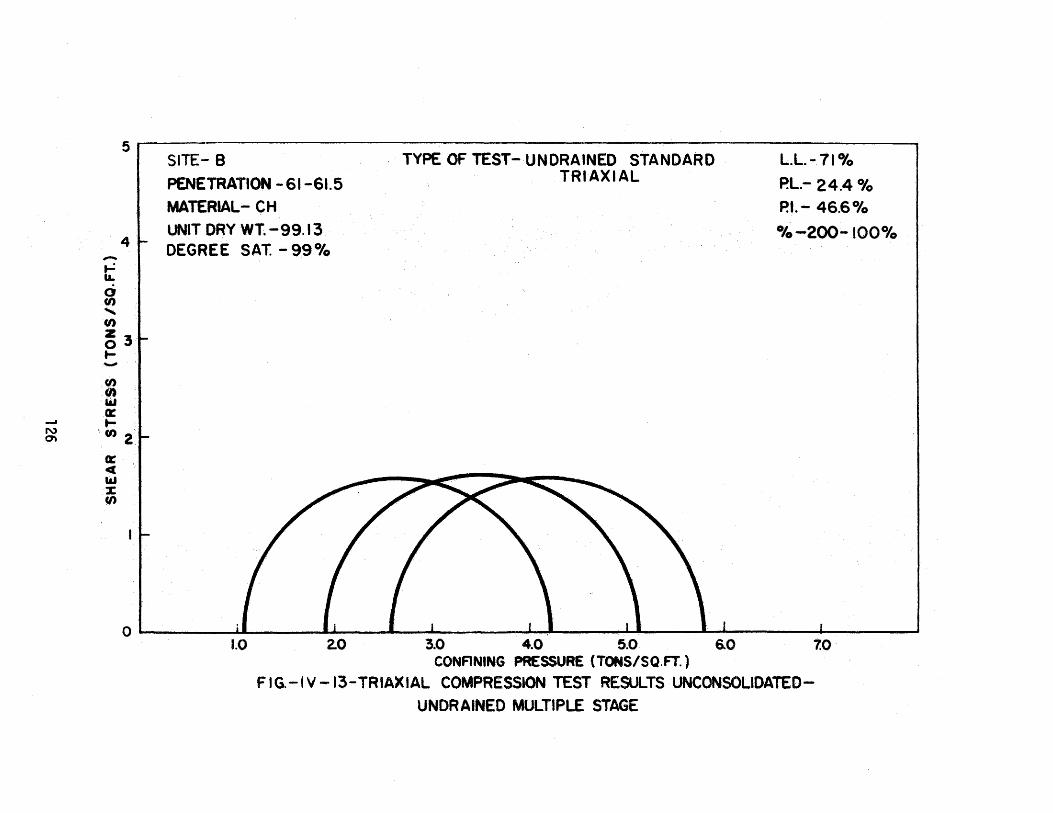
-...,: u. a en
' en
5
4
~3 t--(I)
0 w 0:: _, 1-
~ '(I) 2
0: C( 1&1 % en
I .
SITE- 8
PENETRATION -61-61.5 MATERIAL- CH UNIT DRY WT~-99.13 DEGREE SAT. - 99°/o
TYPE OF TEST- UNDRAINED STANDARD TRIAXIAL
L.L.-71°/o
P.L.- 24.4 °/o
P.l.- 46.6°/o 0/o -200- 100°/o
0~------~~----~._--~~~--------~~------~----~_.--------~------~ 1.0 2.0 3.0 4.0 5.0 6.0 7.0
CONANING PRESSURE (TONS/SQ.FT.)
FtG.-IV-13-TRIAXIAL COMPRESSION TEST RESULTS UNCONSOLIDATED
UNDRAINED MULTIPLE STAGE

5------------------------------------------------------------------------~
-t-= LL
0 U)
' U)
4
~3 .... -U) C1) 1&1 0:
__, .... ~ U)2
0: <( 1&.1 X q)
SITE- C
PENETRATION- 8.5-9 MATERIAL- CH
UNIT DRY WT.-112.0 DEGREE SAT.- 85°/o
TYPE OF TEST- UNDRAINED TEXAS TRIAXIAL
L.L.-61.9°/o
P.L.- 10.3°/o
P.l.- 46.9°/o 0/o-200-71.4 °/o
QLL--~--~-L------~------~--~----~~~--~--------~--~~~------~ !.0 2.0 3.0 4.0 5.0 6.0 7.0
CONANING PRESSURE (TONS/SQ.FT.)
FlG.-IV-14-TRIAXIAL COMPRESSION TEST RESULTS UNCONSOLIDATED
UNDRAINED MULTIPLE STAGE

__, N (X)
5~------------------~------------------~----------~----~-------------
-.,_; .... 0 en "' (/)
4
~3 ~ -en cl) ..... a: ~ . en 2
« C( .., z Jl)
SITE- C
PENETRATIQN -9-9.5
MATERIAL- C H UNIT DRY WT.- 107. 8 DEGREE SAT. - 85°/o
TYPE OF TEST- UNOR,AINED TRANSMATlC . L.L.~ 58.6°/o
P.L.- II. 7 °/o
P.l.- 46.9°/o 0/o-200~ 71.4°/o
0~---L--~~~----~------~--------~----~--._------~--------~------~ 1.0 2.0 3.0 4.0 5.0 6.0 1.0
CONANING PRESSURE {TONS/SQ.FT.)
FIG.-IV-15-TRIAXIAL COMPRESSION TEST RESULTS UNCONSOLIDATEDUNDRAINED MULTIPLE STAGE
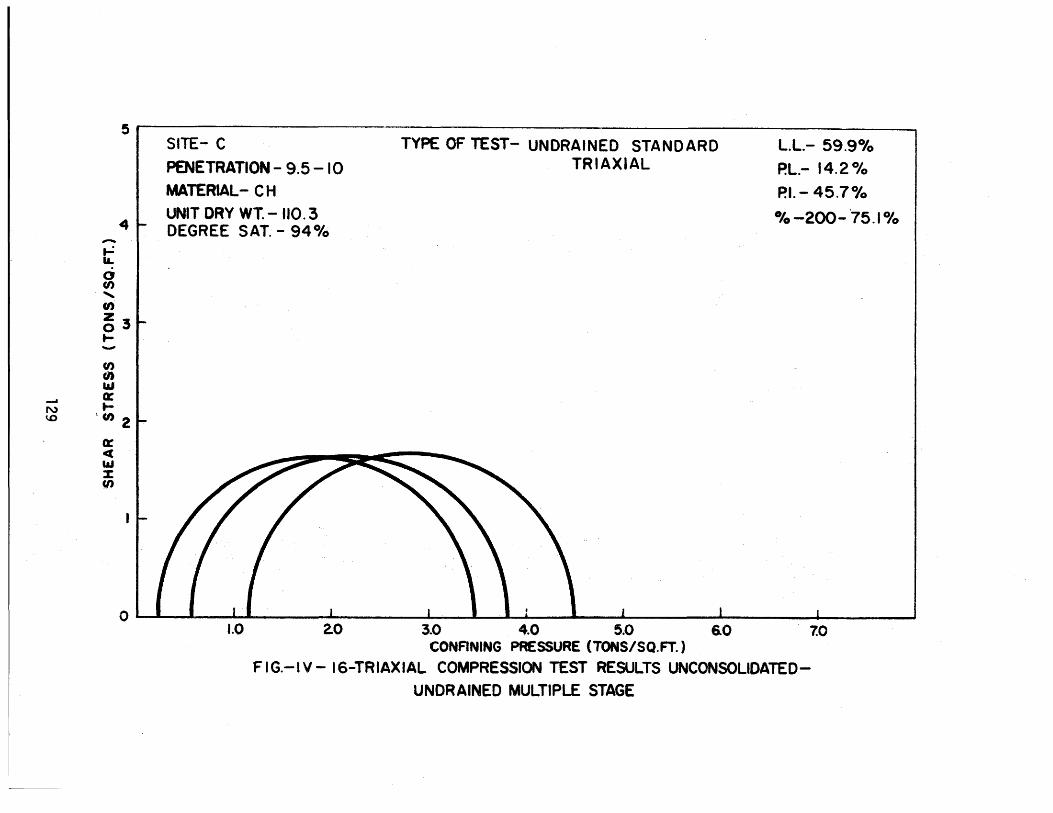
--' N ~
5r------------------------------------------------------------------------
4 -~ I.L
ci (/) ., Cl)
~3 t--(/) fl) .... « t-
\ Cl) 2
« C( LtJ :1: Jl)
SITE- C
PENETRATION- 9.5- I 0 MATERIAL- C H UNIT DRY WT.- 110.3 DEGREE SAT.- 94°/o
TYPE OF TEST- UNDRAINED STANDARD TRIAXIAL
L.L.- 59.9°/o P.L.- 14.2 °/o
P.l.- 45.7°/o 0/o -200- .75.1 °/o
0~--~--~~----~--------~--~~~--~~--~------~------~~----~ 1.0 2.0 3.0 4.0 5.0 6.0 7.0
CONANING PRESSURE {TONS/SQ. FT.)
FIG.-IV- 16-TRIAXIAL COMPRESSION TEST RESULTS UNCONSOLIDATEDUNDRAINED MULTIPLE STAGE

_ __, w 0
5
4 -...,: La.
0 fl) ........ en ~3 ... -fl) Cl) 1.&1 ~ ...
. en 2
~ Cl
"" % (/)
SITE-C
PENETRATION- 27-27.5
MATERIAL....;CL
UNIT DRY WT.-116.5 DEGREE SAT:-88°/o
TYPE OF TEST-UNDRAINED TEXAS TRIAXIAL
L.L.- 33.7°/o
P.L.- 15.3°/o
P.l.- 18.4 °/o 0/o -200-58.9 °/o
0~----~~----~--~~----~--------~--~--~----------~----_.----~---1.0 2.0 3.0 4.0 5.0 6.0 7.0
CONANING PRESSURE (TONS/SQ.FT.)
FIG.-lV-17-TRIAXIAL COMPRESSION TEST RESULTS UNCONSOLIDATEDUNDRAINED MULTIPLE STAGE

___. w ___.
sr------
-_._; LL
ci (/)
' (I)
4
~3 t--(/) en
"" ct: t-
. (I) 2
ct: c(
"' :I: (/)
SITE- C
PENETRATION- 27.5-28 MATERIAL- C L
UNIT DRY WT.- 109.5 DEGREE SAT. - 81°/o
TYPE OF TEST- UNDRAINED STANDARD TRIAXIAL
L.L.- 39°/o
P.l.- 14.5 °/o
P.l.- 24.5°/p 0/o -200-68.1 °/Q
0 --------~----~--~--------~------~~----------------~----~~----------l.O 2.0 3.0 4.0 5.0 6.0 7.0
CONFINING PRESSURE {TONS/SQ.FT.)
FIG.-IV-18-TR1AXIAL COMPRESSION TEST RESULTS UNCONSOUDATED
UND~AINED MULTIPLE STAGE
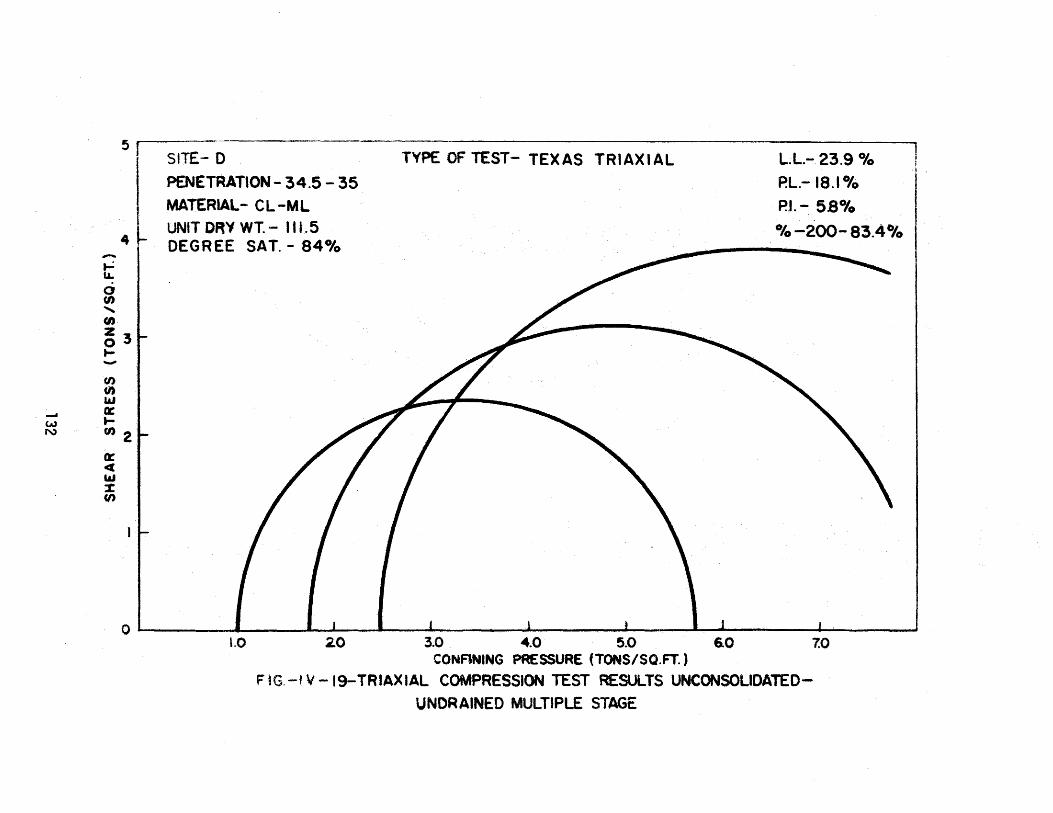
-w N
5 I
4 -.,_; u. 0 fl)
' (I) z3 0 t--<n 0
"' a: ... (1)2
a: 4
"' z VI
SITE-D
PENETRATION- 34.5- 35 MATERIAL- CL-ML
UNIT DRV WT.- II 1.5 DEGREE SAT.- 84°/o
TYPE OF TEST- TEXAS TRIAXIAL L~L.- 23.9 °/o J I ,
P.L.- 18.1 °/o I P.l.-: 58"/o . I
_ ...... ---
0
-Yo--2 ... 00-- 83.4o/o I
o~---------4------~~--~---~--------~--------~----~------------~~------~ l.O 2.0 3.0 4.0 5.0 6.0 7.0
CONANING PRESSURE (TONS/SQ.FT.)
F tG. -tV -19-TRIAXIAL COMPRESSION TEST RESULTS UNCONSOLIDATEDUNDRAINED MULTIPLE STAGE
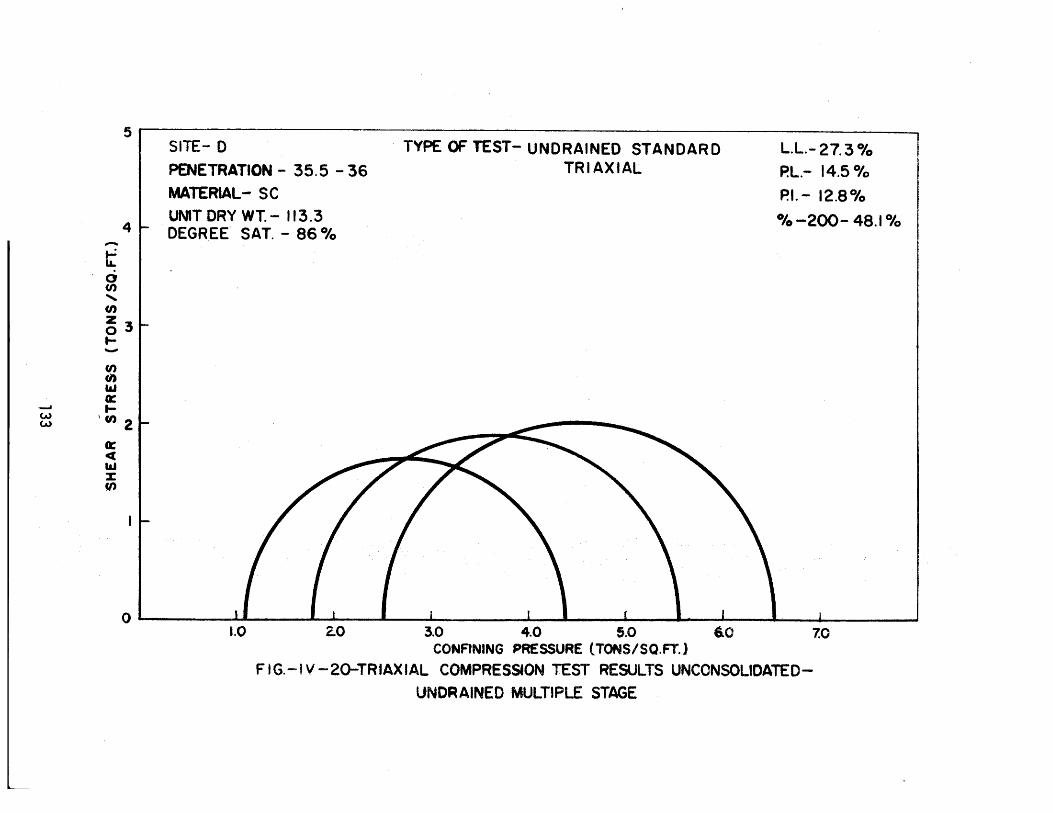
sr------------------------------------------------------------------------
-.,_; La.
a U)
' U)
4
~3 t--U) 0 IAJ 0::
~ t-~ I Cl) 2
0:: c:( laJ z Jl)
SITE- 0
PENETRATION- 35.5 -36 MATERIAL- SC
UMT DRY WT.- 113.3 DEGREE SAT. - 86 °/o
· TYPE OF TEST- UNDRAINED STANDARD TRIAXIAL
L.L.- 27.3 °/o P.L.- 14.5 °/o
P.l.- 12.8°/o 0/o-200- 48.1°/o
0 I II I I I I I I t I I I I I
1.0 2.0 3.0 4.0 5.0 6.0 7.0 CONANING PRESSURE (TONS/SQ.FT.)
FIG.-IV-2Q-TRIAXIAL COMPRESSION TEST RESULTS UNCONSOLIDATED
UNDRAINED MULTIPLE STAGE

END OF REPORT
134