Correlation of Textural qualities in a pound cake to the ...
29
1 IQP SYS - 1830 Correlation of Textural qualities in a pound cake to the mechanical behavior An Interactive Qualifying Project Report submitted to the Faculty of WORCESTER POLYTECHNIC INSTITUTE in partial fulfillment of the requirements for the Degree of Bachelor of Science By ______________________ Michael Blaess Advisor ______________________ Professor Satya Shivkumar Date: April 27, 2011
Transcript of Correlation of Textural qualities in a pound cake to the ...
1
IQP SYS - 1830
Correlation of Textural qualities in a pound
cake to the mechanical behavior
An Interactive Qualifying Project Report submitted to the Faculty of
WORCESTER POLYTECHNIC INSTITUTE
in partial fulfillment of the requirements for the
Degree of Bachelor of Science
By
______________________
Michael Blaess
Advisor
______________________
Professor Satya Shivkumar
Date: April 27, 2011

2

3
Abstract The texture of a pound cake is determined by the mechanical and physical properties of the
overall product. While the effects of ingredients and baking conditions on various types of cakes have
been studied previously, a mechanical model for the development of properties has not been
established. The purpose of this project was to correlate the textural properties of pound cakes
produced under various conditions to their mechanical behavior. Samples were baked at temperatures
of 175 °C, 200 °C, and 225 °C and aged for 0, 1, 3, and 6 days. The compressive and viscoelastic
properties of these cakes were estimated and correlated to texture. Various changes occurring during
the baking of cake were demonstrated and the time needed to transition from a brittle to plastic foam
was established. The data can be used to assess the effects of baking on texture and highlight the
changes occurring during storage.

4
Table of Contents Abstract ......................................................................................................................................................... 3
Table of Figures ............................................................................................................................................. 5
Table of Tables .............................................................................................................................................. 6
1. Introduction .......................................................................................................................................... 7
2. Background Research ............................................................................................................................ 8
2.1 Pound Cake ............................................................................................................................................. 8
2.2 Cellular Solids .......................................................................................................................................... 8
2.3 Maillard Reaction .................................................................................................................................. 10
2.4.1 AAC 1090.01 ....................................................................................................................................... 10
2.4.2 Micro Method for Cake Baking .......................................................................................................... 10
3. Objectives............................................................................................................................................ 11
4. Materials and Methods ....................................................................................................................... 12
4.1 Materials and Equipment...................................................................................................................... 12
4.2 Cake Batter Preparation ........................................................................................................................ 12
4.3 Cooking ................................................................................................................................................. 13
4.4 Compression Testing ............................................................................................................................. 14
4.5 Measuring the Maillard Reaction ................................................................................................... 15
4.6 Height Expansion ............................................................................................................................ 15
5.1 Compression Tests ................................................................................................................................ 16
5.1.1 Analysis of Temperature and Aging on Strain .................................................................................... 18
5.1.2 Analysis of Elastic Modulus ................................................................................................................ 18
5.2 Height Expansion .................................................................................................................................. 19
5.3 Maillard Reaction .................................................................................................................................. 19
5.3.1 Relationship between Brittle Material and Maillard Reaction .......................................................... 20
References .................................................................................................................................................. 23
Appendix B – Stress - Strain Curves after 0 Days of Baking ........................................................................ 25
Appendix C – Stress - Strain Curves after 1 Day of Baking .......................................................................... 26
Appendix D – Stress - Strain Curves after 3 Days of Baking ........................................................................ 27
Appendix E – Stress - Strain Curves after 6 Days of Baking ........................................................................ 28
Appendix G – Measurement of Temperature in Sample .......................................................................... 29
5
Table of Figures Figure 1 - Standard Pound Cake .................................................................................................................... 8 Figure 2 - Examples of Food Foams: (a) Bread, (b) Meringue, (c) Chocolate Bar, (d) Junk Food Crisp, (e) Malteser, (f) Jaffa Cake ................................................................................................................................ 9 Figure 3 - Open Cell Foam Formation ........................................................................................................... 9 Figure 4 - Open Cell under Compression ...................................................................................................... 9 Figure 5 - Brittle Open Cell Foam under Compression ................................................................................. 9 Figure 6 - Elastomeric Foam Stress Strain Curve .......................................................................................... 9 Figure 7 - - Elastic-Plastic Foam Stress Strain Curve ..................................................................................... 9 Figure 8 - - Elastic-Brittle Foam Stress Strain Curve [3] ................................................................................ 9 Figure 9 - Equipment Used during Baking Process ..................................................................................... 12 Figure 10 - Thermal Couple in Commercial Convection Oven .................................................................... 12 Figure 11 - Cake Batter Preparation ........................................................................................................... 13 Figure 12 - Cake Batter undergoing convection cooking in non-stick muffin pan ...................................... 13 Figure 13 - Post Cooked Pound Cake Samples ............................................................................................ 14 Figure 14 - Sample before compression ..................................................................................................... 14 Figure 15 - Sample during compression...................................................................................................... 14 Figure 16 - Sample after compression ........................................................................................................ 14 Figure 17 - Instron Model 4201 Table Top Electromechanical Test System in Washburn Laboratories .... 14 Figure 18 - Mathcad Software for Maillard Reaction Analysis ................................................................... 15 Figure 19 - Stress - Strain Curve (0 Days, 175 °C, Sample 2) ....................................................................... 16 Figure 20 - Stress - Strain Curve (0 Days, 200 °C, Sample 1) ....................................................................... 17 Figure 21 - Sample Baked at 225°C and No Aging Before Compression ..................................................... 17 Figure 22 - Sample Baked at 225°C and No Aging During Compression ..................................................... 17 Figure 23 - S ample Baked at 225°C and No Aging After Compression ...................................................... 17 Figure 24 - Samples Baked at 200 °C and No Aging .................................................................................... 18 Figure 26- Illustration of Heights with Temperature; from left to right (225, 200, 175)°C ........................ 19 Figure 27 - Differences in Crust Thickness with variation of Temperature ; from left to right (225, 200, 175)°C .......................................................................................................................................................... 20 Figure 28 - Differences in Browning Effect ; from left to right (175, 200, 225)°C ....................................... 20 Figure 29 - (0 Days, 175 °C, Sample 1) ........................................................................................................ 25 Figure 30 -(0 Days, 200 °C, Sample 2) ......................................................................................................... 25 Figure 31 - (0 Days, 225 °C, Sample 1) ........................................................................................................ 25 Figure 32 - (0 Days, 225 °C, Sample 2) ........................................................................................................ 25 Figure 33 - (1 Day, 175 °C, Sample 1) .......................................................................................................... 26 Figure 34 - (1 Day, 175 °C, Sample 2) .......................................................................................................... 26 Figure 35 - (1 Day, 200 °C, Sample 1) .......................................................................................................... 26 Figure 36 -(1 Day, 200 °C, Sample 2) ........................................................................................................... 26 Figure 37 - (1 Day, 225 °C, Sample 1) .......................................................................................................... 26 Figure 38 - (1 Day, 225 °C, Sample 2) .......................................................................................................... 26 Figure 39 - (3 Days, 175 °C, Sample 1) ........................................................................................................ 27
6
Figure 40 - (3 Days, 175 °C, Sample 2) ........................................................................................................ 27 Figure 41 - (3 Days, 200 °C, Sample 1) ........................................................................................................ 27 Figure 42 -(3 Days, 200 °C, Sample 2) ......................................................................................................... 27 Figure 43 - (3 Days, 225 °C, Sample 1) ........................................................................................................ 27 Figure 44 - (3 Days, 225 °C, Sample 2) ........................................................................................................ 27 Figure 45 - (6 Days, 175 °C, Sample 1) ........................................................................................................ 28 Figure 46 - (6 Days, 175 °C, Sample 2) ........................................................................................................ 28 Figure 47 - (6 Days, 200 °C, Sample 1) ........................................................................................................ 28 Figure 48 -(6 Days, 200 °C, Sample 2) ......................................................................................................... 28 Figure 49 - (6 Days, 225 °C, Sample 1) ........................................................................................................ 28 Figure 50 - (6 Days, 225 °C, Sample 2) ........................................................................................................ 28 Figure 51 - Internal Temperature of Cake Batter during 175 C Baking ...................................................... 29
Table of Tables Table 1 - Cake Batter Ingredients by Weight .............................................................................................. 12 Table 2 - Measure of Strain on aged 225 °C Samples ................................................................................. 17 Table 3 - Measure of Strain on Various Samples ........................................................................................ 17 Table 4 - Measure of Elastic Modulus on Various Samples ........................................................................ 18 Table 5 - Average Heights Before and After Baking .................................................................................... 18 Table 6 - Intensity Values with varied Temperature ................................................................................... 19
7
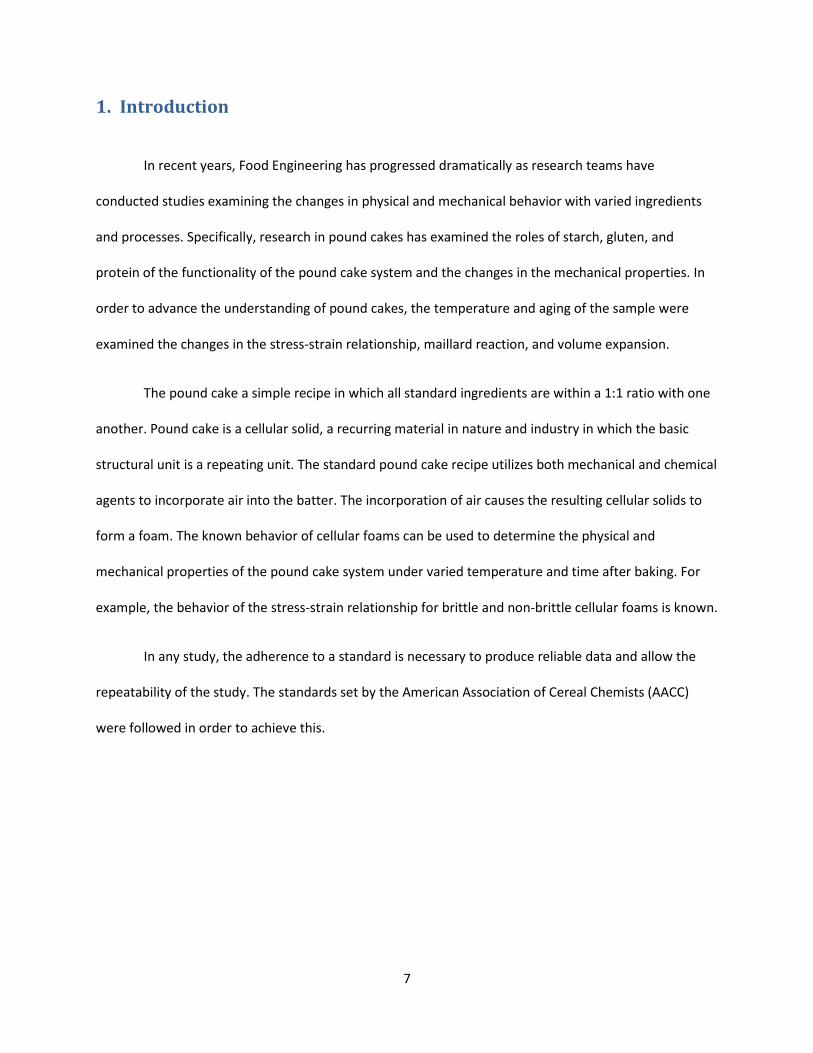
1. Introduction
In recent years, Food Engineering has progressed dramatically as research teams have
conducted studies examining the changes in physical and mechanical behavior with varied ingredients
and processes. Specifically, research in pound cakes has examined the roles of starch, gluten, and
protein of the functionality of the pound cake system and the changes in the mechanical properties. In
order to advance the understanding of pound cakes, the temperature and aging of the sample were
examined the changes in the stress-strain relationship, maillard reaction, and volume expansion.
The pound cake a simple recipe in which all standard ingredients are within a 1:1 ratio with one
another. Pound cake is a cellular solid, a recurring material in nature and industry in which the basic
structural unit is a repeating unit. The standard pound cake recipe utilizes both mechanical and chemical
agents to incorporate air into the batter. The incorporation of air causes the resulting cellular solids to
form a foam. The known behavior of cellular foams can be used to determine the physical and
mechanical properties of the pound cake system under varied temperature and time after baking. For
example, the behavior of the stress-strain relationship for brittle and non-brittle cellular foams is known.
In any study, the adherence to a standard is necessary to produce reliable data and allow the
repeatability of the study. The standards set by the American Association of Cereal Chemists (AACC)
were followed in order to achieve this.
8
2. Background Research
In recent years, the study of pound cakes has examined the effect of proportions or modified of
ingredients on the physical and mechanical properties. Previous research on pound cake systems have
focused on the variance the modification of different ingredients
2.1 Pound Cake
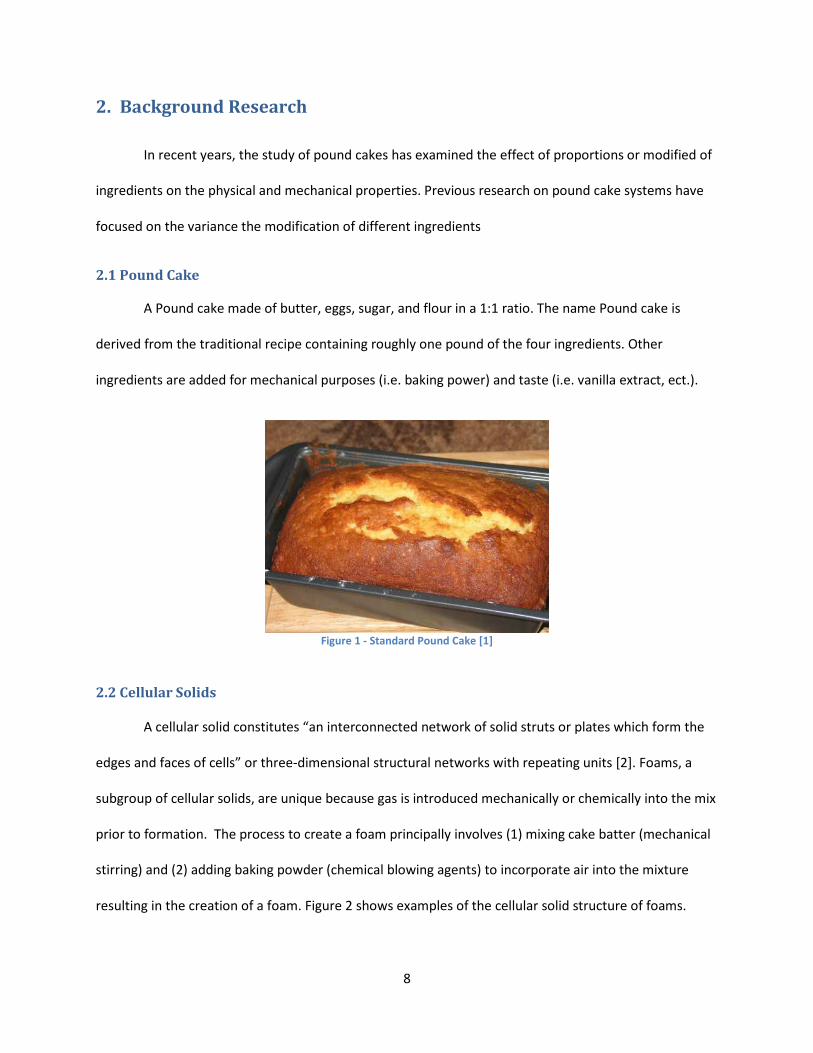
A Pound cake made of butter, eggs, sugar, and flour in a 1:1 ratio. The name Pound cake is
derived from the traditional recipe containing roughly one pound of the four ingredients. Other
ingredients are added for mechanical purposes (i.e. baking power) and taste (i.e. vanilla extract, ect.).
Figure 1 - Standard Pound Cake [1]
2.2 Cellular Solids
A cellular solid constitutes “an interconnected network of solid struts or plates which form the
edges and faces of cells” or three-dimensional structural networks with repeating units [2]. Foams, a
subgroup of cellular solids, are unique because gas is introduced mechanically or chemically into the mix
prior to formation. The process to create a foam principally involves (1) mixing cake batter (mechanical
stirring) and (2) adding baking powder (chemical blowing agents) to incorporate air into the mixture
resulting in the creation of a foam. Figure 2 shows examples of the cellular solid structure of foams.
9
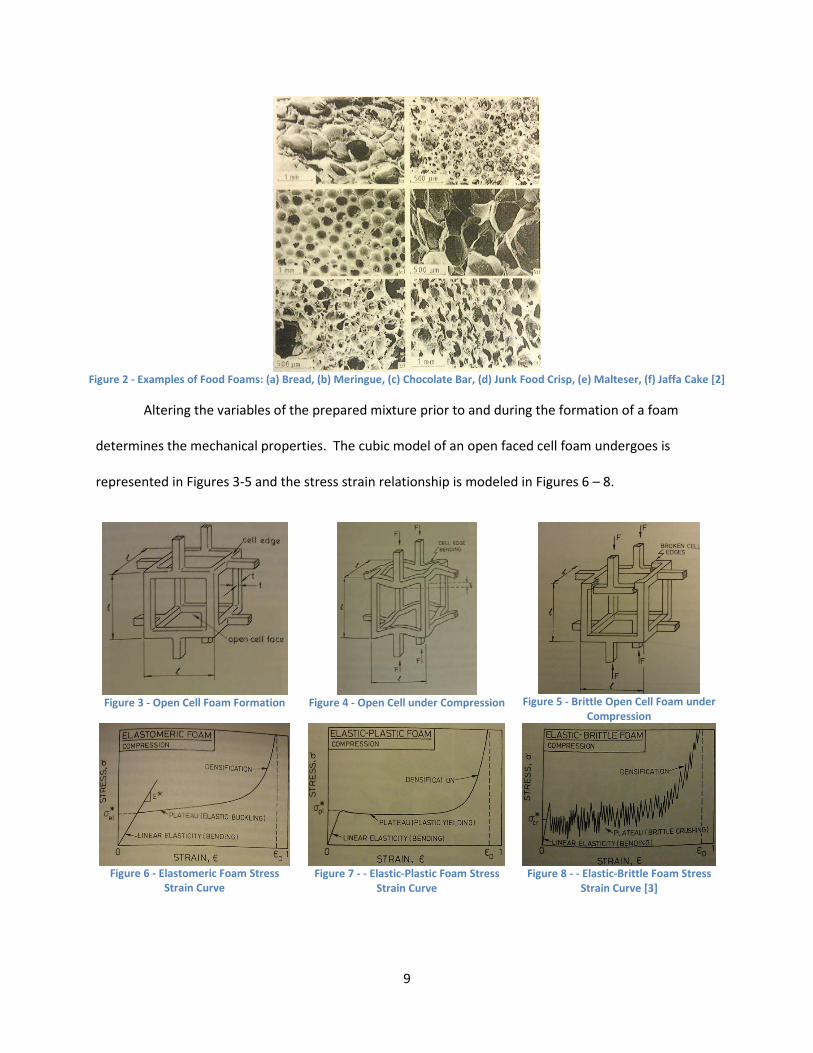
Figure 2 - Examples of Food Foams: (a) Bread, (b) Meringue, (c) Chocolate Bar, (d) Junk Food Crisp, (e) Malteser, (f) Jaffa Cake [2]
Altering the variables of the prepared mixture prior to and during the formation of a foam
determines the mechanical properties. The cubic model of an open faced cell foam undergoes is
represented in Figures 3-5 and the stress strain relationship is modeled in Figures 6 – 8.
Figure 3 - Open Cell Foam Formation
Figure 4 - Open Cell under Compression
Figure 5 - Brittle Open Cell Foam under
Compression
Figure 6 - Elastomeric Foam Stress
Strain Curve
Figure 7 - - Elastic-Plastic Foam Stress
Strain Curve
Figure 8 - - Elastic-Brittle Foam Stress
Strain Curve [3]
10
2.3 Maillard Reaction
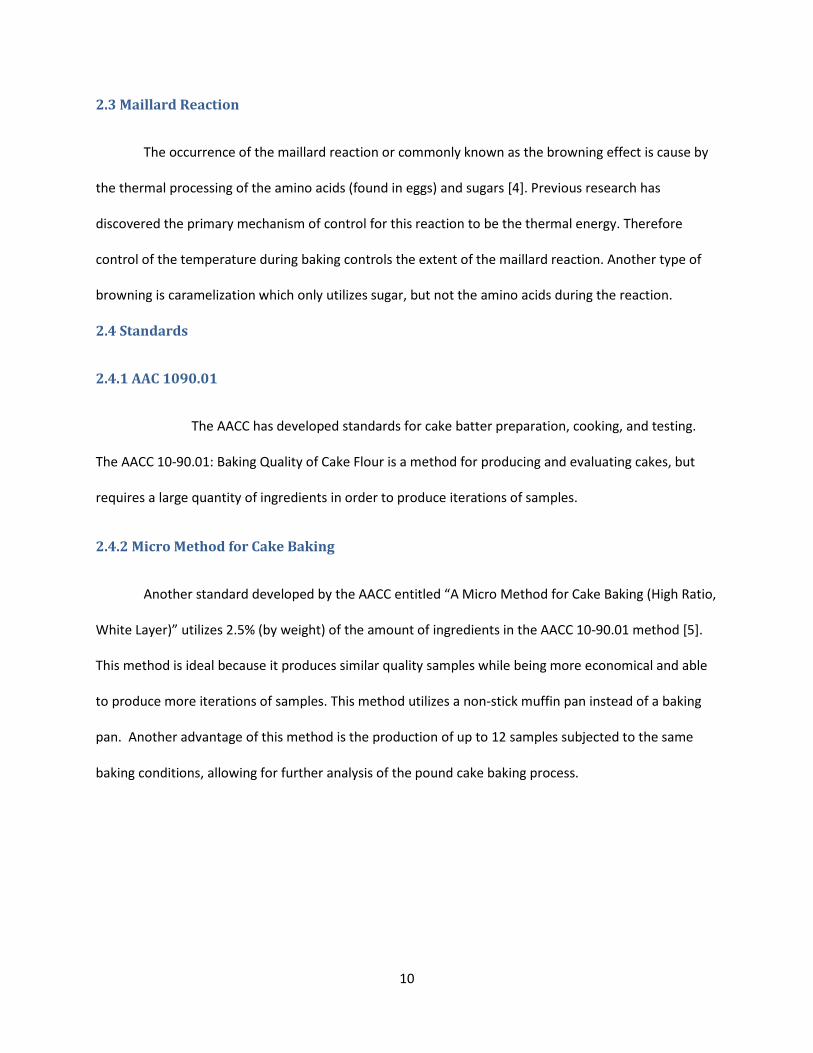
The occurrence of the maillard reaction or commonly known as the browning effect is cause by
the thermal processing of the amino acids (found in eggs) and sugars [4]. Previous research has
discovered the primary mechanism of control for this reaction to be the thermal energy. Therefore
control of the temperature during baking controls the extent of the maillard reaction. Another type of
browning is caramelization which only utilizes sugar, but not the amino acids during the reaction.
2.4 Standards
2.4.1 AAC 1090.01
The AACC has developed standards for cake batter preparation, cooking, and testing.
The AACC 10-90.01: Baking Quality of Cake Flour is a method for producing and evaluating cakes, but
requires a large quantity of ingredients in order to produce iterations of samples.
2.4.2 Micro Method for Cake Baking
Another standard developed by the AACC entitled “A Micro Method for Cake Baking (High Ratio,
White Layer)” utilizes 2.5% (by weight) of the amount of ingredients in the AACC 10-90.01 method [5].
This method is ideal because it produces similar quality samples while being more economical and able
to produce more iterations of samples. This method utilizes a non-stick muffin pan instead of a baking
pan. Another advantage of this method is the production of up to 12 samples subjected to the same
baking conditions, allowing for further analysis of the pound cake baking process.
11
3. Objectives 1. Understand cake structure
2. Understand the stress-strain relationship of pound cake
3. Study the effect of baking temperature and time on the stress-strain relationship and maillard reaction of pound cake.
4. Study the effect of baking temperature on the maillard reaction and volume expansion of pound cake.
12
4. Materials and Methods
A modified procedure of the AACC micro method for cake baking was adhered to as well as the
practices performed and documented by previous research groups.
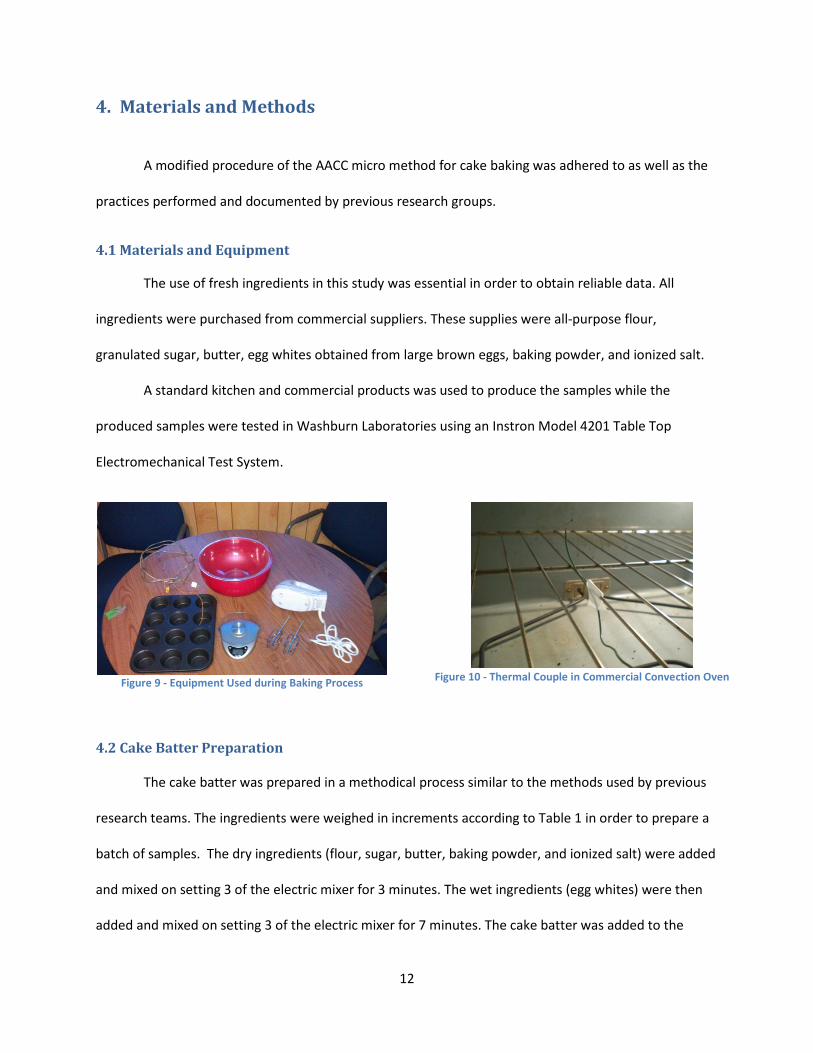
4.1 Materials and Equipment
The use of fresh ingredients in this study was essential in order to obtain reliable data. All
ingredients were purchased from commercial suppliers. These supplies were all-purpose flour,
granulated sugar, butter, egg whites obtained from large brown eggs, baking powder, and ionized salt.
A standard kitchen and commercial products was used to produce the samples while the
produced samples were tested in Washburn Laboratories using an Instron Model 4201 Table Top
Electromechanical Test System.
Figure 9 - Equipment Used during Baking Process
Figure 10 - Thermal Couple in Commercial Convection Oven
4.2 Cake Batter Preparation
The cake batter was prepared in a methodical process similar to the methods used by previous
research teams. The ingredients were weighed in increments according to Table 1 in order to prepare a
batch of samples. The dry ingredients (flour, sugar, butter, baking powder, and ionized salt) were added
and mixed on setting 3 of the electric mixer for 3 minutes. The wet ingredients (egg whites) were then
added and mixed on setting 3 of the electric mixer for 7 minutes. The cake batter was added to the
13
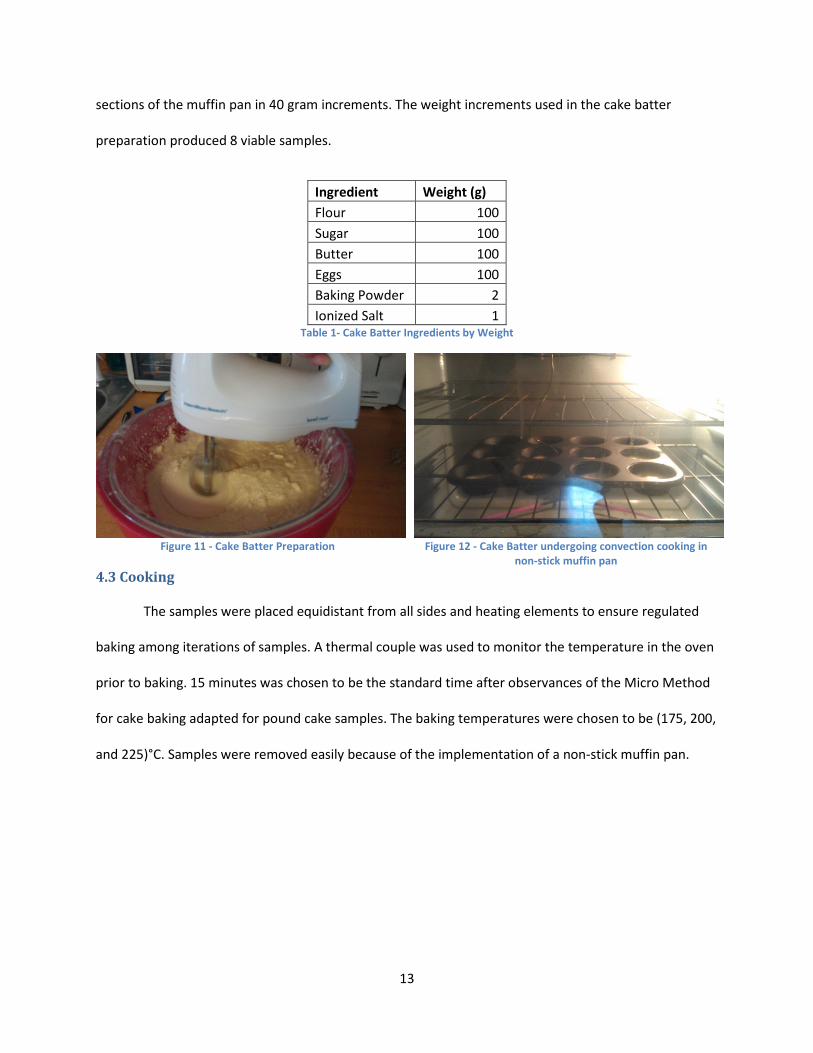
sections of the muffin pan in 40 gram increments. The weight increments used in the cake batter
preparation produced 8 viable samples.
Ingredient Weight (g) Flour 100 Sugar 100 Butter 100 Eggs 100 Baking Powder 2 Ionized Salt 1
Table 1- Cake Batter Ingredients by Weight
Figure 11 - Cake Batter Preparation
Figure 12 - Cake Batter undergoing convection cooking in
non-stick muffin pan 4.3 Cooking
The samples were placed equidistant from all sides and heating elements to ensure regulated
baking among iterations of samples. A thermal couple was used to monitor the temperature in the oven
prior to baking. 15 minutes was chosen to be the standard time after observances of the Micro Method
for cake baking adapted for pound cake samples. The baking temperatures were chosen to be (175, 200,
and 225)°C. Samples were removed easily because of the implementation of a non-stick muffin pan.
14
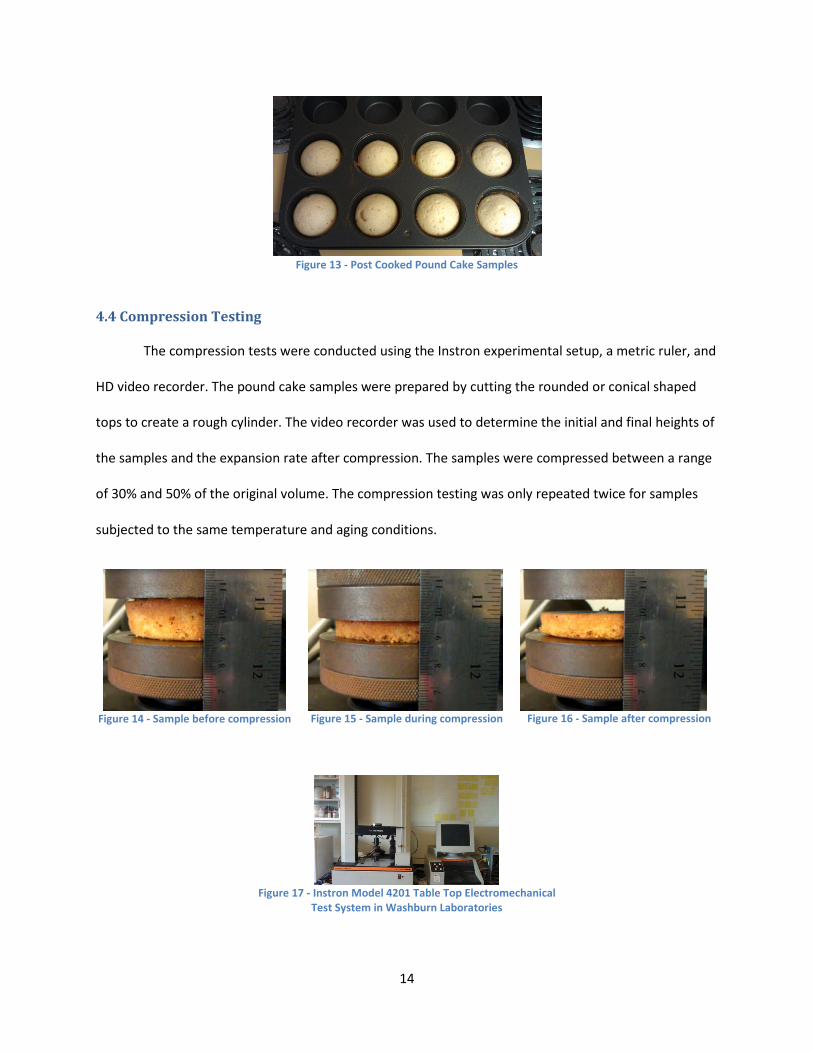
Figure 13 - Post Cooked Pound Cake Samples
4.4 Compression Testing
The compression tests were conducted using the Instron experimental setup, a metric ruler, and
HD video recorder. The pound cake samples were prepared by cutting the rounded or conical shaped
tops to create a rough cylinder. The video recorder was used to determine the initial and final heights of
the samples and the expansion rate after compression. The samples were compressed between a range
of 30% and 50% of the original volume. The compression testing was only repeated twice for samples
subjected to the same temperature and aging conditions.
Figure 14 - Sample before compression
Figure 15 - Sample during compression
Figure 16 - Sample after compression
Figure 17 - Instron Model 4201 Table Top Electromechanical
Test System in Washburn Laboratories
15
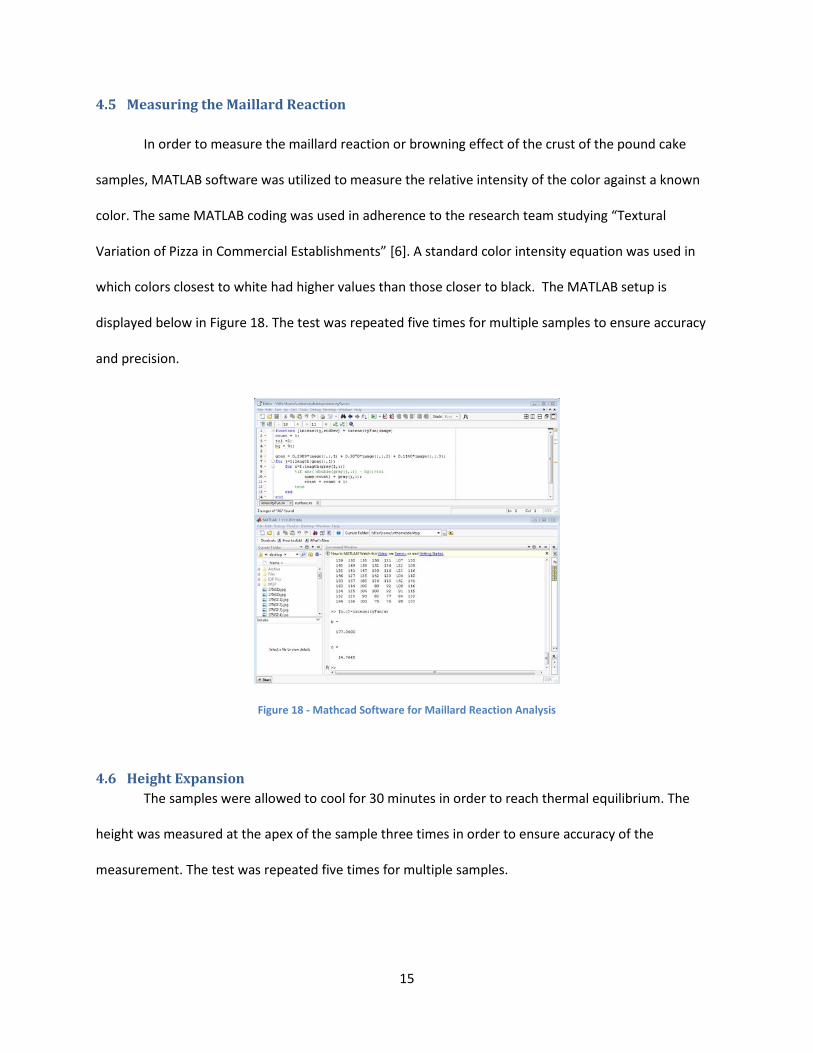
4.5 Measuring the Maillard Reaction
In order to measure the maillard reaction or browning effect of the crust of the pound cake
samples, MATLAB software was utilized to measure the relative intensity of the color against a known
color. The same MATLAB coding was used in adherence to the research team studying “Textural
Variation of Pizza in Commercial Establishments” [6]. A standard color intensity equation was used in
which colors closest to white had higher values than those closer to black. The MATLAB setup is
displayed below in Figure 18. The test was repeated five times for multiple samples to ensure accuracy
and precision.
Figure 18 - Mathcad Software for Maillard Reaction Analysis
4.6 Height Expansion The samples were allowed to cool for 30 minutes in order to reach thermal equilibrium. The
height was measured at the apex of the sample three times in order to ensure accuracy of the
measurement. The test was repeated five times for multiple samples.
16
5. Results and Discussion
5.1 Compression Tests
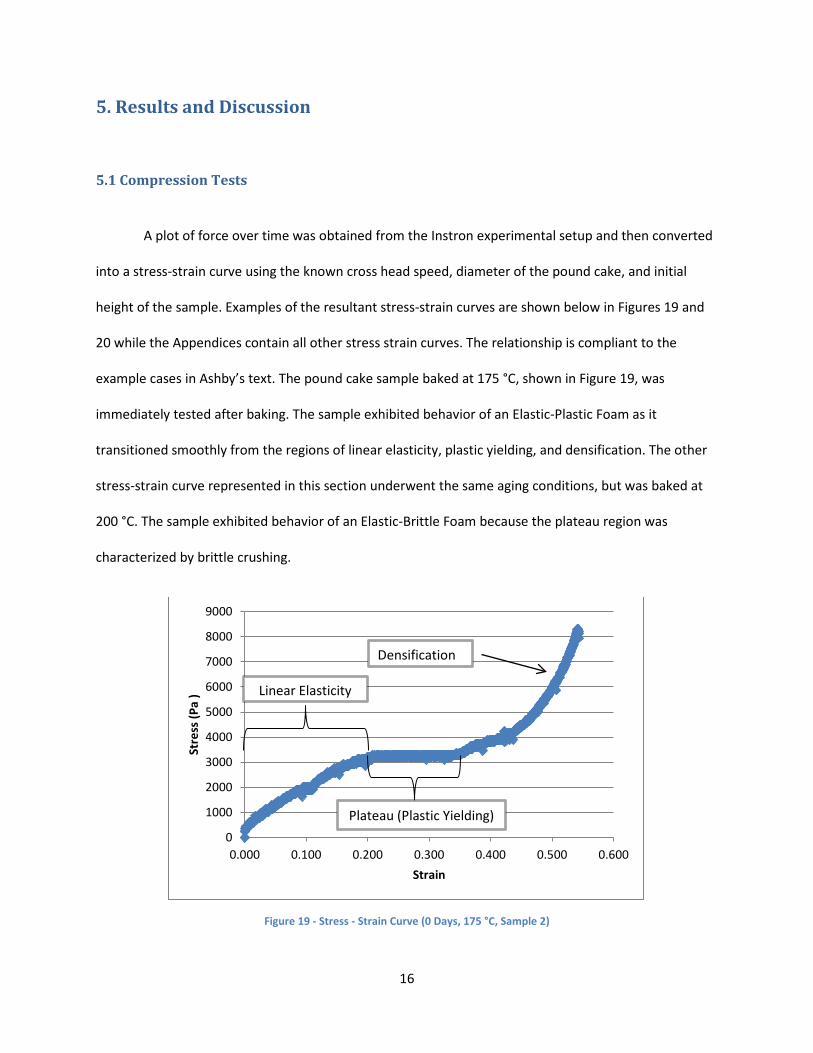
A plot of force over time was obtained from the Instron experimental setup and then converted
into a stress-strain curve using the known cross head speed, diameter of the pound cake, and initial
height of the sample. Examples of the resultant stress-strain curves are shown below in Figures 19 and
20 while the Appendices contain all other stress strain curves. The relationship is compliant to the
example cases in Ashby’s text. The pound cake sample baked at 175 °C, shown in Figure 19, was
immediately tested after baking. The sample exhibited behavior of an Elastic-Plastic Foam as it
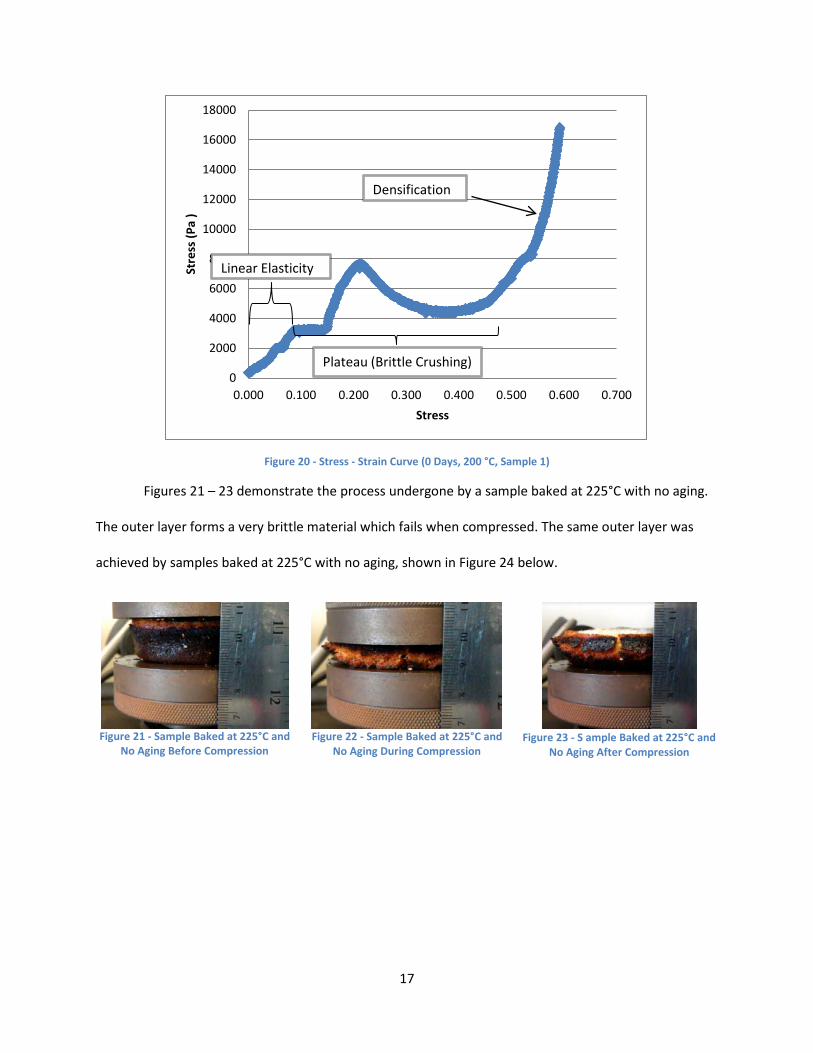
transitioned smoothly from the regions of linear elasticity, plastic yielding, and densification. The other
stress-strain curve represented in this section underwent the same aging conditions, but was baked at
200 °C. The sample exhibited behavior of an Elastic-Brittle Foam because the plateau region was
characterized by brittle crushing.
Figure 19 - Stress - Strain Curve (0 Days, 175 °C, Sample 2)
0
1000
2000
3000
4000
5000
6000
7000
8000
9000
0.000 0.100 0.200 0.300 0.400 0.500 0.600
Stre
ss (P
a )
Strain
Linear Elasticity
Densification
Plateau (Plastic Yielding)
17
Figure 20 - Stress - Strain Curve (0 Days, 200 °C, Sample 1)
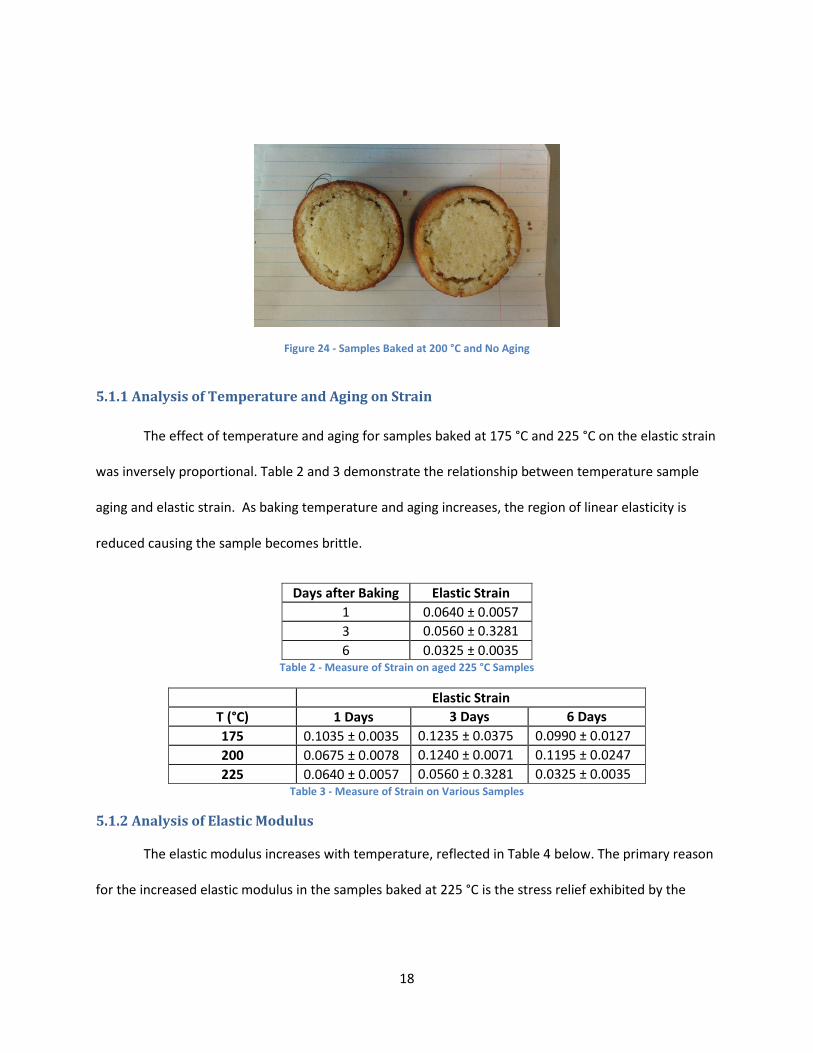
Figures 21 – 23 demonstrate the process undergone by a sample baked at 225°C with no aging.
The outer layer forms a very brittle material which fails when compressed. The same outer layer was
achieved by samples baked at 225°C with no aging, shown in Figure 24 below.
Figure 21 - Sample Baked at 225°C and
No Aging Before Compression
Figure 22 - Sample Baked at 225°C and
No Aging During Compression
Figure 23 - S ample Baked at 225°C and
No Aging After Compression
0
2000
4000
6000
8000
10000
12000
14000
16000
18000
0.000 0.100 0.200 0.300 0.400 0.500 0.600 0.700
Stre
ss (P
a )
Stress
Linear Elasticity
Plateau (Brittle Crushing)
Densification
18
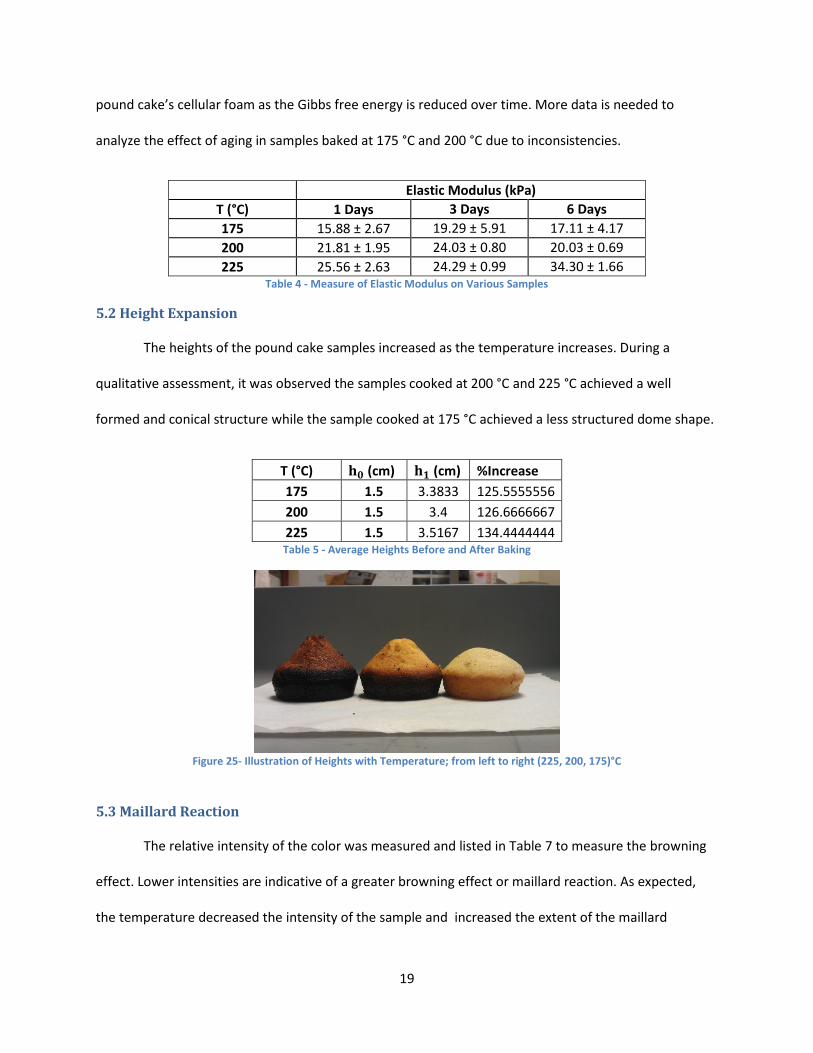
Figure 24 - Samples Baked at 200 °C and No Aging
5.1.1 Analysis of Temperature and Aging on Strain The effect of temperature and aging for samples baked at 175 °C and 225 °C on the elastic strain
was inversely proportional. Table 2 and 3 demonstrate the relationship between temperature sample
aging and elastic strain. As baking temperature and aging increases, the region of linear elasticity is
reduced causing the sample becomes brittle.
Days after Baking Elastic Strain 1 0.0640 ± 0.0057 3 0.0560 ± 0.3281 6 0.0325 ± 0.0035
Table 2 - Measure of Strain on aged 225 °C Samples
Elastic Strain T (°C) 1 Days 3 Days 6 Days 175 0.1035 ± 0.0035 0.1235 ± 0.0375 0.0990 ± 0.0127 200 0.0675 ± 0.0078 0.1240 ± 0.0071 0.1195 ± 0.0247 225 0.0640 ± 0.0057 0.0560 ± 0.3281 0.0325 ± 0.0035
Table 3 - Measure of Strain on Various Samples
5.1.2 Analysis of Elastic Modulus
The elastic modulus increases with temperature, reflected in Table 4 below. The primary reason
for the increased elastic modulus in the samples baked at 225 °C is the stress relief exhibited by the
19
pound cake’s cellular foam as the Gibbs free energy is reduced over time. More data is needed to
analyze the effect of aging in samples baked at 175 °C and 200 °C due to inconsistencies.
Elastic Modulus (kPa) T (°C) 1 Days 3 Days 6 Days 175 15.88 ± 2.67 19.29 ± 5.91 17.11 ± 4.17 200 21.81 ± 1.95 24.03 ± 0.80 20.03 ± 0.69 225 25.56 ± 2.63 24.29 ± 0.99 34.30 ± 1.66
Table 4 - Measure of Elastic Modulus on Various Samples
5.2 Height Expansion
The heights of the pound cake samples increased as the temperature increases. During a
qualitative assessment, it was observed the samples cooked at 200 °C and 225 °C achieved a well
formed and conical structure while the sample cooked at 175 °C achieved a less structured dome shape.
T (°C) 𝐡𝟎 (cm) 𝐡𝟏 (cm) %Increase 175 1.5 3.3833 125.5555556 200 1.5 3.4 126.6666667 225 1.5 3.5167 134.4444444 Table 5 - Average Heights Before and After Baking
Figure 25- Illustration of Heights with Temperature; from left to right (225, 200, 175)°C
5.3 Maillard Reaction
The relative intensity of the color was measured and listed in Table 7 to measure the browning
effect. Lower intensities are indicative of a greater browning effect or maillard reaction. As expected,
the temperature decreased the intensity of the sample and increased the extent of the maillard

20
reaction. This was measured using the intensity coding in MATLAB and the relative thickness of the
crust. The mechanical behavior of the crust was observed during the compression testing which is
further investigated in this section.
Temp (°C) Intensity Crust Thickness (mm) 175 180.54 ± 10.39 1.0 200 175.42 ± 4.90 3.0 225 156.65 ± 25.83 5.0
Table 6 - Intensity Values with varied Temperature
Figure 26 - Differences in Crust Thickness with variation of
Temperature ; from left to right (225, 200, 175)°C
Figure 27 - Differences in Browning Effect ; from left to right
(175, 200, 225)°C
5.3.1 Relationship between Brittle Material and Maillard Reaction
A relationship between the maillard reaction and mechanical behavior of the brittle crust is
examined after cross referencing observations made during the compression tests. During the
compression tests, the brittle material created during baking temperatures of 200 °C and 225 °C was
caused by the maillard reaction. This material was different from the foam material inside the core.
However, the samples did not exhibit brittle behavior after aging.
5.3.2 Relationship between Height Expansion and Maillard Reaction
A relationship between the baking temperatures is examined after cross referencing
observations made during the height expansion. The samples subjected to higher baking temperatures

21
had lower intensities, thicker crusts, greater height expansions, and better formed shapes. Therefore
there is a relationship between the height or volume expansion and the maillard reaction.
22
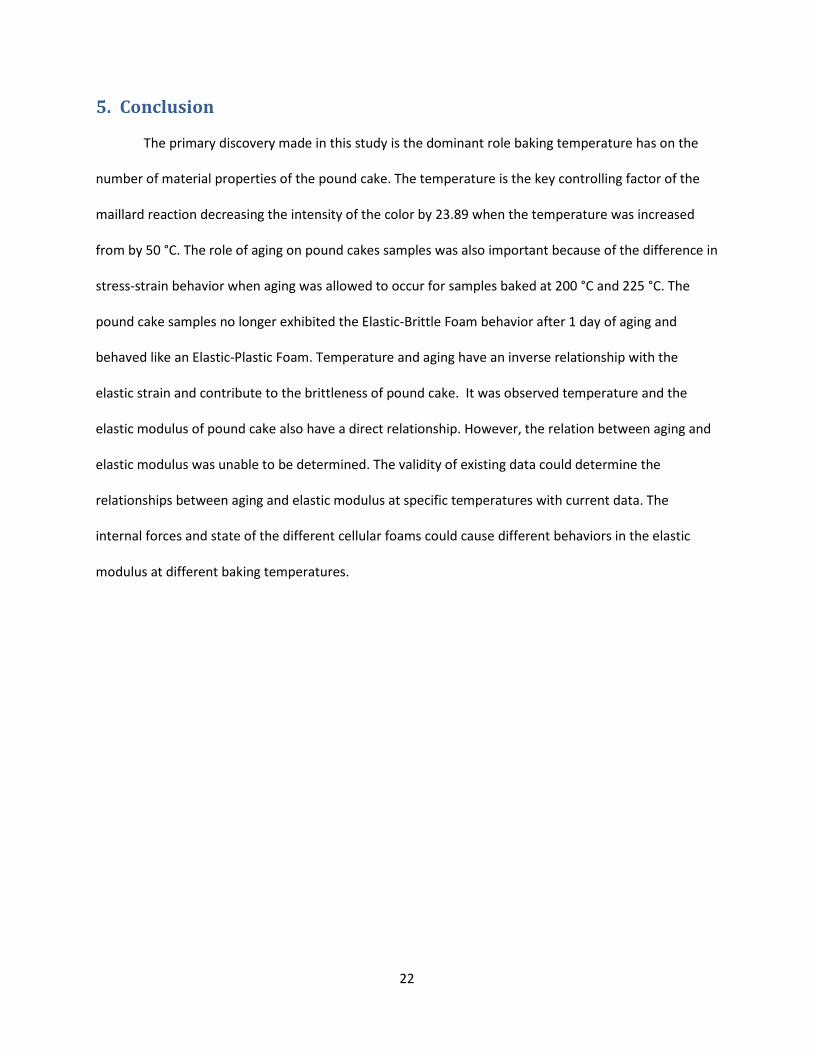
5. Conclusion
The primary discovery made in this study is the dominant role baking temperature has on the
number of material properties of the pound cake. The temperature is the key controlling factor of the
maillard reaction decreasing the intensity of the color by 23.89 when the temperature was increased
from by 50 °C. The role of aging on pound cakes samples was also important because of the difference in
stress-strain behavior when aging was allowed to occur for samples baked at 200 °C and 225 °C. The
pound cake samples no longer exhibited the Elastic-Brittle Foam behavior after 1 day of aging and
behaved like an Elastic-Plastic Foam. Temperature and aging have an inverse relationship with the
elastic strain and contribute to the brittleness of pound cake. It was observed temperature and the
elastic modulus of pound cake also have a direct relationship. However, the relation between aging and
elastic modulus was unable to be determined. The validity of existing data could determine the
relationships between aging and elastic modulus at specific temperatures with current data. The
internal forces and state of the different cellular foams could cause different behaviors in the elastic
modulus at different baking temperatures.
23
References [1] "Pound Cake." Word Press. Available from http://giniann.files.wordpress.com/2006/02/pound%20cake.jpg. Internet; accessed 26 April 2011.
[2] Gibson, Lorna J. and Ashby, Michael E. Cellular solids: Structure and Properties. Cambridge: University of Cambridge, 1997.
[3] (Gibson, 1997, 24-175)
[4] Jaeger, H et al. “The Maillard reaction and its control during food processing. The potential of emerging technologies.” Pathologie Biologie. 58, no 3 (2010).
[5] Raeker, Maide Ozbay and Johnson, Lawrence A. “A Micro Method for Cake Baking (High Ratio, White Layer).” Journal of Cereal Chemistry. 72, no.2: 167-172
[6] Bingham, Andrew; Boucher, Christopher; and Boyce, James. “Textural Variations of Pizza in Commercial Establishments” IQP Report. Worcester Polytechnic Institute, 2011.
Additional References
Wilderjans, Edith et al. “The role of gluten in a pound cake system: A model approach based on gluten-starch blends.” Journal of Food Chemistry. 110, no 4 (2008): 909-915
Wilderjans, Edith et al. “A model approach to starch and protein functionality in a pound cake system.” Journal of Food Chemistry. 120, no 1 (2010): 44-51
24
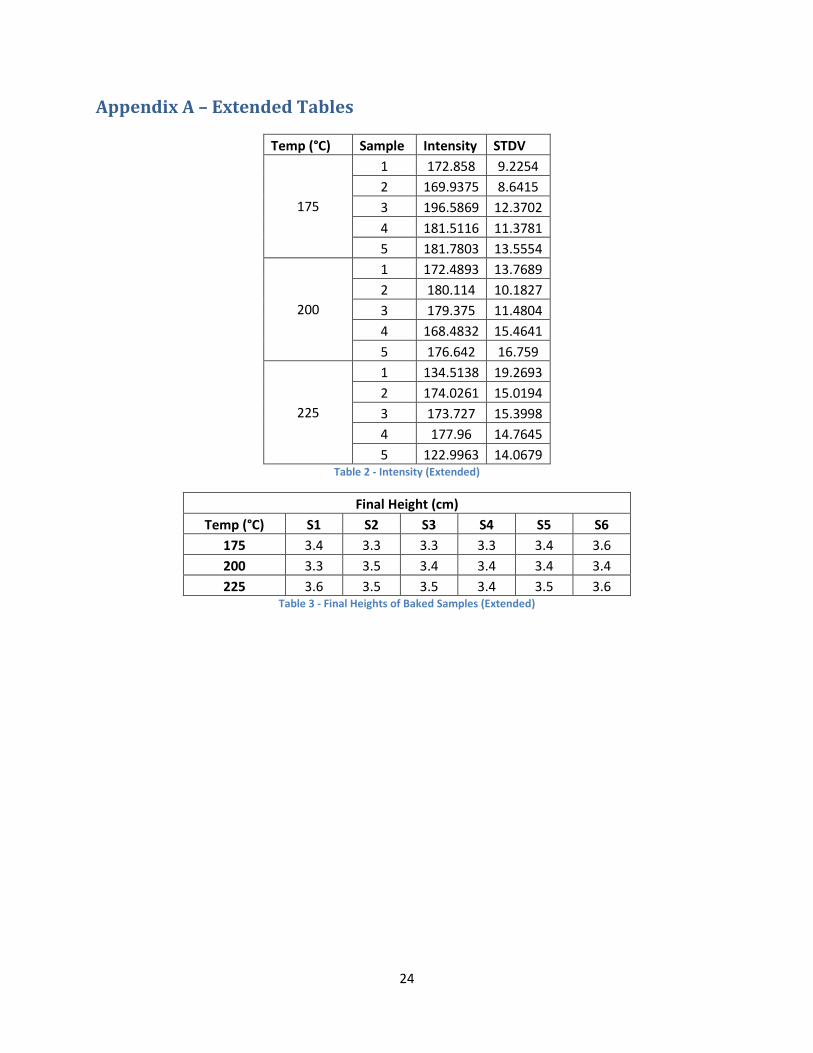
Appendix A – Extended Tables
Temp (°C) Sample Intensity STDV
175
1 172.858 9.2254 2 169.9375 8.6415 3 196.5869 12.3702 4 181.5116 11.3781 5 181.7803 13.5554
200
1 172.4893 13.7689 2 180.114 10.1827 3 179.375 11.4804 4 168.4832 15.4641 5 176.642 16.759
225
1 134.5138 19.2693 2 174.0261 15.0194 3 173.727 15.3998 4 177.96 14.7645 5 122.9963 14.0679
Table 2 - Intensity (Extended)
Final Height (cm) Temp (°C) S1 S2 S3 S4 S5 S6
175 3.4 3.3 3.3 3.3 3.4 3.6 200 3.3 3.5 3.4 3.4 3.4 3.4 225 3.6 3.5 3.5 3.4 3.5 3.6
Table 3 - Final Heights of Baked Samples (Extended)
25
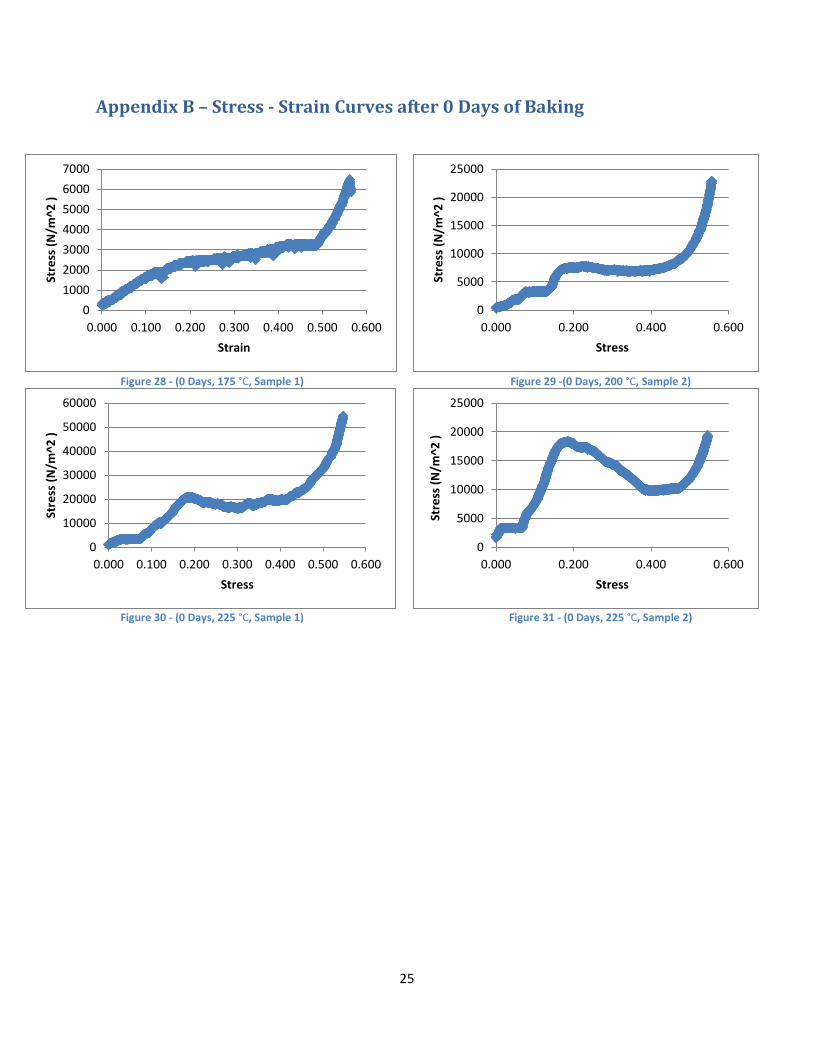
Appendix B – Stress - Strain Curves after 0 Days of Baking
Figure 28 - (0 Days, 175 °C, Sample 1)
Figure 29 -(0 Days, 200 °C, Sample 2)
Figure 30 - (0 Days, 225 °C, Sample 1)
Figure 31 - (0 Days, 225 °C, Sample 2)
01000200030004000500060007000
0.000 0.100 0.200 0.300 0.400 0.500 0.600
Stre
ss (N
/m^2
)
Strain
0
5000
10000
15000
20000
25000
0.000 0.200 0.400 0.600
Stre
ss (N
/m^2
)
Stress
0
10000
20000
30000
40000
50000
60000
0.000 0.100 0.200 0.300 0.400 0.500 0.600
Stre
ss (N
/m^2
)
Stress
0
5000
10000
15000
20000
25000
0.000 0.200 0.400 0.600
Stre
ss (N
/m^2
)
Stress
26
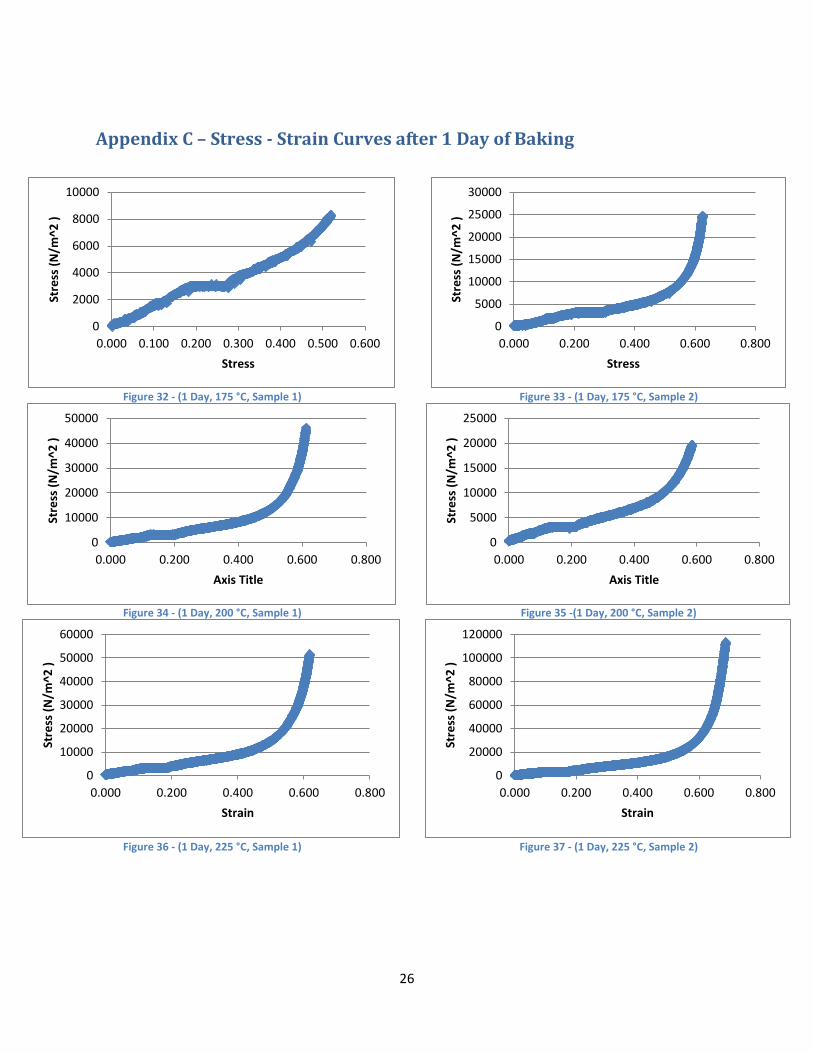
Appendix C – Stress - Strain Curves after 1 Day of Baking
Figure 32 - (1 Day, 175 °C, Sample 1)
Figure 33 - (1 Day, 175 °C, Sample 2)
Figure 34 - (1 Day, 200 °C, Sample 1)
Figure 35 -(1 Day, 200 °C, Sample 2)
Figure 36 - (1 Day, 225 °C, Sample 1)
Figure 37 - (1 Day, 225 °C, Sample 2)
0
2000
4000
6000
8000
10000
0.000 0.100 0.200 0.300 0.400 0.500 0.600
Stre
ss (N
/m^2
)
Stress
0
5000
10000
15000
20000
25000
30000
0.000 0.200 0.400 0.600 0.800
Stre
ss (N
/m^2
)
Stress
0
10000
20000
30000
40000
50000
0.000 0.200 0.400 0.600 0.800
Stre
ss (N
/m^2
)
Axis Title
0
5000
10000
15000
20000
25000
0.000 0.200 0.400 0.600 0.800
Stre
ss (N
/m^2
)
Axis Title
0
10000
20000
30000
40000
50000
60000
0.000 0.200 0.400 0.600 0.800
Stre
ss (N
/m^2
)
Strain
0
20000
40000
60000
80000
100000
120000
0.000 0.200 0.400 0.600 0.800
Stre
ss (N
/m^2
)
Strain
27
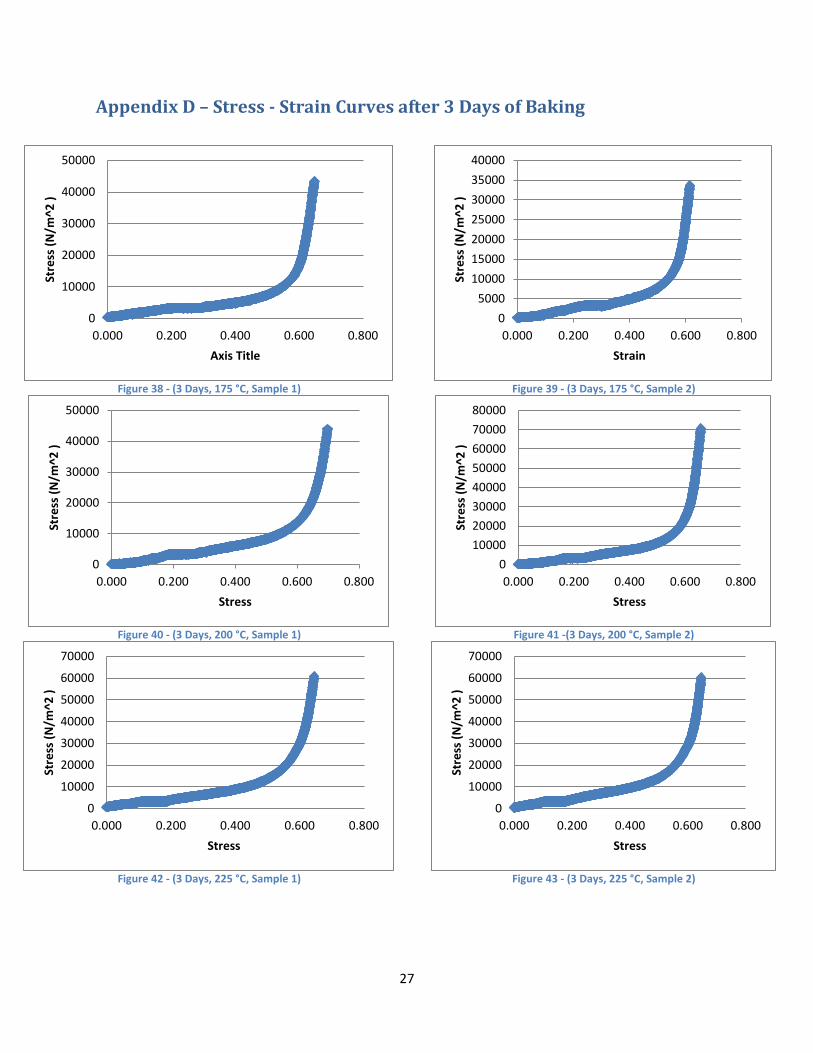
Appendix D – Stress - Strain Curves after 3 Days of Baking
Figure 38 - (3 Days, 175 °C, Sample 1)
Figure 39 - (3 Days, 175 °C, Sample 2)
Figure 40 - (3 Days, 200 °C, Sample 1)
Figure 41 -(3 Days, 200 °C, Sample 2)
Figure 42 - (3 Days, 225 °C, Sample 1)
Figure 43 - (3 Days, 225 °C, Sample 2)
0
10000
20000
30000
40000
50000
0.000 0.200 0.400 0.600 0.800
Stre
ss (N
/m^2
)
Axis Title
05000
10000150002000025000300003500040000
0.000 0.200 0.400 0.600 0.800
Stre
ss (N
/m^2
)
Strain
0
10000
20000
30000
40000
50000
0.000 0.200 0.400 0.600 0.800
Stre
ss (N
/m^2
)
Stress
01000020000300004000050000600007000080000
0.000 0.200 0.400 0.600 0.800
Stre
ss (N
/m^2
)
Stress
0
10000
20000
30000
40000
50000
60000
70000
0.000 0.200 0.400 0.600 0.800
Stre
ss (N
/m^2
)
Stress
0
10000
20000
30000
40000
50000
60000
70000
0.000 0.200 0.400 0.600 0.800
Stre
ss (N
/m^2
)
Stress

28
Appendix E – Stress - Strain Curves after 6 Days of Baking
Figure 44 - (6 Days, 175 °C, Sample 1)
Figure 45 - (6 Days, 175 °C, Sample 2)
Figure 46 - (6 Days, 200 °C, Sample 1)
Figure 47 -(6 Days, 200 °C, Sample 2)
Figure 48 - (6 Days, 225 °C, Sample 1)
Figure 49 - (6 Days, 225 °C, Sample 2)
02000400060008000
100001200014000160001800020000
0.000 0.200 0.400 0.600 0.800
Stre
ss (N
/m^2
)
Stress
0
5000
10000
15000
20000
25000
30000
0.000 0.200 0.400 0.600 0.800
Stre
ss (N
/m^2
)
Stress
0
5000
10000
15000
20000
0.000 0.200 0.400 0.600 0.800
Stre
ss (N
/m^2
)
Stress
0
5000
10000
15000
20000
25000
0.000 0.200 0.400 0.600 0.800
Stre
ss (N
/m^2
)
Stress
0
10000
20000
30000
40000
50000
0.000 0.200 0.400 0.600 0.800
Stre
ss (N
/m^2
)
Stress
0
5000
10000
15000
20000
25000
30000
0.000 0.200 0.400 0.600 0.800
Axis
Titl
e
Axis Title
29
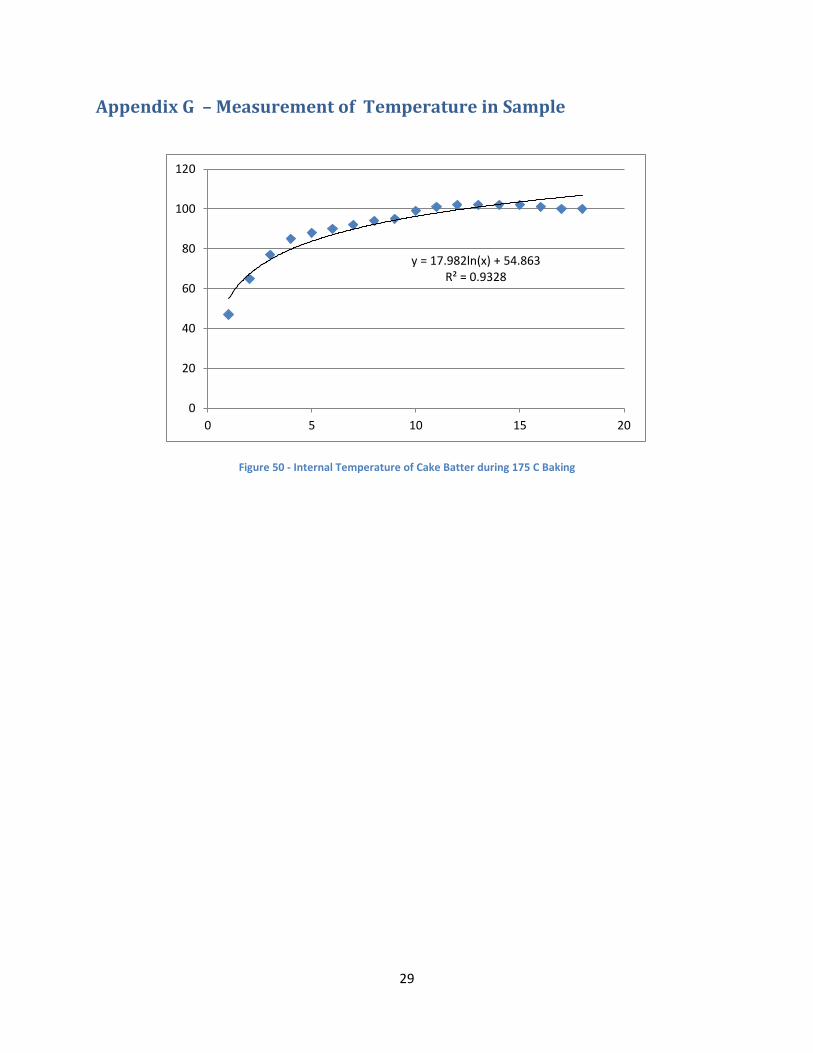
Appendix G – Measurement of Temperature in Sample
Figure 50 - Internal Temperature of Cake Batter during 175 C Baking
y = 17.982ln(x) + 54.863 R² = 0.9328
0
20
40
60
80
100
120
0 5 10 15 20