CORRELATION OF ANALYTICAL AND EXPERIMENTAL ELASTIC MODE...
18
CORRELATION OF ANALYTICAL AND EXPERIMENTAL ELASTIC MODE SHAPES FOR A SMALL ASPECT RATIO WING USING MODAL DESCRAMBLING James Senter 1 , Evan Martin 1 , Michael Rakieski 1 and Emil Suciu 1 1 Loads & Dynamics Analyst , L-3 Communications Platform Integration Division, 7500 Maehr Drive, Waco, Texas, 76715 USA SUMMARY The Modal Assurance Criterion is used to compare scrambled and descrambled experimental and calculated mode shapes for a rectangular flat steel plate of AR=2. KEYWORDS GVT, DLM, Modal Descrambling, Elastic Streamwise Camber Deformation, MAC
Transcript of CORRELATION OF ANALYTICAL AND EXPERIMENTAL ELASTIC MODE...
CORRELATION OF ANALYTICAL AND
EXPERIMENTAL ELASTIC MODE SHAPES FOR A
SMALL ASPECT RATIO WING USING MODAL
DESCRAMBLING
James Senter1, Evan Martin
1, Michael Rakieski
1 and Emil Suciu
1
1Loads & Dynamics Analyst , L-3 Communications Platform Integration
Division, 7500 Maehr Drive, Waco, Texas, 76715 USA
SUMMARY
The Modal Assurance Criterion is used to compare scrambled and descrambled
experimental and calculated mode shapes for a rectangular flat steel plate of
AR=2.
KEYWORDS
GVT, DLM, Modal Descrambling, Elastic Streamwise Camber Deformation,
MAC
CORRELATION OF ANALYTICAL AND EXPERIMENTAL ELASTIC
MODE SHAPES FOR A SMALL ASPECT RATIO WING USING
MODAL DESCRAMBLING
1: INTRODUCTION
The subject matter discussed in this paper is related to aircraft flutter analyses,
in particular the process of improving the analytical structural dynamic model
by comparing its results to the GVT results. The GVT results are available as
frequencies and mode shapes defined at specified points.
The user attempts to name or identify modes of vibration in order to understand
the physical problem. Some flutter analysts refer to the mode naming process
as an art. It can be argued that stick model modes can be consistently identified
by making use of the beam directional stiffness properties and the strain energy
summation method (Reference [1]). Full finite element structural dynamic
models do not easily lend themselves to such easily quantifiable processes as
shown in Reference [1] for stick models, therefore naming modes still remains
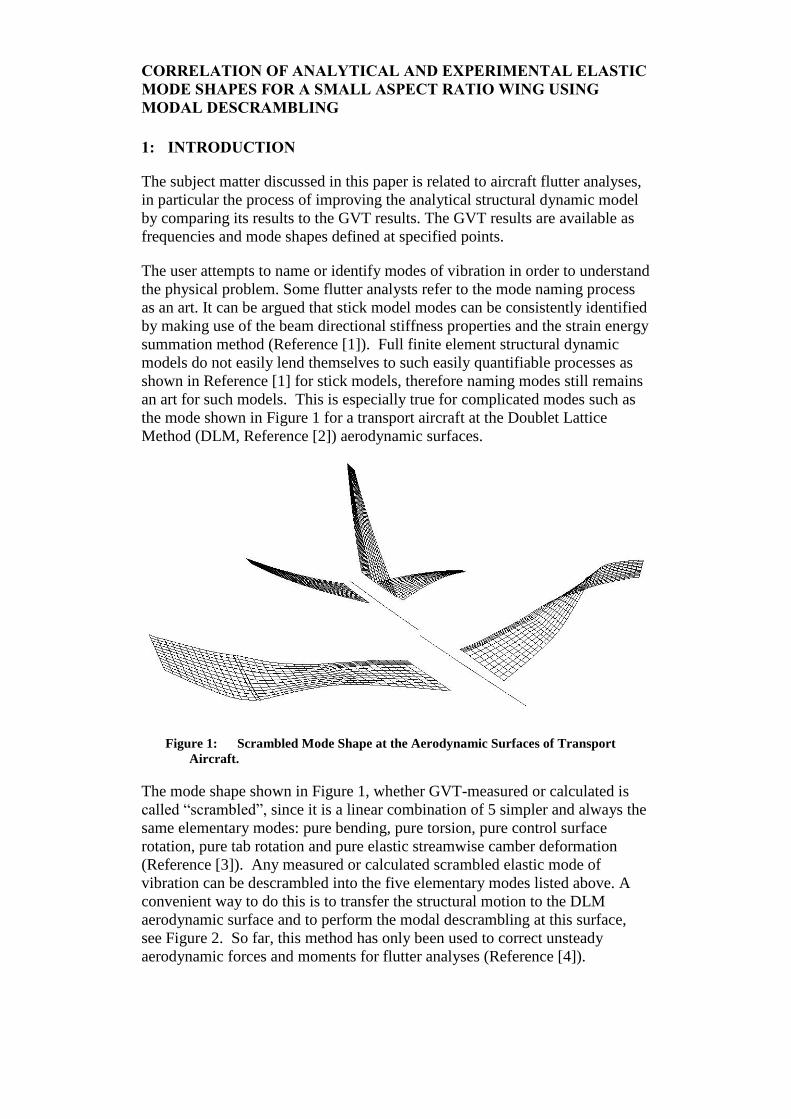
an art for such models. This is especially true for complicated modes such as
the mode shown in Figure 1 for a transport aircraft at the Doublet Lattice
Method (DLM, Reference [2]) aerodynamic surfaces.
Figure 1: Scrambled Mode Shape at the Aerodynamic Surfaces of Transport
Aircraft.
The mode shape shown in Figure 1, whether GVT-measured or calculated is
called “scrambled”, since it is a linear combination of 5 simpler and always the
same elementary modes: pure bending, pure torsion, pure control surface
rotation, pure tab rotation and pure elastic streamwise camber deformation
(Reference [3]). Any measured or calculated scrambled elastic mode of
vibration can be descrambled into the five elementary modes listed above. A
convenient way to do this is to transfer the structural motion to the DLM
aerodynamic surface and to perform the modal descrambling at this surface,
see Figure 2. So far, this method has only been used to correct unsteady
aerodynamic forces and moments for flutter analyses (Reference [4]).
CORRELATION OF ANALYTICAL AND EXPERIMENTAL ELASTIC
MODE SHAPES FOR A SMALL ASPECT RATIO WING USING
MODAL DESCRAMBLING
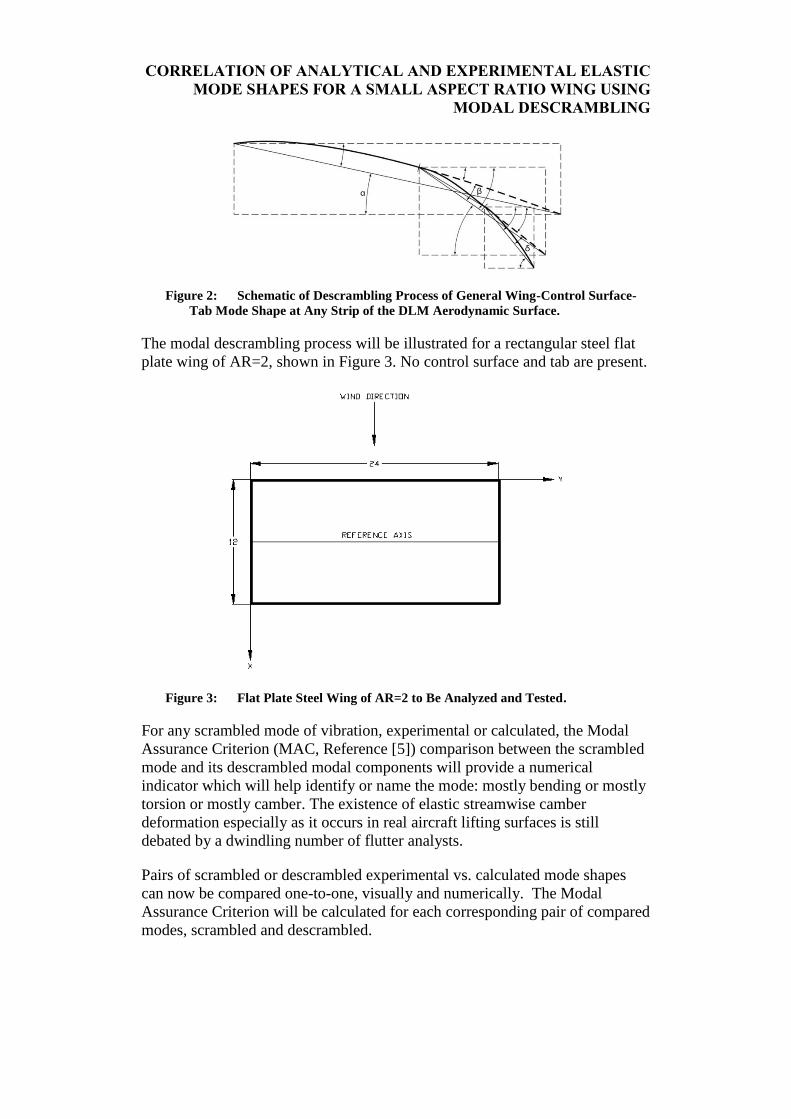
Figure 2: Schematic of Descrambling Process of General Wing-Control Surface-
Tab Mode Shape at Any Strip of the DLM Aerodynamic Surface.
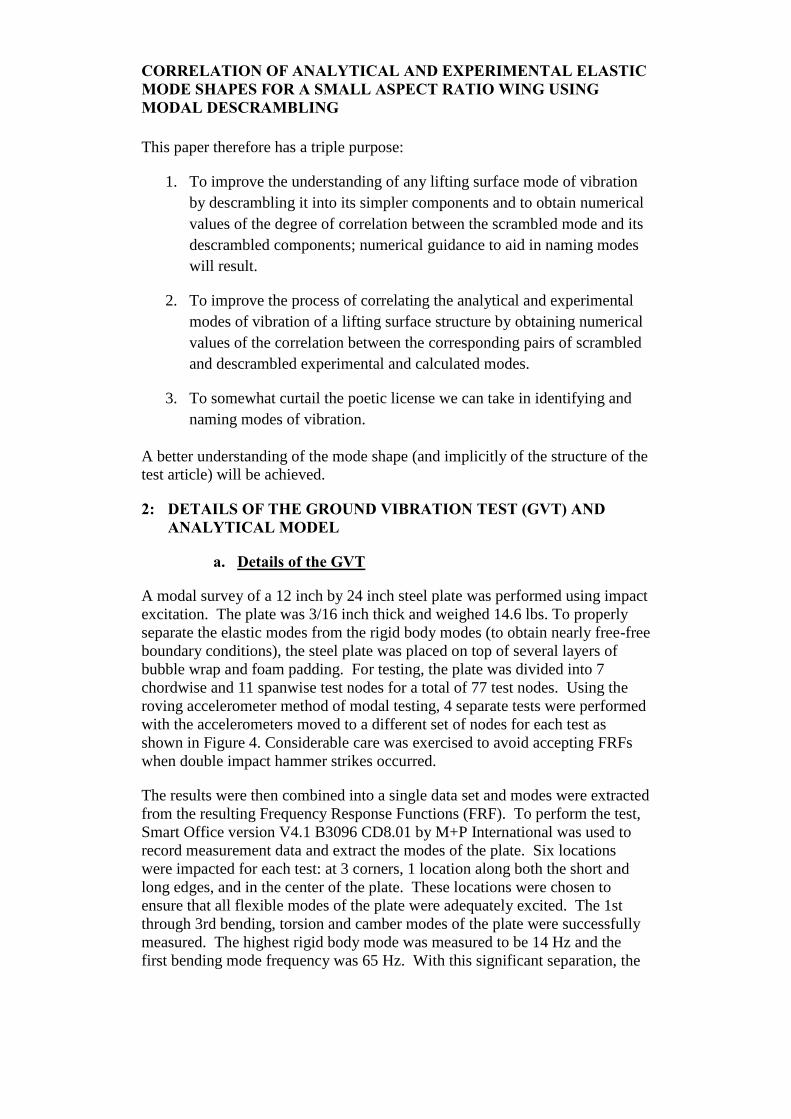
The modal descrambling process will be illustrated for a rectangular steel flat
plate wing of AR=2, shown in Figure 3. No control surface and tab are present.
Figure 3: Flat Plate Steel Wing of AR=2 to Be Analyzed and Tested.
For any scrambled mode of vibration, experimental or calculated, the Modal
Assurance Criterion (MAC, Reference [5]) comparison between the scrambled
mode and its descrambled modal components will provide a numerical
indicator which will help identify or name the mode: mostly bending or mostly
torsion or mostly camber. The existence of elastic streamwise camber
deformation especially as it occurs in real aircraft lifting surfaces is still
debated by a dwindling number of flutter analysts.
Pairs of scrambled or descrambled experimental vs. calculated mode shapes
can now be compared one-to-one, visually and numerically. The Modal
Assurance Criterion will be calculated for each corresponding pair of compared
modes, scrambled and descrambled.
CORRELATION OF ANALYTICAL AND EXPERIMENTAL ELASTIC
MODE SHAPES FOR A SMALL ASPECT RATIO WING USING
MODAL DESCRAMBLING
This paper therefore has a triple purpose:
1. To improve the understanding of any lifting surface mode of vibration
by descrambling it into its simpler components and to obtain numerical
values of the degree of correlation between the scrambled mode and its
descrambled components; numerical guidance to aid in naming modes
will result.
2. To improve the process of correlating the analytical and experimental
modes of vibration of a lifting surface structure by obtaining numerical
values of the correlation between the corresponding pairs of scrambled
and descrambled experimental and calculated modes.
3. To somewhat curtail the poetic license we can take in identifying and
naming modes of vibration.
A better understanding of the mode shape (and implicitly of the structure of the
test article) will be achieved.
2: DETAILS OF THE GROUND VIBRATION TEST (GVT) AND
ANALYTICAL MODEL
a. Details of the GVT
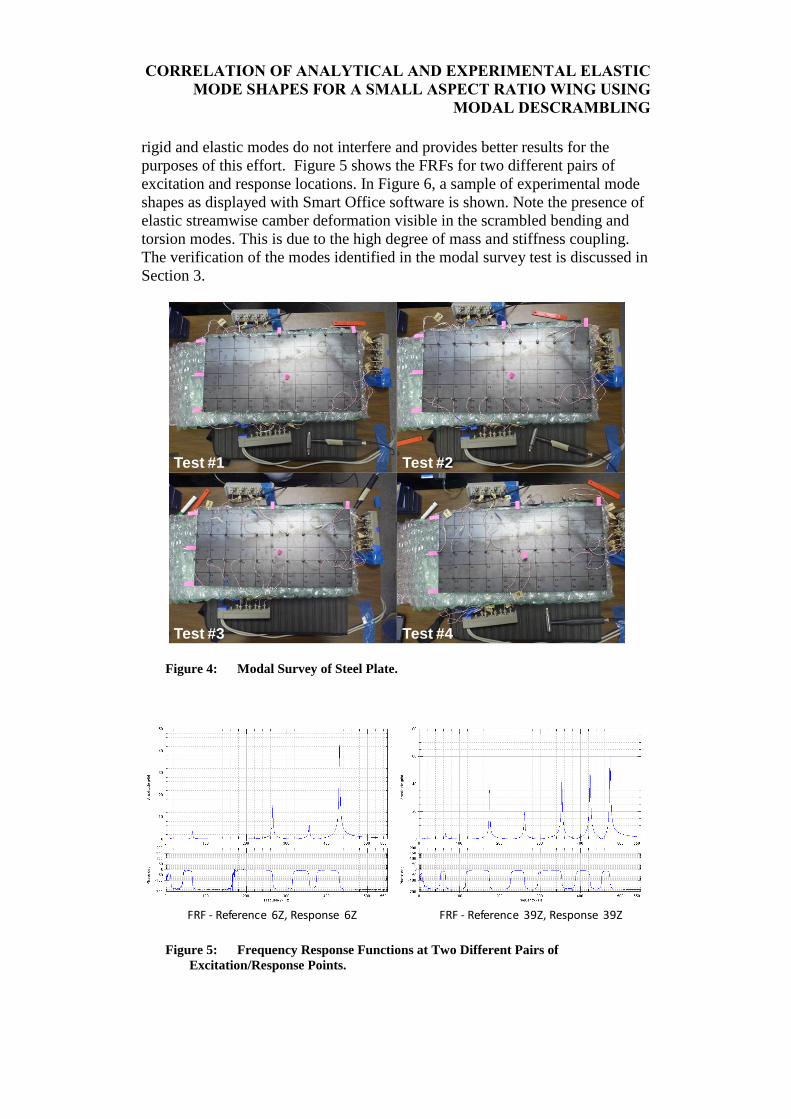
A modal survey of a 12 inch by 24 inch steel plate was performed using impact
excitation. The plate was 3/16 inch thick and weighed 14.6 lbs. To properly
separate the elastic modes from the rigid body modes (to obtain nearly free-free
boundary conditions), the steel plate was placed on top of several layers of
bubble wrap and foam padding. For testing, the plate was divided into 7
chordwise and 11 spanwise test nodes for a total of 77 test nodes. Using the
roving accelerometer method of modal testing, 4 separate tests were performed
with the accelerometers moved to a different set of nodes for each test as
shown in Figure 4. Considerable care was exercised to avoid accepting FRFs
when double impact hammer strikes occurred.
The results were then combined into a single data set and modes were extracted
from the resulting Frequency Response Functions (FRF). To perform the test,
Smart Office version V4.1 B3096 CD8.01 by M+P International was used to
record measurement data and extract the modes of the plate. Six locations
were impacted for each test: at 3 corners, 1 location along both the short and
long edges, and in the center of the plate. These locations were chosen to
ensure that all flexible modes of the plate were adequately excited. The 1st
through 3rd bending, torsion and camber modes of the plate were successfully
measured. The highest rigid body mode was measured to be 14 Hz and the
first bending mode frequency was 65 Hz. With this significant separation, the
CORRELATION OF ANALYTICAL AND EXPERIMENTAL ELASTIC
MODE SHAPES FOR A SMALL ASPECT RATIO WING USING
MODAL DESCRAMBLING
rigid and elastic modes do not interfere and provides better results for the
purposes of this effort. Figure 5 shows the FRFs for two different pairs of
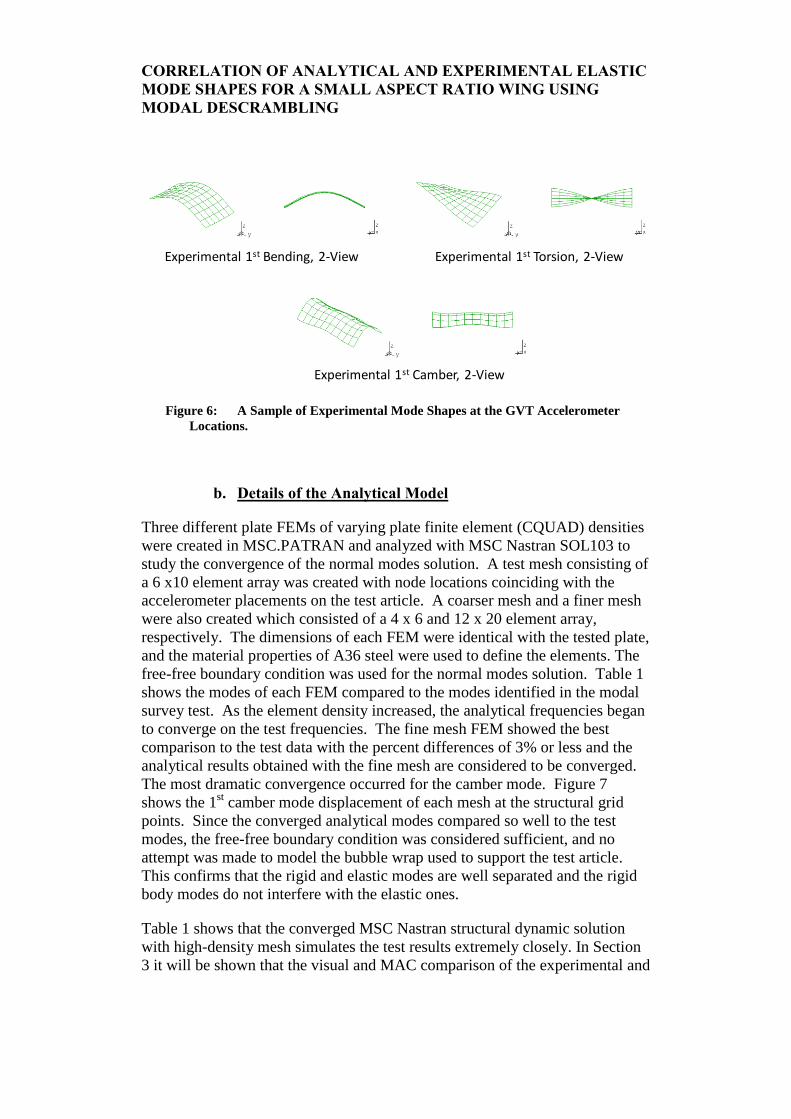
excitation and response locations. In Figure 6, a sample of experimental mode
shapes as displayed with Smart Office software is shown. Note the presence of
elastic streamwise camber deformation visible in the scrambled bending and
torsion modes. This is due to the high degree of mass and stiffness coupling.
The verification of the modes identified in the modal survey test is discussed in
Section 3.
Figure 4: Modal Survey of Steel Plate.
Figure 5: Frequency Response Functions at Two Different Pairs of
Excitation/Response Points.
Test #1 Test #2
Test #3 Test #4
FRF - Reference 6Z, Response 6Z FRF - Reference 39Z, Response 39Z
CORRELATION OF ANALYTICAL AND EXPERIMENTAL ELASTIC
MODE SHAPES FOR A SMALL ASPECT RATIO WING USING
MODAL DESCRAMBLING
Figure 6: A Sample of Experimental Mode Shapes at the GVT Accelerometer
Locations.
b. Details of the Analytical Model
Three different plate FEMs of varying plate finite element (CQUAD) densities
were created in MSC.PATRAN and analyzed with MSC Nastran SOL103 to
study the convergence of the normal modes solution. A test mesh consisting of
a 6 x10 element array was created with node locations coinciding with the
accelerometer placements on the test article. A coarser mesh and a finer mesh
were also created which consisted of a 4 x 6 and 12 x 20 element array,
respectively. The dimensions of each FEM were identical with the tested plate,
and the material properties of A36 steel were used to define the elements. The
free-free boundary condition was used for the normal modes solution. Table 1
shows the modes of each FEM compared to the modes identified in the modal
survey test. As the element density increased, the analytical frequencies began
to converge on the test frequencies. The fine mesh FEM showed the best
comparison to the test data with the percent differences of 3% or less and the
analytical results obtained with the fine mesh are considered to be converged.
The most dramatic convergence occurred for the camber mode. Figure 7
shows the 1st camber mode displacement of each mesh at the structural grid
points. Since the converged analytical modes compared so well to the test
modes, the free-free boundary condition was considered sufficient, and no
attempt was made to model the bubble wrap used to support the test article.
This confirms that the rigid and elastic modes are well separated and the rigid
body modes do not interfere with the elastic ones.
Table 1 shows that the converged MSC Nastran structural dynamic solution
with high-density mesh simulates the test results extremely closely. In Section
3 it will be shown that the visual and MAC comparison of the experimental and
Experimental 1st Bending, 2-View Experimental 1st Torsion, 2-View
Experimental 1st Camber, 2-View
CORRELATION OF ANALYTICAL AND EXPERIMENTAL ELASTIC
MODE SHAPES FOR A SMALL ASPECT RATIO WING USING
MODAL DESCRAMBLING
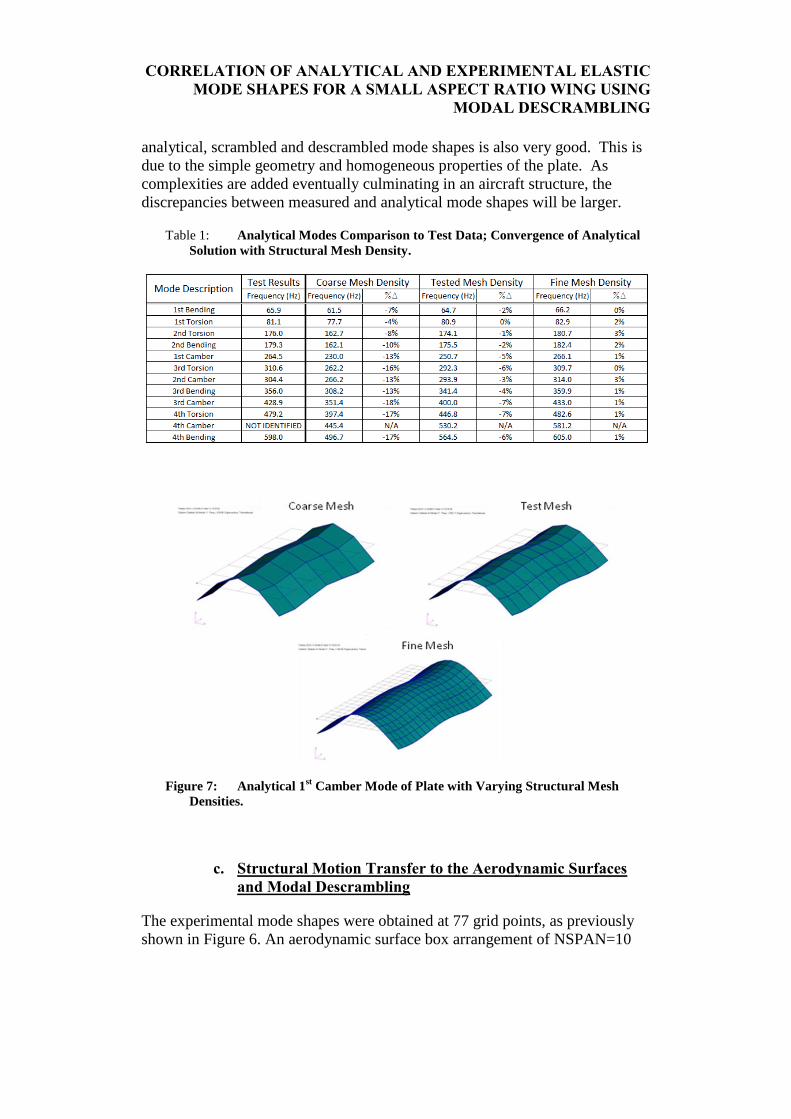
analytical, scrambled and descrambled mode shapes is also very good. This is
due to the simple geometry and homogeneous properties of the plate. As
complexities are added eventually culminating in an aircraft structure, the
discrepancies between measured and analytical mode shapes will be larger.
Table 1: Analytical Modes Comparison to Test Data; Convergence of Analytical
Solution with Structural Mesh Density.
Figure 7: Analytical 1st Camber Mode of Plate with Varying Structural Mesh
Densities.
c. Structural Motion Transfer to the Aerodynamic Surfaces
and Modal Descrambling
The experimental mode shapes were obtained at 77 grid points, as previously
shown in Figure 6. An aerodynamic surface box arrangement of NSPAN=10
CORRELATION OF ANALYTICAL AND EXPERIMENTAL ELASTIC
MODE SHAPES FOR A SMALL ASPECT RATIO WING USING
MODAL DESCRAMBLING
and NCHORD=6 for the steel flat plate wing was chosen so that the corners of
the boxes coincide with the accelerometer locations.
The measured mode shape displacements are then inputted into MSC Nastran
SOL145 at the specified corner grid points locations using the DMIG input
format for all the modes of interest. This structural motion is then transferred to
the DLM aerodynamic surface through the surface splining feature of SOL145.
The mode shapes at the aerodynamic set are then available for descrambling
and SOL145 is then stopped, since it is not expected that the flutter results for
this steel plate will bring any further enlightenment. After descrambling the
modes using a FORTRAN program, the descrambled displacements at the
centers of the aerodynamic boxes are plotted using MATLAB. A procedure to
display and animate the descrambled mode shapes using MSC PATRAN is in
work.
The analytical mode shapes obtained with the fine structural mesh are also
transferred to the same aerodynamic surface with NSPAN=10 and
NCHORD=6 using NASTRAN SOL145. The calculated mode shapes at the
centers of the aerodynamic boxes are now available for descrambling and for
graphical display at exactly the same locations as the measured modes.
3: COMPARISON OF THE GVT AND ANALYTICAL MODE
SHAPES
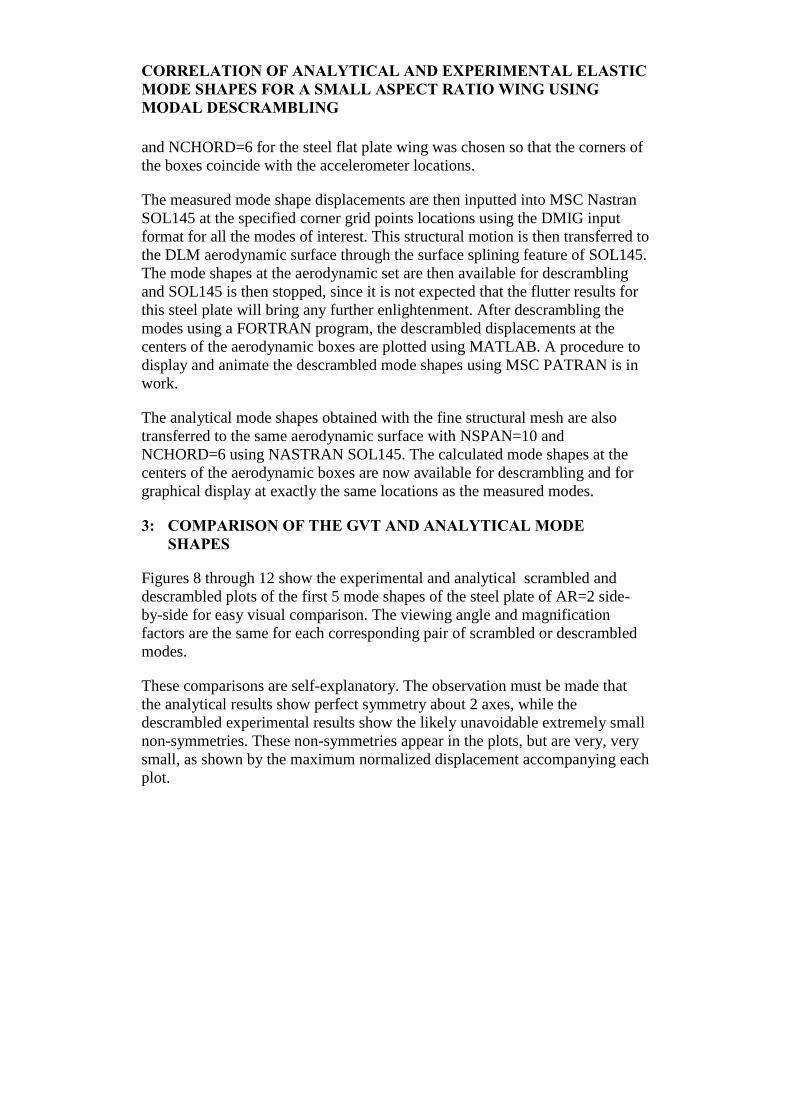
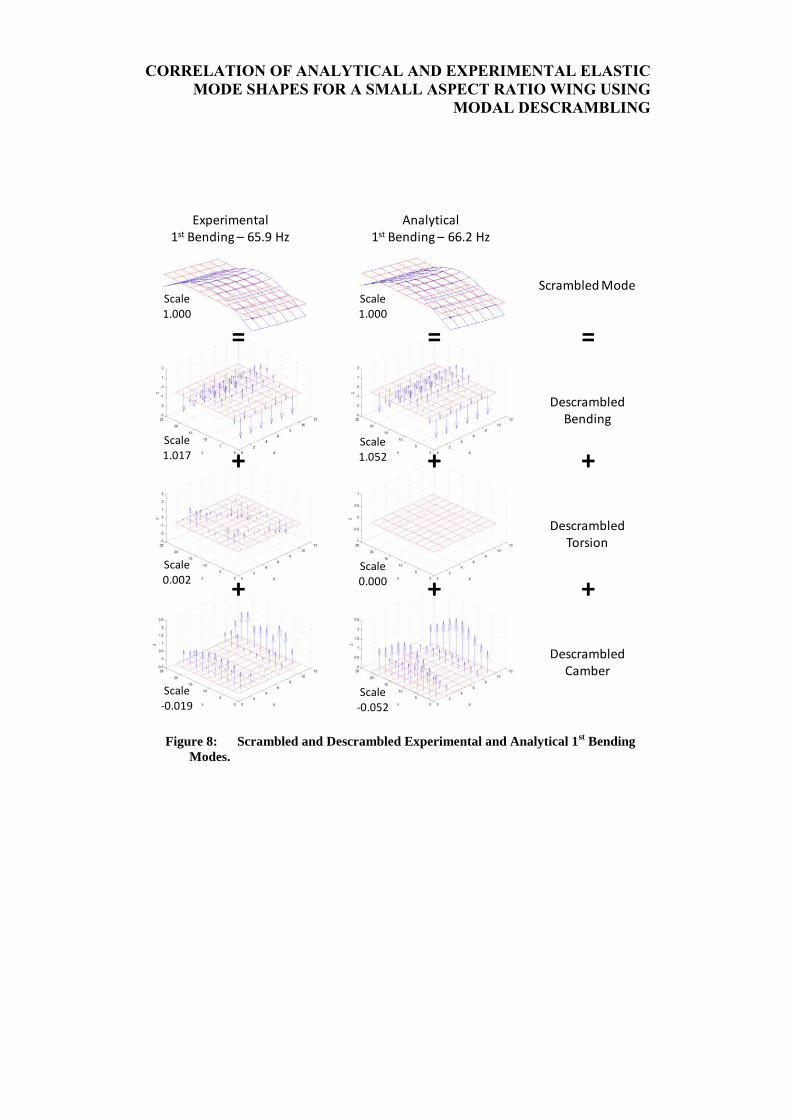
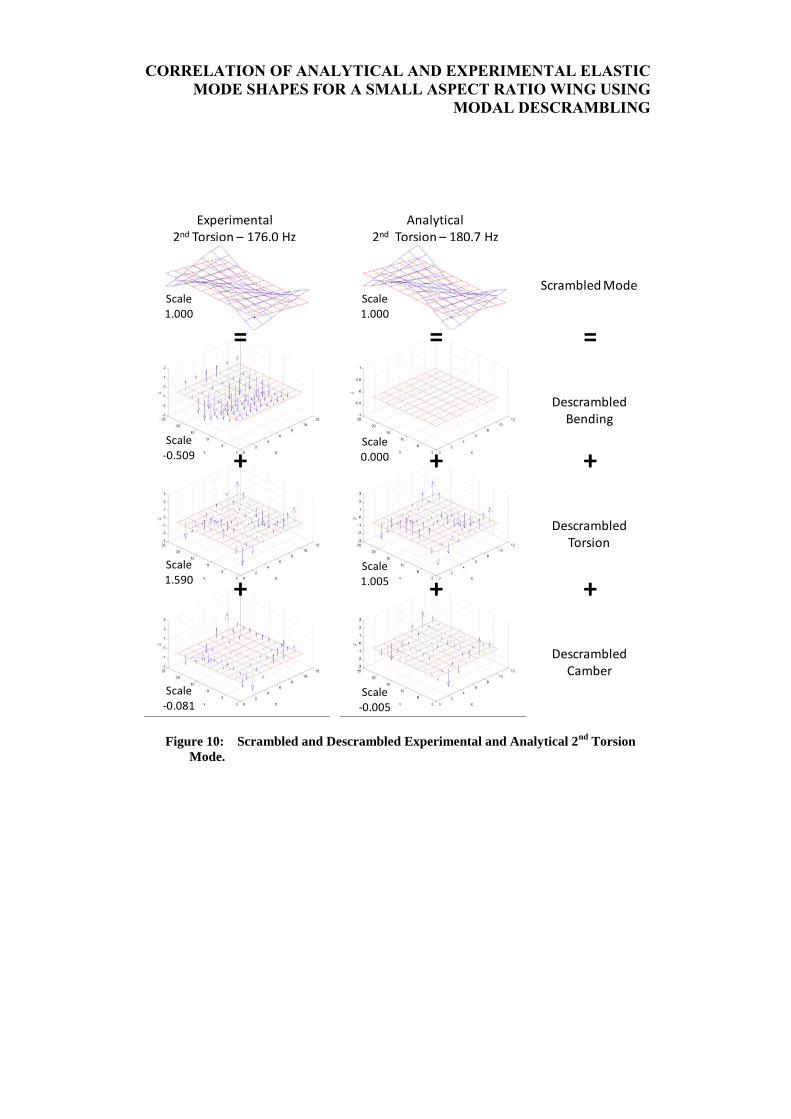
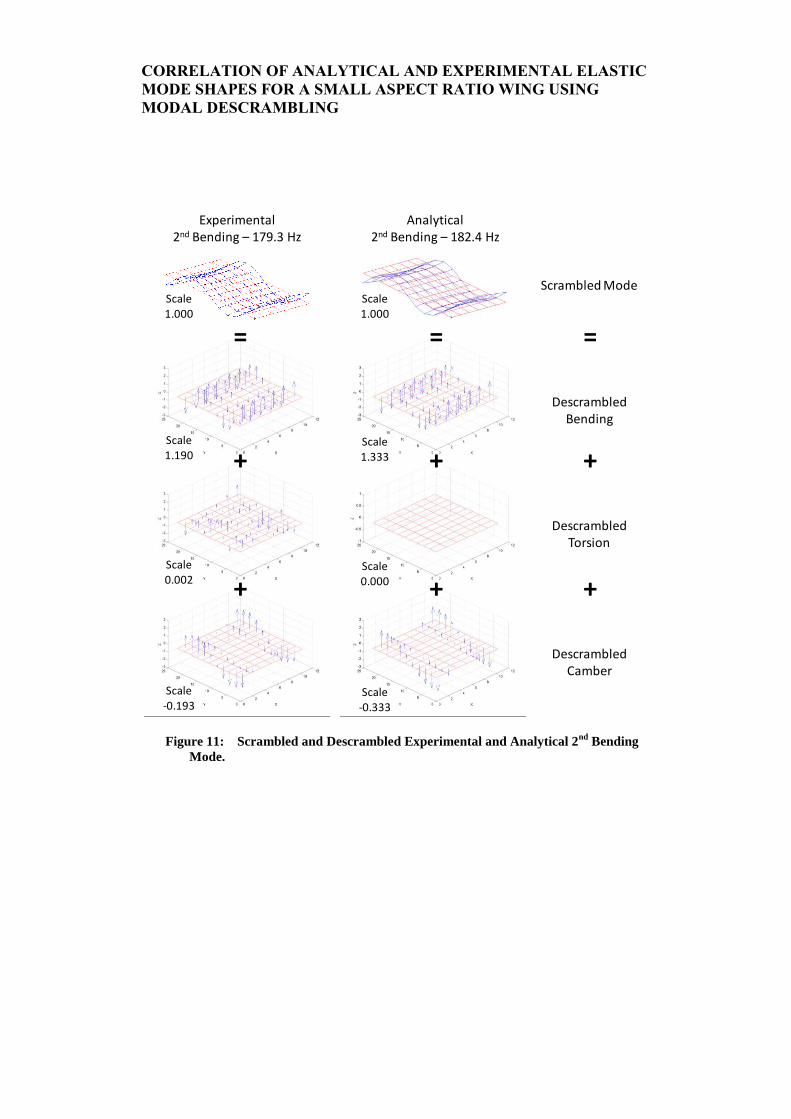
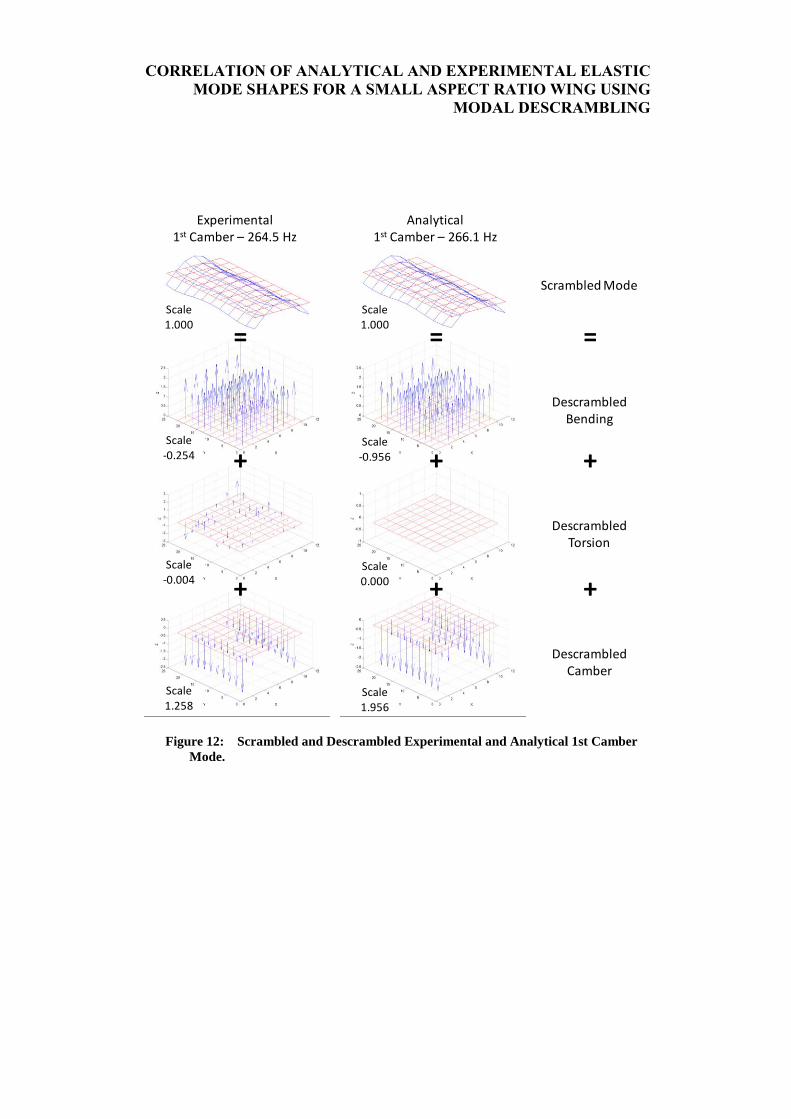
Figures 8 through 12 show the experimental and analytical scrambled and
descrambled plots of the first 5 mode shapes of the steel plate of AR=2 side-
by-side for easy visual comparison. The viewing angle and magnification
factors are the same for each corresponding pair of scrambled or descrambled
modes.
These comparisons are self-explanatory. The observation must be made that
the analytical results show perfect symmetry about 2 axes, while the
descrambled experimental results show the likely unavoidable extremely small
non-symmetries. These non-symmetries appear in the plots, but are very, very
small, as shown by the maximum normalized displacement accompanying each
plot.
CORRELATION OF ANALYTICAL AND EXPERIMENTAL ELASTIC
MODE SHAPES FOR A SMALL ASPECT RATIO WING USING
MODAL DESCRAMBLING
Figure 8: Scrambled and Descrambled Experimental and Analytical 1st Bending
Modes.
Experimental1st Bending – 65.9 Hz
Analytical1st Bending – 66.2 Hz
Scrambled Mode
DescrambledBending
DescrambledTorsion
DescrambledCamber
=
+
+
=
+
+
=
+
+
Scale 1.017
Scale 0.002
Scale -0.019
Scale 1.052
Scale 0.000
Scale -0.052
Scale 1.000
Scale 1.000
CORRELATION OF ANALYTICAL AND EXPERIMENTAL ELASTIC
MODE SHAPES FOR A SMALL ASPECT RATIO WING USING
MODAL DESCRAMBLING
Figure 9: Scrambled and Descrambled Experimental and Analytical 1st Torsion
Mode.
Experimental1st Torsion – 81.1 Hz
Analytical1st Torsion – 82.9 Hz
Scrambled Mode
DescrambledBending
DescrambledTorsion
DescrambledCamber
=
+
+
=
+
+
=
+
+
Scale -0.643
Scale 1.632
Scale 0.000
Scale 1.001
Scale1.000
Scale 1.000
Scale 0.011
Scale -0.001
CORRELATION OF ANALYTICAL AND EXPERIMENTAL ELASTIC
MODE SHAPES FOR A SMALL ASPECT RATIO WING USING
MODAL DESCRAMBLING
Figure 10: Scrambled and Descrambled Experimental and Analytical 2nd
Torsion
Mode.
Experimental2nd Torsion – 176.0 Hz
Analytical2nd Torsion – 180.7 Hz
Scrambled Mode
DescrambledBending
DescrambledTorsion
DescrambledCamber
=
+
+
=
+
+
=
+
+
Scale -0.509
Scale 1.590
Scale 0.000
Scale 1.005
Scale 1.000
Scale 1.000
Scale -0.081
Scale -0.005
CORRELATION OF ANALYTICAL AND EXPERIMENTAL ELASTIC
MODE SHAPES FOR A SMALL ASPECT RATIO WING USING
MODAL DESCRAMBLING
Figure 11: Scrambled and Descrambled Experimental and Analytical 2nd
Bending
Mode.
Experimental2nd Bending – 179.3 Hz
Analytical2nd Bending – 182.4 Hz
Scrambled Mode
DescrambledBending
DescrambledTorsion
DescrambledCamber
=
+
+
=
+
+
=
+
+
Scale 1.190
Scale 0.002
Scale 1.333
Scale 0.000
Scale 1.000
Scale 1.000
Scale -0.193
Scale -0.333
CORRELATION OF ANALYTICAL AND EXPERIMENTAL ELASTIC
MODE SHAPES FOR A SMALL ASPECT RATIO WING USING
MODAL DESCRAMBLING
Figure 12: Scrambled and Descrambled Experimental and Analytical 1st Camber
Mode.
Experimental1st Camber – 264.5 Hz
Analytical1st Camber – 266.1 Hz
Scrambled Mode
DescrambledBending
DescrambledTorsion
DescrambledCamber
=
+
+
=
+
+
=
+
+
Scale -0.254
Scale -0.004
Scale -0.956
Scale 0.000
Scale 1.000
Scale 1.000
Scale 1.258
Scale 1.956
CORRELATION OF ANALYTICAL AND EXPERIMENTAL ELASTIC
MODE SHAPES FOR A SMALL ASPECT RATIO WING USING
MODAL DESCRAMBLING
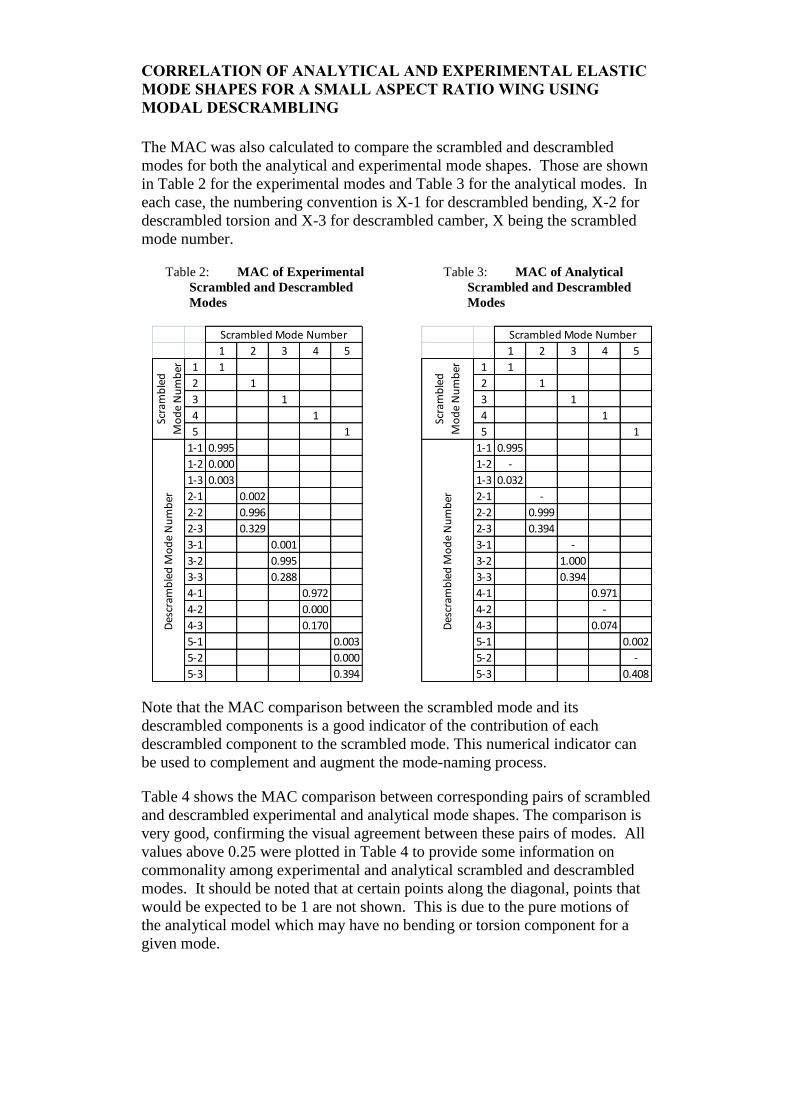
The MAC was also calculated to compare the scrambled and descrambled
modes for both the analytical and experimental mode shapes. Those are shown
in Table 2 for the experimental modes and Table 3 for the analytical modes. In
each case, the numbering convention is X-1 for descrambled bending, X-2 for
descrambled torsion and X-3 for descrambled camber, X being the scrambled
mode number.
Table 2: MAC of Experimental
Scrambled and Descrambled
Modes
Table 3: MAC of Analytical
Scrambled and Descrambled
Modes
Note that the MAC comparison between the scrambled mode and its
descrambled components is a good indicator of the contribution of each
descrambled component to the scrambled mode. This numerical indicator can
be used to complement and augment the mode-naming process.
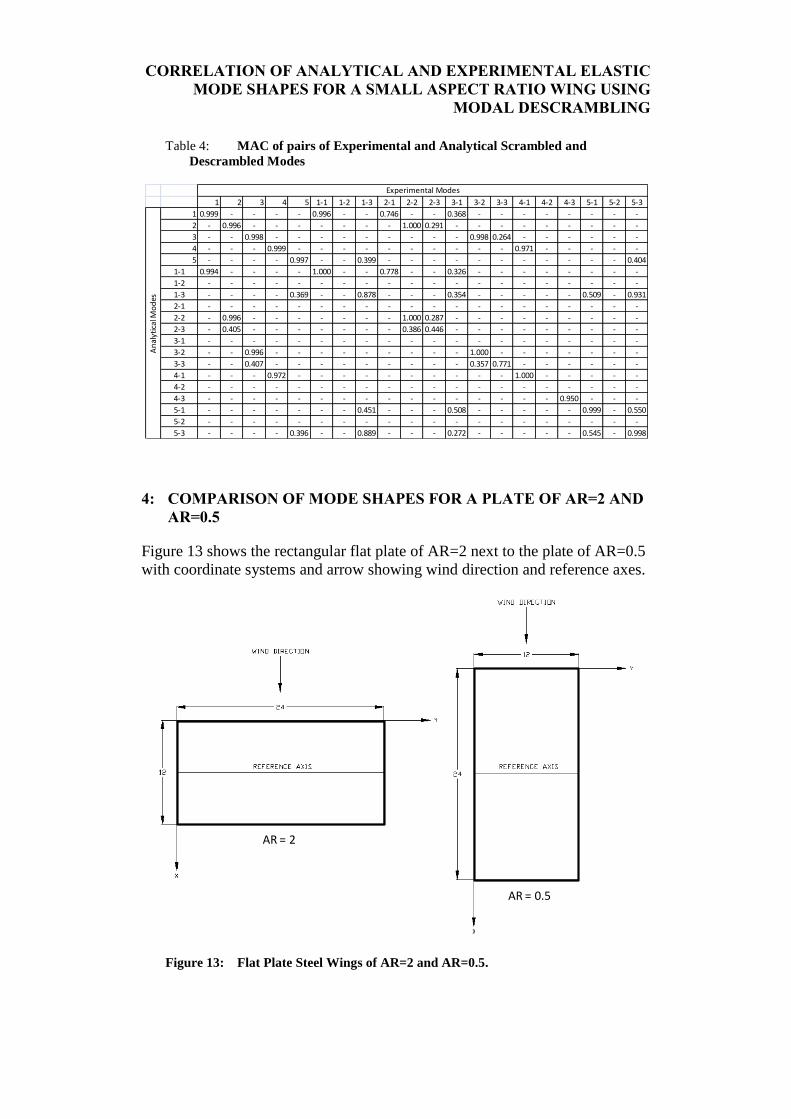
Table 4 shows the MAC comparison between corresponding pairs of scrambled
and descrambled experimental and analytical mode shapes. The comparison is
very good, confirming the visual agreement between these pairs of modes. All
values above 0.25 were plotted in Table 4 to provide some information on
commonality among experimental and analytical scrambled and descrambled
modes. It should be noted that at certain points along the diagonal, points that
would be expected to be 1 are not shown. This is due to the pure motions of
the analytical model which may have no bending or torsion component for a
given mode.
1 2 3 4 5
1 1
2 1
3 1
4 1
5 1
1-1 0.995
1-2 0.000
1-3 0.003
2-1 0.002
2-2 0.996
2-3 0.329
3-1 0.001
3-2 0.995
3-3 0.288
4-1 0.972
4-2 0.000
4-3 0.170
5-1 0.003
5-2 0.000
5-3 0.394
Scra
mb
led
Mo
de
Nu
mb
erD
escr
amb
led
Mo
de
Nu
mb
er
Scrambled Mode Number
1 2 3 4 5
1 1
2 1
3 1
4 1
5 1
1-1 0.995
1-2 -
1-3 0.032
2-1 -
2-2 0.999
2-3 0.394
3-1 -
3-2 1.000
3-3 0.394
4-1 0.971
4-2 -
4-3 0.074
5-1 0.002
5-2 -
5-3 0.408
Scrambled Mode Number
Scra
mb
led
Mo
de
Nu
mb
erD
escr
amb
led
Mo
de
Nu
mb
er
CORRELATION OF ANALYTICAL AND EXPERIMENTAL ELASTIC
MODE SHAPES FOR A SMALL ASPECT RATIO WING USING
MODAL DESCRAMBLING
Table 4: MAC of pairs of Experimental and Analytical Scrambled and
Descrambled Modes
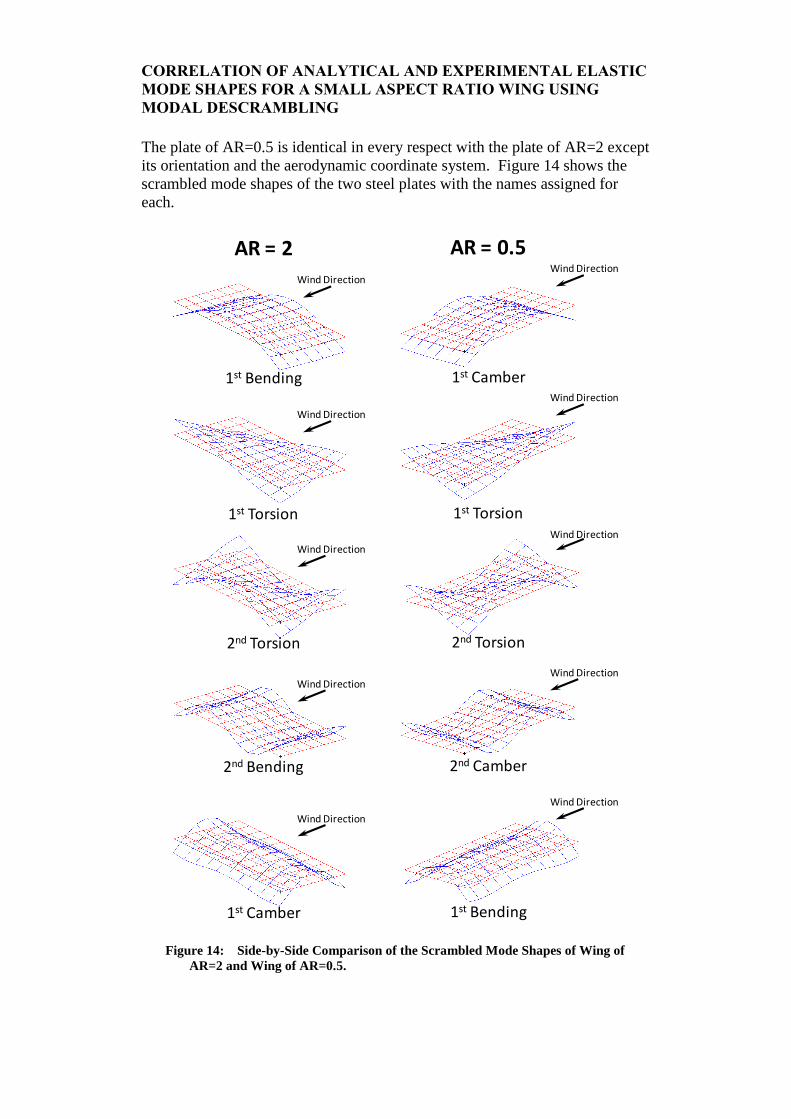
4: COMPARISON OF MODE SHAPES FOR A PLATE OF AR=2 AND
AR=0.5
Figure 13 shows the rectangular flat plate of AR=2 next to the plate of AR=0.5
with coordinate systems and arrow showing wind direction and reference axes.
Figure 13: Flat Plate Steel Wings of AR=2 and AR=0.5.
1 2 3 4 5 1-1 1-2 1-3 2-1 2-2 2-3 3-1 3-2 3-3 4-1 4-2 4-3 5-1 5-2 5-3
1 0.999 - - - - 0.996 - - 0.746 - - 0.368 - - - - - - - -
2 - 0.996 - - - - - - - 1.000 0.291 - - - - - - - - -
3 - - 0.998 - - - - - - - - - 0.998 0.264 - - - - - -
4 - - - 0.999 - - - - - - - - - - 0.971 - - - - -
5 - - - - 0.997 - - 0.399 - - - - - - - - - - - 0.404
1-1 0.994 - - - - 1.000 - - 0.778 - - 0.326 - - - - - - - -
1-2 - - - - - - - - - - - - - - - - - - - -
1-3 - - - - 0.369 - - 0.878 - - - 0.354 - - - - - 0.509 - 0.931
2-1 - - - - - - - - - - - - - - - - - - - -
2-2 - 0.996 - - - - - - - 1.000 0.287 - - - - - - - - -
2-3 - 0.405 - - - - - - - 0.386 0.446 - - - - - - - - -
3-1 - - - - - - - - - - - - - - - - - - - -
3-2 - - 0.996 - - - - - - - - - 1.000 - - - - - - -
3-3 - - 0.407 - - - - - - - - - 0.357 0.771 - - - - - -
4-1 - - - 0.972 - - - - - - - - - - 1.000 - - - - -
4-2 - - - - - - - - - - - - - - - - - - - -
4-3 - - - - - - - - - - - - - - - - 0.950 - - -
5-1 - - - - - - - 0.451 - - - 0.508 - - - - - 0.999 - 0.550
5-2 - - - - - - - - - - - - - - - - - - - -
5-3 - - - - 0.396 - - 0.889 - - - 0.272 - - - - - 0.545 - 0.998
An
alyt
ical
Mo
des
Experimental Modes
AR = 0.5
AR = 2
CORRELATION OF ANALYTICAL AND EXPERIMENTAL ELASTIC
MODE SHAPES FOR A SMALL ASPECT RATIO WING USING
MODAL DESCRAMBLING
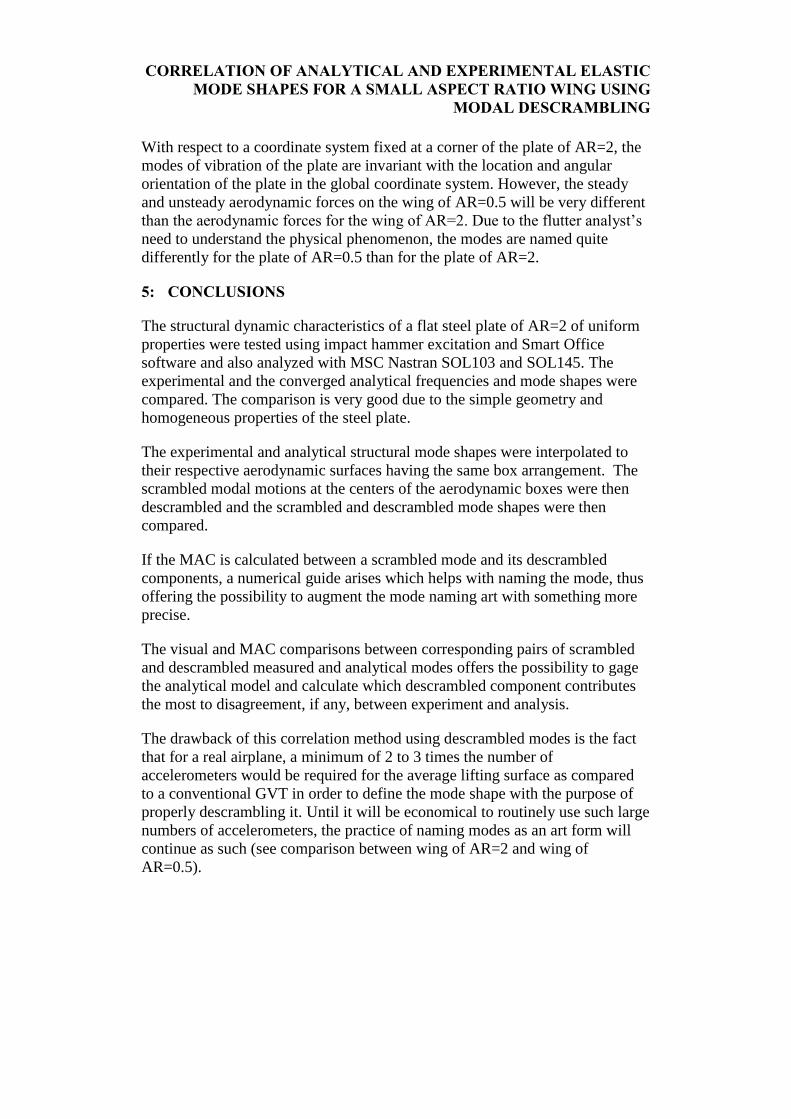
The plate of AR=0.5 is identical in every respect with the plate of AR=2 except
its orientation and the aerodynamic coordinate system. Figure 14 shows the
scrambled mode shapes of the two steel plates with the names assigned for
each.
Figure 14: Side-by-Side Comparison of the Scrambled Mode Shapes of Wing of
AR=2 and Wing of AR=0.5.
AR = 2 AR = 0.5
1st Bending 1st Camber
1st Torsion 1st Torsion
2nd Torsion 2nd Torsion
2nd Bending 2nd Camber
1st Camber 1st Bending
Wind Direction
Wind Direction
Wind Direction
Wind Direction
Wind Direction
Wind Direction
Wind Direction
Wind Direction
Wind Direction
Wind Direction
CORRELATION OF ANALYTICAL AND EXPERIMENTAL ELASTIC
MODE SHAPES FOR A SMALL ASPECT RATIO WING USING
MODAL DESCRAMBLING
With respect to a coordinate system fixed at a corner of the plate of AR=2, the
modes of vibration of the plate are invariant with the location and angular
orientation of the plate in the global coordinate system. However, the steady
and unsteady aerodynamic forces on the wing of AR=0.5 will be very different
than the aerodynamic forces for the wing of AR=2. Due to the flutter analyst’s
need to understand the physical phenomenon, the modes are named quite
differently for the plate of AR=0.5 than for the plate of AR=2.
5: CONCLUSIONS
The structural dynamic characteristics of a flat steel plate of AR=2 of uniform
properties were tested using impact hammer excitation and Smart Office
software and also analyzed with MSC Nastran SOL103 and SOL145. The
experimental and the converged analytical frequencies and mode shapes were
compared. The comparison is very good due to the simple geometry and
homogeneous properties of the steel plate.
The experimental and analytical structural mode shapes were interpolated to
their respective aerodynamic surfaces having the same box arrangement. The
scrambled modal motions at the centers of the aerodynamic boxes were then
descrambled and the scrambled and descrambled mode shapes were then
compared.
If the MAC is calculated between a scrambled mode and its descrambled
components, a numerical guide arises which helps with naming the mode, thus
offering the possibility to augment the mode naming art with something more
precise.
The visual and MAC comparisons between corresponding pairs of scrambled
and descrambled measured and analytical modes offers the possibility to gage
the analytical model and calculate which descrambled component contributes
the most to disagreement, if any, between experiment and analysis.
The drawback of this correlation method using descrambled modes is the fact
that for a real airplane, a minimum of 2 to 3 times the number of
accelerometers would be required for the average lifting surface as compared
to a conventional GVT in order to define the mode shape with the purpose of
properly descrambling it. Until it will be economical to routinely use such large
numbers of accelerometers, the practice of naming modes as an art form will
continue as such (see comparison between wing of AR=2 and wing of
AR=0.5).
CORRELATION OF ANALYTICAL AND EXPERIMENTAL ELASTIC
MODE SHAPES FOR A SMALL ASPECT RATIO WING USING
MODAL DESCRAMBLING
6: ACKNOWLEDGEMENTS
The authors are indebted to Mr. John Corbett, who wrote the MATLAB mode
shape plotting procedure.
7: REFERENCES
1. Suciu, E., and Buck, J., “Postprocessor for Automatic Mode
Identification for MSC/NASTRAN Structural Dynamic Solutions with
Emphasis on Aircraft Flutter Applications”, presented at the 1998
MSC/NASTRAN America’s Users’ Conference, Los Angeles, CA,
October 5-8, 1998.
2. Rodden, W.P., and Johnson, E.H., “User’s Guide V68, MSC.Nastran
Aeroelastic Analysis”, The MacNeal-Schwendler Corporation, Los
Angeles, CA, 1994.
3. Panza, J.L., and Suciu, E., “A Closer Look at the Elastic Streamwise
Camber Deformation of Swept and Unswept Wings”, Presented at the
International Forum for Aeroelasticity and Structural Dynamics 2005 as
Paper No. IF-090, Munich, Germany, June 28 – July 1, 2005.
4. Suciu, E., Stathopoulos, N., Dickinson, M. and Glaser, J.,”The T-Tail
Flutter Mechanism Revisited”, Paper No. IFASD-2011-121, Presented at
the International Forum for Aeroelasticity and Structural Dynamics,
Paris, France, June 26-30, 2011.
5. Allemang, R.J., "The Modal Assurance Criterion (MAC): Twenty Years
of Use and Abuse", Presented at IMAC-XX: Conference & Exposition on
Structural Dynamics, 2002.