Correlation Coefficient -1 0 1 Negative No Positive Correlation Correlation Correlation.
Upload
rosaline-haynesCategory
view
219download
0
CORRELATION AND FUNCTIONAL DEPENDENCY
28th Annual DoD Cost Analysis Symposium Leesburg, VA 22 September 1994
An Overview of Correlation and Functional Dependencies
in Cost Risk and Uncertainty Analysis
Richard L. Coleman22 September 1994
Paper submitted byRichard L. Coleman
Shishu S. Gupta15 August 1994
CORRELATION AND FUNCTIONAL DEPENDENCY
28th Annual DoD Cost Analysis Symposium Leesburg, VA 22 September 1994
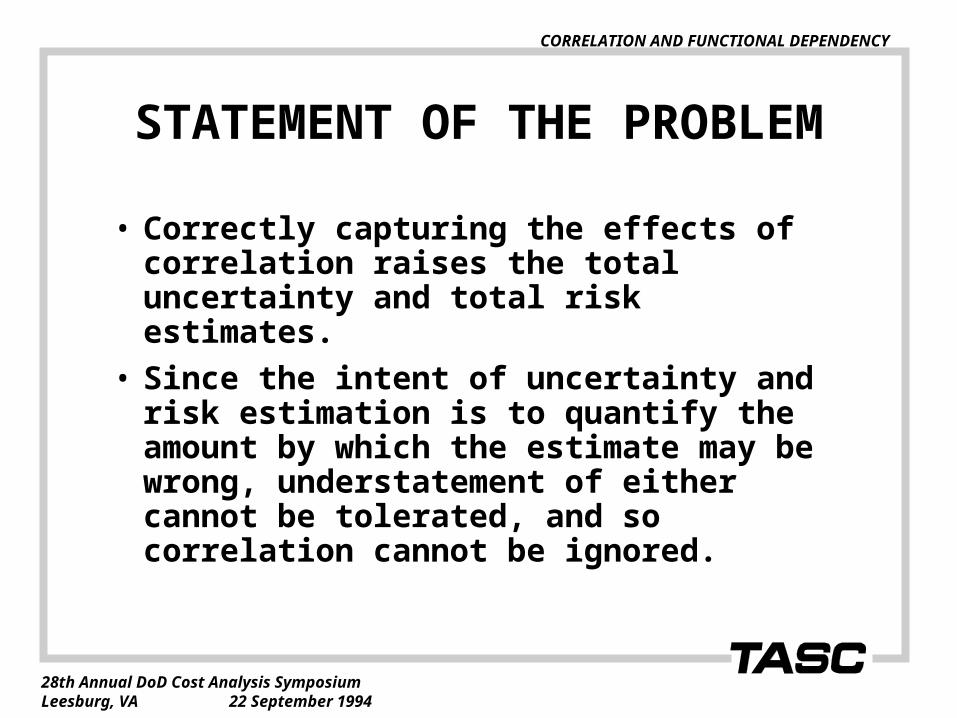
STATEMENT OF THE PROBLEM
• Correctly capturing the effects of correlation raises the total uncertainty and total risk estimates.
• Since the intent of uncertainty and risk estimation is to quantify the amount by which the estimate may be wrong, understatement of either cannot be tolerated, and so correlation cannot be ignored.
CORRELATION AND FUNCTIONAL DEPENDENCY
28th Annual DoD Cost Analysis Symposium Leesburg, VA 22 September 1994
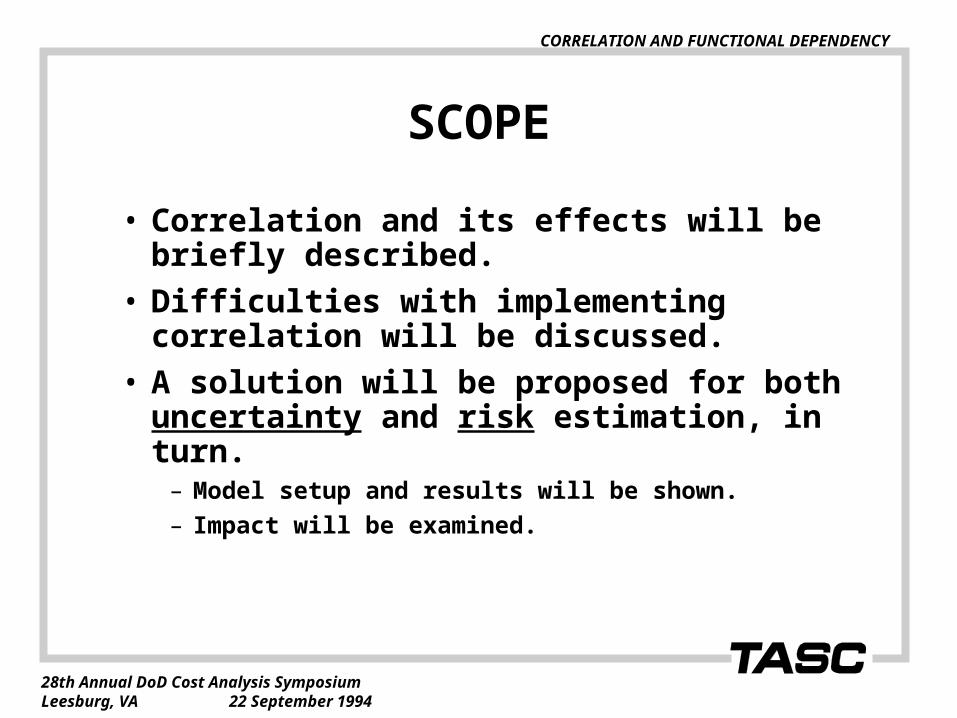
SCOPE
• Correlation and its effects will be briefly described.
• Difficulties with implementing correlation will be discussed.
• A solution will be proposed for both uncertainty and risk estimation, in turn.
– Model setup and results will be shown.
– Impact will be examined.

CORRELATION AND FUNCTIONAL DEPENDENCY
28th Annual DoD Cost Analysis Symposium Leesburg, VA 22 September 1994
DEFINITIONS
• Cost Growth: the change (positive or negative) in the final cost of a weapon system.
– Predicted growth at the outset or during the acquisition
– Actual growth at the end of acquisition
• Risk: the prediction of cost growth before the end of the acquisition.
• Uncertainty: the statistical variability in prediction of the costs (not cost growth.)
– Implicit in the data and procedures (e.g., linear regression) used to generate a cost estimate

CORRELATION AND FUNCTIONAL DEPENDENCY
28th Annual DoD Cost Analysis Symposium Leesburg, VA 22 September 1994
DEFINITIONS (cont’d)• Functional dependency: a dependent variable
derived from a functional relationship to an independent variable.
– “Source variable” and “derivative variable” will replace “independent” and “dependent variable,” respectively, to avoid confusions over the algebraic and statistical meanings of independent.
• Functional correlation: correlation that arises between source and derivative variables as a result of functional dependency.
• Derivative correlation: correlation that arises among derivative variables as a result of functional dependency.

CORRELATION AND FUNCTIONAL DEPENDENCY
28th Annual DoD Cost Analysis Symposium Leesburg, VA 22 September 1994
ASSUMPTIONS AND LIMITATIONS
• This briefing is couched in terms of the Normal (Gaussian) distribution and the triangular distribution.
– The procedure is in no way limited to any particular distribution.

CORRELATION AND FUNCTIONAL DEPENDENCY
28th Annual DoD Cost Analysis Symposium Leesburg, VA 22 September 1994
IMPACT OF CORRELATION
• The correlation of costs does not usually affect the point estimate of costs
– Correlations of predictive inputs are dealt with in standard ways, e.g., choice of independent inputs.
– Depending on distributional assumptions, and the percentile used, the point estimate may shift with correlation.
• The impact arises in the quantification of the uncertainty and risk of a cost estimate.
– The estimate of risk and uncertainty are almost always affected.

CORRELATION AND FUNCTIONAL DEPENDENCY
28th Annual DoD Cost Analysis Symposium Leesburg, VA 22 September 1994
CORRELATION AND DISPERSION
• In positive correlation, correlated costs tend to rise and fall together, increasing dispersion.
• In independence, some costs rise while others fall, offseting the excesses of one another, giving intermediate dispersion.
• In negative correlation, correlated cost changes tend to directly offset one another, reducing total dispersion.
CORRELATION AND FUNCTIONAL DEPENDENCY
28th Annual DoD Cost Analysis Symposium Leesburg, VA 22 September 1994
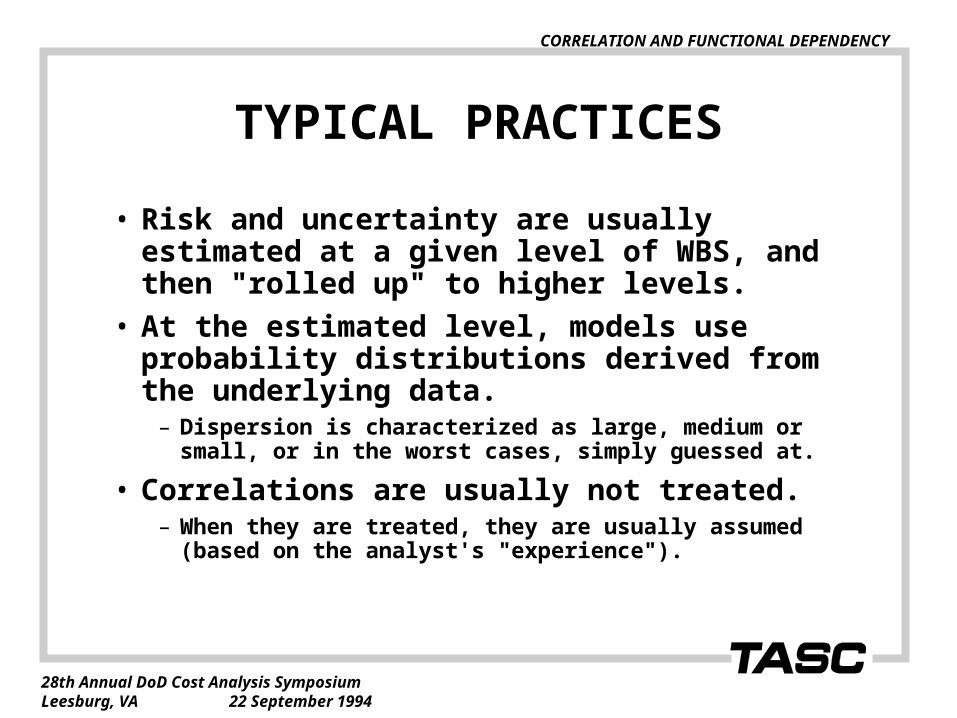
TYPICAL PRACTICES
• Risk and uncertainty are usually estimated at a given level of WBS, and then "rolled up" to higher levels.
• At the estimated level, models use probability distributions derived from the underlying data.
– Dispersion is characterized as large, medium or small, or in the worst cases, simply guessed at.
• Correlations are usually not treated.– When they are treated, they are usually assumed (based
on the analyst's "experience").

CORRELATION AND FUNCTIONAL DEPENDENCY
28th Annual DoD Cost Analysis Symposium Leesburg, VA 22 September 1994
OBSTACLES TO CORRELATION ESTIMATION
• Discovery of mutual cost correlation is nearly impossible in practice.
– Most data and resulting CERs are derived piecemeal, from disparate data sources, which will not yield correlation estimates.
• Correlation is useful principally in risk and uncertainty, so cost research does not collect and analyze it, except in individual CERs.
• Risk and uncertainty research focus on models and distributions and don’t get to correlation collection and analysis.

CORRELATION AND FUNCTIONAL DEPENDENCY
28th Annual DoD Cost Analysis Symposium Leesburg, VA 22 September 1994
OBSTACLES TO CORRELATION IMPLEMENTATION
• Estimated or assumed correlations might provide an mathematically intractable correlation matrix.
• Production of a full set of random numbers needed to produce a simulation solution is ponderous.
– Relies on, e.g., the Choleski Factorization method.
• The problem becomes even more complex if non-Gaussian distributions are used.

CORRELATION AND FUNCTIONAL DEPENDENCY
28th Annual DoD Cost Analysis Symposium Leesburg, VA 22 September 1994
UNCERTAINTY SETUP
• The same WBS and relationships as are used in the cost estimate are imbedded into a spreadsheet-based model.
• The WBS level varies, to achieve independence among “source” variables.
• The model is set up to accept means and standard deviations.
• Source variables come from random draws.
• Derivative variables fall out of the equations.

CORRELATION AND FUNCTIONAL DEPENDENCY
28th Annual DoD Cost Analysis Symposium Leesburg, VA 22 September 1994
EXAMPLE WBS STRUCTURE
SE/PM
Hardware Total cost
DevEng
CORRELATION AND FUNCTIONAL DEPENDENCY
28th Annual DoD Cost Analysis Symposium Leesburg, VA 22 September 1994
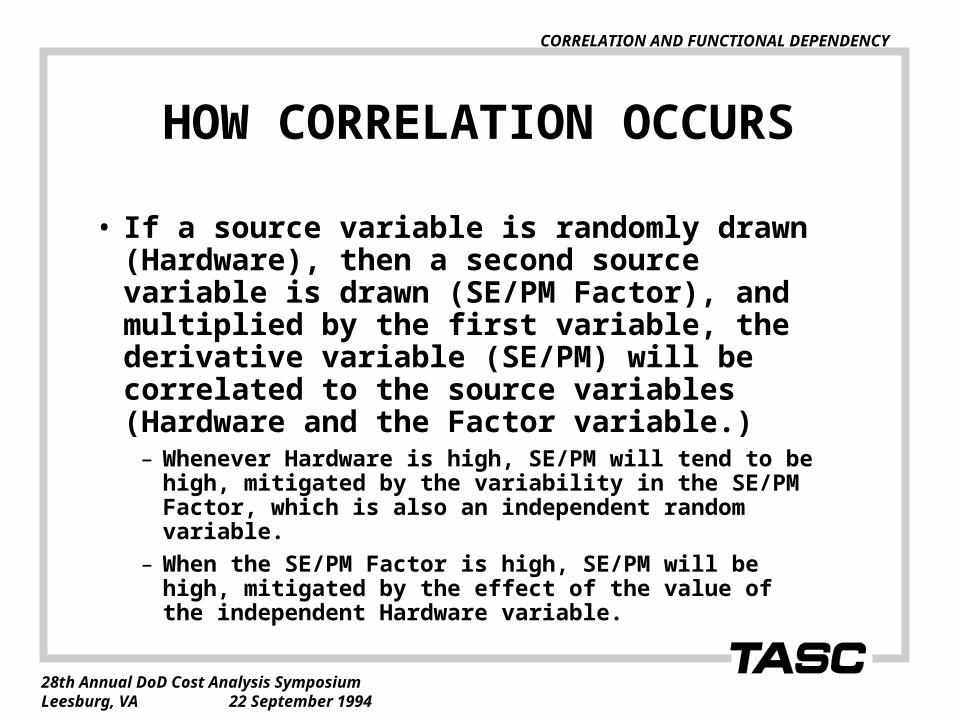
HOW CORRELATION OCCURS
• If a source variable is randomly drawn (Hardware), then a second source variable is drawn (SE/PM Factor), and multiplied by the first variable, the derivative variable (SE/PM) will be correlated to the source variables (Hardware and the Factor variable.)
– Whenever Hardware is high, SE/PM will tend to be high, mitigated by the variability in the SE/PM Factor, which is also an independent random variable.
– When the SE/PM Factor is high, SE/PM will be high, mitigated by the effect of the value of the independent Hardware variable.

CORRELATION AND FUNCTIONAL DEPENDENCY
28th Annual DoD Cost Analysis Symposium Leesburg, VA 22 September 1994
UNCERTAINTY RUN EXAMPLE
• Let Hardware be a source variable.
• Let SE/PM and DevEng be derivative variables (linear functions of hardware) as follows:
SE/PM = 10 + .2 * Hardware
DevEng = 10 + .1 * Hardware

CORRELATION AND FUNCTIONAL DEPENDENCY
28th Annual DoD Cost Analysis Symposium Leesburg, VA 22 September 1994
UNCERTAINTY MODEL OUTPUT
Type Input One OutputVariable of Input Std Simulation Output Std
Name Variable Mean Deviation Result* Mean Deviation
Hardware Source 100.0 10.0 111.430 100.50 9.90SE/PM Factor Source 0.2 0.02 0.223 0.20 0.02SE/PM Derivative 34.849 30.10 3.01DevEng Factor Source 0.1 0.01 0.109 0.10 0.01DevEng Derivative 22.146 20.05 2.005
Total Cost Derivative 168.425 150.65 12.877
* The result of either a draw of a single random variable from the distribution (in the case of a source variable), or an algebraic expression involving constants and source variables (in the case of a derivative variable).

CORRELATION AND FUNCTIONAL DEPENDENCY
28th Annual DoD Cost Analysis Symposium Leesburg, VA 22 September 1994
FUNCTIONAL CORRELATION • The first 30 sets of the full 1000 random draws
were captured and regressed, in order to test for relationships. Results:
SE/PM = 10.05 + 0.201 * Hardware
DevEng = 12.33 + 0.077 * Hardware
SE/PM DevEng
Std. Err. of Y Est. 2.566 1.047
R-Squared 0.345 0.314
Correlation 0.587 0.560
t statistic 4.456 6.390

CORRELATION AND FUNCTIONAL DEPENDENCY
28th Annual DoD Cost Analysis Symposium Leesburg, VA 22 September 1994
EXAMPLE WBS STRUCTUREFunctional Correlations
SE/PM
Hardware Total cost
DevEng

CORRELATION AND FUNCTIONAL DEPENDENCY
28th Annual DoD Cost Analysis Symposium Leesburg, VA 22 September 1994
DERIVATIVE CORRELATION
• The first 30 sets of points were tested for correlation between the derivative variables, SE/PM and DevEng. Results:
Correlation coefficient .484
t statistic 4.048
(Note: this is arithmetically equivalent to a regression
with r-squared of .234, and the same t statistic, but represents a different conceptual model.)

CORRELATION AND FUNCTIONAL DEPENDENCY
28th Annual DoD Cost Analysis Symposium Leesburg, VA 22 September 1994
EXAMPLE WBS STRUCTUREFunctional Correlations Plus Derivative Correlation
SE/PM
Hardware Total cost
DevEng

CORRELATION AND FUNCTIONAL DEPENDENCY
28th Annual DoD Cost Analysis Symposium Leesburg, VA 22 September 1994
EFFECT ON DISPERSION
• In the previous example, the standard deviation of the estimate increased:
With independence 10.457
With correlation 12.877
Percent change + 23%

CORRELATION AND FUNCTIONAL DEPENDENCY
28th Annual DoD Cost Analysis Symposium Leesburg, VA 22 September 1994
DIFFERENCES FROM OTHER APPROACHES
• The expressions for derivative variables are those of the cost estimate.
– A more simplistic approach, the way most models seem to operate, is to treat all variables as source variables, i.e., mutually independent.
• Correlation effects are correctly captured without the difficulties of explicit treatment.
• The values and distributions of derivative variables flow from the expressions.
– No extra effort is necessary to derive these.

CORRELATION AND FUNCTIONAL DEPENDENCY
28th Annual DoD Cost Analysis Symposium Leesburg, VA 22 September 1994
RISK SETUP (using TASC-STAR)
• Point estimates are multiplied by random variables drawn from triangular distributions.
• Both cost estimating risk and schedule/technical risk are applied.
– The former is based on the standard error of the estimate
– The latter is based on historical Selected Acquisition Reports (SARs)
• The adjusted value of each source variable is used as the basis for each derivative variable, which is then recomputed and multiplied by relevant risk factors.

CORRELATION AND FUNCTIONAL DEPENDENCY
28th Annual DoD Cost Analysis Symposium Leesburg, VA 22 September 1994
RISK RUN EXAMPLE
• The effect on an actual missile system risk estimate :
Independent CorrelatedCost w/o risk $1,181M $1,181M
Risk $66M $241M
Total $1,247M $1,422M

CORRELATION AND FUNCTIONAL DEPENDENCY
28th Annual DoD Cost Analysis Symposium Leesburg, VA 22 September 1994
EFFECT ON DISPERSION• In the previous example, the standard
deviation of the estimate increased:
Effect of Functional Correlation
0
5
10
15
20
25
30
35
40
45
50
0 500 1,000 1,500 2,000 2,500
LCC (FY88$M)
Fre
qu
en
cy
Independent Dependent
Dependent MeanIndependent Mean
Mean shifted by 14%
With independence $159M
With correlation $286M
Percent change + 80%

CORRELATION AND FUNCTIONAL DEPENDENCY
28th Annual DoD Cost Analysis Symposium Leesburg, VA 22 September 1994
CONCLUSIONS
• Setting up functional dependencies in risk and uncertainty models
– results in faithful replication of the functional correlation actually observed in the data, and
– produces derivative correlation among variables not actually observed jointly
• Derivative correlation arises as an inescapable result of the functional dependencies, and is a natural outcome.
• Many, if not all, of the problems of correlation are solved.
– To proceed farther requires data we do not yet have.

CORRELATION AND FUNCTIONAL DEPENDENCY
28th Annual DoD Cost Analysis Symposium Leesburg, VA 22 September 1994
FURTHER RESEARCH
• Collect a moderately large, “connected” set of data to observe and test actual correlations. Then,
– Test functional dependency results.
– Test alternative methods, and compare fidelity and difficulty.
CORRELATION AND FUNCTIONAL DEPENDENCY
28th Annual DoD Cost Analysis Symposium Leesburg, VA 22 September 1994
Backup

CORRELATION AND FUNCTIONAL DEPENDENCY
28th Annual DoD Cost Analysis Symposium Leesburg, VA 22 September 1994
NEGATIVE CORRELATION: AN EXAMPLE
• Suppose two manufacturers build bricks.– Their materials costs are similar.
– Labor costs are similar
– Overhead is similar.
• One company charges part of the time of their foremen to Quality Assurance (QA) that the other company charges to Test and Evaluation (T&E).
• The costs of QA and T&E will be negatively correlated.
• Dispersion will be:– Large in QA and T&E
– Small in total cost