Correlation analysis of EEG and EMG
10
Transcript of Correlation analysis of EEG and EMG
Correlation analysis of EEG and EMG
Giulia Cisotto, Ph.D.,Umberto Michieli, M.Sc. Student
Leonardo Badia, Prof. Ph.D.
Department of Information EngineeringUniversity of Padua, Padua (Italy)
Fourth Global Wireless Summit, Aarhus (Denmark) 201611/29/2016
Cisotto, Michieli, Badia, GWS'16 Correlation analysis of EEG and EMG 11/29/2016 1 / 10
Outline
1 Aim of the study
2 EEG and EMG signals
3 EEG-EMG processing
4 Preliminary results
5 Conclusions and future perspectives
Cisotto, Michieli, Badia, GWS'16 Correlation analysis of EEG and EMG 11/29/2016 2 / 10
Aim of the study
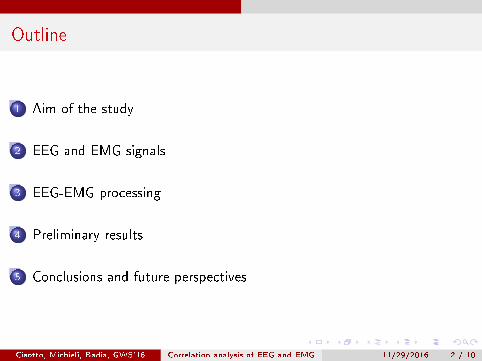
Rationale:
Voluntary movement is controlled by the brain that sends/receives precisesignals to/from muscles and nerves.
Research question:
What is the origin of involuntary movements, like bursts? Is that voluntarycontrol?
Healthy EMG, background activity. Pathological EMG with bursts.
Cisotto, Michieli, Badia, GWS'16 Correlation analysis of EEG and EMG 11/29/2016 3 / 10
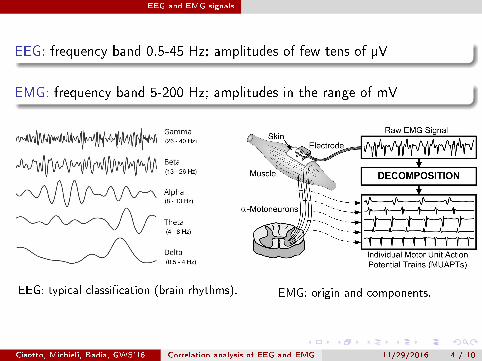
EEG and EMG signals
EEG: frequency band 0.5-45 Hz; amplitudes of few tens of µV
EMG: frequency band 5-200 Hz; amplitudes in the range of mV
EEG: typical classi�cation (brain rhythms). EMG: origin and components.
Cisotto, Michieli, Badia, GWS'16 Correlation analysis of EEG and EMG 11/29/2016 4 / 10
EEG and EMG signals
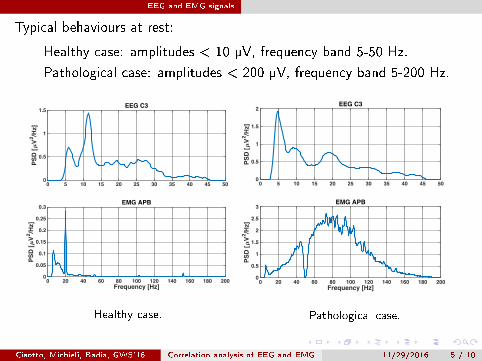
Typical behaviours at rest:
Healthy case: amplitudes < 10 µV, frequency band 5-50 Hz.
Pathological case: amplitudes < 200 µV, frequency band 5-200 Hz.
Healthy case. Pathological case.
Cisotto, Michieli, Badia, GWS'16 Correlation analysis of EEG and EMG 11/29/2016 5 / 10

EEG-EMG processing
Given x[n] and y[n] discrete signals, e.g. digitized EEG and EMG:
Cross-correlation coe�cient:
rmax =max(rxy [n])√
ExEy
where rxy [n] ,∑+∞
m=−∞ x∗[m]y [n +m] is the cross-correlationfunction between x[n] and y[n].
Delay: lag = argmax(rmax)
Coherence (absolute value):
Cohxy (f ) ,Pxy (f )√
|Px(f )| ·√|Py (f )|
where Px(f ) and Py (f ) are the power spectral density (PSD) of x [n]and y [n], respectively, and Pxy (f ) is the cross-PSD.
Cisotto, Michieli, Badia, GWS'16 Correlation analysis of EEG and EMG 11/29/2016 6 / 10
Preliminary results
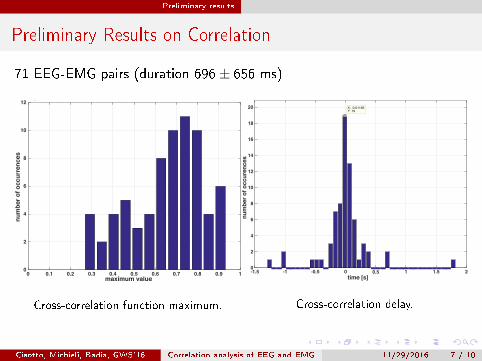
Preliminary Results on Correlation
71 EEG-EMG pairs (duration 696± 656 ms)
maximum value0 0.1 0.2 0.3 0.4 0.5 0.6 0.7 0.8 0.9 1
num
ber o
f occ
urre
nces
0
2
4
6
8
10
12Istogramma del modulo del massimo valore normalizzato della correlazione
Cross-correlation function maximum.
0.5 time [s]
-1.5 -1 -0.5 0 1 1.5 2
num
ber o
f occ
uren
ces
0
2
4
6
8
10
12
14
16
18
20 X: -0.01165Y: 19
Cross-correlation delay.
Cisotto, Michieli, Badia, GWS'16 Correlation analysis of EEG and EMG 11/29/2016 7 / 10
Preliminary results
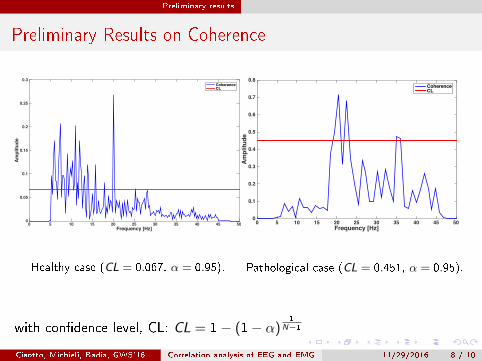
Preliminary Results on Coherence
Frequency [Hz]0 5 10 15 20 25 30 35 40 45 50
Am
plitu
de
0
0.05
0.1
0.15
0.2
0.25
0.3CoherenceCL
Healthy case (CL = 0.067, α = 0.95).
Frequency [Hz]0 5 10 15 20 25 30 35 40 45 50
Am
plitu
de
0
0.1
0.2
0.3
0.4
0.5
0.6
0.7
0.8CoherenceCL
Pathological case (CL = 0.451, α = 0.95).
with con�dence level, CL: CL = 1− (1− α)1
N−1
Cisotto, Michieli, Badia, GWS'16 Correlation analysis of EEG and EMG 11/29/2016 8 / 10
Conclusions and future perspectives
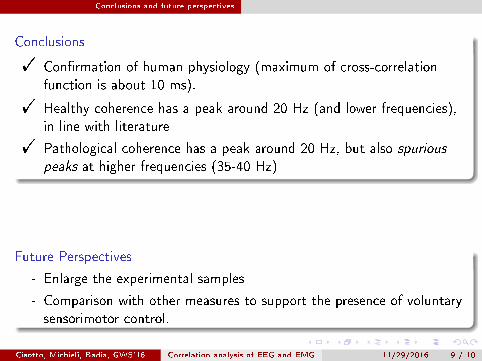
Conclusions
! Con�rmation of human physiology (maximum of cross-correlationfunction is about 10 ms).
! Healthy coherence has a peak around 20 Hz (and lower frequencies),in line with literature
! Pathological coherence has a peak around 20 Hz, but also spurious
peaks at higher frequencies (35-40 Hz)
Future Perspectives
- Enlarge the experimental samples
- Comparison with other measures to support the presence of voluntarysensorimotor control.
Cisotto, Michieli, Badia, GWS'16 Correlation analysis of EEG and EMG 11/29/2016 9 / 10
Acknoledgments
Acknoledgments
Umberto Michieli, M.Sc. Student (2017)
Leonardo Badia, Prof. Ph.D.
Cisotto, Michieli, Badia, GWS'16 Correlation analysis of EEG and EMG 11/29/2016 10 / 10