Correction - PNAS · Correction SUSTAINABILITY SCIENCE Correction for “Prairie strips improve...
7
Prairie strips improve biodiversity and the delivery of multiple ecosystem services from corn–soybean croplands Lisa A. Schulte a,1 , Jarad Niemi b , Matthew J. Helmers c , Matt Liebman d , J. Gordon Arbuckle e , David E. James f , Randall K. Kolka g , Matthew E. O’Neal h , Mark D. Tomer f , John C. Tyndall a , Heidi Asbjornsen i , Pauline Drobney j , Jeri Neal k , Gary Van Ryswyk l , and Chris Witte c a Department of Natural Resource Ecology and Management, Iowa State University, Ames, IA 50011; b Department of Statistics, Iowa State University, Ames, IA 50011; c Department of Agricultural and Biosystems Engineering, Iowa State University, Ames, IA 50011; d Department of Agronomy, Iowa State University, Ames, IA 50011; e Department of Sociology, Iowa State University, Ames, IA 50011; f National Laboratory for Agriculture and the Environment, US Department of Agriculture Agricultural Research Service, Ames, IA 50011; g Northern Research Station, US Department of Agriculture Forest Service, Grand Rapids, MN 55744; h Department of Entomology, Iowa State University, Ames, IA 50011; i Department of Natural Resources and the Environment, University of New Hampshire, Durham, NH 03824; j Neal Smith National Wildlife Refuge, US Fish and Wildlife Service, Prairie City, IA 50228; k Leopold Center for Sustainable Agriculture, Iowa State University, Ames, IA 50011; and l Van Ryswyk Farms, Mitchellville, IA 50169 Edited by David Tilman, University of Minnesota, St. Paul, MN, and approved August 1, 2017 (received for review December 9, 2016) Loss of biodiversity and degradation of ecosystem services from agricultural lands remain important challenges in the United States despite decades of spending on natural resource management. To date, conservation investment has emphasized engineering prac- tices or vegetative strategies centered on monocultural plantings of nonnative plants, largely excluding native species from cropland. In a catchment-scale experiment, we quantified the multiple effects of integrating strips of native prairie species amid corn and soybean crops, with prairie strips arranged to arrest run-off on slopes. Re- placing 10% of cropland with prairie strips increased biodiversity and ecosystem services with minimal impacts on crop production. Compared with catchments containing only crops, integrating prairie strips into cropland led to greater catchment-level insect taxa richness (2.6-fold), pollinator abundance (3.5-fold), native bird species richness (2.1-fold), and abundance of bird species of greatest conservation need (2.1-fold). Use of prairie strips also reduced total water runoff from catchments by 37%, resulting in retention of 20 times more soil and 4.3 times more phosphorus. Corn and soybean yields for catch- ments with prairie strips decreased only by the amount of the area taken out of crop production. Social survey results indicated demand among both farming and nonfarming populations for the environ- mental outcomes produced by prairie strips. If federal and state policies were aligned to promote prairie strips, the practice would be applicable to 3.9 million ha of cropland in Iowa alone. agriculture | agroecosystem services | perennials | US Corn Belt | sustainability T he global footprint of agriculture is expected to grow in coming decades with a rising human population and changing diets (1). Given linked, negative impacts of agriculture on other Earth processes, strategies for balancing agricultural production with conservation of biodiversity and protection of environ- mental quality are sorely needed (2). The US Midwest is one region where there is a salient need to balance production, conservation, and environmental-quality goals. Agroecosystems dominate the region (3) and are primarily composed of corn and soybean croplands, which cover 43% of the Midwestern Corn Belt and 69% of Iowa (4). While producing one-quarter of global corn and soybean supplies (5), these agroecosystems are also associated with loss of native habitat and contingent biodiversity (3, 6, 7), degradation of air, water, and soil quality (8–10), and declines in rural communities (11). Impacts are not restricted to the region: Loss of nutrients from corn and soybean agro- ecosystems in the Midwest is linked with persistent environ- mental and economic problems of national and global concern, including hypoxia in the Gulf of Mexico (12) and greenhouse-gas emissions (13, 14). National declines in biodiversity, as observed with declining populations of pollinators (15) and monarch but- terfly (Danaus plexippus), prompted a Presidential Memorandum and a national strategy centered on the Midwest to reverse losses and restore their populations (16). Strategically integrating perennial vegetation into land used for annual crop production is one strategy that could help balance agricultural production, conservation, and environmental-quality goals (17). Compared with their annual row-crop counterparts, perennial communities enhance hydrologic regulation, improve soil and water quality, foster carbon sequestration and storage, support populations of beneficial organisms for pest control and pollination, and generally foster biological functioning (17– 19). Perennial species can also moderate the impacts of climate change, which pose a major threat to sustaining high crop yields into the future (20). Perennial species typically established within a cropland context in the Midwestern United States, e.g., on field borders, terraces, and grass waterways, are monocultures of nonnative grasses, e.g., Bromus spp. and Festuca spp. Native Significance Prairie strips are a new conservation technology designed to alleviate biodiversity loss and environmental damage associ- ated with row-crop agriculture. Results from a multiyear, catchment-scale experiment comparing corn and soybean fields with and without prairie vegetation indicated prairie strips raised pollinator and bird abundance, decreased water runoff, and increased soil and nutrient retention. These bene- fits accrued at levels disproportionately greater than the land area occupied by prairie strips. Social surveys revealed demand among both farm and nonfarm populations for the outcomes prairie strips produced. We estimated prairie strips could be used to improve biodiversity and ecosystem services across 3.9 million ha of cropland in Iowa and a large portion of the 69 million ha under similar management in the United States. Author contributions: L.A.S., M.J.H., M.L., J.G.A., R.K.K., M.E.O., M.D.T., J.C.T., H.A., P.D., and J.N. designed research; L.A.S., M.J.H., M.L., J.G.A., D.E.J., R.K.K., M.E.O., M.D.T., J.C.T., G.V.R., and C.W. performed research; L.A.S., J.N., J.G.A., D.E.J., and J.C.T. analyzed data; and L.A.S., J.N., M.J.H., and M.L. wrote the paper. The authors declare no conflict of interest. This article is a PNAS Direct Submission. Freely available online through the PNAS open access option. Data deposition: The data reported in this paper have been deposited in the ISU-STRIPS repository, https://github.com/ISU-STRIPS/STRIPS/releases/tag/v0.2. 1 To whom correspondence should be addressed. Email: [email protected]. This article contains supporting information online at www.pnas.org/lookup/suppl/doi:10. 1073/pnas.1620229114/-/DCSupplemental. www.pnas.org/cgi/doi/10.1073/pnas.1620229114 PNAS Early Edition | 1 of 6 SUSTAINABILITY SCIENCE Downloaded by guest on March 18, 2020 Downloaded by guest on March 18, 2020 Downloaded by guest on March 18, 2020
Transcript of Correction - PNAS · Correction SUSTAINABILITY SCIENCE Correction for “Prairie strips improve...
Prairie strips improve biodiversity and thedelivery of multiple ecosystem services fromcorn–soybean croplandsLisa A. Schultea,1, Jarad Niemib, Matthew J. Helmersc, Matt Liebmand, J. Gordon Arbucklee, David E. Jamesf,Randall K. Kolkag, Matthew E. O’Nealh, Mark D. Tomerf, John C. Tyndalla, Heidi Asbjornseni, Pauline Drobneyj,Jeri Nealk, Gary Van Ryswykl, and Chris Wittec
aDepartment of Natural Resource Ecology and Management, Iowa State University, Ames, IA 50011; bDepartment of Statistics, Iowa State University, Ames,IA 50011; cDepartment of Agricultural and Biosystems Engineering, Iowa State University, Ames, IA 50011; dDepartment of Agronomy, Iowa StateUniversity, Ames, IA 50011; eDepartment of Sociology, Iowa State University, Ames, IA 50011; fNational Laboratory for Agriculture and the Environment, USDepartment of Agriculture Agricultural Research Service, Ames, IA 50011; gNorthern Research Station, US Department of Agriculture Forest Service, GrandRapids, MN 55744; hDepartment of Entomology, Iowa State University, Ames, IA 50011; iDepartment of Natural Resources and the Environment, Universityof New Hampshire, Durham, NH 03824; jNeal Smith National Wildlife Refuge, US Fish and Wildlife Service, Prairie City, IA 50228; kLeopold Center forSustainable Agriculture, Iowa State University, Ames, IA 50011; and lVan Ryswyk Farms, Mitchellville, IA 50169
Edited by David Tilman, University of Minnesota, St. Paul, MN, and approved August 1, 2017 (received for review December 9, 2016)
Loss of biodiversity and degradation of ecosystem services fromagricultural lands remain important challenges in the United Statesdespite decades of spending on natural resource management. Todate, conservation investment has emphasized engineering prac-tices or vegetative strategies centered on monocultural plantings ofnonnative plants, largely excluding native species from cropland. Ina catchment-scale experiment, we quantified the multiple effects ofintegrating strips of native prairie species amid corn and soybeancrops, with prairie strips arranged to arrest run-off on slopes. Re-placing 10% of cropland with prairie strips increased biodiversityand ecosystem services with minimal impacts on crop production.Compared with catchments containing only crops, integrating prairiestrips into cropland led to greater catchment-level insect taxa richness(2.6-fold), pollinator abundance (3.5-fold), native bird species richness(2.1-fold), and abundance of bird species of greatest conservationneed (2.1-fold). Use of prairie strips also reduced total water runofffrom catchments by 37%, resulting in retention of 20 times more soiland 4.3 times more phosphorus. Corn and soybean yields for catch-ments with prairie strips decreased only by the amount of the areataken out of crop production. Social survey results indicated demandamong both farming and nonfarming populations for the environ-mental outcomes produced by prairie strips. If federal and state policieswere aligned to promote prairie strips, the practicewould be applicableto 3.9 million ha of cropland in Iowa alone.
agriculture | agroecosystem services | perennials | US Corn Belt |sustainability
The global footprint of agriculture is expected to grow incoming decades with a rising human population and changing
diets (1). Given linked, negative impacts of agriculture on otherEarth processes, strategies for balancing agricultural productionwith conservation of biodiversity and protection of environ-mental quality are sorely needed (2). The US Midwest is oneregion where there is a salient need to balance production,conservation, and environmental-quality goals. Agroecosystemsdominate the region (3) and are primarily composed of corn andsoybean croplands, which cover 43% of the Midwestern CornBelt and 69% of Iowa (4). While producing one-quarter of globalcorn and soybean supplies (5), these agroecosystems are alsoassociated with loss of native habitat and contingent biodiversity(3, 6, 7), degradation of air, water, and soil quality (8–10), anddeclines in rural communities (11). Impacts are not restricted tothe region: Loss of nutrients from corn and soybean agro-ecosystems in the Midwest is linked with persistent environ-mental and economic problems of national and global concern,including hypoxia in the Gulf of Mexico (12) and greenhouse-gas
emissions (13, 14). National declines in biodiversity, as observedwith declining populations of pollinators (15) and monarch but-terfly (Danaus plexippus), prompted a Presidential Memorandumand a national strategy centered on the Midwest to reverse lossesand restore their populations (16).Strategically integrating perennial vegetation into land used
for annual crop production is one strategy that could help balanceagricultural production, conservation, and environmental-qualitygoals (17). Compared with their annual row-crop counterparts,perennial communities enhance hydrologic regulation, improvesoil and water quality, foster carbon sequestration and storage,support populations of beneficial organisms for pest controland pollination, and generally foster biological functioning (17–19). Perennial species can also moderate the impacts of climatechange, which pose a major threat to sustaining high crop yieldsinto the future (20). Perennial species typically established withina cropland context in the Midwestern United States, e.g., onfield borders, terraces, and grass waterways, are monoculturesof nonnative grasses, e.g., Bromus spp. and Festuca spp. Native
Significance
Prairie strips are a new conservation technology designed toalleviate biodiversity loss and environmental damage associ-ated with row-crop agriculture. Results from a multiyear,catchment-scale experiment comparing corn and soybeanfields with and without prairie vegetation indicated prairiestrips raised pollinator and bird abundance, decreased waterrunoff, and increased soil and nutrient retention. These bene-fits accrued at levels disproportionately greater than the landarea occupied by prairie strips. Social surveys revealed demandamong both farm and nonfarm populations for the outcomesprairie strips produced. We estimated prairie strips could beused to improve biodiversity and ecosystem services across3.9 million ha of cropland in Iowa and a large portion of the69 million ha under similar management in the United States.
Author contributions: L.A.S., M.J.H., M.L., J.G.A., R.K.K., M.E.O., M.D.T., J.C.T., H.A., P.D.,and J.N. designed research; L.A.S., M.J.H., M.L., J.G.A., D.E.J., R.K.K., M.E.O., M.D.T., J.C.T.,G.V.R., and C.W. performed research; L.A.S., J.N., J.G.A., D.E.J., and J.C.T. analyzed data;and L.A.S., J.N., M.J.H., and M.L. wrote the paper.
The authors declare no conflict of interest.
This article is a PNAS Direct Submission.
Freely available online through the PNAS open access option.
Data deposition: The data reported in this paper have been deposited in the ISU-STRIPSrepository, https://github.com/ISU-STRIPS/STRIPS/releases/tag/v0.2.1To whom correspondence should be addressed. Email: [email protected].
This article contains supporting information online at www.pnas.org/lookup/suppl/doi:10.1073/pnas.1620229114/-/DCSupplemental.
www.pnas.org/cgi/doi/10.1073/pnas.1620229114 PNAS Early Edition | 1 of 6
SUST
AINABILITY
SCIENCE
Dow
nloa
ded
by g
uest
on
Mar
ch 1
8, 2
020
Dow
nloa
ded
by g
uest
on
Mar
ch 1
8, 2
020
Dow
nloa
ded
by g
uest
on
Mar
ch 1
8, 2
020
perennial plants are not commonly used, but such communitieshave the potential to offer even greater function, resilience, andstability because of ecological traits that are well adapted to re-gional climate and soil conditions (21). They also provide habitatfor a broad suite of native taxa.To quantify the effects of integrating strips of native perennial
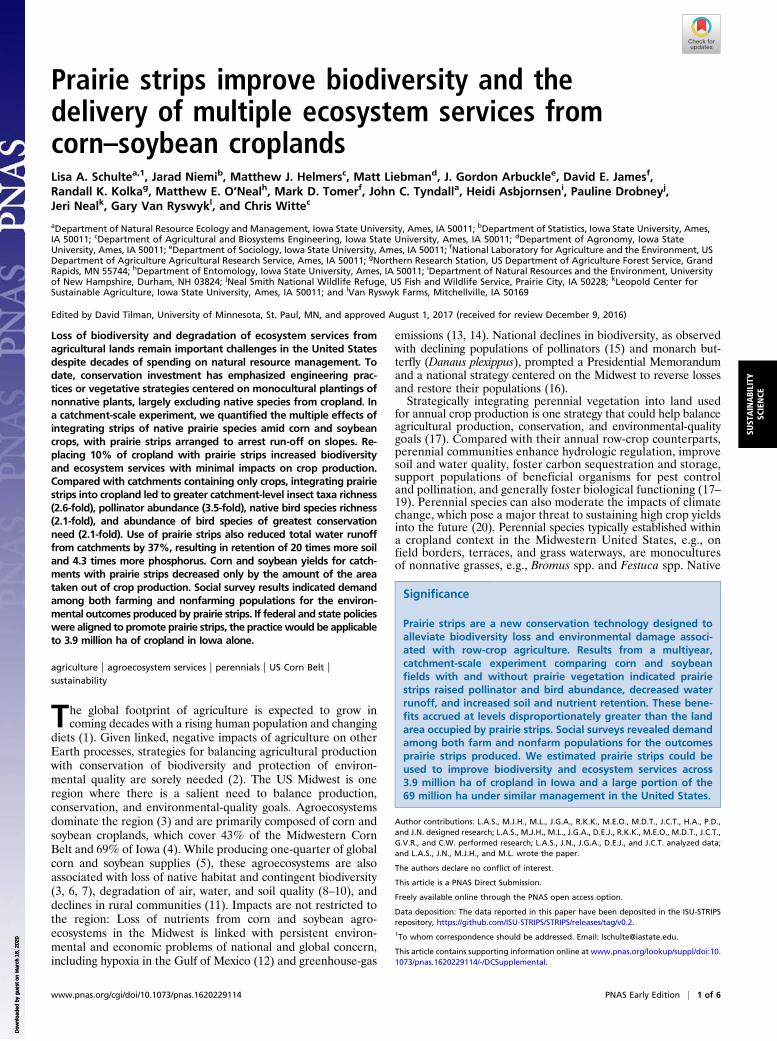
vegetation on the biodiversity and ecosystem services within row-crop agricultural fields, in 2007 we established a catchment-scaleexperiment in central Iowa termed “STRIPS” (Science-based Trialsof Row-crops Integrated with Prairie Strips). We chose to recon-struct and evaluate prairie vegetation because it was the historicallydominant plant community in the Midwestern United States beforeEuro-American settlement in the mid-1800s. We sowed prairieplant species in strips along hillside contours and in footslope areaswithin nine agricultural catchments while using three catchmentssolely for crop production. Catchments were 0.47–3.19 ha in size(Fig. 1 and Fig. S1). Cropped areas were planted in soybean (Glycinemax) and corn (Zea mays) in alternate years using continuous no-tillmanagement and conventional agrichemicals. Treatments were se-lected to test whether prairie strips could deliver increases in benefitsat levels disproportionately greater than the area of the catchmentsthey occupied, compared with a 100% row crop control (17); e.g., weexpected prairie strips comprising 10% of an agricultural catch-ment would result in greater than 10% increases in biodiversity andecosystem services.In previous disciplinary papers we established that prairie
strips in row cropland provided habitat for native biodiversity(22–24), improved soil quality (25), fostered desirable patterns ofbiogeochemical functioning and hydrological regulation (26–29),and offered a low-cost agricultural conservation option for farmersand farmland owners relative to alternative best-management prac-tices (30). Here, we sought to use a holistic, integrative approach toassess the effects of prairie strips relative to the proportion of thecatchments they occupied. We used a consistent, comprehensivestatistical treatment of multidimensional data derived from theSTRIPS experiment that included agronomic, biological, and hy-drological measures within the same analysis and allowed an explicitconsideration of tradeoffs among various performance indicators.Next, we evaluated the attitudes of Iowa farm and nonfarm resi-dents with regard to environmental, socioeconomic, and agronomicconditions that could be affected by integrating prairie strips intocropland. Finally, we used spatial data and models to determine theextent to which prairie strips might be used more broadly in Iowa toaddress conservation and environmental-quality concerns.
ResultsSTRIPS Experiment. Tradeoffs among agronomic and financialfactors with environmental measures were prominent for the100% cropland treatment, which formed the baseline for theexperiment. Mean annual corn grain yield was 8.9 Mg/ha,ranging between 7.3 Mg/ha in 2014 and 11.0 Mg/ha in 2008;soybean yield averaged 3.6 Mg/ha, ranging between 2.1 Mg/ha in2013 and 4.3 Mg/ha in 2009. These yields were similar to aver-ages within Iowa (Table S1) and were associated with averagenet revenues (returns to land and labor resources) of $482/ha for
corn and $603/ha for soybean in 2016 US dollars (2016 USD).Yields were achieved with concomitant average annual losses of13 Mg/ha of soil, 41 kg/ha of nitrogen, and 11 kg/ha of phosphoruswith 170 mm of water runoff.We found many significant differences between prairie and
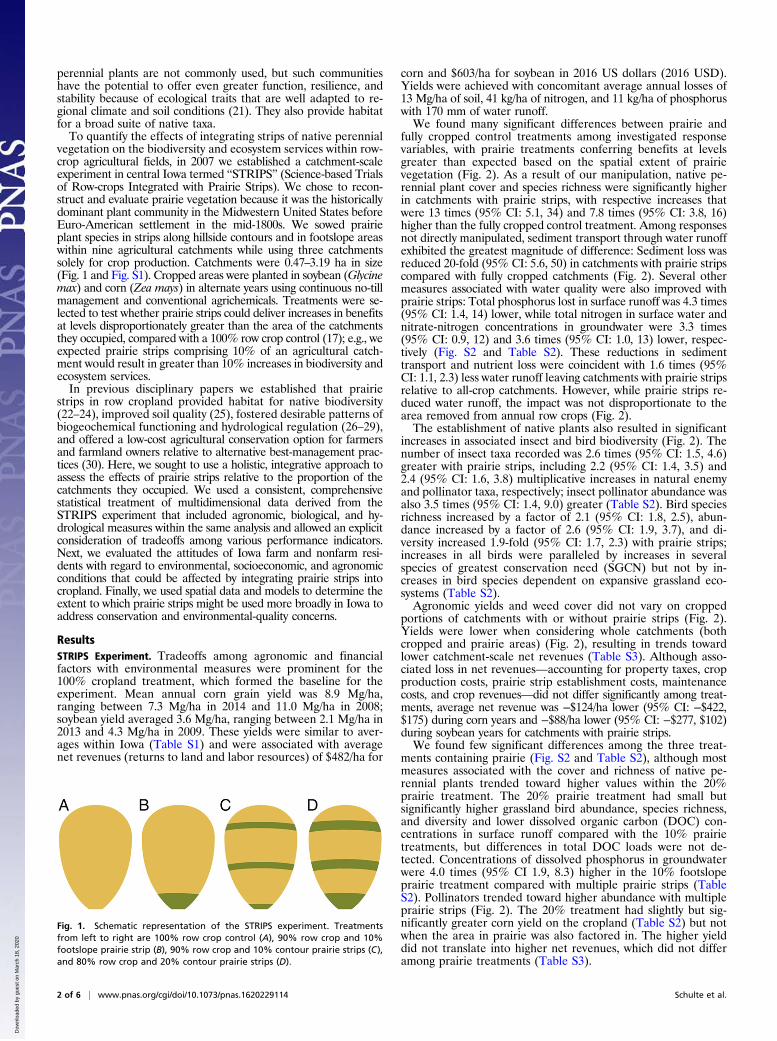
fully cropped control treatments among investigated responsevariables, with prairie treatments conferring benefits at levelsgreater than expected based on the spatial extent of prairievegetation (Fig. 2). As a result of our manipulation, native pe-rennial plant cover and species richness were significantly higherin catchments with prairie strips, with respective increases thatwere 13 times (95% CI: 5.1, 34) and 7.8 times (95% CI: 3.8, 16)higher than the fully cropped control treatment. Among responsesnot directly manipulated, sediment transport through water runoffexhibited the greatest magnitude of difference: Sediment loss wasreduced 20-fold (95% CI: 5.6, 50) in catchments with prairie stripscompared with fully cropped catchments (Fig. 2). Several othermeasures associated with water quality were also improved withprairie strips: Total phosphorus lost in surface runoff was 4.3 times(95% CI: 1.4, 14) lower, while total nitrogen in surface water andnitrate-nitrogen concentrations in groundwater were 3.3 times(95% CI: 0.9, 12) and 3.6 times (95% CI: 1.0, 13) lower, respec-tively (Fig. S2 and Table S2). These reductions in sedimenttransport and nutrient loss were coincident with 1.6 times (95%CI: 1.1, 2.3) less water runoff leaving catchments with prairie stripsrelative to all-crop catchments. However, while prairie strips re-duced water runoff, the impact was not disproportionate to thearea removed from annual row crops (Fig. 2).The establishment of native plants also resulted in significant
increases in associated insect and bird biodiversity (Fig. 2). Thenumber of insect taxa recorded was 2.6 times (95% CI: 1.5, 4.6)greater with prairie strips, including 2.2 (95% CI: 1.4, 3.5) and2.4 (95% CI: 1.6, 3.8) multiplicative increases in natural enemyand pollinator taxa, respectively; insect pollinator abundance wasalso 3.5 times (95% CI: 1.4, 9.0) greater (Table S2). Bird speciesrichness increased by a factor of 2.1 (95% CI: 1.8, 2.5), abun-dance increased by a factor of 2.6 (95% CI: 1.9, 3.7), and di-versity increased 1.9-fold (95% CI: 1.7, 2.3) with prairie strips;increases in all birds were paralleled by increases in severalspecies of greatest conservation need (SGCN) but not by in-creases in bird species dependent on expansive grassland eco-systems (Table S2).Agronomic yields and weed cover did not vary on cropped
portions of catchments with or without prairie strips (Fig. 2).Yields were lower when considering whole catchments (bothcropped and prairie areas) (Fig. 2), resulting in trends towardlower catchment-scale net revenues (Table S3). Although asso-ciated loss in net revenues—accounting for property taxes, cropproduction costs, prairie strip establishment costs, maintenancecosts, and crop revenues—did not differ significantly among treat-ments, average net revenue was −$124/ha lower (95% CI: −$422,$175) during corn years and −$88/ha lower (95% CI: −$277, $102)during soybean years for catchments with prairie strips.We found few significant differences among the three treat-
ments containing prairie (Fig. S2 and Table S2), although mostmeasures associated with the cover and richness of native pe-rennial plants trended toward higher values within the 20%prairie treatment. The 20% prairie treatment had small butsignificantly higher grassland bird abundance, species richness,and diversity and lower dissolved organic carbon (DOC) con-centrations in surface runoff compared with the 10% prairietreatments, but differences in total DOC loads were not de-tected. Concentrations of dissolved phosphorus in groundwaterwere 4.0 times (95% CI 1.9, 8.3) higher in the 10% footslopeprairie treatment compared with multiple prairie strips (TableS2). Pollinators trended toward higher abundance with multipleprairie strips (Fig. 2). The 20% treatment had slightly but sig-nificantly greater corn yield on the cropland (Table S2) but notwhen the area in prairie was also factored in. The higher yielddid not translate into higher net revenues, which did not differamong prairie treatments (Table S3).
Fig. 1. Schematic representation of the STRIPS experiment. Treatmentsfrom left to right are 100% row crop control (A), 90% row crop and 10%footslope prairie strip (B), 90% row crop and 10% contour prairie strips (C),and 80% row crop and 20% contour prairie strips (D).
2 of 6 | www.pnas.org/cgi/doi/10.1073/pnas.1620229114 Schulte et al.
Dow
nloa
ded
by g
uest
on
Mar
ch 1
8, 2
020
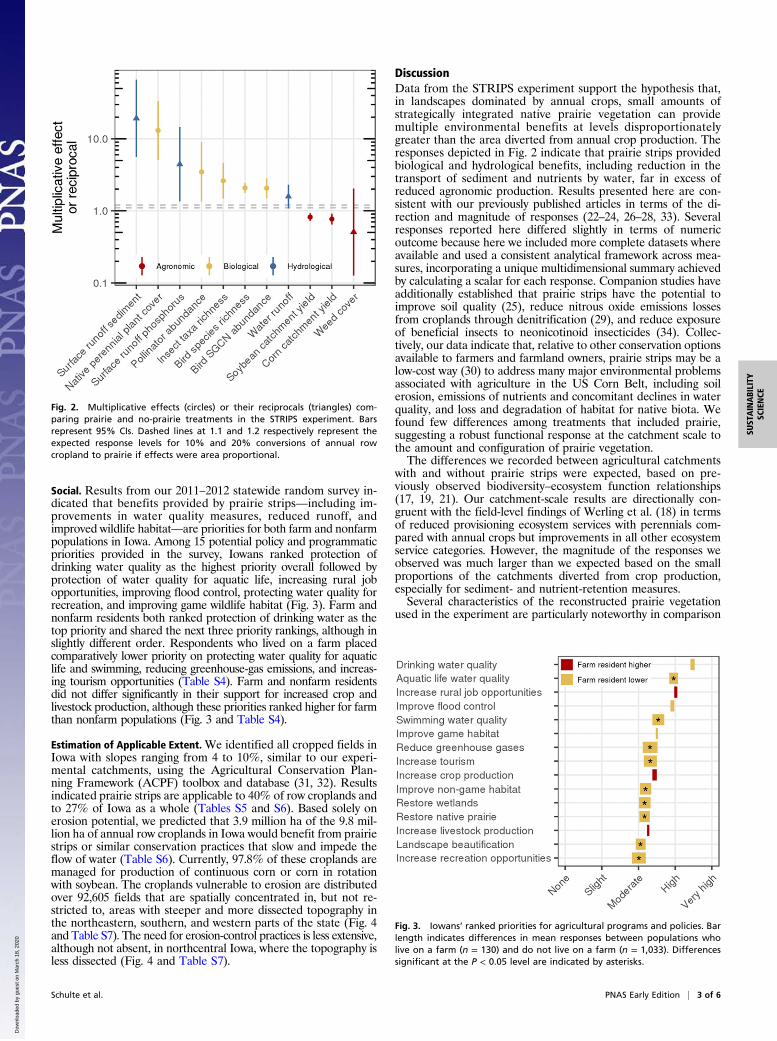
Social. Results from our 2011–2012 statewide random survey in-dicated that benefits provided by prairie strips—including im-provements in water quality measures, reduced runoff, andimproved wildlife habitat—are priorities for both farm and nonfarmpopulations in Iowa. Among 15 potential policy and programmaticpriorities provided in the survey, Iowans ranked protection ofdrinking water quality as the highest priority overall followed byprotection of water quality for aquatic life, increasing rural jobopportunities, improving flood control, protecting water quality forrecreation, and improving game wildlife habitat (Fig. 3). Farm andnonfarm residents both ranked protection of drinking water as thetop priority and shared the next three priority rankings, although inslightly different order. Respondents who lived on a farm placedcomparatively lower priority on protecting water quality for aquaticlife and swimming, reducing greenhouse-gas emissions, and increas-ing tourism opportunities (Table S4). Farm and nonfarm residentsdid not differ significantly in their support for increased crop andlivestock production, although these priorities ranked higher for farmthan nonfarm populations (Fig. 3 and Table S4).
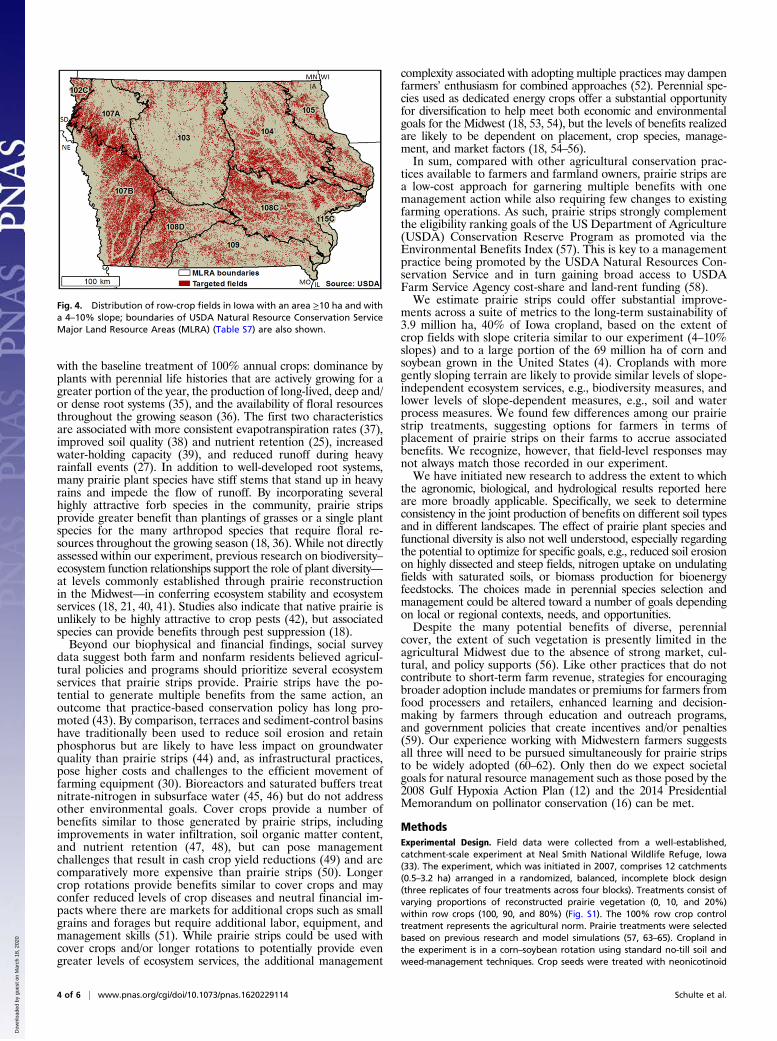
Estimation of Applicable Extent.We identified all cropped fields inIowa with slopes ranging from 4 to 10%, similar to our experi-mental catchments, using the Agricultural Conservation Plan-ning Framework (ACPF) toolbox and database (31, 32). Resultsindicated prairie strips are applicable to 40% of row croplands andto 27% of Iowa as a whole (Tables S5 and S6). Based solely onerosion potential, we predicted that 3.9 million ha of the 9.8 mil-lion ha of annual row croplands in Iowa would benefit from prairiestrips or similar conservation practices that slow and impede theflow of water (Table S6). Currently, 97.8% of these croplands aremanaged for production of continuous corn or corn in rotationwith soybean. The croplands vulnerable to erosion are distributedover 92,605 fields that are spatially concentrated in, but not re-stricted to, areas with steeper and more dissected topography inthe northeastern, southern, and western parts of the state (Fig. 4and Table S7). The need for erosion-control practices is less extensive,although not absent, in northcentral Iowa, where the topography isless dissected (Fig. 4 and Table S7).
DiscussionData from the STRIPS experiment support the hypothesis that,in landscapes dominated by annual crops, small amounts ofstrategically integrated native prairie vegetation can providemultiple environmental benefits at levels disproportionatelygreater than the area diverted from annual crop production. Theresponses depicted in Fig. 2 indicate that prairie strips providedbiological and hydrological benefits, including reduction in thetransport of sediment and nutrients by water, far in excess ofreduced agronomic production. Results presented here are con-sistent with our previously published articles in terms of the di-rection and magnitude of responses (22–24, 26–28, 33). Severalresponses reported here differed slightly in terms of numericoutcome because here we included more complete datasets whereavailable and used a consistent analytical framework across mea-sures, incorporating a unique multidimensional summary achievedby calculating a scalar for each response. Companion studies haveadditionally established that prairie strips have the potential toimprove soil quality (25), reduce nitrous oxide emissions lossesfrom croplands through denitrification (29), and reduce exposureof beneficial insects to neonicotinoid insecticides (34). Collec-tively, our data indicate that, relative to other conservation optionsavailable to farmers and farmland owners, prairie strips may be alow-cost way (30) to address many major environmental problemsassociated with agriculture in the US Corn Belt, including soilerosion, emissions of nutrients and concomitant declines in waterquality, and loss and degradation of habitat for native biota. Wefound few differences among treatments that included prairie,suggesting a robust functional response at the catchment scale tothe amount and configuration of prairie vegetation.The differences we recorded between agricultural catchments
with and without prairie strips were expected, based on pre-viously observed biodiversity–ecosystem function relationships(17, 19, 21). Our catchment-scale results are directionally con-gruent with the field-level findings of Werling et al. (18) in termsof reduced provisioning ecosystem services with perennials com-pared with annual crops but improvements in all other ecosystemservice categories. However, the magnitude of the responses weobserved was much larger than we expected based on the smallproportions of the catchments diverted from crop production,especially for sediment- and nutrient-retention measures.Several characteristics of the reconstructed prairie vegetation
used in the experiment are particularly noteworthy in comparison
Fig. 3. Iowans’ ranked priorities for agricultural programs and policies. Barlength indicates differences in mean responses between populations wholive on a farm (n = 130) and do not live on a farm (n = 1,033). Differencessignificant at the P < 0.05 level are indicated by asterisks.
Fig. 2. Multiplicative effects (circles) or their reciprocals (triangles) com-paring prairie and no-prairie treatments in the STRIPS experiment. Barsrepresent 95% CIs. Dashed lines at 1.1 and 1.2 respectively represent theexpected response levels for 10% and 20% conversions of annual rowcropland to prairie if effects were area proportional.
Schulte et al. PNAS Early Edition | 3 of 6
SUST
AINABILITY
SCIENCE
Dow
nloa
ded
by g
uest
on
Mar
ch 1
8, 2
020
with the baseline treatment of 100% annual crops: dominance byplants with perennial life histories that are actively growing for agreater portion of the year, the production of long-lived, deep and/or dense root systems (35), and the availability of floral resourcesthroughout the growing season (36). The first two characteristicsare associated with more consistent evapotranspiration rates (37),improved soil quality (38) and nutrient retention (25), increasedwater-holding capacity (39), and reduced runoff during heavyrainfall events (27). In addition to well-developed root systems,many prairie plant species have stiff stems that stand up in heavyrains and impede the flow of runoff. By incorporating severalhighly attractive forb species in the community, prairie stripsprovide greater benefit than plantings of grasses or a single plantspecies for the many arthropod species that require floral re-sources throughout the growing season (18, 36). While not directlyassessed within our experiment, previous research on biodiversity–ecosystem function relationships support the role of plant diversity—at levels commonly established through prairie reconstructionin the Midwest—in conferring ecosystem stability and ecosystemservices (18, 21, 40, 41). Studies also indicate that native prairie isunlikely to be highly attractive to crop pests (42), but associatedspecies can provide benefits through pest suppression (18).Beyond our biophysical and financial findings, social survey
data suggest both farm and nonfarm residents believed agricul-tural policies and programs should prioritize several ecosystemservices that prairie strips provide. Prairie strips have the po-tential to generate multiple benefits from the same action, anoutcome that practice-based conservation policy has long pro-moted (43). By comparison, terraces and sediment-control basinshave traditionally been used to reduce soil erosion and retainphosphorus but are likely to have less impact on groundwaterquality than prairie strips (44) and, as infrastructural practices,pose higher costs and challenges to the efficient movement offarming equipment (30). Bioreactors and saturated buffers treatnitrate-nitrogen in subsurface water (45, 46) but do not addressother environmental goals. Cover crops provide a number ofbenefits similar to those generated by prairie strips, includingimprovements in water infiltration, soil organic matter content,and nutrient retention (47, 48), but can pose managementchallenges that result in cash crop yield reductions (49) and arecomparatively more expensive than prairie strips (50). Longercrop rotations provide benefits similar to cover crops and mayconfer reduced levels of crop diseases and neutral financial im-pacts where there are markets for additional crops such as smallgrains and forages but require additional labor, equipment, andmanagement skills (51). While prairie strips could be used withcover crops and/or longer rotations to potentially provide evengreater levels of ecosystem services, the additional management
complexity associated with adopting multiple practices may dampenfarmers’ enthusiasm for combined approaches (52). Perennial spe-cies used as dedicated energy crops offer a substantial opportunityfor diversification to help meet both economic and environmentalgoals for the Midwest (18, 53, 54), but the levels of benefits realizedare likely to be dependent on placement, crop species, manage-ment, and market factors (18, 54–56).In sum, compared with other agricultural conservation prac-
tices available to farmers and farmland owners, prairie strips area low-cost approach for garnering multiple benefits with onemanagement action while also requiring few changes to existingfarming operations. As such, prairie strips strongly complementthe eligibility ranking goals of the US Department of Agriculture(USDA) Conservation Reserve Program as promoted via theEnvironmental Benefits Index (57). This is key to a managementpractice being promoted by the USDA Natural Resources Con-servation Service and in turn gaining broad access to USDAFarm Service Agency cost-share and land-rent funding (58).We estimate prairie strips could offer substantial improve-
ments across a suite of metrics to the long-term sustainability of3.9 million ha, 40% of Iowa cropland, based on the extent ofcrop fields with slope criteria similar to our experiment (4–10%slopes) and to a large portion of the 69 million ha of corn andsoybean grown in the United States (4). Croplands with moregently sloping terrain are likely to provide similar levels of slope-independent ecosystem services, e.g., biodiversity measures, andlower levels of slope-dependent measures, e.g., soil and waterprocess measures. We found few differences among our prairiestrip treatments, suggesting options for farmers in terms ofplacement of prairie strips on their farms to accrue associatedbenefits. We recognize, however, that field-level responses maynot always match those recorded in our experiment.We have initiated new research to address the extent to which
the agronomic, biological, and hydrological results reported hereare more broadly applicable. Specifically, we seek to determineconsistency in the joint production of benefits on different soil typesand in different landscapes. The effect of prairie plant species andfunctional diversity is also not well understood, especially regardingthe potential to optimize for specific goals, e.g., reduced soil erosionon highly dissected and steep fields, nitrogen uptake on undulatingfields with saturated soils, or biomass production for bioenergyfeedstocks. The choices made in perennial species selection andmanagement could be altered toward a number of goals dependingon local or regional contexts, needs, and opportunities.Despite the many potential benefits of diverse, perennial
cover, the extent of such vegetation is presently limited in theagricultural Midwest due to the absence of strong market, cul-tural, and policy supports (56). Like other practices that do notcontribute to short-term farm revenue, strategies for encouragingbroader adoption include mandates or premiums for farmers fromfood processers and retailers, enhanced learning and decision-making by farmers through education and outreach programs,and government policies that create incentives and/or penalties(59). Our experience working with Midwestern farmers suggestsall three will need to be pursued simultaneously for prairie stripsto be widely adopted (60–62). Only then do we expect societalgoals for natural resource management such as those posed by the2008 Gulf Hypoxia Action Plan (12) and the 2014 PresidentialMemorandum on pollinator conservation (16) can be met.
MethodsExperimental Design. Field data were collected from a well-established,catchment-scale experiment at Neal Smith National Wildlife Refuge, Iowa(33). The experiment, which was initiated in 2007, comprises 12 catchments(0.5–3.2 ha) arranged in a randomized, balanced, incomplete block design(three replicates of four treatments across four blocks). Treatments consist ofvarying proportions of reconstructed prairie vegetation (0, 10, and 20%)within row crops (100, 90, and 80%) (Fig. S1). The 100% row crop controltreatment represents the agricultural norm. Prairie treatments were selectedbased on previous research and model simulations (57, 63–65). Cropland inthe experiment is in a corn–soybean rotation using standard no-till soil andweed-management techniques. Crop seeds were treated with neonicotinoid
Fig. 4. Distribution of row-crop fields in Iowa with an area ≥10 ha and witha 4–10% slope; boundaries of USDA Natural Resource Conservation ServiceMajor Land Resource Areas (MLRA) (Table S7) are also shown.
4 of 6 | www.pnas.org/cgi/doi/10.1073/pnas.1620229114 Schulte et al.
Dow
nloa
ded
by g
uest
on
Mar
ch 1
8, 2
020
insecticides until banned by the US Fish and Wildlife Service in 2013. Cornhybrids and soybean varieties were glyphosate resistant; glyphosate was ap-plied at planting and near the middle of June of each year for weed control.Fertilizers were applied to crops based on soil test levels. Nitrogen was appliedas anhydrous ammonia (NH3) in the spring before corn planting and was in-jected with standard equipment. Prairie strips were sown on 6 July 2007 with amixture of 32 native grass and forb species; an additional forb species wassown in spring 2008 (22). Prairie strips had a minimum width of 4 m; theminimum distance between strips was 36m, which accommodated agriculturaloperations using standard farming equipment. We collected data on agro-nomic, biological, hydrological, and financial responses for each catchment.
Agronomic Data. Corn (2008, 2010, 2012, 2014) and soybean (2009, 2011, 2013,2015) yields were measured by a Case IH AFS Pro-600 combine-mounted yieldmonitor every 3 s or ∼2.2 m during crop harvest, resulting in a fine-scalespatially referenced dataset of crop yields across the study area. Estimates ofwet and dry yields were reported by mass and volume along with sampletime, geographic coordinates, estimated moisture content, and flow rate.Data were clipped to experimental catchment boundaries, determined tosubmeter accuracy using real-time kinematics (RTK) GPS technology usingArcGIS (66). We calculated average crop yield for each catchment based ondata points lying within catchment boundaries. Yield data were expressed inunits of megagrams per hectare at standard agronomic moisture concen-trations for corn and soybean grain. For catchments with prairie, we mul-tiplied the cropland mean yield by cropland proportion to obtain a meanyield for the catchment. Weed cover in cropped portions of all 12 catch-ments was surveyed annually during 2009–2011 (22).
Biological Data. The percent plant cover by species was collected annually in2008–2011 in each of the nine catchments containing prairie strips; surveyswere conducted in July–August to capture peak flowering period (22). In-sects were collected using monthly sweep net samples during May–Sep-tember in 2009 in both soybean and prairie habitat, during May–Septemberin 2010 in prairie habitat, and during June–September in 2011 in both soy-bean and prairie habitat (23, 67). During 2010, insect samples were collectedmonthly during June–August by suctioning from corn foliage using a mod-ified leaf blower (36, 67). All insect samples were stored at −20 °C untilidentification to at least family and, when possible, to species. Plant andinsect data were transformed to represent catchment responses byweighting according to the land cover proportion associated with thetreatment; e.g., for a 10% prairie treatment, counts recorded in the croppedand prairie areas were respectively multiplied by 0.9 and 0.1. Native birdsurveys were conducted annually in 2008–2012 (24); approval was obtainedthrough Iowa State University (ISU) Institutional Animal Care and UseCommittee (IACUC log no. 4-10-6935-Q). Bird species were grouped foranalysis by grassland habitat requirements (68) and SGCN (69).
Hydrological Data. Each experimental catchment had a distinct surface flowoutlet point where an H-flume was installed in 2005 to monitor surface waterrunoff volume and chemistry. Each of these locations was sampled with anautomated water sampler to obtain flow measurements and discrete watersamples based on flow intervals (28). Water samples were collected duringthe 2008–2013 growing seasons to determine nitrate-nitrogen (NO3-N), totalnitrogen, and total phosphorus loads. Groundwater samples were extractedmonthly during the growing season from shallow wells installed at upslopeand footslope positions. Samples were analyzed for NO3-N (33) and ortho-phosphate (PO4-P) (70) through 2014.
Financial Data. We used a farm-level financial model to assess annual es-tablishment, management, and opportunity costs associated with cropproduction and prairie strips for 2008–2015. Data used to compute catch-ment revenue (2016 USD/ha) included crop-yield data from the experiment,estimated crop management rates and operational costs for owned landincluding property taxes using ISU’s AgDecisionMaker (Table S1) (71), and thecost of seeding and managing prairie strips (30). All costs were monetized over
a 15-y horizon, an analytical time frame that corresponds to a maximum, one-time USDA Conservation Reserve Program contract length (72).
Social Data. We conducted a statewide random sample survey of 2,400 Iowaresidents in 2011–2012 to assess public concerns about environmental qualityand expectations for the state’s agricultural sector. As the project was catego-rized as exempt from full Institutional Review Board review (ISU IRB ID no. 11-244), signed informed consent was not necessary, but formal informed consentlanguage (e.g., voluntary nature, confidentiality) was required and included inthe survey. The survey garnered a 47% response rate, and data did not showevidence of nonresponse bias (73). We analyzed survey responses regardingIowans’ ranked priorities for agricultural programs and policies comparing the13% of the sample who lived on a farm at the time of the survey, since adoptionof prairie strips depends on farmer and landowner willingness to implementthem, with the rest of the sample. Responses were recorded on a five-pointinteger scale corresponding to the following categories: 1, no priority; 2, slightpriority; 3, moderate priority; 4, high priority; and 5, very high priority.
Data Analysis.Wemodeled the yearly average of the logarithm of agronomic,biological, andhydrological responses collected from2008onward for data thatlent themselves to the statistical framework. For responses with zeros, weadded the smallest nonzero value for that set of responses to avoid taking thelogarithmof zero.We used amixed-effect, weighted linear regressionmodel inwhich block, treatment, and the logarithm of catchment size were treated asfixedeffects, and catchment and yearwere treated as randomeffects. Includingblocks provided treatment comparisons adjusted for landscape and block-widespillover between plots. Catchment financial returns were analyzed in the samemanner except that data were not log transformed due to some negative netreturns. Separate analyses were performed for corn and soybean for yield andeconomic return data. We estimated contrasts to assess the treatment effectsaccording to Table S8. We report results as 95% CIs for the exponentiatedcontrasts; thus, the result can be interpreted as the multiplicative effect unlessotherwise noted. Analysis was performed using the statistical software R (74)and the R packages lme4 and lsmeans (75). Social data were analyzed using at test to compare the responses of those who lived on a farm with those whodid not. All data used in these analyses are publicly available at https://github.com/ISU-STRIPS/STRIPS/releases/tag/v0.2 along with explanatory metadata.
Geographic Modeling. We used the ACPF toolbox (31, 32) to determine theextent to which prairie strips may be applicable as a conservation practice inIowa. Selection criteria included fields in row-crop production in 2014 withslope angles of 4–10% comprising at least a 10-ha area within the fieldboundary. The 4–10% slope criteria matched the range of slopes within ourexperimental catchments; slopes of >10% frequently have terraces installedthrough USDA programs. Slope calculations were made by field using a sloperaster derived from a 2-m–resolution digital elevation model. The slope cal-culation was estimated in percent slope using ArcGIS (66). The slope raster wasreclassified into three classes: 0–4%, 4–10%, and >10% slope. Area totals foreach class were compared with the overall field area to estimate the percentof the field in each slope class. These totals were summed for all fields by land-use class. The 10-ha criterion was conservatively considered the minimumoperable unit given typical equipment sizes used in farming operations inIowa; a sensitivity analysis on this factor is presented in Table S9.
ACKNOWLEDGMENTS. We thank the US Fish and Wildlife Service Neal SmithNational Wildlife Refuge for hosting the experiment, numerous technicians andstudent researchers for contributions to data collection, Heartland Cooperativefor yield data, P. Dixon for statistical advice, and two anonymous reviewers forconstructive comments. Funding was provided by Iowa State University, IowaDepartment of Agriculture and Land Stewardship, Iowa Flood Center, LeopoldCenter for Sustainable Agriculture Grants E2011-20 and SI2009, McIntire–StennisCooperative Forestry Research Program Grants IOW3805 and IOW5354, NationalScience Foundation Grant 0508091, the USDA Forest Service, USDA NationalInstitute of Food and Agriculture Grants IOW5249 and IOW5423, and USDASustainable Agriculture Research and Education Grant H001226911.
1. Tilman D, Balzer C, Hill J, Befort BL (2011) Global food demand and the sustainable
intensification of agriculture. Proc Natl Acad Sci USA 108:20260–20264.2. Rockström J, et al. (2009) A safe operating space for humanity. Nature 461:
472–475.3. Lark TJ, Salmon JM, Gibbs HK (2015) Cropland expansion outpaces agricultural and
biofuel policies in the United States. Environ Res Lett 10:044003.4. USDA National Agricultural Statistics Service (2016) Crop production 2015 summary
(NASS, Washington, DC). Available at https://www.usda.gov/nass/PUBS/TODAYRPT/
cropan16.pdf.
5. FAO [Food and Agriculture Organization of the United Nations] (2017) Crop Pro-
duction Quantities by Country, Average 1994-2014. Available at www.fao.org/faostat/
en/#data/QC/visualize. Accessed June 28, 2017.6. Sauer JR, Link WA, Fallon JE, Pardieck KL, Ziolkowski DJ (2013) The North American Breeding
Bird Survey 1966–2011: Summary analysis and species accounts. N Am Fauna 79:1–32.7. Spivak M, Mader E, Vaughan M, Euliss NH, Jr (2011) The plight of the bees. Environ Sci
Technol 45:34–38.8. Alexander RB, et al. (2008) Differences in phosphorus and nitrogen delivery to the
Gulf of Mexico from the Mississippi River basin. Environ Sci Technol 42:822–830.
Schulte et al. PNAS Early Edition | 5 of 6
SUST
AINABILITY
SCIENCE
Dow
nloa
ded
by g
uest
on
Mar
ch 1
8, 2
020
9. Veenstra JJ, Burras CL (2012) Effects of agriculture on the classification of black soils inthe Midwestern United States. Can J Soil Sci 92:403–411.
10. Tessum CW, Hill JD, Marshall JD (2014) Life cycle air quality impacts of conventionaland alternative light-duty transportation in the United States. Proc Natl Acad Sci USA111:18490–18495.
11. Lobao L, Stofferahn CW (2008) The community effects of industrialized farming:Social science research and challenges to corporate farming laws. Agric Human Values25:219–240.
12. Mississippi River/Gulf Hypoxia Nutrient Task Force (2008) Gulf Hypoxia Action Plan2008 for Reducing, Mitigating, and Controlling Hypoxia in the Northern Gulf ofMexico and Improving Water Quality in the Mississippi River Basin (US Environmen-tal Protection Agency, Washington, DC).
13. Shcherbak I, Millar N, Robertson GP (2014) Global metaanalysis of the nonlinear re-sponse of soil nitrous oxide (N2O) emissions to fertilizer nitrogen. Proc Natl Acad SciUSA 111:9199–9204.
14. Wollenberg E, et al. (2016) Reducing emissions from agriculture to meet the 2 °Ctarget. Glob Chang Biol 22:3859–3864.
15. Potts SG, et al. (2010) Global pollinator declines: Trends, impacts and drivers. TrendsEcol Evol 25:345–353.
16. The White House (2014) Presidential Memorandum–Creating a federal strategy topromote the health of honey bees and other pollinators. Available at https://obamawhitehouse.archives.gov/the-press-office/2014/06/20/presidential-memorandum-creating-federal-strategy-promote-health-honey-b. Accessed June 28, 2017.
17. Asbjornsen H, et al. (2014) Targeting perennial vegetation in agricultural landscapesfor enhancing ecosystem services. Renew Agric Food Syst 29:101–125.
18. Werling BP, et al. (2014) Perennial grasslands enhance biodiversity and multipleecosystem services in bioenergy landscapes. Proc Natl Acad Sci USA 111:1652–1657.
19. Kremen C, Miles A (2012) Ecosystem services in biologically diversified versus con-ventional farming systems: Benefits, externalities, and trade-offs. Ecol Soc 17:40.
20. Deryng D, Sacks WJJ, Barford CCC, Ramankutty N (2011) Simulating the effects ofclimate and agricultural management practices on global crop yield. GlobalBiogeochem Cycles 25:1–18.
21. Cardinale BJ, et al. (2012) Biodiversity loss and its impact on humanity.Nature 486:59–67.22. Hirsh SM, Mabry CM, Schulte LA, Liebman MZ (2013) Diversifying agricultural catch-
ments by incorporating tallgrass prairie buffer strips. Ecol Res 31:201–211.23. Cox R, O’Neal M, Hessel R, Schulte LA, Helmers M (2014) The impact of prairie strips
on aphidophagous predator abundance and soybean aphid predation in agriculturalcatchments. Environ Entomol 43:1185–1197.
24. Schulte LA, MacDonald AL, Niemi JB, Helmers MJ (2016) Prairie strips as a mechanismto promote land sharing by birds in industrial agricultural landscapes. Agric EcosystEnviron 220:55–63.
25. Pérez-Suárez M, Castellano MJ, Kolka R, Asbjornsen H, Helmers M (2014) Nitrogenand carbon dynamics in prairie vegetation strips across topographical gradients inmixed Central Iowa agroecosystems. Agric Ecosyst Environ 188:1–11.
26. Zhou X, et al. (2014) Nutrient removal by prairie filter strips in agricultural landscapes.J Soil Water Conserv 69:54–64.
27. Hernandez-Santana V, et al. (2013) Native prairie filter strips reduce runoff fromhillslopes under annual row-crop systems in Iowa, USA. J Hydrol (Amst) 477:94–103.
28. Helmers MJ, et al. (2012) Sediment removal by prairie filter strips in row-croppedephemeral watersheds. J Environ Qual 41:1531–1539.
29. Iqbal J, Parkin TB, Helmers MJ, Zhou X, Castellano MJ (2015) Denitrification and ni-trous oxide emissions in annual croplands, perennial grass buffers, and restored pe-rennial grasslands. Soil Sci Soc Am J 79:239–250.
30. Tyndall JC, Schulte LA, Liebman M, Helmers M (2013) Field-level financial assessmentof contour prairie strips for enhancement of environmental quality. Environ Manage52:736–747.
31. Porter SA, Tomer MD, James DE, Boomer KMB (2017) Agricultural ConservationPlanning Framework ArcGIS Toolbox User’s Manual. Version 2.2. Available at www.northcentralwater.org/acpf. Accessed June 28, 2017.
32. Tomer MD, James DE, Sandoval-Green CMJ (2017) Agricultural conservation planningframework: 3. Land use and field boundary database development and structure.J Environ Qual 46:676–686.
33. Zhou X, Helmers MJ, Asbjornsen H, Kolka R, Tomer MD (2010) Perennial filter stripsreduce nitrate levels in soil and shallow groundwater after grassland-to-croplandconversion. J Environ Qual 39:2006–2015.
34. Hladik ML, et al. (2017) Neonicotinoid insecticide removal by prairie strips in row-cropped watersheds with historical seed coating use. Agric Ecosyst Environ 241:160–167.
35. JarchowME, et al. (2015) Trade-offs among agronomic, energetic, and environmentalperformance characteristics of corn and prairie bioenergy cropping systems. GlobChange Biol Bioenergy 7:57–71.
36. Fiedler AK, Landis DA (2007) Plant characteristics associated with natural enemyabundance at Michigan native plants. Environ Entomol 36:878–886.
37. Daigh AL, et al. (2014) Subsurface drainage flow and soil water dynamics of re-constructed prairies and corn rotations for biofuel production. Vadose Zone J, 13,10.2136/vzj2013.10.0177.
38. Bach EM, Hofmockel KS (2016) A time for every season: Soil aggregate turnoverstimulates decomposition and reduces carbon loss in grasslands managed for bio-energy. Glob Change Biol Bioenergy 8:588–599.
39. Gutierrez-Lopez J, Asbjornsen H, Helmers M, Isenhart T (2014) Regulation of soilmoisture dynamics in agricultural fields using strips of native prairie vegetation.Geoderma 226–227:238–249.
40. Lange M, et al. (2015) Plant diversity increases soil microbial activity and soil carbonstorage. Nat Commun 6:6707.
41. Lefcheck JS, et al. (2015) Biodiversity enhances ecosystem multifunctionality acrosstrophic levels and habitats. Nat Commun 6:6936.
42. Fiedler AK, Landis DA (2007) Attractiveness of Michigan native plants to arthropodnatural enemies and herbivores. Environ Entomol 36:751–765.
43. Batie SS (2009) Green payments and the US farm bill: Information and policy chal-lenges. Front Ecol Environ 7:380–388.
44. Baker J, Helmers M, Laflen J (2006) Water management practices: Rain-fed cropland.Evaluating the Environmental Benefits of Agricultural Conservation Practices–TheStatus of Our Knowledge (Soil and Water Conservation Society, Ankeny, IA).
45. Christianson LE, Bhandari A, Helmers MJ, Kult KJ, Sutphin T (2012) Performanceevaluation of four field-scale agricultural drainage denitrification bioreactors in Iowa.Trans ASABE 55:2163–2174.
46. Jaynes DB, Isenhart TM (2014) Reconnecting tile drainage to riparian buffer hydrol-ogy for enhanced nitrate removal. J Environ Qual 43:631–638.
47. Kaspar T, Singer J (2011) The use of cover crops to manage soil. Soil Management:Building a Stable Base for Agriculture, eds Hatfield J, Sauer TJ (American Society ofAgronomy and Soil Science Society of America, Madison, WI), pp 321–337.
48. Poeplau C, Don A (2015) Carbon sequestration in agricultural soils via cultivation ofcover crops–A meta-analysis. Agric Ecosyst Environ 200:33–41.
49. Kaspar TC, Bakker MG (2015) Biomass production of 12 winter cereal cover cropcultivars and their effect on subsequent no-till corn yield. J Soil Water Conserv 70:353–364.
50. Roley SS, Tank JL, Tyndall JC, Witter JD (2015) How cost-effective are cover crops,wetlands, and two-stage ditches for nitrogen removal in the Mississippi River basin?Water Resour Econ 15:43–56.
51. Davis AS, Hill JD, Chase CA, Johanns AM, Liebman M (2012) Increasing croppingsystem diversity balances productivity, profitability and environmental health. PLoSOne 7:e47149.
52. Roesch-McNally GE, et al. (2017) The trouble with cover crops: Farmers’ experienceswith overcoming barriers to adoption. Renew Agric Food Syst, 1–12.
53. Heaton EA, et al. (2013) Managing a second-generation crop portfolio through sus-tainable intensification: Examples from the USA and the EU. Biofuels Bioprod Biorefin7:702–714.
54. Robertson GP, et al. (2017) Cellulosic biofuel contributions to a sustainable energyfuture: Choices and outcomes. Science 356:eaal2324.
55. Brandes E, et al. (2016) Subfield profitability analysis reveals an economic case forcropland diversification. Environ Res Lett 11:014009.
56. Boody G, et al. (2005) Multifunctional agriculture in the United States. Bioscience 55:27–38.
57. Dosskey MG, Helmers MJ, Eisenhauer DE, Franti TG, Hoagland KD (2002) Assessmentof concentrated flow through riparian buffers. J Soil Water Conserv 57:336–343.
58. Stubbs M (2014) Conservation Reserve Program (CRP): Status and Current Issues. R42783.(Congressional Research Service,Washington, DC). Available at www.nationalaglawcenter.org/wp-content/uploads/assets/crs/R42783.pdf. Accessed June 28, 2017.
59. Liebman M, et al. (2016) Ecologically sustainable weed management: How do we getfrom proof-of-concept to adoption? Ecol Appl 26:1352–1369.
60. Atwell RC, Schulte LA, Westphal LM (2010) How to build multifunctional agricultural land-scapes in the US Corn Belt: Add perennials and partnerships. Land Use Pol 27:1082–1090.
61. Reimer A, et al. (2014) People, place, behavior, and context: A research agenda forexpanding our understanding of what motivates farmers’ conservation behaviors.J Soil Water Conserv 69:57A–61A.
62. Arbuckle JG, Roesch-McNally G (2015) Cover crop adoption in Iowa: The role ofperceived practice characteristics. J Soil Water Conserv 70:418–429.
63. Robinson CA, Ghaffarzadeh M, Cruse RM (1996) Vegetative filter strip effects onsediment concentration in cropland runoff. J Soil Water Conserv 51:227–230.
64. Qi Z, Helmers MJ, Kaleita AL (2011) Soil water dynamics under various agriculturalland covers on a subsurface drained field in north-central Iowa, USA. Agric WaterManag 98:665–674.
65. Helmers MJ, et al. (2005) Flow pathways and sediment trapping in a field-scale veg-etative filter. Trans ASAE 48:955–968.
66. ESRI (2015) ArcGIS 10.3.1 (ESRI, Redlands, CA).67. Hessel R (2013) Classical and Conservation Biological Control of Pest Insects Within
Prairie and Crop Systems. MS thesis (Iowa State University, Ames, IA). Available at lib.dr.iastate.edu/etd. Accessed June 28, 2017.
68. Peterjohn BG, Sauer JR (1999) Population status of North American grassland birdsfrom the North American Breeding Bird Survey 1966-1996. Stud Avian Biol 19:27–44.
69. Iowa Department of Natural Resources (2015) Iowa Wildlife Action Plan. Available atwww.iowadnr.gov/Conservation/Wildlife-Stewardship/Iowa-Wildlife-Action-Plan. Ac-cessed June 28, 2017.
70. Clesceri LS, Greenberg AE, Eaton AD, eds (1998) Standard Methods for the Exami-nation of Water and Wastewater, 20th Ed (American Public Health Association,American Water Works, Water Environment Federation, Baltimore).
71. Iowa State University Extension and Outreach (2016) Ag decision maker: An agri-cultural economics and business website. Available at https://www.extension.iastate.edu/agdm/. Accessed June 28, 2017.
72. Tyndall J, Roesch GE (2014) Agricultural water quality BMPs: A standardized approachto financial analysis. J Ext 52:3FEA10.
73. Arbuckle JG, Jr, Tyndall J, Sorensen E (2015) Iowans’ Perspectives on Targeted Ap-proaches for Multiple-Benefit Agriculture (Department of Sociology, Iowa StateUniversity, Ames, IA), Technical Report 1038.
74. R Core Team (2016) R: A Language and Environment for Statistical Computing (RFoundation for Statistical Computing, Vienna), Version 3.4.0. Available at https://www.r-project.org/.
75. Bates D, Maechler M, Bolker BM, Walker S (2014) lme4: Linear mixed-effects modelsusing lme4. J Stat Softw 61:1–48.
76. Jost L, DeVries P, Walla T, Greeney H (2010) Partitioning diversity for conservationanalyses. Divers Distrib 16:65–76.
6 of 6 | www.pnas.org/cgi/doi/10.1073/pnas.1620229114 Schulte et al.
Dow
nloa
ded
by g
uest
on
Mar
ch 1
8, 2
020
Correction
SUSTAINABILITY SCIENCECorrection for “Prairie strips improve biodiversity and the de-livery of multiple ecosystem services from corn–soybean crop-lands,” by Lisa A. Schulte, Jarad Niemi, Matthew J. Helmers,Matt Liebman, J. Gordon Arbuckle, David E. James, Randall K.Kolka, Matthew E. O’Neal, Mark D. Tomer, John C. Tyndall, HeidiAsbjornsen, Pauline Drobney, Jeri Neal, Gary Van Ryswyk, andChris Witte, which was first published October 2, 2017; 10.1073/pnas.1620229114 (Proc Natl Acad Sci USA 114:11247–11252).The authors note that the following statement should be
added to the Acknowledgments: “The findings and conclusionsin this article are those of the author(s) and do not necessarilyrepresent the views of the US Fish and Wildlife Service. Mentionof trade names or commercial products in this publication issolely for the purpose of providing specific information and doesnot imply recommendation or endorsement by USDA.”
Published under the PNAS license.
www.pnas.org/cgi/doi/10.1073/pnas.1719680114
www.pnas.org PNAS | December 12, 2017 | vol. 114 | no. 50 | E10851
CORR
ECTION