Corporate Yield Spreads and Rollover Risk marginal effect of debt market illiquidity through a...
38
1 Rollover risk and corporate bond spreads PATRICIO VALENZUELA † ABSTRACT Using a new data set on corporate bonds placed in international markets by advanced and emerging market borrowers, this paper demonstrates that the impact of debt market illiquidity on corporate bond spreads is exacerbated with a higher proportion of short-term debt. This effect is stronger in speculative-grade bonds and is smaller in the banking sector as banks may have the support of a lender of last resort in times of debt market illiquidity. The paper’s major finding is consistent with the predictions of structural credit risk models that argue that a higher proportion of short-term debt increases the firm’s exposure to debt market illiquidity through a ‘rollover risk’ channel. JEL CODE: G12; G13; G15; G32; G33 KEY WORDS: CREDIT SPREADS; DEFAULT RISK; MARKET ILLIQUIDITY; ROLLOVER RISK † University of Chile, República 701, Santiago, Chile. e-mail: [email protected]. I have benefited from helpful comments from Franklin Allen, Arpad Abraham, Jérôme Adda, Dion Bongaerts, Eduardo Borensztein, Elena Carletti, Gian Luca Clementi, Giancarlo Corsetti, Satyajit Chatterjee, Sanjiv Das, Luigi Guiso, Zhiguo He, Rodrigo Hernández, Todd Keister, Jun Qian, Krista Schwarz, Lovo Stefano, and Anjan Thakor and seminar participants at the IADB Research Department, the European University Institute, the Riksbank, University Carlos III, CUNEF, the CREDIT Conference, the CRSP Forum, the EUROFIDAI-AFFI International Paris Finance Meeting, the SFA Annual Meeting, the European Finance Association Doctoral Tutorial, the Chicago Quantitative Fall Conference, and the FMA Annual Meeting. I thank Jack Bao, Jun Pan, and Jiang Wang for access to their Gamma measure and Krista Schwarz for access to her KfW spread.
Transcript of Corporate Yield Spreads and Rollover Risk marginal effect of debt market illiquidity through a...

1
Rollover risk and corporate bond spreads
PATRICIO VALENZUELA †
ABSTRACT
Using a new data set on corporate bonds placed in international markets by advanced and
emerging market borrowers, this paper demonstrates that the impact of debt market
illiquidity on corporate bond spreads is exacerbated with a higher proportion of short-term
debt. This effect is stronger in speculative-grade bonds and is smaller in the banking sector
as banks may have the support of a lender of last resort in times of debt market illiquidity.
The paper’s major finding is consistent with the predictions of structural credit risk models
that argue that a higher proportion of short-term debt increases the firm’s exposure to debt
market illiquidity through a ‘rollover risk’ channel.
JEL CODE: G12; G13; G15; G32; G33
KEY WORDS: CREDIT SPREADS; DEFAULT RISK; MARKET ILLIQUIDITY; ROLLOVER RISK
† University of Chile, República 701, Santiago, Chile. e-mail: [email protected]. I have benefited from helpful
comments from Franklin Allen, Arpad Abraham, Jérôme Adda, Dion Bongaerts, Eduardo Borensztein, Elena Carletti, Gian Luca Clementi, Giancarlo Corsetti, Satyajit Chatterjee, Sanjiv Das, Luigi Guiso, Zhiguo He, Rodrigo Hernández, Todd Keister, Jun Qian, Krista Schwarz, Lovo Stefano, and Anjan Thakor and seminar participants at the IADB Research Department, the European University Institute, the Riksbank, University Carlos III, CUNEF, the CREDIT Conference, the CRSP Forum, the EUROFIDAI-AFFI International Paris Finance Meeting, the SFA Annual Meeting, the European Finance Association Doctoral Tutorial, the Chicago Quantitative Fall Conference, and the FMA Annual Meeting. I thank Jack Bao, Jun Pan, and Jiang Wang for access to their Gamma measure and Krista Schwarz for access to her KfW spread.

2
Introduction
The financial crisis of 2007 to 2009 hit international debt markets hard and produced a
significant widening of corporate bond spreads. According to the literature on the determinants of
corporate bond spreads, the main factors that may have affected these spreads during the crisis are
default and liquidity risks. However, the financial crisis also highlighted the importance of rollover
risk as a significant factor for consideration in the pricing of corporate bonds. Although there is a
rich body of literature examining the influence of default risk and market illiquidity on corporate
bond spreads (e.g., Merton, 1974; Collin-Dufresne et al., 2001; Campbell and Taksler, 2003; Chen,
Lesmond, and Wei, 2007; Covitz and Downing, 2007; Bao, Pan, and Wang, 2010), research on the
role of rollover risk in corporate debt markets is still in its infancy.
During episodes of market illiquidity, rollover risk appears to be particularly relevant. Firms with
high levels of short-term debt to total debt and without access to new capital at a reasonable cost
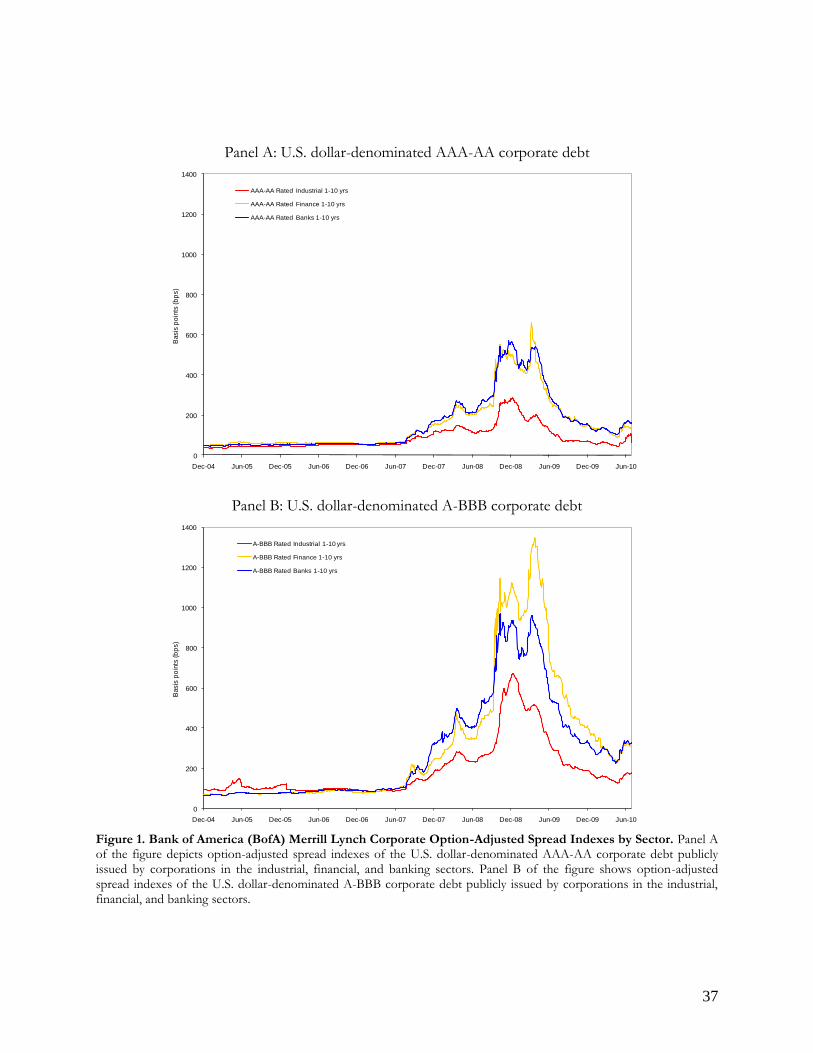
may incur substantial rollover losses that increase their probabilities of default. Figure 1 shows that
the impact of the financial crisis of 2007 to 2009 was particularly strong for bonds issued by banks
and financial corporations and bonds with lower credit ratings. A potential reason for the divergence
of corporate bond spreads across sectors is the previously mentioned rollover risk, as banks and
financial corporations are more prone to rollover losses given their high levels of short-term debt
relative to their total debt.
[Insert Figure 1 about here.]

3
Using a new data set on corporate bonds placed on international markets for the period January
2004 to June 2009, this paper shows that the impact of debt market illiquidity on corporate bond
spreads is exacerbated with higher levels of short-term debt over total debt. This result is significant,
even after controlling for all known determinants of corporate bond spreads and the potential
heterogeneous effects of debt market illiquidity (e.g., flight-to-quality and too-big-to-fail) and is
robust to alternative measures of debt market illiquidity, to including bond- and time-fixed effects,
and to potential endogeneity bias.1 In addition, the main finding in this paper is consistent with the
predictions of first-passage structural credit risk models, such as the one introduced by He and
Xiong (2012), in which the impact of debt market illiquidity affects corporate bond spreads through
a ‘rollover risk’ channel.
Rollover risk is priced in both investment-grade and speculative-grade bonds, but its impact on
spreads is higher for speculative corporate bonds. For investment-grade bonds, during the episode
of high debt market illiquidity at the end of 2008, rollover risk predicts a difference of approximately
85 basis points between the spread of bonds issued by firms with short-term debt to total debt ratios
at the 75th and 25th percentiles. For speculative-grade bonds, this magnitude is approximately 230
basis points. During the same episode of market illiquidity, the average spreads of investment-grade
and speculative-grade corporate bonds were approximately 475 basis points and 1,290 basis points,
respectively. Therefore, the magnitudes associated with rollover risk during periods of market
illiquidity are economically significant. The results also indicate that banks are more resilient to the
1 According to Gopalan, Song and Yerramilli (2010), firms that have a higher proportion of short-term debt over total debt tend to be less risky and less likely to experience deteriorations in their credit quality. Therefore, estimations that do not correct for the endogeneity of rollover may potentially underestimate the true impact of rollover on the deterioration in credit quality.

4
marginal effect of debt market illiquidity through a rollover risk channel, which is consistent with the
possibility that banks may have the support of a lender of last resort during episodes of market
illiquidity.
As a consequence of the financial crisis of 2007 to 2009, recent empirical studies have
highlighted firms’ maturity debt structures as an important component of corporate bond spreads.
Golapan, Song and Yerramilli (2010) show that long-term bonds issued by firms with a higher
proportion of debt maturing within the year trade at higher spreads and are more likely to
experience multi-notch rating downgrades. Hu (2010) argues that firms with a proportion of
expiring long-term debt higher than 0.2 experienced higher spreads during the second half of 2008.
Although the results presented in these studies are consistent with the argument that a higher
proportion of short-term debt exposes firms to rollover risk, our understanding of the channels
through which rollover risk affects corporate bond spreads remains limited.
This paper contributes to the literature on the determinants of corporate bond spreads in several
dimensions. First, it contributes to the empirical literature by exploring an important channel
through which debt market illiquidity affects corporate bond spreads, i.e., the rollover risk channel.
Ignoring this channel when considering the impact of debt market illiquidity on corporate bond
spreads and adhering to standard models on the pricing of corporate bonds may be undesirable in
times of market illiquidity, as this approach may bias the results. Second, in contrast to the
commonly held position, the results in this paper empirically demonstrate that liquidity and default
risks are not independent determinants of corporate bond spreads. In fact, the results of this study
suggest an interaction between liquidity and default premiums whereby the debt market illiquidity

5
increases the firm’s probability of default through increased rollover losses. Finally, by showing that
banks are less affected by the marginal effect of debt market illiquidity through a rollover risk
channel, this paper contributes to the current debate regarding the regulation of nonbank financial
corporations.
The remainder of the paper is organized as follows. Section 2 briefly presents the theoretical
framework that supports the empirical tests conducted in this paper. Section 3 describes the
characteristics of the data and sample. Section 4 presents the empirical results. Section 5 addresses
potential endogeneity. Section 6 concludes the paper.
1. The theoretical framework
This section presents a theoretical discussion of the rollover risk channel through which debt
market illiquidity influences corporate bond spreads. First-passage structural credit risk models
frame the most important issues.
Extending Leland and Toft’s structural credit risk model (1996), which considers illiquid bond
markets and firms that finance their capital with equity, short-term and long-term debt, He and
Xiong (2012) show that market illiquidity increases corporate bond spreads and argue that this effect
is exacerbated in firms with higher levels of short-term debt in relation to total debt. Under the
assumption of a stationary debt structure, implying that when a bond matures firms replace it by
issuing a new, identical bond, the impact of rollover risk on corporate bond spreads is demonstrated
by the following mechanism: A negative shock in debt market liquidity increases the liquidity
premium, driving the prices of firms’ newly issued bonds down. If the market value of the newly

6
issued bonds drops below its principal value, firms incur rollover losses. These losses are higher in
firms with higher short-term debt to total debt ratios, as short-term debt is rolled over at a higher
frequency. Rollover losses reduce the firm’s equity value at a higher endogenous default boundary,
thus increasing the probabilities of default and, in turn, increasing corporate bond spreads. In the
model presented by He and Xiong (2012), default occurs endogenously when the assets drop to a
low boundary at which the equity value becomes zero.
Therefore, structural credit risk models generate predictions of the impact of market illiquidity
on corporate bond spreads through a rollover risk channel.
2. Sample characteristics and data description
Using Bloomberg Professional, I constructed a new data set of investment-grade and
speculative-grade corporate bonds placed in international markets by developed and emerging
market borrowers. The period under study is from January 2004 to June 2009. The data set consists
of month-end data and considers all fixed-rate bonds that are denominated in U.S. dollars and
available to Bloomberg in June 2009, with the exception of bonds issued by firms located in the U.S.
or England.2 The rationale behind excluding the economies in which the crisis incubated is to reduce
potential endogeneity problems in the causal impact of debt market illiquidity on corporate bond
spreads. Despite these exclusions, as I show here, the behavior of my spread data mimics the
behavior of spread indexes widely used by investors quite well and that represent nearly the entire
2 The countries included in the final sample are Argentina, Australia, Austria, Belgium, Brazil, Canada, Chile, Colombia, Denmark, Finland, France, Germany, Ireland, Italy, Japan, Malaysia, Mexico, Netherlands, New Zealand, Norway, Panama, Peru, Philippines, Singapore, South Korea, Spain, Sweden, Switzerland, and Thailand.
7
universe of corporate bonds denominated in U.S. dollars. The data set contains bonds issued by
publicly traded firms in the financial and nonfinancial sectors. The distribution of issuers by sector
in the final sample is as follows: industrial (53.9%), banking (17.1%), financial (9.0%), utility (8.6%),
telephone (7.8%), oil and gas (2.4%), and transportation (1.2%).
It is important to emphasize that international debt denominated in US dollars have become an
important financing source for firms (Allen, Qian, Carletti and Valenzuela, 2012). Using data from
1991 to 2005, Gozzi et al. (2010) show that 35% of the capital raised through debt issues was raised
in international markets. Moreover, international debt issues tend to be denominated in foreign
currencies (Hausmann, and Panizza, 2010; Gozzi et al., 2012).
To reduce potential coding errors, I clean the data in four ways. First, I eliminate the top and
bottom 0.5% of the spreads from my analysis. Second, I exclude all observations in which any of the
accounting variables exceeds the sample mean by more than five standard deviations. Third, I do
not consider bonds issued in countries in which the total number of observations was lower than
30.3 Fourth, I restrict the sample to bonds issued by firms with an S&P credit rating between AAA
and B-. After the cleaning of the data, the final sample, including all the control variables, contains
21,375 bond-month observations, of which 16,691 correspond to investment-grade bonds and 4,684
correspond to speculative-grade bonds.
3 The bonds eliminated in this cleaning of the data correspond to bonds issued in the Bahamas, China, and Hong Kong.
8
3.1. Corporate bond spreads
The dependent variable is the corporate option-adjusted spread (OAS) from Bloomberg. In short, it
represents the spread over an issuer’s spot rate curve (i.e., the theoretical yield on a zero-coupon
U.S. Treasury security). It is derived by positing a distribution of millions of interest rate paths (using
a one-factor, arbitrage-free binomial tree of normally distributed short rates) consistent with the
current ‘riskless’ Treasury term structure. The bond’s call schedule is then examined, and the interest
rate paths are used to discount the cash flows from the corporate bonds necessary to arrive at their
present values, while the cash flows depend on the level of interest rates.4 The present values are
averaged to obtain an expected value, which can be viewed as the theoretical price of the bond. The
OAS is the constant spread over the underlying Treasury term structure across each path that makes
the theoretical value of the bond equal to the market price of the bond.
Fabozzi (2006) emphasized that when the OAS is measured over a U.S. Treasury security, as in
this case, the OAS captures the credit spread, a liquidity premium, and any richness or cheapness of
the bond after adjusting for the effects of any embedded options. The use of the OAS in this study
is important, given that in general, corporate bonds contain embedded options, causing 57% of the
bonds in my sample to contain contingent cash flows due to call or put features. However, note that
the OAS methodology does not affect my results, as they are robust to splitting my sample between
4 For instance, the probability of the occurrence of a cash flow prior to the call period is 100%, but the probability of the occurrence of a cash flow occurring after the call period begins depends on the possible paths of interest rates up to the time of the cash flow.

9
bonds without embedded options (in which the option value is zero) and bonds with embedded
options.5
To explore whether my OAS data suffer from any selection bias, it is interesting to compare it
with the OAS indexes. In Figure 2, I plot the average OASs from my data beside the OAS indexes
reported by Bank of America (BofA) Merrill Lynch. I plot each series for each credit rating category
with their respective correlations. It is noteworthy that while there are some discrepancies between
the two series, the indexes constructed from my data set adequately mimic the behavior of the BofA
Merrill Lynch OAS indexes and, therefore, the universe of bonds given a set of characteristics such
as credit rating, currency, amount issued and time to maturity.6 For all the reported credit rating
categories, the levels in both indexes are similar and their correlations are close to one, suggesting
that my spread data are quite representative of the universe of corporate bonds denominated in U.S.
dollars and that the results presented here are unlikely to be driven by sample selection bias.
[Insert Figure 2 about here.]
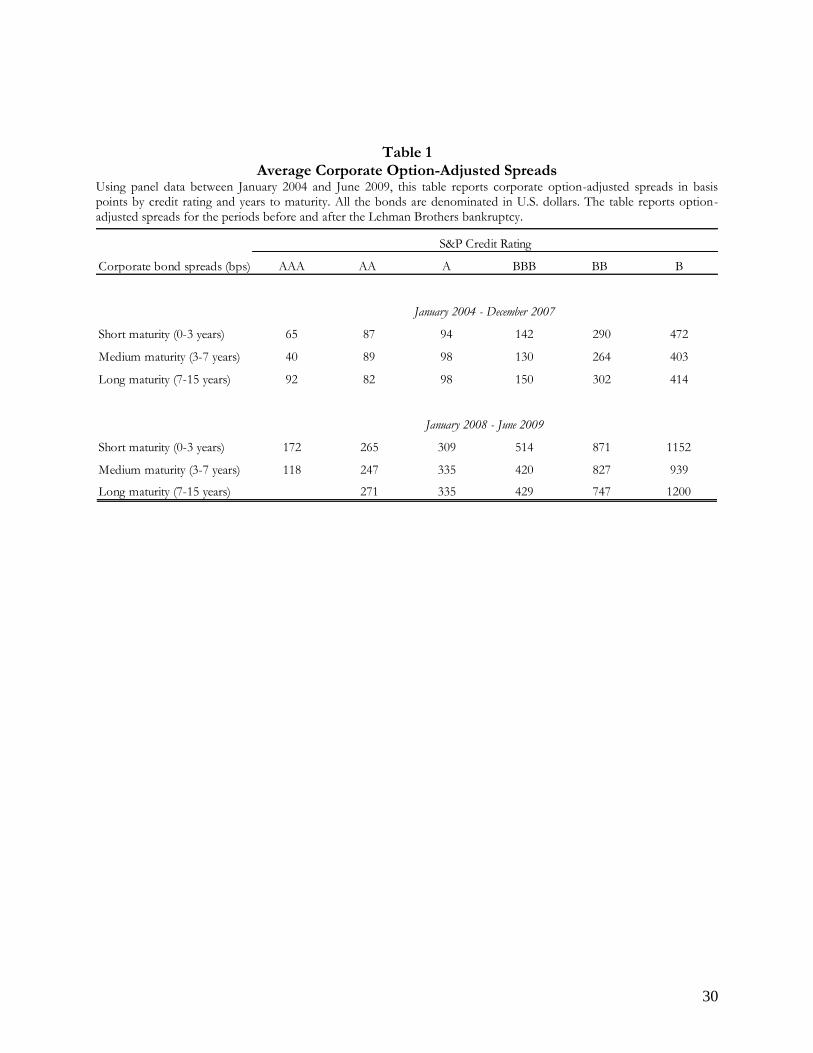
Table 1 summarizes the mean spread using the S&P credit rating and the number of years to
maturity. The table shows that OASs increase as the quality of the credit rating decreases and that
5 Other studies using OASs are, for example, Becchetti et al. (2010), Cavallo and Valenzuela (2010), Huang and Kong (2003), and Pedrosa and Roll (1998). 6 The BofA Merrill Lynch OAS indexes correspond to weighted averages based on the outstanding amount of each bond. According to the data restrictions, the OAS weighted averages from my data are based on the issued amount. In addition, given that the U.S. Corporate BofA Merrill Lynch indexes by credit rating are only available for bonds issued in investment-grade countries of risk, in the construction of my indexes, I do not consider bonds issued in countries granted a lower than investment-grade credit rating. The index criteria used by BofA Merrill Lynch are available at http://www.mlindex.ml.com.

10
OASs are considerably higher in the period of financial distress including the Lehman Brothers
bankruptcy.
[Insert Table 1 about here.]
3.2. Debt market illiquidity
In view of the financial crisis of 2007 to 2009 and its effects, this paper focuses on the
systematic implications of debt market illiquidity and utilizes debt market illiquidity measures rather
than bond-specific measures. Furthermore, it is generally known that there is a significant level of
commonality in measures of bond illiquidity, indicating a significant systemic illiquidity component
(Bao, Pan, and Wang, 2010; Chordia, Sarkar, and Subrahmanyam, 2005).
The five measures of debt market illiquidity used in this paper are the Gamma measure, the
Noise measure, the On/off-the-run U.S. Treasury spread, the Supranational AAA spread and the
KfW spread. Due to space considerations, I present all my results using the Gamma measure, which
is constructed using corporate bond prices, and only use the other measures for the purpose of
robustness in my baseline estimations. The results in this paper are qualitatively similar regardless of
the measure used. Appendix A describes the five measures of debt market illiquidity used in this
paper. Appendix B shows the correlation matrix among those measures.7
3.3. Short-term debt
7 Although these measures are constructed using data from different debt markets and denominated in different currencies (e.g., the KfW spread is denominated in euros), based on the commonality of liquidity across markets, these measures are useful to test whether they can be used comprehensively as measures of market illiquidity in bond markets.

11
According to the theoretical framework introduced by He and Xiong (2012), rollover losses
increase with debt market illiquidity, and this effect is stronger for firms with higher short-term debt
to total debt ratios. Therefore, the empirical model presented in the next section considers debt
market illiquidity and its interaction with the short-term debt to total debt ratio as determinants of
corporate bond spreads. The short-term debt to total debt ratio is constructed using accounting data
from Bloomberg and is calculated as the ratio of short-term borrowings over total borrowings.
3.4. Other corporate bond spreads determinants
To control for all variables that could directly affect corporate bond spreads, all specifications
consider a powerful set of variables. The choice of the control variables is based primarily on
structural credit risk models and the empirical literature on the determinants of corporate bond
spreads (see, e.g., Collin-Dufresne et al., 2001 and Campbell and Taksler, 2003). The descriptions,
units, frequency and sources of the variables are presented in Appendix C.
At the bond level, all the regressions include bond-fixed effects and control for time to maturity.
Bond-fixed effects control for the endogeneity arising from time-invariant bond/firm heterogeneity.
At the firm level, I control for Standard and Poor’s (S&P) corporate credit rating in all
specifications.8 Because credit ratings mainly consider the long-term and structural components of
default risk (Löffler, 2004), I also consider the issuer’s equity volatility and a standard set of
accounting variables, as in Campbell and Taskler (2003). The accounting variables considered are the
8 Although there is a well-known nonlinear relationship between credit ratings and spreads, the results are nearly identical when controlling for credit ratings or credit-rating dummies. There are two reasons for this. First, I split the sample between investment-grade and speculative-grade bonds, which captures some of this nonlinear relationship. Second, in all regressions, I control for the known determinants of credit risk and, thus, of credit ratings. For the purpose of parsimony, I report the results using the credit-rating variable rather than credit-rating dummies.

12
ratio operating income to sales, the ratio of short-term debt to total debt, the ratio of total debt to
assets and firm size.9 As balance sheet variables are reported quarterly, following Collin-Dufresne et
al. (2001), I estimate monthly observations using linear interpolation.10
At the country level, I also include the S&P sovereign credit rating to control for a broad range
of country-level factors correlated with sovereign risks, which may affect the credit risk of private
firms. Finally, I consider the interaction between corporate credit rating and debt market liquidity to
control for a potential ‘flight-to-quality’ effect, in which investors abandon risky bonds in favor of
safer bonds during periods of market illiquidity.11 Table 2 characterizes the variables considered in
my final sample of bonds for each year.
[Insert Table 2 about here.]
3. Regression analysis
4.1. Corporate bond spreads and rollover risk
The central question of this study is to explore whether debt market illiquidity affects corporate
bond spreads through a rollover risk channel. Thus, the baseline specification is as follows:
9 Although my main results are robust to the inclusion of the pretax interest coverage, I exclude this variable in my baseline regression, as my sample size drops considerably when it is added. 10 The main results in this paper are, for the most part, identical when using quarterly or monthly data. 11 As a robustness check, the model presented in section 5.1 considers a number of additional interaction terms to control for other potential heterogeneous effects of debt market illiquidity.
13
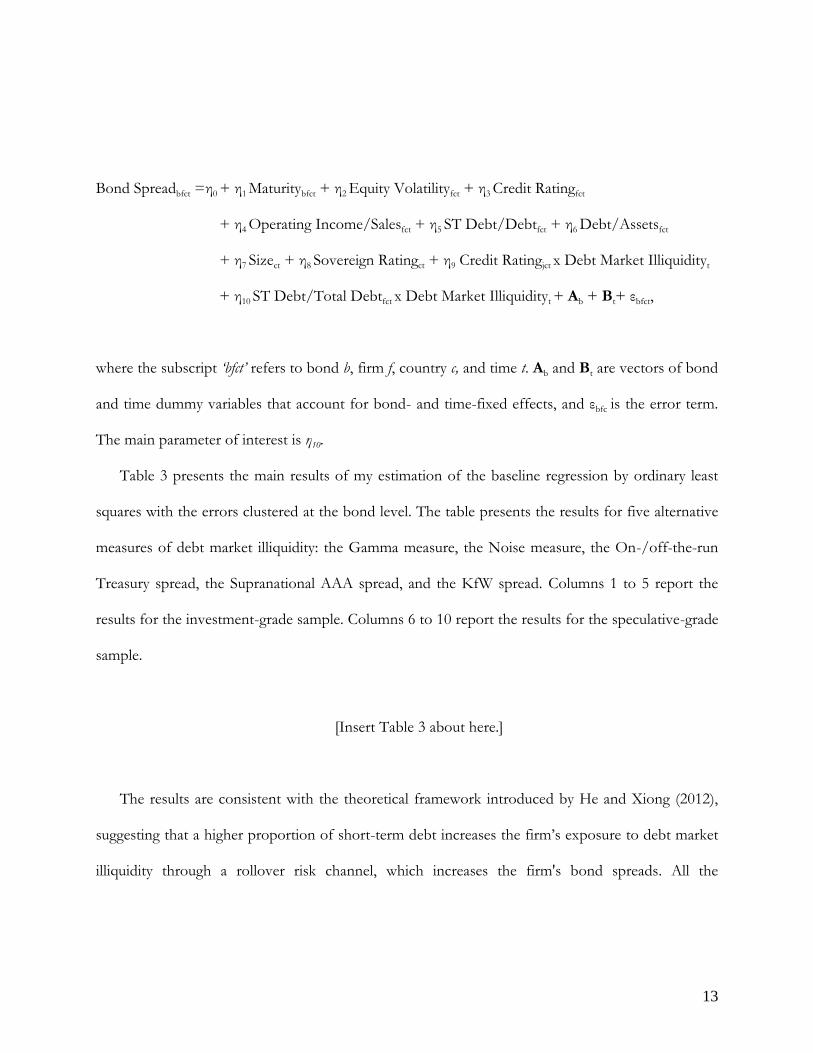
Bond Spreadbfct =η0 + η1 Maturitybfct + η2 Equity Volatilityfct + η3 Credit Ratingfct
+ η4 Operating Income/Salesfct + η5 ST Debt/Debtfct + η6 Debt/Assetsfct
+ η7 Sizect + η8 Sovereign Ratingct + η9 Credit Ratingjct x Debt Market Illiquidityt
+ η10 ST Debt/Total Debtfct x Debt Market Illiquidityt + Ab + Bt+ εbfct,
where the subscript ‘bfct’ refers to bond b, firm f, country c, and time t. Ab and Bt are vectors of bond
and time dummy variables that account for bond- and time-fixed effects, and εbfc is the error term.
The main parameter of interest is η10.
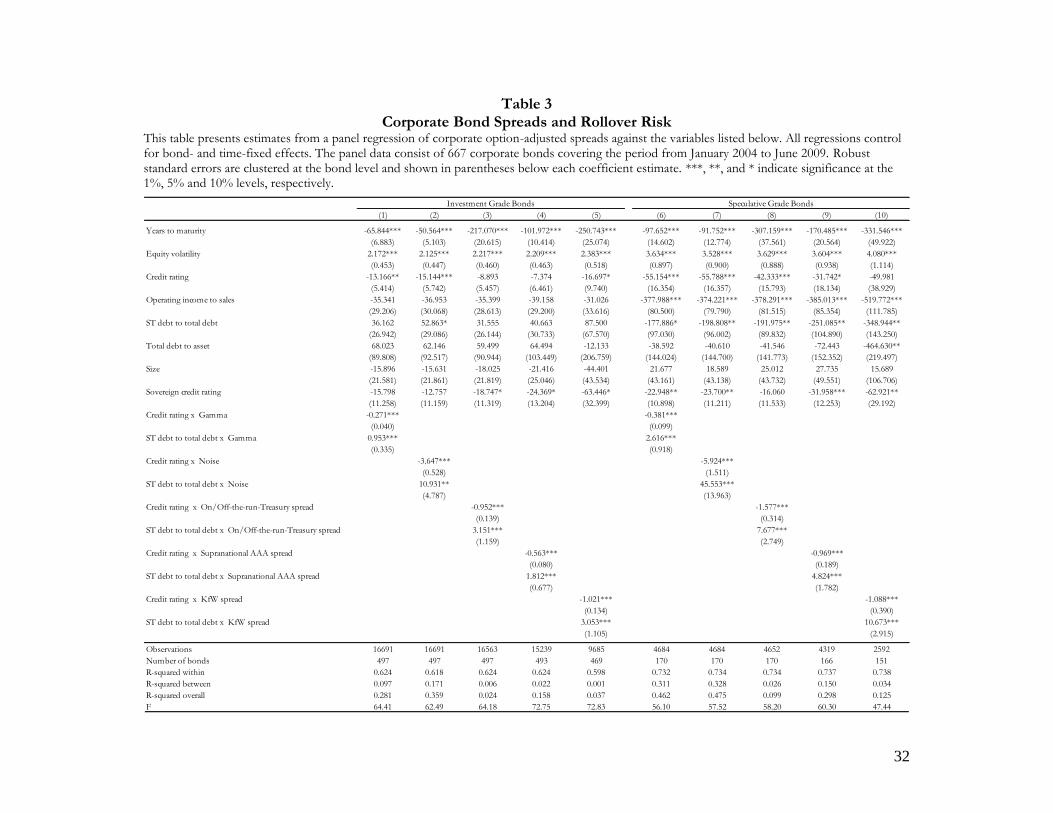
Table 3 presents the main results of my estimation of the baseline regression by ordinary least
squares with the errors clustered at the bond level. The table presents the results for five alternative
measures of debt market illiquidity: the Gamma measure, the Noise measure, the On-/off-the-run
Treasury spread, the Supranational AAA spread, and the KfW spread. Columns 1 to 5 report the
results for the investment-grade sample. Columns 6 to 10 report the results for the speculative-grade
sample.
[Insert Table 3 about here.]
The results are consistent with the theoretical framework introduced by He and Xiong (2012),
suggesting that a higher proportion of short-term debt increases the firm’s exposure to debt market
illiquidity through a rollover risk channel, which increases the firm's bond spreads. All the

14
coefficients of the interaction term between the proportion of short-term debt and debt market
illiquidity are positive and highly statistically significant. Thus, this paper’s major finding is robust to
the five measures of debt market illiquidity in both the investment-grade and speculative-grade
samples.
The results also suggest the presence of a ‘flight to quality’ effect, whereby bonds that are less
risky in terms of their credit rating quality are relatively less affected by episodes of market illiquidity,
as investors may ‘fly’ from risky bonds to safer bonds. Columns 1 to 10 show that the coefficients
associated with the interaction between corporate credit rating and debt market illiquidity are
negative and highly statistically significant. Additionally, the results show that the spread of
investment bonds is less sensitive to market illiquidity than the spread of speculative grade bonds.
In times of market illiquidity, the proportion of the spreads explained by debt market illiquidity
through a rollover risk channel is economically important. One way to evaluate the magnitude of the
rollover risk’s effect on corporate bond spreads is to consider the following. Given a Gamma
measure of 330, as was the case at the end of 2008, the coefficients presented in column 1 in Table 3
predict that the spreads of investment grade bonds issued by firms with short-term to total debt
ratios in the 75th percentile are approximately 85 basis points higher than the spreads of speculative
bonds issued by firms with short-term to total debt ratios in the 25th percentile. Additionally, the
coefficients presented in column 6 in Table 3 predict that this magnitude is approximately 230 basis
points in the speculative-grade bond sample. For the same period of market illiquidity, the spread of
investment-grade and speculative-grade corporate bonds were, on average, approximately 475 basis
points and 1,290 basis points, respectively. These magnitudes suggest that a firm’s maturity debt

15
structure can explain an important proportion of the divergence of corporate bond spreads during
episodes of debt market illiquidity.
Most of the coefficients associated with the control variables have the expected sign, although
many of them are not statistically significant. However, it is noteworthy that in unreported
regressions, including industry- and country-fixed effects rather than bond-fixed effects, nearly all
the coefficients are highly significant in the expected directions, and their magnitudes are consistent
with those reported in previous studies (see, e.g., Campbell and Taksler, 2003). This suggests that it
is primarily the variation across bonds and firms that provide the explanatory power of those
variables.
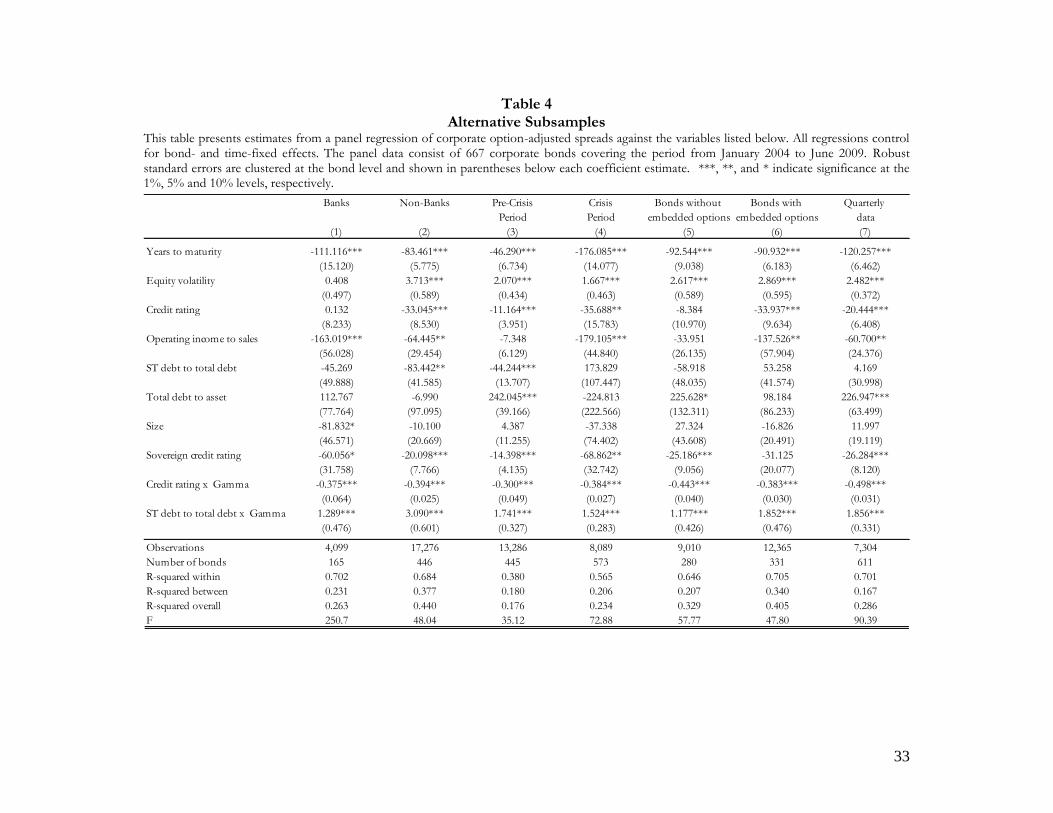
4.2. Banks versus Nonbanks
In times of market illiquidity, bonds issued by banks exhibit higher spreads than bonds issued by
nonbanks, as banks are more exposed to rollover losses as a result of their higher levels of short-
term debt over total debt. However, because banks often have a lender of last resort that may
alleviate the cost of rolling over their maturing debt in periods of market illiquidity, I would expect
bonds issued by banks to be more resilient to the influence of debt market illiquidity through a
rollover risk channel.
To explore whether the impact of debt market illiquidity on corporate bond spreads through a
rollover risk channel differs across sectors, columns 1 and 2 of Table 4 divide my sample between
banks and nonbanks, respectively. As expected, the results indicate that banks are less affected than
nonbanks by the marginal effect of debt market illiquidity through a rollover risk channel. In fact,

16
the coefficient of the interaction term in the bank sample is approximately half that of the nonbank
sample. This result is consistent with the assumption that banks have a lender of last resort in
periods of market illiquidity.12
[Insert Table 4 about here.]
4.3. Subsamples
Table 4 also explores other subsamples. Since the sample period contains the Lehman Borthers
bankruptcy and its effects on financial markets, it is likely that the results are biased by this episode.
Columns 3 and 4 present the results for two sub-periods: the pre-crisis period (2004-2007) and the
crisis period (2008-2009). The results indicate that the impact of debt market illiquidity through a
rollover risk remains significant in both periods.
Despite the fact that the OAS methodology is a standard approach in financial markets for
computing the embedded value of the eventual embedded option of the bond (e.g., a call option),
this methodology may introduce some errors to the measurement of my dependent variable. To
explore whether the OAS methodology is driving the results, columns 5 and 6 divide my sample
between bonds without embedded options (in which the option value is zero) and with embedded
options, respectively. The results suggest that the OAS methodology does not drive my main results,
12 I also explore this issue in unreported regressions, augmenting my baseline regressions with three interaction terms: the interaction between a bank dummy variable and debt market illiquidity; the interaction between a bank dummy variable and the proportion of short-term debt; and the interaction between a bank dummy variable, the proportion of short-term debt, and debt market illiquidity. The results of these regressions are consistent with those reported in columns 1 and 2 of Table 4. I prefer to report my results using different samples, as this approach provides a more general estimation and allows for different coefficients for the control variables.

17
as the coefficients of the interaction term between debt market illiquidity and the proportion of
short-term debt remain positive and highly significant in both samples.
Finally, Table 4 investigates whether the interpolation of my quarterly firm-level variables into
monthly frequency affects the results. To rule this possibility out, column 7 re-estimates my baseline
regression using quarterly data. Once again, the results remain qualitatively unchanged.
4. Endogeneity
Given that bond-fixed effects do not address the endogeneity associated with time-varying
bond/firm characteristics, this section explores whether the results are robust to controlling for
endogeneity more exhaustively. There are three good reasons to believe that endogeneity may be
driving the results. First, the level of short-term debt to total debt may shift simultaneously with
other bond- and firm-level characteristics, and it may be these additional variables that drive the
results. For instance, a reduction in the firm’s share of short-term debt may be part of a firm strategy
that also includes a leverage reduction. Therefore, the short-term to total debt ratio may take on a
leverage effect rather than a rollover risk effect. Second, debt market illiquidity is likely to occur
simultaneously with credit market deterioration. Thus, systemic default risk may be driving the debt
market illiquidity effect. Third, because the maturity debt structure of a firm is a managerial decision,
the short-term debt to total debt ratio may depend on the firm’s credit risk level, as reflected in its
spreads. The analysis developed here presents additional evidence suggesting that it is unlikely that
endogeneity is driving the main results.

18
5.1. Is the short-term debt to total debt a proxy for other firm or bond characteristics?
Given that my measure of rollover risk is constructed as the interaction between the short-term
to total debt ratio and debt market illiquidity, it is possible that these variables are proxies for
something else. The first possibility is that the short-term debt to total debt ratio may take on other
contemporaneous variables. Table 5 presents the results of more explicit testing for this possibility
by including a number of additional interaction terms. The four added terms correspond to the
interaction of equity volatility, total debt to total assets, size of the firm, and years to maturity with
debt market illiquidity. On the one hand, I expect bonds issued by firms with greater equity volatility
and leverage to be more vulnerable to episodes of market illiquidity. On the other hand, I expect
bonds issued by larger firms and with a longer time to maturity to be more resilient to episodes of
market illiquidity.
Table 5 shows that all my previous results remain relatively unchanged, while all the coefficients
associated with the new interaction terms (with the exception of the interaction between size and
debt market illiquidity in the speculative-grade sample) have the expected sign, although most of
them are not statistically significant at standard levels of confidence. These results (i.e., that only
credit ratings and the proportion of short-term debt exacerbate the impact of debt market illiquidity)
suggest that in times of market illiquidity, credit ratings adequately account for a powerful set of
bond/firm characteristics but do not account for the firm’s maturity structure, a conclusion that is
consistent with Golapan, Song, and Yerramillin (2010)’s major finding.
[Insert Table 5 about here.]
19
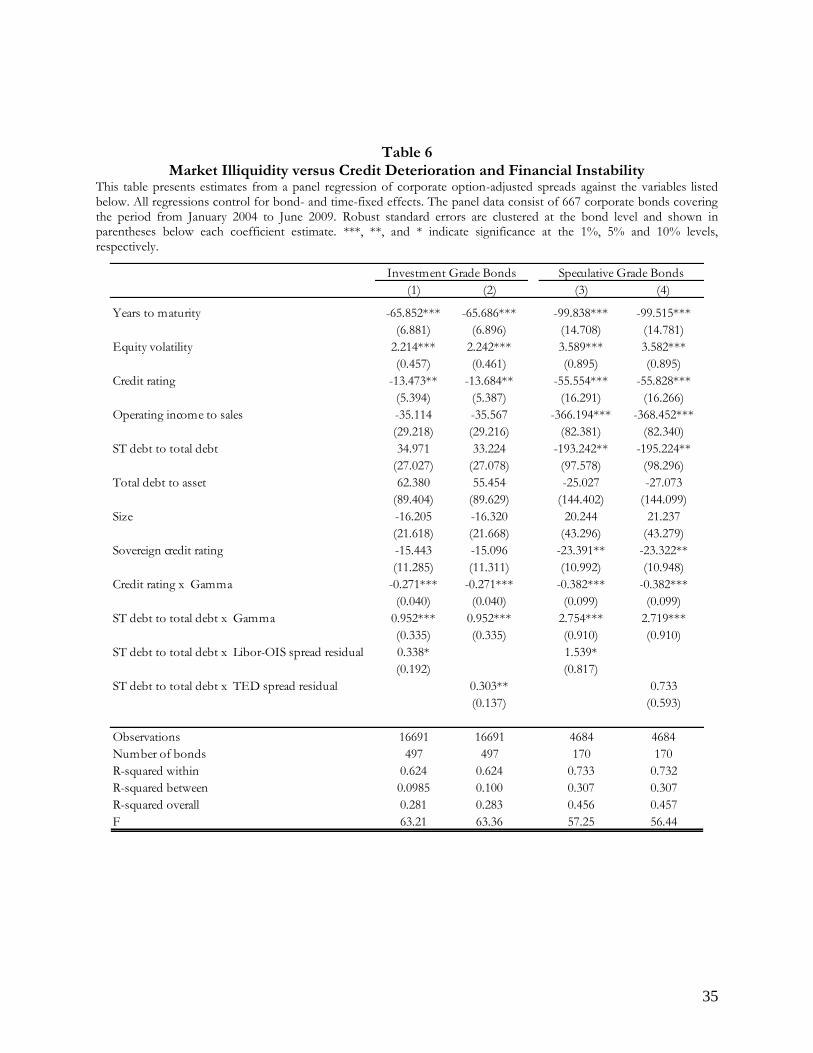
5.2. Is debt market illiquidity a proxy for credit deterioration?
Another possibility is that my debt market illiquidity variable may pick up other
contemporaneous variables (e.g., systemic credit risk deterioration). To rule this possibility out, I
augment my baseline regression with the interaction of the short-term debt to total debt ratio with
two variables. The first variable is the three-month Libor-OIS spread, which is the difference
between the London inter-bank offer rate and the overnight index swap rate. The second variable is
the three-month TED spread, which is the difference between the interest rate on inter-bank loans
and the ‘T-bills’ rate. It is generally understood that these spreads contain both liquidity and default
premiums. For example, Schwarz (2009) decomposes the Libor-OIS spread on market illiquidity and
credit risk, finding that market illiquidity explains more than two-thirds of the widening of the euro
Libor-OIS spread.
To account for the close relationship between these two spreads and market illiquidity, I include
only the part of these measures that is unrelated to the liquidity premium. To this end, I first regress
each measure of my debt market illiquidity variable and then use the residual from that equation in
my baseline regression. The resulting residual retains all the financial information except market
illiquidity.
Table 6 presents the results of my augmented regressions. Once again, my main results remain
qualitatively unchanged, and my coefficient of interest remains highly significant. In addition, the
positive coefficients on ‘ST Debt/Debt x Libor-OIS spread residual’ and ‘ST Debt/Debt x TED spread
20
residual’ suggest that the systematic credit risk’s impact on spreads is also exacerbated by the short-
term debt to total debt ratio.
[Insert Table 6 about here.]
5.3. Instrumental variables generalized method of moments (IV-GMM) estimation
As firms may choose their maturity debt structure to balance the smaller borrowing costs and
rollover losses usually associated with short-term borrowing and according to their credit risk
profiles and other firm characteristics (Diamond, 1991; Barclay and Smith, 1995), the choice of the
firm’s debt structure is an endogenous decision. To control for potential reverse causality, I replicate
my baseline specifications using a two-step efficient IV-GMM estimator.13
The instrumental variables approach implemented in this paper is based on two observations.
First, leverage ratios and maturity debt structures appear to be stationary. Several empirical studies
support the existence of a pre-established target in leverage and short-term debt to total debt ratios
(Antoniou et. al, 2006; Jalilvand and Harris, 1984; Opler and Titman, 1997; Deesomsak et. al, 2009).
In addition, Barclay and Smith (1995) show that it is the variation between firms that provides
explanatory power in regressions on the determinants of the firm’s debt maturity structure: they
obtain adjusted R2s of 0.16 and 0.26 in pooled and cross-sectional regressions with a much smaller
13 The efficiency gains of this estimator relative to the traditional IV/2SLS estimator is derived from the use of the optimal weighting matrix, the over-identification restrictions of the model, and the relaxation of the identical and independently distributed assumptions.

21
R2 of 0.02 in fixed effects regressions when the explanatory power of the fixed effects is excluded. 14
Second, the recent financial crisis was largely unexpected. Therefore, it is unlikely that the short-term
debt to total debt ratios before the crisis reflected risks associated with the financial crisis. This
should be particularly true in the sample of countries covered in this study, which excludes the U.S.
and England.
In light of these observations, I estimate my baseline specifications using a two-step efficient IV-
GMM estimator for the period from January 2007 to June 2009. I instrument short-term debt to
total debt and its interaction with debt market illiquidity with the firm-fixed effects from a regression
of short-term debt to total debt on firm dummies and with the three- and six-month lags of the
interaction between debt market illiquidity and the same firm-fixed effects. The firm-fixed effects are
estimated using the period prior to January 2007. Therefore, their values should reflect the pre-
established target in the short-term debt to total debt ratios that is unrelated to the risks associated
with the period from January 2007 to June 2009. Additionally, to reduce the potential endogeneity of
my control variables, I use three-month lags for all the independent variables.
Table 7 reports the results for the second-stage of the two-step efficient IV-GMM estimator for
the regressions reported in columns 1 and 6 in Table 3. The results remain largely unchanged from
my previous results. The table also presents the F-test and R-squared of the excluded instruments
and the p-values for the Hansen’s J test of over-identifying restrictions (Baum, Schaffer, and
Stillman, 2003). The F-test and R-squared of the excluded instruments indicates that the instruments
and endogenous variables are correlated, even after netting out the effects of all other exogenous
14 The sample used in this study appears to be consistent with this observation. In fact, firm-fixed effects can explain most of the variance of the short-term debt to total debt ratios. Moreover, the statistics reported in Table 2 show that short-term to total debt ratios have been relatively stable during the entire study period.
22
variables. Furthermore, the J test cannot reject the null hypothesis that all the instruments are valid.
Overall, the entire set of robustness checks presented in this paper suggests that it is unlikely that the
main results in this paper are driven by endogeneity bias.
[Insert Table 7 about here.]
5. Conclusions
This paper demonstrates that the impact of debt market illiquidity on corporate bond spreads is
exacerbated with a higher proportion of short-term debt through a rollover risk channel. This effect
is present in both investment-grade and speculative-grade bonds, is stronger in speculative-grade
bonds and is smaller in the banking sector. In addition, the rollover risk channel is able to explain an
important proportion of the divergence of corporate bonds across firms and sectors during the
financial crisis of 2007 to 2009. The paper’s major findings are consistent with the predictions of
recent structural credit risk models and contribute to the empirical literature on the modeling of
corporate bond spreads around periods of market illiquidity. Although the impact of debt market
illiquidity on corporate bonds spreads through rollover risk appears important, this channel has been
ignored in prior empirical studies.

23
Appendix A Description Debt Market Illiquidity Measures
The Gamma measure
The Gamma measure is the negative of the autocovariance of price changes. The construction of
this measure is based on the fact that illiquidity arises from market frictions and that its impact on
the markets is transitory. Given that transitory price movements produce negative serially correlated
price changes, the Gamma measure creates a meaningful measure of debt market illiquidity that
captures the impact of illiquidity on prices. This paper uses the aggregated Gamma measure that is
obtained by aggregating the Gamma measure across individual bonds. This measure is adopted from
Bao, Pan, and Wang (2011), who construct it using information of the U.S. secondary corporate
bond markets from the TRACE dataset.
The Noise measure
The Noise measure is the aggregation of the price deviations across all bonds. These deviations
are constructed by calculating the root mean squared distance between the market yields and the
yields from a smooth zero-coupon yield curve. The main concept behind this measure is that the
lack of arbitrage capital reduces the power of arbitrage, and assets can be traded at prices deviating
from their fundamental values. Therefore, this ‘noise’ in prices contains important information
about the amount of liquidity in the aggregate market. This measure is adopted from Hu, Pan, and
Wang (2011), who analyze ‘noise’ in the prices of U.S. Treasury bonds.

24
The On/off-the-run U.S. Treasury spread
The On/off-the-run U.S. Treasury spread is the spread between the yield of on-the-run and off-
the-run U.S. Treasury bonds. Although the issuer of both types of bonds is the same, in general, on-
the-run bonds trade at a higher price than similar off-the-run bonds due to the greater liquidity and
specialness of the on-the-run bonds in the repo markets. This specialness refers to the fact that
holders of on-the-run Treasury bonds are frequently able to pledge them as collateral and borrow in
the repo market at considerably lower interest rates than those of similar loans collateralized by off-
the-run Treasury bonds (Sundaresan and Wang, 2009). I compute the On/off-the-run U.S. Treasury
spread using 10-year bonds, given that the spread tends to be very small and noisy at smaller
maturities. The data sources used in the construction of this spread are Gürkaynak et al. (2007) and
the Board of Governors of the Federal Reserve System.
The Supranational AAA spread
The Supranational AAA spread is the yield spread between supranational AAA bonds and U.S.
Treasury bonds. Because U.S. Treasury and supranational bonds are traditionally considered ‘safe
havens’ due to their negligible default risks and U.S. Treasury bonds are, in general, the most liquid
bonds, any difference between supranational AAA bonds and U.S. Treasury bonds should be driven
mainly by the liquidity premium. I compute the Supranational AAA spread using bond yield indexes
from BofA Merrill Lynch. The yield indexes considered include U.S. dollar denominated bonds with
a time to maturity of between 1 and 3 years.
25
The KfW spread
The KfW spread is the spread between KfW bonds and German governmental bonds. As KfW
bonds are bonds supported by the explicit guarantee of the German federal government, the KfW
spread represents the liquidity premium that investors are willing to pay for the greater liquidity of
the federal government bonds in comparison to KfW bonds. The KfW spread is denominated in
euros and is computed using two-year bonds. This spread is adopted from Schwarz (2010).
26
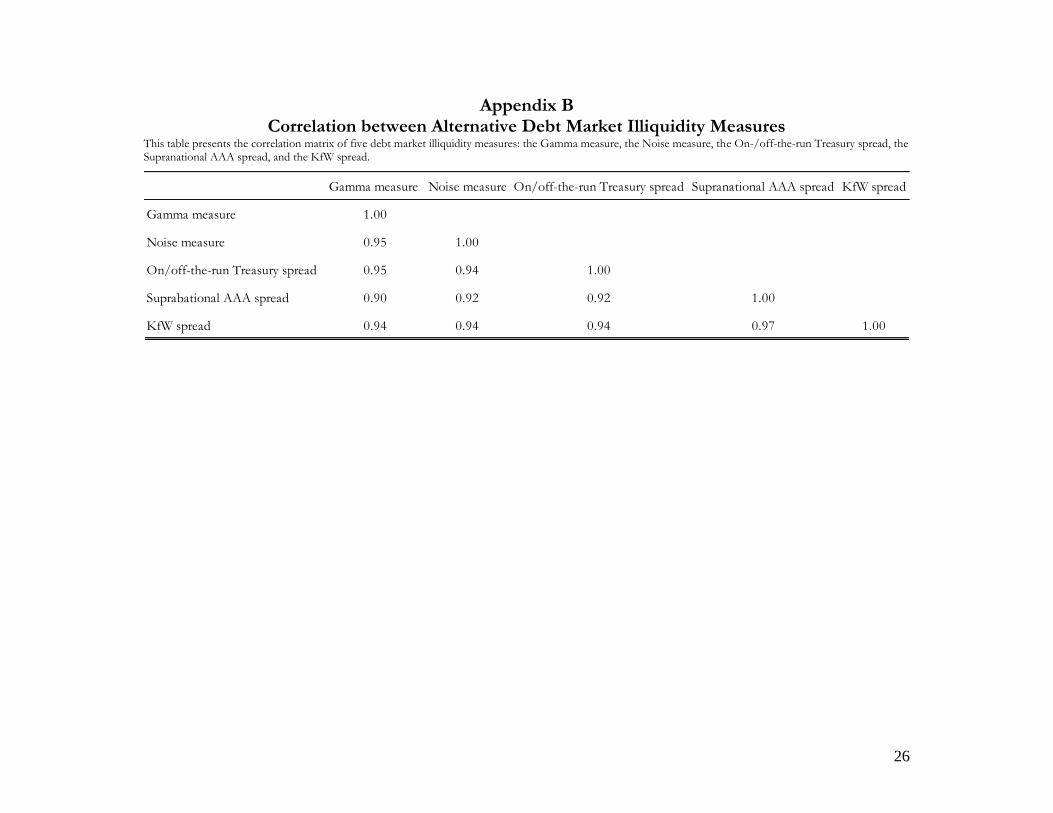
Appendix B Correlation between Alternative Debt Market Illiquidity Measures
This table presents the correlation matrix of five debt market illiquidity measures: the Gamma measure, the Noise measure, the On-/off-the-run Treasury spread, the Supranational AAA spread, and the KfW spread.
Gamma measure Noise measure On/off-the-run Treasury spread Supranational AAA spread KfW spread
Gamma measure 1.00
Noise measure 0.95 1.00
On/off-the-run Treasury spread 0.95 0.94 1.00
Suprabational AAA spread 0.90 0.92 0.92 1.00
KfW spread 0.94 0.94 0.94 0.97 1.00

27
Appendix C Description of Variables
This table describes the variables used in the empirical model, presenting the variables’ names, descriptions, units, and sources. '
Name Description Unit Source
Bond spread Option-adjusted spread Basis points Bloomberg Years to maturity Years to maturity Years Bloomberg Issue size Amount issued US$ (in log ) Bloomberg Coupon rate Coupon bond Basis points Bloomberg Equity volatility Volatility is the standard deviation of the day-to-day
logarithmic price changes. A previous day’s 180-day price volatility equals the annualized standard deviation of the relative price change of the most recent trading day’s closing price, expressed in a percentage for the day prior to the current.
Percent Bloomberg
Credit rating Standard and Poor's firm rating, long-term debt, foreign currency
(1=D, …, 21=AAA) S&P
Operating income to sales Operating income divided by net sales Ratio Bloomberg ST debt to total debt Short-term debt divided by total debt Ratio Bloomberg Total debt to assets Total debt divided by total assets Ratio Bloomberg Size Total assets Millions of US$ (in log ) Bloomberg Sovereign credit rating Standard and Poor's sovereign rating, long-term debt,
foreign currency (1=D, …, 21=AAA) S&P
Gamma measure Negative of the autocovariance of price changes Basis points Bao, Pan and Wang (2010) Noise measure Root mean squared distance between the market yields and
the yields from a smooth zero-coupon yield curve Basis points Hu, Pan and Wang (2011)
On/Off-the-run treasury spread Difference between the yield to maturity of 10 years of off-the- run and on-the-run treasury bonds
Basis points Board of Governors of the Federal Reserve System
Supranational AAA spread Difference between the supranational AAA 1-3-year yield index and the treasury 1-3-year yield index
Basis points DataStream
KfW spread Difference between 2-year KfW bonds and German federal government bonds
Basis points Schwarz (2010)
Libor-OIS spread Spread between the three-month OIS rates and LIBOR rates Basis points Bloomberg Ted spread Difference between the three-month U.S. treasury bill rate
and the three-month London Interbank Borrowing Rate (LIBOR)
Basis points Bloomberg

28
References Allen, F., Qian, J., Carletti, E. and Valenzuela, P. (2012). Financial Intermediation, the Credit
Markets and Alternative Financial Systems, in: by G. Constantinides, M. Harris and R. Stulz (eds.), The Handbook of the Economics of Finance, North-Holland, Amsterdam.
Antoniou, A., Guney, Y. and Paudyal, K. (2006). The determinants of debt maturity structure: Evidence from France, Germany and the UK, European Financial Management 12, 161-194.
Barclay, M. and Smith, C. (1995). The maturity structure of corporate debt, Journal of Finance 50, 609-631.
Baum, C., Schaffer, M. and Stillman, S. (2003). Instrumental variables and GMM: Estimation and testing, The Stata Journal 3, 1-31.
Bao, J., Pan, J. and Wang, J. (2010). The illiquidity of corporate bonds, Journal of Finance 66, 911-946.
Becchetti, L., Carpentieri, A. and Hasan, I. (2012). Option-adjusted delta credit spreads: a cross-country analysis, European Financial Management 18, 183-217.
Campbell, J. and Taksler, G. (2003). Equity volatility and corporate bond yields, Journal of Finance 58, 2321-2349.
Cavallo, E. and Valenzuela, P. (2010). The determinants of corporate risk in emerging markets: An option-adjusted spread analysis, International Journal of Finance and Economics 15, 59-74.
Chen, L., Lesmond, D. and Wei, J. (2007). Corporate yield spreads and bond liquidity, Journal of Finance 62, 119-149.
Chordia, T., Sarkar, A. and Subrahmanyam, A. (2005). An Empirical analysis of stock and bond market liquidity, Review of Financial Studies 18, 85-129.
Collin-Dufresne, P., Goldstein, R., Spencer, J. (2001). The determinants of credit spread changes, Journal of Finance 56, 2177-2208.
Covitz, D. and Downing, C. (2007). Liquidity or credit risk? The determinants of very short-term corporate yield spreads, Journal of Finance 62, 2303-2327.
Diamond, D. (1991). Debt maturity structure and liquidity risk, Quarterly Journal of Economics 106, 709-737.
Deesomsak, R., Paudyal, K. and Pescetto, G. (2009). Debt maturity structure and the 1997 Asian financial crisis, Journal of Multinational Financial Management 19, 26-42.
Fabozzi, F. (2006). Fixed Income Mathematics: Analytical and Statistical Techniques, Fourth Edition. Mc Graw Hill Publising.
Gopalan, R., Song, F. and Yerramilli, V. (2010). Debt maturity structure and credit quality, Working paper, Washington University.

29
Gozzi, J., Levine, R., Martinez, M. and Schmukler, S. (2012). How firms use domestic and international corporate bond markets, NBER Working Paper 17763.
Gozzi, J., Levine, R. and Schmukler, S. (2010). Patterns of international capital raisings, Journal of International Economics 80, 45-47.
Gürkaynak, R., Sack, B. and Wright, J. (2007). The U.S. Treasury yield curve: 1961 to the present, Journal of Monetary Economics 54, 2291-2304.
Hausmann, R. and Panizza, U. (2010). Redemption or abstinence? Original sin, currency mismatches and counter-cyclical policies in the new millennium, Working Paper 194, Centre for International Development at Harvard University.
He, Z. and Xiong, W. (2012). Rollover risk and credit risk, Journal of Finance 67, 391-429.
Hu, X. (2010). Rollover risk and credit spreads in the financial crisis of 2008, Working paper, Princeton University.
Hu, X., Pan, J. and Wang, J. (2011). Noise as information for illiquidity, Working paper, MIT.
Huang, J. and Kong, W. (2003). Explaining credit spread changes: New evidence from option-adjusted bond indexes, Journal of Derivatives 11, 30-44.
Jalilvand, A. and Harris, R. (1984). Corporate behavior in adjusting to capital structure and dividend targets: An econometrics study, Journal of Finance 39, 127-145.
Leland, H. and Toft, K. (1996). Optimal capital structure, endogenous bankruptcy, and the term structure of credit spreads, Journal of Finance 51, 987-1019.
Löffler, G. (2004). An anatomy of rating through the cycle, Journal of Banking and Finance 28, 695–720.
Merton, R. (1974). On the pricing of corporate debt: The risk structure of interest rates, Journal of Finance 29, 449-470.
Opler, T. and Titman, S. (1997). The debt-equity choice: An analysis of issuing firms, Working paper, Ohio State University.
Pedrosa, M. and Roll, R. (1998). Systematic risk in corporate bond credit spreads, Journal of Fixed Income 8, 7-26.
Schwarz, K. (2009). Mind the gap: Disentangling credit and liquidity in risk spreads, Working paper, Columbia University
Sundaresan, S. and Wang, Z. (2009). Y2K and liquidity premium in treasury bond markets, Review of Financial Studies 22, 1021-1056.
30
Table 1 Average Corporate Option-Adjusted Spreads
Using panel data between January 2004 and June 2009, this table reports corporate option-adjusted spreads in basis points by credit rating and years to maturity. All the bonds are denominated in U.S. dollars. The table reports option-adjusted spreads for the periods before and after the Lehman Brothers bankruptcy.
AAA AA A BBB BB B
Short maturity (0-3 years) 65 87 94 142 290 472
Medium maturity (3-7 years) 40 89 98 130 264 403
Long maturity (7-15 years) 92 82 98 150 302 414
Short maturity (0-3 years) 172 265 309 514 871 1152
Medium maturity (3-7 years) 118 247 335 420 827 939
Long maturity (7-15 years) 271 335 429 747 1200
S&P Credit Rating
Corporate bond spreads (bps)
January 2004 - December 2007
January 2008 - June 2009

31
Table 2 Sample Characterization
Using panel data between January 2004 and June 2009, this table presents simple averages by year of the variables considered in the empirical model. N corresponds to the total number of observations for each year.
Variables 2004 2005 2006 2007 2008 2009 2004-2009
Bond spreads (OAS) 169.53 156.36 146.81 158.88 406.22 574.75 271.87
Years to maturity 8.51 7.59 6.68 5.86 5.18 4.65 6.17
Issue size 19.39 19.29 19.17 19.20 19.29 19.32 19.26
Coupon rate 683.06 663.68 646.93 640.12 643.72 635.87 648.92
Equity volatility 27.07 25.89 27.96 27.90 44.98 72.92 37.48
Credit rating 13.60 13.55 13.94 14.33 14.24 14.22 14.05
Operating income to sales 0.17 0.18 0.17 0.15 0.12 0.08 0.14
ST debt to total debt 0.18 0.21 0.24 0.27 0.27 0.25 0.25
Total debt to asset 0.31 0.31 0.33 0.34 0.33 0.33 0.33
Size 9.78 9.86 10.15 10.47 10.59 10.58 10.31
Sovereign credit rating 19.29 19.03 19.07 19.10 19.14 19.10 19.11
Gamma measure 31.35 25.34 22.87 39.20 131.60 173.54 73.87
Noise measure 2.07 1.93 1.58 2.45 9.37 10.19 4.91
Supranational AAA spread 19.20 17.07 17.27 29.82 84.19 92.74 49.06
On/off-the-run U.S. Treasury spread 24.57 8.46 3.94 10.31 41.51 55.44 23.81
KfW spread 16.02 49.17 61.85 38.96
32
Table 3 Corporate Bond Spreads and Rollover Risk
This table presents estimates from a panel regression of corporate option-adjusted spreads against the variables listed below. All regressions control for bond- and time-fixed effects. The panel data consist of 667 corporate bonds covering the period from January 2004 to June 2009. Robust standard errors are clustered at the bond level and shown in parentheses below each coefficient estimate. ***, **, and * indicate significance at the 1%, 5% and 10% levels, respectively.
(1) (2) (3) (4) (5) (6) (7) (8) (9) (10)
Years to maturity -65.844*** -50.564*** -217.070*** -101.972*** -250.743*** -97.652*** -91.752*** -307.159*** -170.485*** -331.546***
(6.883) (5.103) (20.615) (10.414) (25.074) (14.602) (12.774) (37.561) (20.564) (49.922)
Equity volatility 2.172*** 2.125*** 2.217*** 2.209*** 2.383*** 3.634*** 3.528*** 3.629*** 3.604*** 4.080***
(0.453) (0.447) (0.460) (0.463) (0.518) (0.897) (0.900) (0.888) (0.938) (1.114)
Credit rating -13.166** -15.144*** -8.893 -7.374 -16.697* -55.154*** -55.788*** -42.333*** -31.742* -49.981
(5.414) (5.742) (5.457) (6.461) (9.740) (16.354) (16.357) (15.793) (18.134) (38.929)
Operating income to sales -35.341 -36.953 -35.399 -39.158 -31.026 -377.988*** -374.221*** -378.291*** -385.013*** -519.772***
(29.206) (30.068) (28.613) (29.200) (33.616) (80.500) (79.790) (81.515) (85.354) (111.785)
ST debt to total debt 36.162 52.863* 31.555 40.663 87.500 -177.886* -198.808** -191.975** -251.085** -348.944**
(26.942) (29.086) (26.144) (30.733) (67.570) (97.030) (96.002) (89.832) (104.890) (143.250)
Total debt to asset 68.023 62.146 59.499 64.494 -12.133 -38.592 -40.610 -41.546 -72.443 -464.630**
(89.808) (92.517) (90.944) (103.449) (206.759) (144.024) (144.700) (141.773) (152.352) (219.497)
Size -15.896 -15.631 -18.025 -21.416 -44.401 21.677 18.589 25.012 27.735 15.689
(21.581) (21.861) (21.819) (25.046) (43.534) (43.161) (43.138) (43.732) (49.551) (106.706)
Sovereign credit rating -15.798 -12.757 -18.747* -24.369* -63.446* -22.948** -23.700** -16.060 -31.958*** -62.921**
(11.258) (11.159) (11.319) (13.204) (32.399) (10.898) (11.211) (11.533) (12.253) (29.192)
Credit rating x Gamma -0.271*** -0.381***
(0.040) (0.099)
ST debt to total debt x Gamma 0.953*** 2.616***
(0.335) (0.918)
Credit rating x Noise -3.647*** -5.924***
(0.528) (1.511)
ST debt to total debt x Noise 10.931** 45.553***
(4.787) (13.963)
Credit rating x On/Off-the-run-Treasury spread -0.952*** -1.577***
(0.139) (0.314)
ST debt to total debt x On/Off-the-run-Treasury spread 3.151*** 7.677***
(1.159) (2.749)
Credit rating x Supranational AAA spread -0.563*** -0.969***
(0.080) (0.189)
ST debt to total debt x Supranational AAA spread 1.812*** 4.824***
(0.677) (1.782)
Credit rating x KfW spread -1.021*** -1.088***
(0.134) (0.390)
ST debt to total debt x KfW spread 3.053*** 10.673***
(1.105) (2.915)
Observations 16691 16691 16563 15239 9685 4684 4684 4652 4319 2592
Number of bonds 497 497 497 493 469 170 170 170 166 151
R-squared within 0.624 0.618 0.624 0.624 0.598 0.732 0.734 0.734 0.737 0.738
R-squared between 0.097 0.171 0.006 0.022 0.001 0.311 0.328 0.026 0.150 0.034
R-squared overall 0.281 0.359 0.024 0.158 0.037 0.462 0.475 0.099 0.298 0.125
F 64.41 62.49 64.18 72.75 72.83 56.10 57.52 58.20 60.30 47.44
Investment Grade Bonds Speculative Grade Bonds
33
Table 4 Alternative Subsamples
This table presents estimates from a panel regression of corporate option-adjusted spreads against the variables listed below. All regressions control for bond- and time-fixed effects. The panel data consist of 667 corporate bonds covering the period from January 2004 to June 2009. Robust standard errors are clustered at the bond level and shown in parentheses below each coefficient estimate. ***, **, and * indicate significance at the 1%, 5% and 10% levels, respectively.
Banks Non-Banks Pre-Crisis Crisis Bonds without Bonds with Quarterly
Period Period embedded options embedded options data
(1) (2) (3) (4) (5) (6) (7)
Years to maturity -111.116*** -83.461*** -46.290*** -176.085*** -92.544*** -90.932*** -120.257***
(15.120) (5.775) (6.734) (14.077) (9.038) (6.183) (6.462)
Equity volatility 0.408 3.713*** 2.070*** 1.667*** 2.617*** 2.869*** 2.482***
(0.497) (0.589) (0.434) (0.463) (0.589) (0.595) (0.372)
Credit rating 0.132 -33.045*** -11.164*** -35.688** -8.384 -33.937*** -20.444***
(8.233) (8.530) (3.951) (15.783) (10.970) (9.634) (6.408)
Operating income to sales -163.019*** -64.445** -7.348 -179.105*** -33.951 -137.526** -60.700**
(56.028) (29.454) (6.129) (44.840) (26.135) (57.904) (24.376)
ST debt to total debt -45.269 -83.442** -44.244*** 173.829 -58.918 53.258 4.169
(49.888) (41.585) (13.707) (107.447) (48.035) (41.574) (30.998)
Total debt to asset 112.767 -6.990 242.045*** -224.813 225.628* 98.184 226.947***
(77.764) (97.095) (39.166) (222.566) (132.311) (86.233) (63.499)
Size -81.832* -10.100 4.387 -37.338 27.324 -16.826 11.997
(46.571) (20.669) (11.255) (74.402) (43.608) (20.491) (19.119)
Sovereign credit rating -60.056* -20.098*** -14.398*** -68.862** -25.186*** -31.125 -26.284***
(31.758) (7.766) (4.135) (32.742) (9.056) (20.077) (8.120)
Credit rating x Gamma -0.375*** -0.394*** -0.300*** -0.384*** -0.443*** -0.383*** -0.498***
(0.064) (0.025) (0.049) (0.027) (0.040) (0.030) (0.031)
ST debt to total debt x Gamma 1.289*** 3.090*** 1.741*** 1.524*** 1.177*** 1.852*** 1.856***
(0.476) (0.601) (0.327) (0.283) (0.426) (0.476) (0.331)
Observations 4,099 17,276 13,286 8,089 9,010 12,365 7,304
Number of bonds 165 446 445 573 280 331 611
R-squared within 0.702 0.684 0.380 0.565 0.646 0.705 0.701
R-squared between 0.231 0.377 0.180 0.206 0.207 0.340 0.167
R-squared overall 0.263 0.440 0.176 0.234 0.329 0.405 0.286
F 250.7 48.04 35.12 72.88 57.77 47.80 90.39

34
Table 5 Alternative Nonlinear Effects of Market Illiquidity
This table presents estimates from a panel regression of corporate option-adjusted spreads against the variables listed below. All regressions control for bond- and time-fixed effects. The panel data consist of 667 corporate bonds covering the period from January 2004 to June 2009. Robust standard errors are clustered at the bond level and shown in parentheses below each coefficient estimate. ***, **, and * indicate significance at the 1%, 5% and 10% levels, respectively.
Investment Grade Bonds Speculative Grade Bonds
(1) (2)
Years to maturity -67.296*** -74.006***
(8.666) (20.853)
Equity volatility 1.449* 2.891**
(0.756) (1.334)
Credit rating -13.292** -51.454***
(6.100) (15.850)
Operating income to sales -38.084 -360.384***
(28.783) (77.573)
ST debt to total debt 16.728 -143.477
(25.173) (93.183)
Total debt to asset 7.774 -113.274
(104.874) (172.995)
Size -8.951 17.163
(21.884) (41.560)
Sovereign credit rating -17.037 -23.512**
(11.496) (11.301)
Credit rating x Gamma -0.232*** -0.478***
(0.032) (0.128)
ST debt to total debt x Gamma 0.949*** 2.424**
(0.349) (0.934)
Equity volatility x Gamma 0.005 0.006
(0.004) (0.008)
Total debt to asset x Gamma 0.498 0.788
(0.458) (1.100)
Size x Gamma -0.083* 0.283
(0.048) (0.181)
Years to maturity x Gamma -0.021 -0.064
(0.019) (0.064)
Observations 16691 4684
Number of bonds 497 170
R-squared within 0.627 0.735
R-squared between 0.0795 0.375
R-squared overall 0.266 0.515
F 61.57 62.49
35
Table 6 Market Illiquidity versus Credit Deterioration and Financial Instability
This table presents estimates from a panel regression of corporate option-adjusted spreads against the variables listed below. All regressions control for bond- and time-fixed effects. The panel data consist of 667 corporate bonds covering the period from January 2004 to June 2009. Robust standard errors are clustered at the bond level and shown in parentheses below each coefficient estimate. ***, **, and * indicate significance at the 1%, 5% and 10% levels, respectively.
(1) (2) (3) (4)
Years to maturity -65.852*** -65.686*** -99.838*** -99.515***
(6.881) (6.896) (14.708) (14.781)
Equity volatility 2.214*** 2.242*** 3.589*** 3.582***
(0.457) (0.461) (0.895) (0.895)
Credit rating -13.473** -13.684** -55.554*** -55.828***
(5.394) (5.387) (16.291) (16.266)
Operating income to sales -35.114 -35.567 -366.194*** -368.452***
(29.218) (29.216) (82.381) (82.340)
ST debt to total debt 34.971 33.224 -193.242** -195.224**
(27.027) (27.078) (97.578) (98.296)
Total debt to asset 62.380 55.454 -25.027 -27.073
(89.404) (89.629) (144.402) (144.099)
Size -16.205 -16.320 20.244 21.237
(21.618) (21.668) (43.296) (43.279)
Sovereign credit rating -15.443 -15.096 -23.391** -23.322**
(11.285) (11.311) (10.992) (10.948)
Credit rating x Gamma -0.271*** -0.271*** -0.382*** -0.382***
(0.040) (0.040) (0.099) (0.099)
ST debt to total debt x Gamma 0.952*** 0.952*** 2.754*** 2.719***
(0.335) (0.335) (0.910) (0.910)
ST debt to total debt x Libor-OIS spread residual 0.338* 1.539*
(0.192) (0.817)
ST debt to total debt x TED spread residual 0.303** 0.733
(0.137) (0.593)
Observations 16691 16691 4684 4684
Number of bonds 497 497 170 170
R-squared within 0.624 0.624 0.733 0.732
R-squared between 0.0985 0.100 0.307 0.307
R-squared overall 0.281 0.283 0.456 0.457
F 63.21 63.36 57.25 56.44
Investment Grade Bonds Speculative Grade Bonds

36
Table 7 IV-GMM Estimation
This table presents estimates from a panel regression of corporate option-adjusted spreads against the variables listed below. All regressions control for industry- and time-fixed effects. The panel data consist of 667 corporate bonds covering the period from January 2004 to June 2009. Each equation is estimated by IV-GMM. Short-term debt to total debt and rollover losses are instrumented with the firm-fixed effects from a regression of short-term debt to total debt on firm dummies and with the three- and six-month lags of the interaction between debt market illiquidity and the same firm-fixed effects. These firm-fixed effects are estimated from the period between January 2004 and December 2006. All independent variables are lagged three months. Robust
standard errors are clustered at the bond level and shown in parentheses below each coefficient estimate. P-values for the Hansen’s J test of over-identifying restrictions are reported. ***, **, and * indicate significance at the 1%, 5% and 10% levels, respectively.
Investment Grade Bonds Speculative Grade Bonds
(1) (2)
Years to maturity 5.933*** 14.931***
(0.663) (3.493)
Issue size -4.615*** 136.657***
(0.952) (14.789)
Coupon rate 0.093*** 0.345***
(0.014) (0.058)
Equity volatility 2.462*** 3.156***
(0.228) (0.559)
Credit rating -5.473*** -65.048***
(1.702) (7.718)
Operating income to sales -25.607* -153.838***
(15.329) (44.513)
ST debt to total debt 64.534** 459.090***
(27.297) (137.088)
Total debt to asset 28.186** 226.337***
(12.157) (76.556)
Size 1.742 2.850
(1.998) (7.875)
Sovereign credit rating -9.201*** 14.464***
(1.027) (2.790)
Credit rating x Gamma -0.226*** -0.250***
(0.022) (0.068)
ST debt to total debt x Gamma 1.267*** 2.469***
(0.351) (0.920)
Observations 8956 2264
Adjusted R-squared 0.520 0.531
F test of excluded instruments 1551 / 447 113 / 68
Partial R-squared of excluded instruments 0.4589 / 0.2327 0.1578 / 0.1317
Hansen’s J test p-value 0.462 0.306
37
Panel A: U.S. dollar-denominated AAA-AA corporate debt
0
200
400
600
800
1000
1200
1400
Dec-04 Jun-05 Dec-05 Jun-06 Dec-06 Jun-07 Dec-07 Jun-08 Dec-08 Jun-09 Dec-09 Jun-10
Basis
po
ints
(b
ps)
AAA-AA Rated Industrial 1-10 yrs
AAA-AA Rated Finance 1-10 yrs
AAA-AA Rated Banks 1-10 yrs
Panel B: U.S. dollar-denominated A-BBB corporate debt
0
200
400
600
800
1000
1200
1400
Dec-04 Jun-05 Dec-05 Jun-06 Dec-06 Jun-07 Dec-07 Jun-08 Dec-08 Jun-09 Dec-09 Jun-10
Basis
po
ints
(b
ps)
A-BBB Rated Industrial 1-10 yrs
A-BBB Rated Finance 1-10 yrs
A-BBB Rated Banks 1-10 yrs
Figure 1. Bank of America (BofA) Merrill Lynch Corporate Option-Adjusted Spread Indexes by Sector. Panel A of the figure depicts option-adjusted spread indexes of the U.S. dollar-denominated AAA-AA corporate debt publicly issued by corporations in the industrial, financial, and banking sectors. Panel B of the figure shows option-adjusted spread indexes of the U.S. dollar-denominated A-BBB corporate debt publicly issued by corporations in the industrial, financial, and banking sectors.

38
0
50
100
150
200
250
300
350
400
450
500
Dec-04 Jun-05 Dec-05 Jun-06 Dec-06 Jun-07 Dec-07 Jun-08 Dec-08
Weighted average AAA corporate bonds BofA Merrill Lynch AAA corporate index
Correlation=0.956
0
100
200
300
400
500
600
Dec-04 Jun-05 Dec-05 Jun-06 Dec-06 Jun-07 Dec-07 Jun-08 Dec-08 Jun-09
Weighted average AA corporate bonds BofA Merrill Lynch AA corporate index
0
100
200
300
400
500
600
700
Dec-04 Jun-05 Dec-05 Jun-06 Dec-06 Jun-07 Dec-07 Jun-08 Dec-08 Jun-09
Weighted average A corporate bonds BofA Merrill Lynch A corporate index
0
100
200
300
400
500
600
700
800
900
Dec-04 Jun-05 Dec-05 Jun-06 Dec-06 Jun-07 Dec-07 Jun-08 Dec-08 Jun-09
Weighted average BBB corporate bonds BofA Merrill Lynch BBB corporate index
0
200
400
600
800
1000
1200
1400
1600
Dec-04 Jun-05 Dec-05 Jun-06 Dec-06 Jun-07 Dec-07 Jun-08 Dec-08 Jun-09
Weighted average BB corporate bonds BofA Merrill Lynch BB corporate index
0
500
1000
1500
2000
2500
Dec-04 Jun-05 Dec-05 Jun-06 Dec-06 Jun-07 Dec-07 Jun-08 Dec-08 Jun-09
Weighted average B corporate bonds BofA Merrill Lynch B corporate index
Correlation=0.992
Correlation=0.994
Correlation=0.985
Correlation=0.982
Correlation=0.959
Figure 2. Corporate Option-Adjusted Spreads. For each credit rating category, the panels in the figure depict the weighted average OASs calculated from the bond-level data used in this paper along with the Bank of America (BofA) Merrill Lynch OAS indexes. The AAA, AA, A, and BBB U.S. Corporate Indexes are a subset of the BofA Merrill Lynch U.S. Corporate Index, which include securities with an investment-grade rating and an investment-grade-rated country of risk. The BB and B U.S. High Yield Indexes are a subset of the BofA Merrill Lynch U.S. High Yield Index, which includes securities with a lower than investment-grade rating and an investment-grade-rated country of risk. Simplecorrelations between both indexes are reported for each credit rating category.