Corporate yield spreads and real interest ratesroseliao.business.rutgers.edu/BJL_IRFA 2014.pdf ·...
12
Corporate yield spreads and real interest rates Jonathan A. Batten a,1 , Gady Jacoby b , Rose C. Liao c a Department of Finance, Monash University, Caulfield Campus, PO Box 197, Caulfield East, Victoria 3145, Australia b Department of Accounting and Finance, I.H. Asper School of Business, University of Manitoba, Winnipeg, MB R3T 5V4, Canada c Department of Finance Economics, Rutgers Business School, 111 Washington Street Newark, NJ 07102, United States abstract article info Article history: Received 6 February 2014 Received in revised form 26 May 2014 Accepted 30 May 2014 Available online 5 June 2014 JEL classification: C22 C13 C53 G12 Keywords: Credit spreads Corporate bonds Real interest rates Reduced-form models Structural models The effect of inflation on the credit spreads of corporate bonds is investigated utilising real instead of nominal interest rates in extensions of the models proposed by Longstaff and Schwartz (1995) and Collin-Dufresne et al. (2001). Inflation is a critical, non-default, component incorporated in nominal bond yields, whose effect has not been considered by existing credit spread theory. In this sense the only true test of models of credit spread pricing must utilise real rates. To illustrate these requirements the Canadian bond data of Jacoby, Liao, and Batten (2009) is utilised. This Canadian data accommodates callability and the tax effects otherwise present in U.S. bond markets. The relation with historical default rates of both U.S. and Canadian bonds is also investigated since this approach is clean of both callability and tax effects. Overall, the analysis provides additional insights into the theoretical drivers of credit spreads as well as helping to explain observed corporate bond yield behaviour in financial markets. © 2014 Elsevier Inc. All rights reserved. 1. Introduction Much attention in recent years has been directed towards the catastrophic impact information opacity and design complexity present in credit derivatives has had on the valuations of financial institutions and subsequently on the real economy. This was especially the case during the 2007–2009 Global Financial Crisis (Avino, Lazar, & Varotto, 2013; Dabrowski, 2010; Domler, 2013; Gorton, 2009; van Rixtel & Upper, 2012). As noted by Longstaff, Mithal, and Neis (2005), many simple questions concerning the underlying pricing and trading of credit based derivatives and securities in corporate bond markets remain unanswered. For exam- ple, how do financial markets price corporate debt and what proportion of the bond yield above the equivalent maturity risk-free bond – termed the credit spread – is due to default risk? What effect do non-default com- ponents, such as inflation, have on the pricing of credit spreads? Inflation is a critical non-default component incorporated in corporate bond yields that has not been previously recognised in theoretical models of corporate credit spread behaviour. In this sense the only true test of the various theoretical models should utilise real rates not nominal rates. Motivated by these insights, the objective of this study is to investi- gate this last issue by identifying and then separating the inflation component of corporate bond yields prior to the investigation and modelling of credit spreads. We begin by updating and reviewing the existing literature on credit spread modelling, thereby provid- ing clear insights into the theoretical drivers of credit spreads. Our contribution adds to the earlier work by Jacoby et al. (2009) by better explaining the observed corporate bond yield behaviour in financial markets, which has been shown by many other authors to include factors other than compensation for credit and liquidity risk (e.g. Breitenfellner & Wagner, 2012; Collin-Dufresne, Goldstein, & Helwege, 2010; Eom, Helwege, & Huang, 2004; Loncarski & Szilagyi, 2012; Ronen & Zhou, 2013). In a key empirical paper, Longstaff and Schwartz (1995) extend the Merton (1974) model of corporate default to allow the testing of credit spreads using Moody's indexed U.S. bond yields. One of the more notable predictions of the Merton model is that the change in the credit spread is negatively correlated to the return on risky assets and changes in default-free interest rates. While the Longstaff and Schwartz (1995) results are consistent with this theoretical view, Duffee (1998) argued International Review of Financial Analysis 34 (2014) 89–100 E-mail addresses: [email protected] (J.A. Batten), [email protected] (G. Jacoby), [email protected] (R.C. Liao). 1 Tel.: +61 3 9555 3160. http://dx.doi.org/10.1016/j.irfa.2014.05.009 1057-5219/© 2014 Elsevier Inc. All rights reserved. Contents lists available at ScienceDirect International Review of Financial Analysis
Transcript of Corporate yield spreads and real interest ratesroseliao.business.rutgers.edu/BJL_IRFA 2014.pdf ·...
International Review of Financial Analysis 34 (2014) 89–100
Contents lists available at ScienceDirect
International Review of Financial Analysis
Corporate yield spreads and real interest rates
Jonathan A. Batten a,1, Gady Jacoby b, Rose C. Liao c
a Department of Finance, Monash University, Caulfield Campus, PO Box 197, Caulfield East, Victoria 3145, Australiab Department of Accounting and Finance, I.H. Asper School of Business, University of Manitoba, Winnipeg, MB R3T 5V4, Canadac Department of Finance Economics, Rutgers Business School, 111 Washington Street Newark, NJ 07102, United States
E-mail addresses: [email protected] (J.A. [email protected] (G. Jacoby), rliao@andromeda
1 Tel.: +61 3 9555 3160.
http://dx.doi.org/10.1016/j.irfa.2014.05.0091057-5219/© 2014 Elsevier Inc. All rights reserved.
a b s t r a c t
a r t i c l e i n f oArticle history:Received 6 February 2014Received in revised form 26 May 2014Accepted 30 May 2014Available online 5 June 2014
JEL classification:C22C13C53G12
Keywords:Credit spreadsCorporate bondsReal interest ratesReduced-form modelsStructural models
The effect of inflation on the credit spreads of corporate bonds is investigated utilising real instead of nominalinterest rates in extensions of the models proposed by Longstaff and Schwartz (1995) and Collin-Dufresneet al. (2001). Inflation is a critical, non-default, component incorporated in nominal bond yields, whose effecthas not been considered by existing credit spread theory. In this sense the only true test ofmodels of credit spreadpricingmust utilise real rates. To illustrate these requirements the Canadian bond data of Jacoby, Liao, and Batten(2009) is utilised. This Canadian data accommodates callability and the tax effects otherwise present in U.S. bondmarkets. The relation with historical default rates of both U.S. and Canadian bonds is also investigated since thisapproach is clean of both callability and tax effects. Overall, the analysis provides additional insights into thetheoretical drivers of credit spreads as well as helping to explain observed corporate bond yield behaviour infinancial markets.
© 2014 Elsevier Inc. All rights reserved.
1. Introduction
Much attention in recent years has been directed towards thecatastrophic impact information opacity and design complexity presentin credit derivatives has had on the valuations of financial institutionsand subsequently on the real economy. This was especially the caseduring the 2007–2009 Global Financial Crisis (Avino, Lazar, & Varotto,2013; Dabrowski, 2010; Domler, 2013; Gorton, 2009; van Rixtel &Upper, 2012).
As noted by Longstaff,Mithal, andNeis (2005),many simple questionsconcerning the underlying pricing and trading of credit based derivativesand securities in corporate bondmarkets remain unanswered. For exam-ple, how do financial markets price corporate debt and what proportionof the bond yield above the equivalent maturity risk-free bond – termedthe credit spread – is due to default risk?What effect do non-default com-ponents, such as inflation, have on the pricing of credit spreads? Inflationis a critical non-default component incorporated in corporate bond yields
atten),.rutgers.edu (R.C. Liao).
that hasnot beenpreviously recognised in theoreticalmodels of corporatecredit spread behaviour. In this sense the only true test of the varioustheoretical models should utilise real rates not nominal rates.
Motivated by these insights, the objective of this study is to investi-gate this last issue by identifying and then separating the inflationcomponent of corporate bond yields prior to the investigation andmodelling of credit spreads. We begin by updating and reviewingthe existing literature on credit spread modelling, thereby provid-ing clear insights into the theoretical drivers of credit spreads. Ourcontribution adds to the earlier work by Jacoby et al. (2009) bybetter explaining the observed corporate bond yield behaviour infinancial markets, which has been shown by many other authorsto include factors other than compensation for credit and liquidityrisk (e.g. Breitenfellner & Wagner, 2012; Collin-Dufresne, Goldstein, &Helwege, 2010; Eom, Helwege, & Huang, 2004; Loncarski & Szilagyi,2012; Ronen & Zhou, 2013).
In a key empirical paper, Longstaff and Schwartz (1995) extend theMerton (1974) model of corporate default to allow the testing of creditspreads using Moody's indexed U.S. bond yields. One of the morenotable predictions of theMertonmodel is that the change in the creditspread is negatively correlated to the return on risky assets and changesin default-free interest rates. While the Longstaff and Schwartz (1995)results are consistent with this theoretical view, Duffee (1998) argued
90 J.A. Batten et al. / International Review of Financial Analysis 34 (2014) 89–100
that since most bonds in the Moody's index are callable bonds, the neg-ative yield spread–riskless rate relation could instead be due to the ef-fect of the riskless rate on the value of the call option. More recently,Afik, Arad, and Galil (2012) also provide insights into how the choiceof expected asset return and volatility can be applied to improve thepredictability of the simple Merton (1974) model.
This issue was partly clarified in the paper by Jacoby et al. (2009)who use a unique database of Canadian bonds to control for issuercallability. Importantly, they find that once callability is accommodatedthe correlation between riskless interest rates and corporate bondspreads remains negligible. Consequently, their results provide supportfor the reduced-formmodels of Jarrow, Lando, and Turnbull (1997) andDuffie and Singleton (1999)whichmodel default as a jump event, rath-er than the structural models of Merton (1974) and Longstaff andSchwartz (1995) that explicitly define a default hazard process andthereby untie the relation between the firm's asset value and defaultprobability. However, as noted by Collin-Dufresne et al. (2010) reducedform models subsequently offer limited “out-of-sample” predictionsabout credit spreads since theymust rely upon underlying assumptionsconcerning default intensity and recovery rate dynamics. Nonetheless,jump volatility has been shown to capture low frequency movementsin credit spreads and comoves countercyclically with the price-dividend ratio and corporate default rate (Tauchen & Zhou, 2011),while defaults themselves can impact the credit spreads of survivingfirms, allowing for a greater clustering of defaults (Berndt, Ritchken, &Sun, 2010).
A critical link between these various empirical studies concernstheir use of nominal interest rates as the basis for estimating changesin both risky and riskless bond yields. In an earlier study, Fridson,Garman, and Wu (1997) suggest that any empirical investigation ofthe default risk — riskless rate relation should be undertaken usingreal rather than nominal interest rates. They argue that if the firm'srevenues are fully adjusted with respect to inflation, its effectivecost of capital is related to the real riskless rate rather than the nom-inal rate. In this context, an increase in the real riskless rate causesthe firm's cost of short-term debt to increase as well, which will inturn result in a decrease in available cash flow. These combinedeffects will inhibit the firm's ability to issue new long-term debtand thereby exacerbate the probability of default.2
In this paper we first extend these earlier papers by applyingthe regression models used by Longstaff and Schwartz (1995) inthe context of the unique Canadian bond dataset of Jacoby et al.(2009), and then accommodate the effects of time-varying volatilityand autocorrelation using an Autoregressive GARCH (AR-GARCH)setting instead of the standard Ordinary Least Squares regressionapproach that was applied in many earlier papers. Second, we com-pare the effects of credit spreadsmeasured both as absolute yield dif-ferences and as relative spreads (the ratio of the risky to risklessbond) as initially undertaken by Longstaff and Schwartz (1995) toensure that the manner of credit spread calculation does not affectthe results of model estimation.
Finally, we estimate an extended version of the Longstaff andSchwartz (1995) model, undertaken by Collin-Dufresne et al. (2001),using both nominal and real interest rates. This latermodel incorporatesthe key interest rate factors suggested by Duffee (1998) as well as anumber of macroeconomic variables that have subsequently beenused in more recent studies of credit spread behaviour (e.g. Dionne,Gauthier, Hammami, Maurice, & Simonato, 2011). We argue that it isvital that these models be estimated in the context of real interestrates given the failure of existing theory to incorporate the inflation
2 Davies (2008) also accounts for inflation in his study of the 85-year yield-spread dy-namics of AAA and BAA US corporate-bond indices. However, he still uses nominal rateswhen considering the yield spread–riskless rate relation, but conditions on inflation inhis cointegration analysis.
component present in nominal interest rates. In this sense the onlytrue test of the various theoretical models of risky credit spread pricingmust utilise real rates. There is also another important dimension tothis argument — call decisions by issuers are based on nominal ratesand not real rates, highlighting the importance of using real rates inempirical studies.
The overwhelming conclusion of themodelling that is undertaken isthat once the relationship between callability and the nominal interestrate is factored out, no relationship remains between the interest rateand the credit spread. This is in contrast to the negative relation sug-gested by structural model theory. To substantiate our contention thatthe prediction of the structural models does not hold empirically, wealso model the relation with default rates using historical default ratesof both U.S. and Canadian bonds. This approach is clean of bothcallability and tax effects (Jordan & Jordan, 1991).
The paper is organised as follows: next, the recent literature oncredit spreads is briefly reviewed; then, the data and the models usedare presented; the results and concluding comments then form theremaining sections of the paper.
2. Literature
Longstaff and Schwartz (1995) first usedMoody's indexed U.S. bondyields to investigate the theoretical model of Merton (1974). Theiranalysis, using both relative and absolute credit spreads, identified astrong negative relationship between yield spreads and Treasury yields.The two factor model of Longstaff and Schwartz (1995) is an elegantextension of the closed-form solution of Merton (1974) where defaultis a function of the value of the firm at maturity, to a simplecontinuous-time valuation framework that allows for both default andinterest rate risk. This structural model captures the stochastic natureof interest rates, where for simplicity the dynamics of the interest rateare explained using the simple term structure model of Vasicek (1977).
The key criticism by Duffee (1998) centres on the presence of call-able bonds in theMoody's index used to test the theoretical predictionsof the structuralmodels. For callable bonds, higher interest rates imply alower chance that the issuer will exercise the call option. Thus bond-holders will demand a lower yield for this call provision, which will re-sult in an overall decrease in the bond yield spread. To accommodatethe call features present in most U.S. corporate bonds Duffee (1998)constructs a noncallable bond index and regresses spread changes onchanges both in the short yield and in a term structure slope variable,for both callable and noncallable bonds. The results show that changesin the yield spread on callable bonds are strongly negatively related tochanges in Treasury yields, while on the other hand, for noncallablebonds, there is a weak, although still negative relation. These resultssuggest that the negative relationship identified by Longstaff andSchwartz (1995) in U.S. bonds could be attributed to either the defaultpremium or the effects of the call premium. Jacoby et al.'s (2009)investigation of Canadian bonds, which have no tax effects and allowcallability to be controlled, provide further empirical support forreduced-form models that untie the otherwise endogenous relationbetween the firm's asset value and default probability.
Consideration of the effect embedded options in debt may have oncredit spreads has been the subject of extensive recent investigation:Campbell and Taksler (2003) show that idiosyncratic firm-level volatil-ity affects credit spreads, leading to the conclusion that firm-levelvolatility should also affect any embedded options in debt value, whileHackbarth, Miao, and Morellec (2006) also argue that credit spreadsshould be positively correlated with the volatility of cash flowsfrom firm assets. Hwang, Min, McDonald, Kim, and Kim (2010) alsouse a credit spread as a proxy for stocks' default risk to control for thechanging non-diversifiable option-risk characteristic of stocks. Becausesensitivity to the excess credit spread becomes smaller as size increasesand as value decreases, excess credit spread explains the CAPManomalies in a fashion similar to the Fama-French factors.
3 The first publically-traded bond carrying themake-whole call provisionwas issued byQuaker State in 1995 (see Mann & Powers, 2003).
4 The reader may refer to Jacoby and Roberts (2003) for a detailed description of theSCM indices. This data was also used in the study by Jacoby et al. (2009).
91J.A. Batten et al. / International Review of Financial Analysis 34 (2014) 89–100
Other recent studies highlight the importance of liquidity on therisky yield spread, especially for short-term securities (Chen, Fabozzi,& Sverdlove, 2010; Chen, Lesmond, & Wei, 2007; Covitz & Downing,2007; Ericsson & Renault, 2006) as well as the effects of taxes. Duffee(1998) notes that while there are tax effects arising from the differenttax rates, which apply for both U.S. corporate and Treasury bonds(Jordan & Jordan, 1991), he is unable to control for the impact of thetax differential. Elton, Gruber, Agrawal, and Mann (2001) then studythe components of yield spreads for U.S. investment-grade corporatebonds, which by definition have low default risk and so should bemore sensitive to interest rate effects. In conclusion, Elton et al. (2001)warn against ignoring the tax differential when studying corporatebond yield spreads, and both Duffee (1998) and Elton et al. (2001)make a case for a pure test based on bond data with no call optionsand tax effects.
Recent extensions to these studies include analyses of the creditspreads of non-U.S. sovereign bonds,which technically should be treatedseparately to the corporate bond literature. In these papers the sovereignrisk spread is measured as the sovereign bond yield minus the yieldon an equivalent maturity riskless bond-typically a U.S. Treasury orJapanese Government Bond, if the sovereign issue is denominated inJapanese yen. Thuraisamy, Gannon, and Batten (2008) identify variousmacroeconomic factors (such as exchange rates) that affect the sover-eign yield spreads of Latin American issuers, while González-Rozadaand Yeyati (2008) and Riedel et al. (2013) identify a number of factorssuch as credit cycle effects, risk appetite, global liquidity and contagionfrom systemic events such as the Russian default and changes in countryrisk (e.g. Chen, Chen, & Lee, 2013; Lee, 2013; Sottile, 2013), as well ascountry-specific factors that affect emerging market sovereign spreads.There are also a number of more recent papers that explore thesethemes of measuring sovereign risk and yields, including those byJaramillo & Weber, 2013; Martinez, Terceño, and Teruel (2013),Del Brio, Mora-Valencia, and Perote (2014), Gozgor (2014), Mensi,Hammoudeh, Carlos Reboredo, and Khuong Nguyen (2014), Zinna(2014) and recent extensions could explore the effects of corporategovernance (e.g. Chen, 2014; Claessens & Yurtoglu, 2013; Li, Chia-ShengChen, & French, 2012; Yen, Chen, Shen, & Lin, 2014) and related variableson bond spreads.
Cremers, Driessen, Maenhout, and Weinbaum (2008) show thatthe level of individual implied stock volatilities and implied-volatilityskew also affects the pricing of corporate credit spreads, while David(2008) provides an insight into the basis of the credit spread puzzle(Plantin, 2009) demonstrating that the effects of macroeconomicshocks on losses are more sensitive to changes in the price of riskthan are credit spreads. This situation results in higher credit spreadson very risky bonds even though average default losses are maintainedat historical levels.
In recent work involving derivatives products Greatrex (2009)and Ericsson, Jacobs, and Oviedo (2009), Chung and Chan (2010),Dionne et al. (2011) investigate the ability of structural and variousmacroeconomic variables to explain the variation in credit defaultswap (CDS), or interest rate spread changes. They employ modifiedversions of the credit spread models mentioned earlier, with theDionne et al. (2011) model applying a Markov switching mecha-nism to capture regime change. Importantly, changes in spreadson these derivatives are employed in the regression frameworkdue to the non stationarity of levels. This is consistent with theapproach adopted in this and other recent papers on the creditspread present in corporate and sovereign bonds over benchmarkriskless securities.
In this paper, we apply the key regression models to Canadian,investment-grade, corporate bond indices. The strength of ourstudy lies in using Canadian corporate bonds, which are devoidof both the tax effect and the ability to control the effects ofcallability. Studies using U.S. bond data cannot avoid these taxeffects.
3. Data
Canadian corporate bonds have a feature that allows for themitigation of the potential selection bias associated with callability.Most Canadian corporate bonds issued since 1987 carry a call provi-sion called the “doomsday” call provision. This provision is similar tothe U.S. “make-whole” call option, which sets the call price atthe maximum of the par value of the bond, or the value of the bondcalculated based on the yield on a Government of Canada bond(with a matching maturity) plus a spread (the doomsday spread).3
This call provision makes it possible to control for the callabilityof different bonds by credit rating, facilitating the study of a set ofcorporate bonds broader than just the noncallable versus callablebonds used by Duffee (1998).
Our sample is based on a unique database of month-end yield-to-maturity data from the SCM investment-grade Canadian corporatebond indices, reported by CANSIM from September 1976 to July2001 that enables credit ratings and bond callability to be con-trolled.4 The SCM series is no longer produced and its uniquefeatures cannot be reconstructed owing to inconsistency in indexconstruction and data availability. Therefore, while the series couldbe extended using other metrics it would be inappropriate to jointhese series for statistical or modelling purposes. However, theperiod of investigation also provides a unique historical setting inthat yields varied significantly over the sample period, whereasin the post 2001 period while they were generally lower, yieldsremained relatively stable until the onset of the Global FinancialCrisis (2007–2009). As noted by Gemmill and Keswani (2011) thislatter period also included a risk premium related to investors'fears of extreme losses.
Recall that for callable bonds, higher or rising interest rates imply alower chance that the issuer will exercise the call option resulting in alower yield for the call provision. The reverse is the case for periods ofdeclining yields. Our sample period is unique in that any call optionpresent in the corporate bonds that were issued in earlier periods ofhigher yields would have been affected by the subsequent declines inyields that followed. This was not the case for the more benign interestrate environment following 2001.
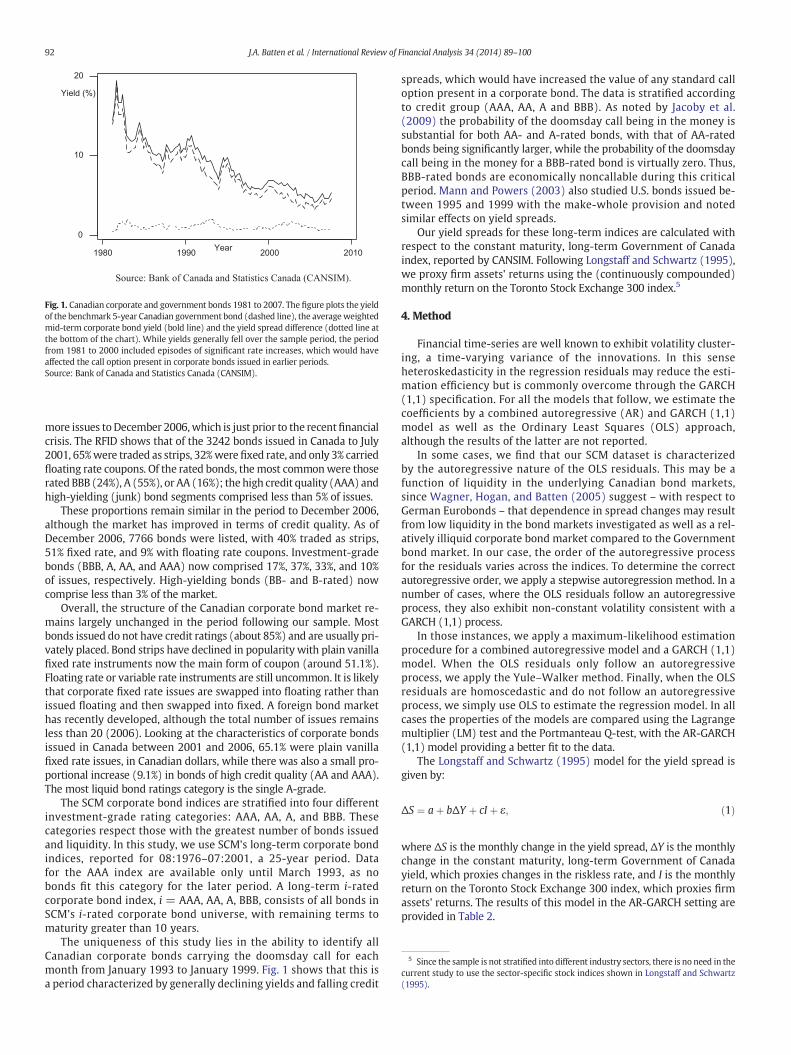
Nonetheless an insight into the recent behaviour of Canadiancorporate bond yields is provided by data currently available from theBank of Canada and Statistics Canada (CANSIM). In this case the proxyfor corporate bonds is the average weighted mid-term corporate bondyield (this monthly series runs from 1980 to 2007) and the proxy forthe risk free interest rate is the 5-year benchmark government bondyield (this monthly series runs from 1981 to 2010). Fig. 1 plots theseyields since 1981 and the yield difference, which is a proxy for the creditspread. This figure clearly shows the benign interest rate environmentof the period following 2001, whereas the earlier periods experiencedgenerally declining yields as inflation expectations were revised down-ward. This environment is a more testing one for corporate creditmodelling since the call option present in many corporate issueswould have gained considerable economic value in the declininginterest rate environment.
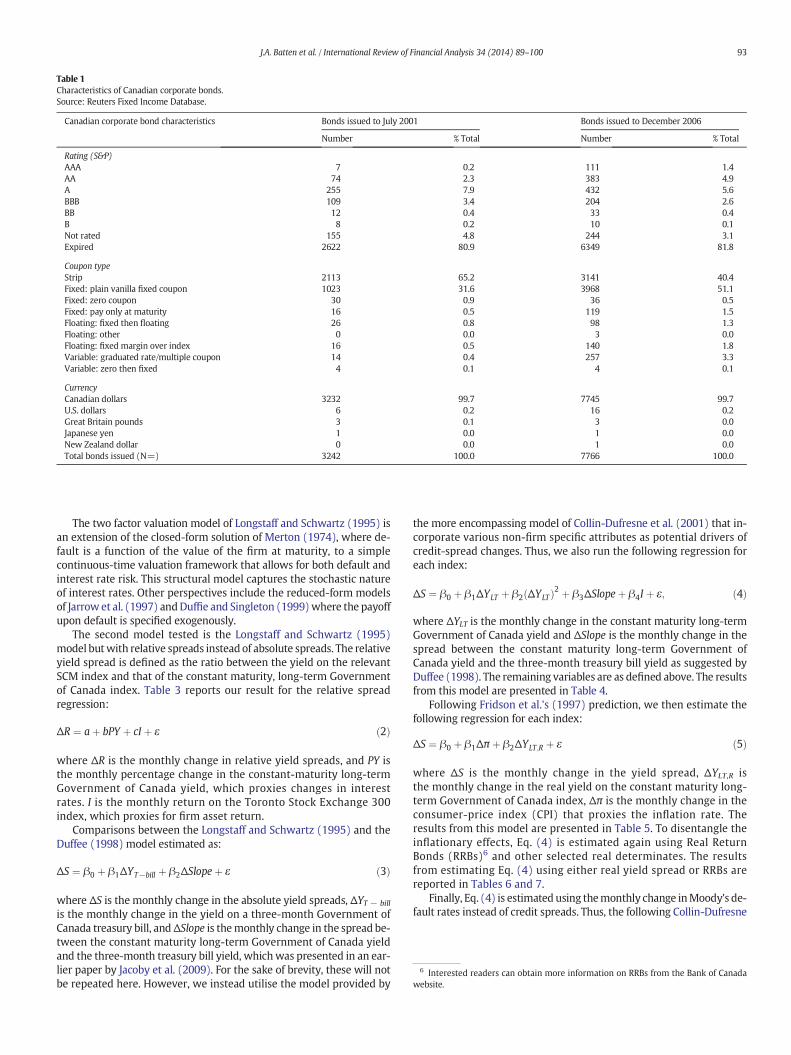
Appendix 1 provides details of the mean and standard deviations ofthe absolute and relative credit spreads. This index does not enable anaccurate assessment to be made of outstandings, trading volume foruse as a proxy for liquidity, or quantities of bonds with differing coupontypes or ratings. Table 1 provides information on Canadian corporatebond characteristics obtained from the Reuters Fixed Income Database(RFID) for issues up to July 2001 (the period of this study) and the
5 Since the sample is not stratified into different industry sectors, there is no need in thecurrent study to use the sector-specific stock indices shown in Longstaff and Schwartz(1995).
Source: Bank of Canada and Statistics Canada (CANSIM).
2010200019901980
20
10
0Year
Yield (%)
Fig. 1. Canadian corporate and government bonds 1981 to 2007. The figure plots the yieldof the benchmark 5-year Canadian government bond (dashed line), the average weightedmid-term corporate bond yield (bold line) and the yield spread difference (dotted line atthe bottom of the chart). While yields generally fell over the sample period, the periodfrom 1981 to 2000 included episodes of significant rate increases, which would haveaffected the call option present in corporate bonds issued in earlier periods.Source: Bank of Canada and Statistics Canada (CANSIM).
92 J.A. Batten et al. / International Review of Financial Analysis 34 (2014) 89–100
more issues toDecember 2006,which is just prior to the recentfinancialcrisis. The RFID shows that of the 3242 bonds issued in Canada to July2001, 65%were traded as strips, 32%were fixed rate, and only 3% carriedfloating rate coupons. Of the rated bonds, themost commonwere thoserated BBB (24%), A (55%), or AA (16%); the high credit quality (AAA) andhigh-yielding (junk) bond segments comprised less than 5% of issues.
These proportions remain similar in the period to December 2006,although the market has improved in terms of credit quality. As ofDecember 2006, 7766 bonds were listed, with 40% traded as strips,51% fixed rate, and 9% with floating rate coupons. Investment-gradebonds (BBB, A, AA, and AAA) now comprised 17%, 37%, 33%, and 10%of issues, respectively. High-yielding bonds (BB- and B-rated) nowcomprise less than 3% of the market.
Overall, the structure of the Canadian corporate bond market re-mains largely unchanged in the period following our sample. Mostbonds issued do not have credit ratings (about 85%) and are usually pri-vately placed. Bond strips have declined in popularity with plain vanillafixed rate instruments now the main form of coupon (around 51.1%).Floating rate or variable rate instruments are still uncommon. It is likelythat corporate fixed rate issues are swapped into floating rather thanissued floating and then swapped into fixed. A foreign bond markethas recently developed, although the total number of issues remainsless than 20 (2006). Looking at the characteristics of corporate bondsissued in Canada between 2001 and 2006, 65.1% were plain vanillafixed rate issues, in Canadian dollars, while there was also a small pro-portional increase (9.1%) in bonds of high credit quality (AA and AAA).The most liquid bond ratings category is the single A-grade.
The SCM corporate bond indices are stratified into four differentinvestment-grade rating categories: AAA, AA, A, and BBB. Thesecategories respect those with the greatest number of bonds issuedand liquidity. In this study, we use SCM's long-term corporate bondindices, reported for 08:1976–07:2001, a 25-year period. Datafor the AAA index are available only until March 1993, as nobonds fit this category for the later period. A long-term i-ratedcorporate bond index, i = AAA, AA, A, BBB, consists of all bonds inSCM's i-rated corporate bond universe, with remaining terms tomaturity greater than 10 years.
The uniqueness of this study lies in the ability to identify allCanadian corporate bonds carrying the doomsday call for eachmonth from January 1993 to January 1999. Fig. 1 shows that this isa period characterized by generally declining yields and falling credit
spreads, which would have increased the value of any standard calloption present in a corporate bond. The data is stratified accordingto credit group (AAA, AA, A and BBB). As noted by Jacoby et al.(2009) the probability of the doomsday call being in the money issubstantial for both AA- and A-rated bonds, with that of AA-ratedbonds being significantly larger, while the probability of the doomsdaycall being in the money for a BBB-rated bond is virtually zero. Thus,BBB-rated bonds are economically noncallable during this criticalperiod. Mann and Powers (2003) also studied U.S. bonds issued be-tween 1995 and 1999 with the make-whole provision and notedsimilar effects on yield spreads.
Our yield spreads for these long-term indices are calculated withrespect to the constant maturity, long-term Government of Canadaindex, reported by CANSIM. Following Longstaff and Schwartz (1995),we proxy firm assets' returns using the (continuously compounded)monthly return on the Toronto Stock Exchange 300 index.5
4. Method
Financial time-series are well known to exhibit volatility cluster-ing, a time-varying variance of the innovations. In this senseheteroskedasticity in the regression residuals may reduce the esti-mation efficiency but is commonly overcome through the GARCH(1,1) specification. For all the models that follow, we estimate thecoefficients by a combined autoregressive (AR) and GARCH (1,1)model as well as the Ordinary Least Squares (OLS) approach,although the results of the latter are not reported.
In some cases, we find that our SCM dataset is characterizedby the autoregressive nature of the OLS residuals. This may be afunction of liquidity in the underlying Canadian bond markets,since Wagner, Hogan, and Batten (2005) suggest – with respect toGerman Eurobonds – that dependence in spread changes may resultfrom low liquidity in the bond markets investigated as well as a rel-atively illiquid corporate bond market compared to the Governmentbond market. In our case, the order of the autoregressive processfor the residuals varies across the indices. To determine the correctautoregressive order, we apply a stepwise autoregression method. In anumber of cases, where the OLS residuals follow an autoregressiveprocess, they also exhibit non-constant volatility consistent with aGARCH (1,1) process.
In those instances, we apply a maximum-likelihood estimationprocedure for a combined autoregressive model and a GARCH (1,1)model. When the OLS residuals only follow an autoregressiveprocess, we apply the Yule–Walker method. Finally, when the OLSresiduals are homoscedastic and do not follow an autoregressiveprocess, we simply use OLS to estimate the regression model. In allcases the properties of the models are compared using the Lagrangemultiplier (LM) test and the Portmanteau Q-test, with the AR-GARCH(1,1) model providing a better fit to the data.
The Longstaff and Schwartz (1995) model for the yield spread isgiven by:
ΔS ¼ aþ bΔY þ cI þ ε; ð1Þ
where ΔS is the monthly change in the yield spread, ΔY is the monthlychange in the constant maturity, long-term Government of Canadayield, which proxies changes in the riskless rate, and I is the monthlyreturn on the Toronto Stock Exchange 300 index, which proxies firmassets' returns. The results of this model in the AR-GARCH setting areprovided in Table 2.
6 Interested readers can obtain more information on RRBs from the Bank of Canadawebsite.
Table 1Characteristics of Canadian corporate bonds.Source: Reuters Fixed Income Database.
Canadian corporate bond characteristics Bonds issued to July 2001 Bonds issued to December 2006
Number % Total Number % Total
Rating (S&P)AAA 7 0.2 111 1.4AA 74 2.3 383 4.9A 255 7.9 432 5.6BBB 109 3.4 204 2.6BB 12 0.4 33 0.4B 8 0.2 10 0.1Not rated 155 4.8 244 3.1Expired 2622 80.9 6349 81.8
Coupon typeStrip 2113 65.2 3141 40.4Fixed: plain vanilla fixed coupon 1023 31.6 3968 51.1Fixed: zero coupon 30 0.9 36 0.5Fixed: pay only at maturity 16 0.5 119 1.5Floating: fixed then floating 26 0.8 98 1.3Floating: other 0 0.0 3 0.0Floating: fixed margin over index 16 0.5 140 1.8Variable: graduated rate/multiple coupon 14 0.4 257 3.3Variable: zero then fixed 4 0.1 4 0.1
CurrencyCanadian dollars 3232 99.7 7745 99.7U.S. dollars 6 0.2 16 0.2Great Britain pounds 3 0.1 3 0.0Japanese yen 1 0.0 1 0.0New Zealand dollar 0 0.0 1 0.0Total bonds issued (N=) 3242 100.0 7766 100.0
93J.A. Batten et al. / International Review of Financial Analysis 34 (2014) 89–100
The two factor valuation model of Longstaff and Schwartz (1995) isan extension of the closed-form solution of Merton (1974), where de-fault is a function of the value of the firm at maturity, to a simplecontinuous-time valuation framework that allows for both default andinterest rate risk. This structural model captures the stochastic natureof interest rates. Other perspectives include the reduced-form modelsof Jarrow et al. (1997) andDuffie and Singleton (1999)where the payoffupon default is specified exogenously.
The second model tested is the Longstaff and Schwartz (1995)model butwith relative spreads instead of absolute spreads. The relativeyield spread is defined as the ratio between the yield on the relevantSCM index and that of the constant maturity, long-term Governmentof Canada index. Table 3 reports our result for the relative spreadregression:
ΔR ¼ aþ bPY þ cI þ ε ð2Þ
where ΔR is the monthly change in relative yield spreads, and PY isthe monthly percentage change in the constant-maturity long-termGovernment of Canada yield, which proxies changes in interestrates. I is the monthly return on the Toronto Stock Exchange 300index, which proxies for firm asset return.
Comparisons between the Longstaff and Schwartz (1995) and theDuffee (1998) model estimated as:
ΔS ¼ β0 þ β1ΔYT−bill þ β2ΔSlopeþ ε ð3Þ
where ΔS is the monthly change in the absolute yield spreads, ΔYT − bill
is the monthly change in the yield on a three-month Government ofCanada treasury bill, andΔSlope is themonthly change in the spread be-tween the constant maturity long-term Government of Canada yieldand the three-month treasury bill yield, whichwas presented in an ear-lier paper by Jacoby et al. (2009). For the sake of brevity, these will notbe repeated here. However, we instead utilise the model provided by
the more encompassing model of Collin-Dufresne et al. (2001) that in-corporate various non-firm specific attributes as potential drivers ofcredit-spread changes. Thus, we also run the following regression foreach index:
ΔS ¼ β0 þ β1ΔYLT þ β2 ΔYLTð Þ2 þ β3ΔSlopeþ β4I þ ε; ð4Þ
where ΔYLT is the monthly change in the constant maturity long-termGovernment of Canada yield and ΔSlope is the monthly change in thespread between the constant maturity long-term Government ofCanada yield and the three-month treasury bill yield as suggested byDuffee (1998). The remaining variables are as defined above. The resultsfrom this model are presented in Table 4.
Following Fridson et al.'s (1997) prediction, we then estimate thefollowing regression for each index:
ΔS ¼ β0 þ β1Δπ þ β2ΔYLT;R þ ε ð5Þ
where ΔS is the monthly change in the yield spread, ΔYLT,R isthe monthly change in the real yield on the constant maturity long-term Government of Canada index, Δπ is the monthly change in theconsumer-price index (CPI) that proxies the inflation rate. Theresults from this model are presented in Table 5. To disentangle theinflationary effects, Eq. (4) is estimated again using Real ReturnBonds (RRBs)6 and other selected real determinates. The resultsfrom estimating Eq. (4) using either real yield spread or RRBs arereported in Tables 6 and 7.
Finally, Eq. (4) is estimated using themonthly change inMoody's de-fault rates instead of credit spreads. Thus, the following Collin-Dufresne
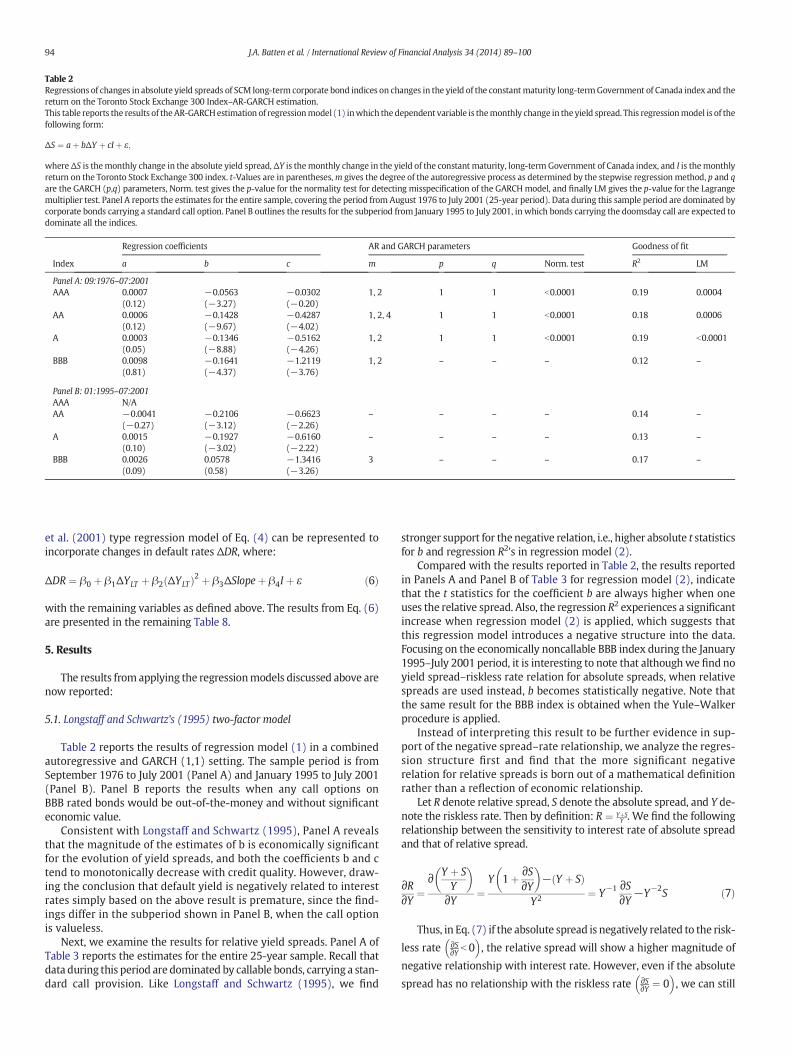
Table 2Regressions of changes in absolute yield spreads of SCM long-term corporate bond indices on changes in the yield of the constantmaturity long-termGovernment of Canada index and thereturn on the Toronto Stock Exchange 300 Index–AR-GARCH estimation.This table reports the results of theAR-GARCHestimation of regressionmodel (1) inwhich thedependent variable is themonthly change in the yield spread. This regressionmodel is of thefollowing form:
ΔS ¼ aþ bΔY þ cI þ ε;
whereΔS is themonthly change in the absolute yield spread, ΔY is themonthly change in the yield of the constant maturity, long-term Government of Canada index, and I is themonthlyreturn on the Toronto Stock Exchange 300 index. t-Values are in parentheses,m gives the degree of the autoregressive process as determined by the stepwise regression method, p and qare the GARCH (p,q) parameters, Norm. test gives the p-value for the normality test for detecting misspecification of the GARCHmodel, and finally LM gives the p-value for the Lagrangemultiplier test. Panel A reports the estimates for the entire sample, covering the period from August 1976 to July 2001 (25-year period). Data during this sample period are dominated bycorporate bonds carrying a standard call option. Panel B outlines the results for the subperiod from January 1995 to July 2001, in which bonds carrying the doomsday call are expected todominate all the indices.
Regression coefficients AR and GARCH parameters Goodness of fit
Index a b c m p q Norm. test R2 LM
Panel A: 09:1976–07:2001AAA 0.0007 −0.0563 −0.0302 1, 2 1 1 b0.0001 0.19 0.0004
(0.12) (−3.27) (−0.20)AA 0.0006 −0.1428 −0.4287 1, 2, 4 1 1 b0.0001 0.18 0.0006
(0.12) (−9.67) (−4.02)A 0.0003 −0.1346 −0.5162 1, 2 1 1 b0.0001 0.19 b0.0001
(0.05) (−8.88) (−4.26)BBB 0.0098 −0.1641 −1.2119 1, 2 – – – 0.12 –
(0.81) (−4.37) (−3.76)
Panel B: 01:1995–07:2001AAA N/AAA −0.0041 −0.2106 −0.6623 – – – – 0.14 –
(−0.27) (−3.12) (−2.26)A 0.0015 −0.1927 −0.6160 – – – – 0.13 –
(0.10) (−3.02) (−2.22)BBB 0.0026 0.0578 −1.3416 3 – – – 0.17 –
(0.09) (0.58) (−3.26)
94 J.A. Batten et al. / International Review of Financial Analysis 34 (2014) 89–100
et al. (2001) type regression model of Eq. (4) can be represented toincorporate changes in default rates ΔDR, where:
ΔDR ¼ β0 þ β1ΔYLT þ β2 ΔYLTð Þ2 þ β3ΔSlopeþ β4I þ ε ð6Þ
with the remaining variables as defined above. The results from Eq. (6)are presented in the remaining Table 8.
5. Results
The results from applying the regressionmodels discussed above arenow reported:
5.1. Longstaff and Schwartz's (1995) two-factor model
Table 2 reports the results of regression model (1) in a combinedautoregressive and GARCH (1,1) setting. The sample period is fromSeptember 1976 to July 2001 (Panel A) and January 1995 to July 2001(Panel B). Panel B reports the results when any call options onBBB rated bonds would be out-of-the-money and without significanteconomic value.
Consistent with Longstaff and Schwartz (1995), Panel A revealsthat the magnitude of the estimates of b is economically significantfor the evolution of yield spreads, and both the coefficients b and ctend to monotonically decrease with credit quality. However, draw-ing the conclusion that default yield is negatively related to interestrates simply based on the above result is premature, since the find-ings differ in the subperiod shown in Panel B, when the call optionis valueless.
Next, we examine the results for relative yield spreads. Panel A ofTable 3 reports the estimates for the entire 25-year sample. Recall thatdata during this period are dominated by callable bonds, carrying a stan-dard call provision. Like Longstaff and Schwartz (1995), we find
stronger support for thenegative relation, i.e., higher absolute t statisticsfor b and regression R2's in regression model (2).
Compared with the results reported in Table 2, the results reportedin Panels A and Panel B of Table 3 for regression model (2), indicatethat the t statistics for the coefficient b are always higher when oneuses the relative spread. Also, the regression R2 experiences a significantincrease when regression model (2) is applied, which suggests thatthis regression model introduces a negative structure into the data.Focusing on the economically noncallable BBB index during the January1995–July 2001 period, it is interesting to note that althoughwe find noyield spread–riskless rate relation for absolute spreads, when relativespreads are used instead, b becomes statistically negative. Note thatthe same result for the BBB index is obtained when the Yule–Walkerprocedure is applied.
Instead of interpreting this result to be further evidence in sup-port of the negative spread–rate relationship, we analyze the regres-sion structure first and find that the more significant negativerelation for relative spreads is born out of a mathematical definitionrather than a reflection of economic relationship.
Let R denote relative spread, S denote the absolute spread, and Y de-note the riskless rate. Then by definition: R ¼ YþS
Y . We find the followingrelationship between the sensitivity to interest rate of absolute spreadand that of relative spread.
∂R∂Y ¼
∂ Y þ SY
� �
∂Y ¼Y 1þ ∂S
∂Y
� �− Y þ Sð Þ
Y2 ¼ Y−1 ∂S∂Y−Y−2S ð7Þ
Thus, in Eq. (7) if the absolute spread is negatively related to the risk-
less rate ∂S∂Y b 0
� �, the relative spread will show a higher magnitude of
negative relationship with interest rate. However, even if the absolute
spread has no relationship with the riskless rate ∂S∂Y ¼ 0
� �, we can still
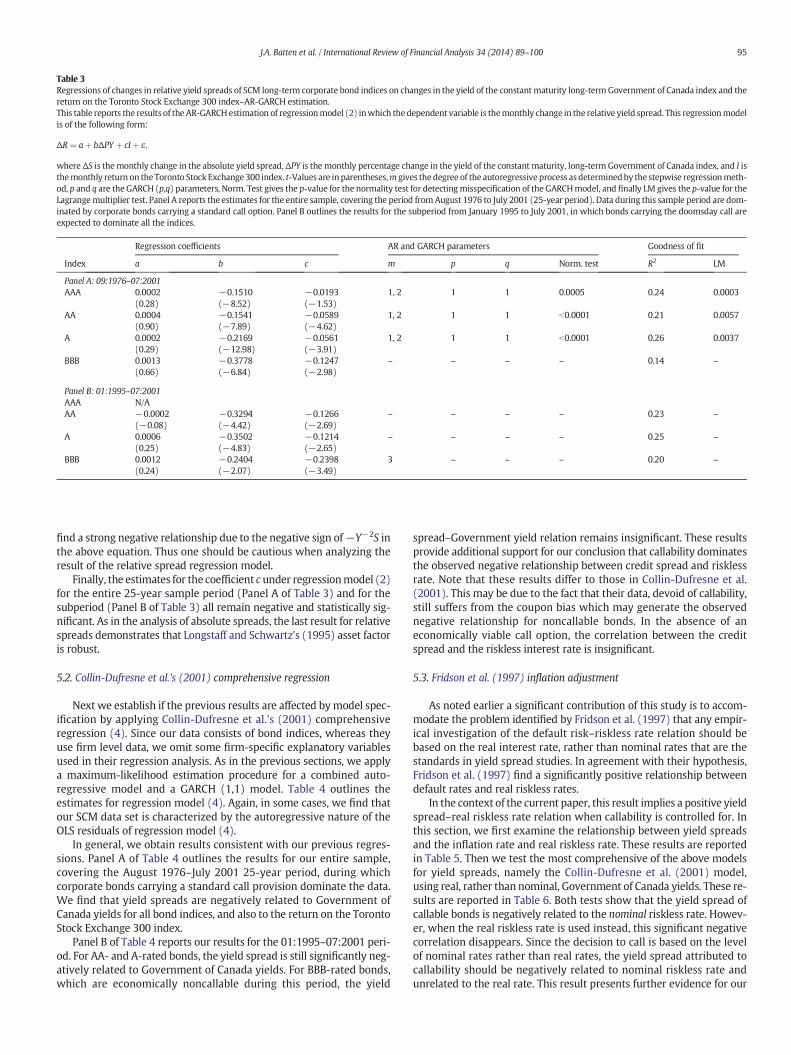
Table 3Regressions of changes in relative yield spreads of SCM long-term corporate bond indices on changes in the yield of the constant maturity long-termGovernment of Canada index and thereturn on the Toronto Stock Exchange 300 index–AR-GARCH estimation.This table reports the results of the AR-GARCHestimation of regressionmodel (2) inwhich thedependent variable is themonthly change in the relative yield spread. This regressionmodelis of the following form:
ΔR ¼ aþ bΔPY þ cI þ ε;
whereΔS is themonthly change in the absolute yield spread,ΔPY is themonthly percentage change in the yield of the constant maturity, long-term Government of Canada index, and I isthemonthly return on theToronto Stock Exchange300 index. t-Values are inparentheses,m gives thedegree of the autoregressiveprocess as determinedby the stepwise regressionmeth-od, p and q are the GARCH (p,q) parameters, Norm. Test gives the p-value for the normality test for detectingmisspecification of the GARCHmodel, and finally LM gives the p-value for theLagrangemultiplier test. Panel A reports the estimates for the entire sample, covering the period from August 1976 to July 2001 (25-year period). Data during this sample period are dom-inated by corporate bonds carrying a standard call option. Panel B outlines the results for the subperiod from January 1995 to July 2001, in which bonds carrying the doomsday call areexpected to dominate all the indices.
Regression coefficients AR and GARCH parameters Goodness of fit
Index a b c m p q Norm. test R2 LM
Panel A: 09:1976–07:2001AAA 0.0002 −0.1510 −0.0193 1, 2 1 1 0.0005 0.24 0.0003
(0.28) (−8.52) (−1.53)AA 0.0004 −0.1541 −0.0589 1, 2 1 1 b0.0001 0.21 0.0057
(0.90) (−7.89) (−4.62)A 0.0002 −0.2169 −0.0561 1, 2 1 1 b0.0001 0.26 0.0037
(0.29) (−12.98) (−3.91)BBB 0.0013 −0.3778 −0.1247 – – – – 0.14 –
(0.66) (−6.84) (−2.98)
Panel B: 01:1995–07:2001AAA N/AAA −0.0002 −0.3294 −0.1266 – – – – 0.23 –
(−0.08) (−4.42) (−2.69)A 0.0006 −0.3502 −0.1214 – – – – 0.25 –
(0.25) (−4.83) (−2.65)BBB 0.0012 −0.2404 −0.2398 3 – – – 0.20 –
(0.24) (−2.07) (−3.49)
95J.A. Batten et al. / International Review of Financial Analysis 34 (2014) 89–100
find a strong negative relationship due to the negative sign of−Y−2S inthe above equation. Thus one should be cautious when analyzing theresult of the relative spread regression model.
Finally, the estimates for the coefficient c under regressionmodel (2)for the entire 25-year sample period (Panel A of Table 3) and for thesubperiod (Panel B of Table 3) all remain negative and statistically sig-nificant. As in the analysis of absolute spreads, the last result for relativespreads demonstrates that Longstaff and Schwartz's (1995) asset factoris robust.
5.2. Collin-Dufresne et al.'s (2001) comprehensive regression
Next we establish if the previous results are affected bymodel spec-ification by applying Collin-Dufresne et al.'s (2001) comprehensiveregression (4). Since our data consists of bond indices, whereas theyuse firm level data, we omit some firm-specific explanatory variablesused in their regression analysis. As in the previous sections, we applya maximum-likelihood estimation procedure for a combined auto-regressive model and a GARCH (1,1) model. Table 4 outlines theestimates for regression model (4). Again, in some cases, we find thatour SCM data set is characterized by the autoregressive nature of theOLS residuals of regression model (4).
In general, we obtain results consistent with our previous regres-sions. Panel A of Table 4 outlines the results for our entire sample,covering the August 1976–July 2001 25-year period, during whichcorporate bonds carrying a standard call provision dominate the data.We find that yield spreads are negatively related to Government ofCanada yields for all bond indices, and also to the return on the TorontoStock Exchange 300 index.
Panel B of Table 4 reports our results for the 01:1995–07:2001 peri-od. For AA- and A-rated bonds, the yield spread is still significantly neg-atively related to Government of Canada yields. For BBB-rated bonds,which are economically noncallable during this period, the yield
spread–Government yield relation remains insignificant. These resultsprovide additional support for our conclusion that callability dominatesthe observed negative relationship between credit spread and risklessrate. Note that these results differ to those in Collin-Dufresne et al.(2001). This may be due to the fact that their data, devoid of callability,still suffers from the coupon bias which may generate the observednegative relationship for noncallable bonds. In the absence of aneconomically viable call option, the correlation between the creditspread and the riskless interest rate is insignificant.
5.3. Fridson et al. (1997) inflation adjustment
As noted earlier a significant contribution of this study is to accom-modate the problem identified by Fridson et al. (1997) that any empir-ical investigation of the default risk–riskless rate relation should bebased on the real interest rate, rather than nominal rates that are thestandards in yield spread studies. In agreement with their hypothesis,Fridson et al. (1997) find a significantly positive relationship betweendefault rates and real riskless rates.
In the context of the current paper, this result implies a positive yieldspread–real riskless rate relation when callability is controlled for. Inthis section, we first examine the relationship between yield spreadsand the inflation rate and real riskless rate. These results are reportedin Table 5. Then we test the most comprehensive of the above modelsfor yield spreads, namely the Collin-Dufresne et al. (2001) model,using real, rather than nominal, Government of Canada yields. These re-sults are reported in Table 6. Both tests show that the yield spread ofcallable bonds is negatively related to the nominal riskless rate. Howev-er, when the real riskless rate is used instead, this significant negativecorrelation disappears. Since the decision to call is based on the levelof nominal rates rather than real rates, the yield spread attributed tocallability should be negatively related to nominal riskless rate andunrelated to the real rate. This result presents further evidence for our
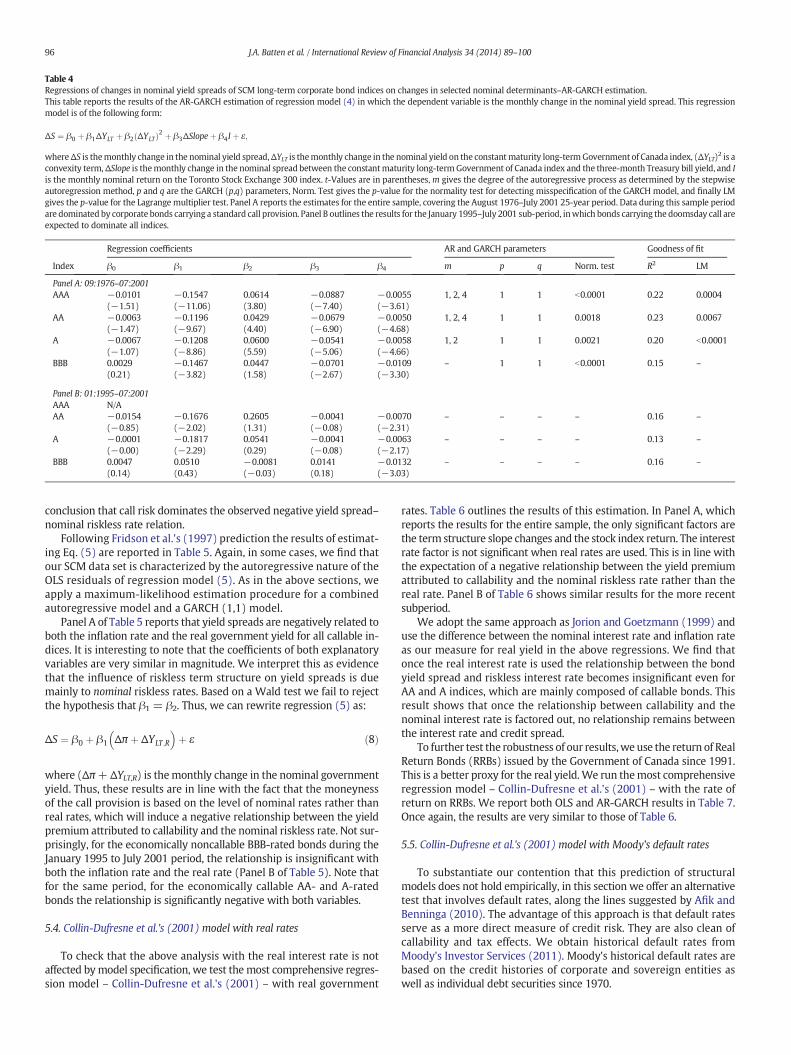
Table 4Regressions of changes in nominal yield spreads of SCM long-term corporate bond indices on changes in selected nominal determinants–AR-GARCH estimation.This table reports the results of the AR-GARCH estimation of regression model (4) in which the dependent variable is the monthly change in the nominal yield spread. This regressionmodel is of the following form:
ΔS ¼ β0 þ β1ΔYLT þ β2 ΔYLTð Þ2 þ β3ΔSlopeþ β4I þ ε;
whereΔS is themonthly change in the nominal yield spread,ΔYLT is themonthly change in the nominal yield on the constantmaturity long-termGovernment of Canada index, (ΔYLT)2 is aconvexity term,ΔSlope is themonthly change in the nominal spread between the constantmaturity long-termGovernment of Canada index and the three-month Treasury bill yield, and Iis the monthly nominal return on the Toronto Stock Exchange 300 index. t-Values are in parentheses,m gives the degree of the autoregressive process as determined by the stepwiseautoregression method, p and q are the GARCH (p,q) parameters, Norm. Test gives the p-value for the normality test for detecting misspecification of the GARCH model, and finally LMgives the p-value for the Lagrange multiplier test. Panel A reports the estimates for the entire sample, covering the August 1976–July 2001 25-year period. Data during this sample periodare dominated by corporate bonds carrying a standard call provision. Panel B outlines the results for the January 1995–July 2001 sub-period, inwhich bonds carrying the doomsday call areexpected to dominate all indices.
Regression coefficients AR and GARCH parameters Goodness of fit
Index β0 β1 β2 β3 β4 m p q Norm. test R2 LM
Panel A: 09:1976–07:2001AAA −0.0101 −0.1547 0.0614 −0.0887 −0.0055 1, 2, 4 1 1 b0.0001 0.22 0.0004
(−1.51) (−11.06) (3.80) (−7.40) (−3.61)AA −0.0063 −0.1196 0.0429 −0.0679 −0.0050 1, 2, 4 1 1 0.0018 0.23 0.0067
(−1.47) (−9.67) (4.40) (−6.90) (−4.68)A −0.0067 −0.1208 0.0600 −0.0541 −0.0058 1, 2 1 1 0.0021 0.20 b0.0001
(−1.07) (−8.86) (5.59) (−5.06) (−4.66)BBB 0.0029 −0.1467 0.0447 −0.0701 −0.0109 – 1 1 b0.0001 0.15 –
(0.21) (−3.82) (1.58) (−2.67) (−3.30)
Panel B: 01:1995–07:2001AAA N/AAA −0.0154 −0.1676 0.2605 −0.0041 −0.0070 – – – – 0.16 –
(−0.85) (−2.02) (1.31) (−0.08) (−2.31)A −0.0001 −0.1817 0.0541 −0.0041 −0.0063 – – – – 0.13 –
(−0.00) (−2.29) (0.29) (−0.08) (−2.17)BBB 0.0047 0.0510 −0.0081 0.0141 −0.0132 – – – – 0.16 –
(0.14) (0.43) (−0.03) (0.18) (−3.03)
96 J.A. Batten et al. / International Review of Financial Analysis 34 (2014) 89–100
conclusion that call risk dominates the observed negative yield spread–nominal riskless rate relation.
Following Fridson et al.'s (1997) prediction the results of estimat-ing Eq. (5) are reported in Table 5. Again, in some cases, we find thatour SCM data set is characterized by the autoregressive nature of theOLS residuals of regression model (5). As in the above sections, weapply a maximum-likelihood estimation procedure for a combinedautoregressive model and a GARCH (1,1) model.
Panel A of Table 5 reports that yield spreads are negatively related toboth the inflation rate and the real government yield for all callable in-dices. It is interesting to note that the coefficients of both explanatoryvariables are very similar in magnitude. We interpret this as evidencethat the influence of riskless term structure on yield spreads is duemainly to nominal riskless rates. Based on a Wald test we fail to rejectthe hypothesis that β1 = β2. Thus, we can rewrite regression (5) as:
ΔS ¼ β0 þ β1 Δπ þ ΔYLT;R
� �þ ε ð8Þ
where (Δπ+ ΔYLT,R) is themonthly change in the nominal governmentyield. Thus, these results are in line with the fact that the moneynessof the call provision is based on the level of nominal rates rather thanreal rates, which will induce a negative relationship between the yieldpremium attributed to callability and the nominal riskless rate. Not sur-prisingly, for the economically noncallable BBB-rated bonds during theJanuary 1995 to July 2001 period, the relationship is insignificant withboth the inflation rate and the real rate (Panel B of Table 5). Note thatfor the same period, for the economically callable AA- and A-ratedbonds the relationship is significantly negative with both variables.
5.4. Collin-Dufresne et al.'s (2001) model with real rates
To check that the above analysis with the real interest rate is notaffected bymodel specification, we test themost comprehensive regres-sion model – Collin-Dufresne et al.'s (2001) – with real government
rates. Table 6 outlines the results of this estimation. In Panel A, whichreports the results for the entire sample, the only significant factors arethe term structure slope changes and the stock index return. The interestrate factor is not significant when real rates are used. This is in line withthe expectation of a negative relationship between the yield premiumattributed to callability and the nominal riskless rate rather than thereal rate. Panel B of Table 6 shows similar results for the more recentsubperiod.
We adopt the same approach as Jorion and Goetzmann (1999) anduse the difference between the nominal interest rate and inflation rateas our measure for real yield in the above regressions. We find thatonce the real interest rate is used the relationship between the bondyield spread and riskless interest rate becomes insignificant even forAA and A indices, which are mainly composed of callable bonds. Thisresult shows that once the relationship between callability and thenominal interest rate is factored out, no relationship remains betweenthe interest rate and credit spread.
To further test the robustness of our results,we use the return of RealReturn Bonds (RRBs) issued by the Government of Canada since 1991.This is a better proxy for the real yield. We run themost comprehensiveregression model – Collin-Dufresne et al.'s (2001) – with the rate ofreturn on RRBs. We report both OLS and AR-GARCH results in Table 7.Once again, the results are very similar to those of Table 6.
5.5. Collin-Dufresne et al.'s (2001) model with Moody's default rates
To substantiate our contention that this prediction of structuralmodels does not hold empirically, in this section we offer an alternativetest that involves default rates, along the lines suggested by Afik andBenninga (2010). The advantage of this approach is that default ratesserve as a more direct measure of credit risk. They are also clean ofcallability and tax effects. We obtain historical default rates fromMoody's Investor Services (2011). Moody's historical default rates arebased on the credit histories of corporate and sovereign entities aswell as individual debt securities since 1970.
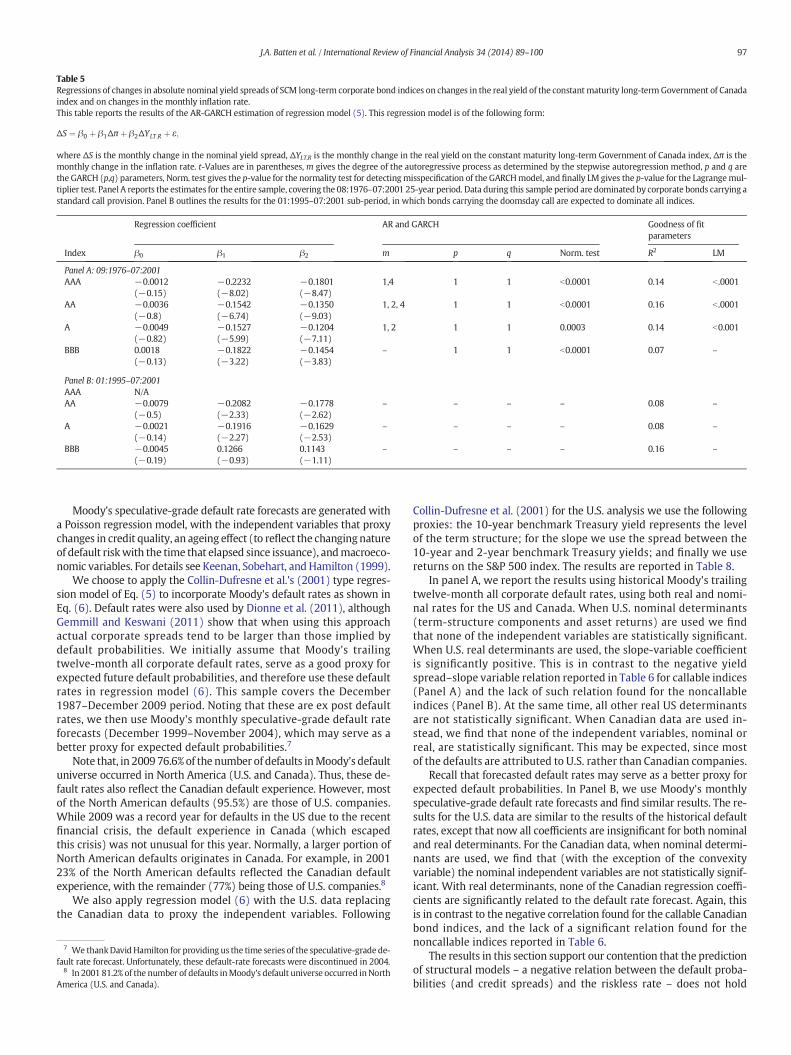
Table 5Regressions of changes in absolute nominal yield spreads of SCM long-term corporate bond indices on changes in the real yield of the constant maturity long-termGovernment of Canadaindex and on changes in the monthly inflation rate.This table reports the results of the AR-GARCH estimation of regression model (5). This regression model is of the following form:
ΔS ¼ β0 þ β1Δπ þ β2ΔYLT;R þ ε;
where ΔS is the monthly change in the nominal yield spread, ΔYLT,R is the monthly change in the real yield on the constant maturity long-term Government of Canada index, Δπ is themonthly change in the inflation rate. t-Values are in parentheses, m gives the degree of the autoregressive process as determined by the stepwise autoregression method, p and q arethe GARCH (p,q) parameters, Norm. test gives the p-value for the normality test for detecting misspecification of the GARCHmodel, and finally LM gives the p-value for the Lagrangemul-tiplier test. Panel A reports the estimates for the entire sample, covering the 08:1976–07:2001 25-year period. Data during this sample period are dominated by corporate bonds carrying astandard call provision. Panel B outlines the results for the 01:1995–07:2001 sub-period, in which bonds carrying the doomsday call are expected to dominate all indices.
Regression coefficient AR and GARCH Goodness of fitparameters
Index β0 β1 β2 m p q Norm. test R2 LM
Panel A: 09:1976–07:2001AAA −0.0012 −0.2232 −0.1801 1,4 1 1 b0.0001 0.14 b .0001
(−0.15) (−8.02) (−8.47)AA −0.0036 −0.1542 −0.1350 1, 2, 4 1 1 b0.0001 0.16 b .0001
(−0.8) (−6.74) (−9.03)A −0.0049 −0.1527 −0.1204 1, 2 1 1 0.0003 0.14 b0.001
(−0.82) (−5.99) (−7.11)BBB 0.0018 −0.1822 −0.1454 – 1 1 b0.0001 0.07 –
(−0.13) (−3.22) (−3.83)
Panel B: 01:1995–07:2001AAA N/AAA −0.0079 −0.2082 −0.1778 – – – – 0.08 –
(−0.5) (−2.33) (−2.62)A −0.0021 −0.1916 −0.1629 – – – – 0.08 –
(−0.14) (−2.27) (−2.53)BBB −0.0045 0.1266 0.1143 – – – – 0.16 –
(−0.19) (−0.93) (−1.11)
97J.A. Batten et al. / International Review of Financial Analysis 34 (2014) 89–100
Moody's speculative-grade default rate forecasts are generated witha Poisson regression model, with the independent variables that proxychanges in credit quality, an ageing effect (to reflect the changingnatureof default riskwith the time that elapsed since issuance), andmacroeco-nomic variables. For details see Keenan, Sobehart, and Hamilton (1999).
We choose to apply the Collin-Dufresne et al.'s (2001) type regres-sion model of Eq. (5) to incorporate Moody's default rates as shown inEq. (6). Default rates were also used by Dionne et al. (2011), althoughGemmill and Keswani (2011) show that when using this approachactual corporate spreads tend to be larger than those implied bydefault probabilities. We initially assume that Moody's trailingtwelve-month all corporate default rates, serve as a good proxy forexpected future default probabilities, and therefore use these defaultrates in regression model (6). This sample covers the December1987–December 2009 period. Noting that these are ex post defaultrates, we then use Moody's monthly speculative-grade default rateforecasts (December 1999–November 2004), which may serve as abetter proxy for expected default probabilities.7
Note that, in 2009 76.6% of the number of defaults inMoody's defaultuniverse occurred in North America (U.S. and Canada). Thus, these de-fault rates also reflect the Canadian default experience. However, mostof the North American defaults (95.5%) are those of U.S. companies.While 2009 was a record year for defaults in the US due to the recentfinancial crisis, the default experience in Canada (which escapedthis crisis) was not unusual for this year. Normally, a larger portion ofNorth American defaults originates in Canada. For example, in 200123% of the North American defaults reflected the Canadian defaultexperience, with the remainder (77%) being those of U.S. companies.8
We also apply regression model (6) with the U.S. data replacingthe Canadian data to proxy the independent variables. Following
7 We thankDavidHamilton for providing us the time series of the speculative-grade de-fault rate forecast. Unfortunately, these default-rate forecasts were discontinued in 2004.
8 In 2001 81.2% of the number of defaults inMoody's default universe occurred inNorthAmerica (U.S. and Canada).
Collin-Dufresne et al. (2001) for the U.S. analysis we use the followingproxies: the 10-year benchmark Treasury yield represents the levelof the term structure; for the slope we use the spread between the10-year and 2-year benchmark Treasury yields; and finally we usereturns on the S&P 500 index. The results are reported in Table 8.
In panel A, we report the results using historical Moody's trailingtwelve-month all corporate default rates, using both real and nomi-nal rates for the US and Canada. When U.S. nominal determinants(term-structure components and asset returns) are used we findthat none of the independent variables are statistically significant.When U.S. real determinants are used, the slope-variable coefficientis significantly positive. This is in contrast to the negative yieldspread–slope variable relation reported in Table 6 for callable indices(Panel A) and the lack of such relation found for the noncallableindices (Panel B). At the same time, all other real US determinantsare not statistically significant. When Canadian data are used in-stead, we find that none of the independent variables, nominal orreal, are statistically significant. This may be expected, since mostof the defaults are attributed to U.S. rather than Canadian companies.
Recall that forecasted default rates may serve as a better proxy forexpected default probabilities. In Panel B, we use Moody's monthlyspeculative-grade default rate forecasts and find similar results. The re-sults for the U.S. data are similar to the results of the historical defaultrates, except that now all coefficients are insignificant for both nominaland real determinants. For the Canadian data, when nominal determi-nants are used, we find that (with the exception of the convexityvariable) the nominal independent variables are not statistically signif-icant. With real determinants, none of the Canadian regression coeffi-cients are significantly related to the default rate forecast. Again, thisis in contrast to the negative correlation found for the callable Canadianbond indices, and the lack of a significant relation found for thenoncallable indices reported in Table 6.
The results in this section support our contention that the predictionof structural models – a negative relation between the default proba-bilities (and credit spreads) and the riskless rate – does not hold
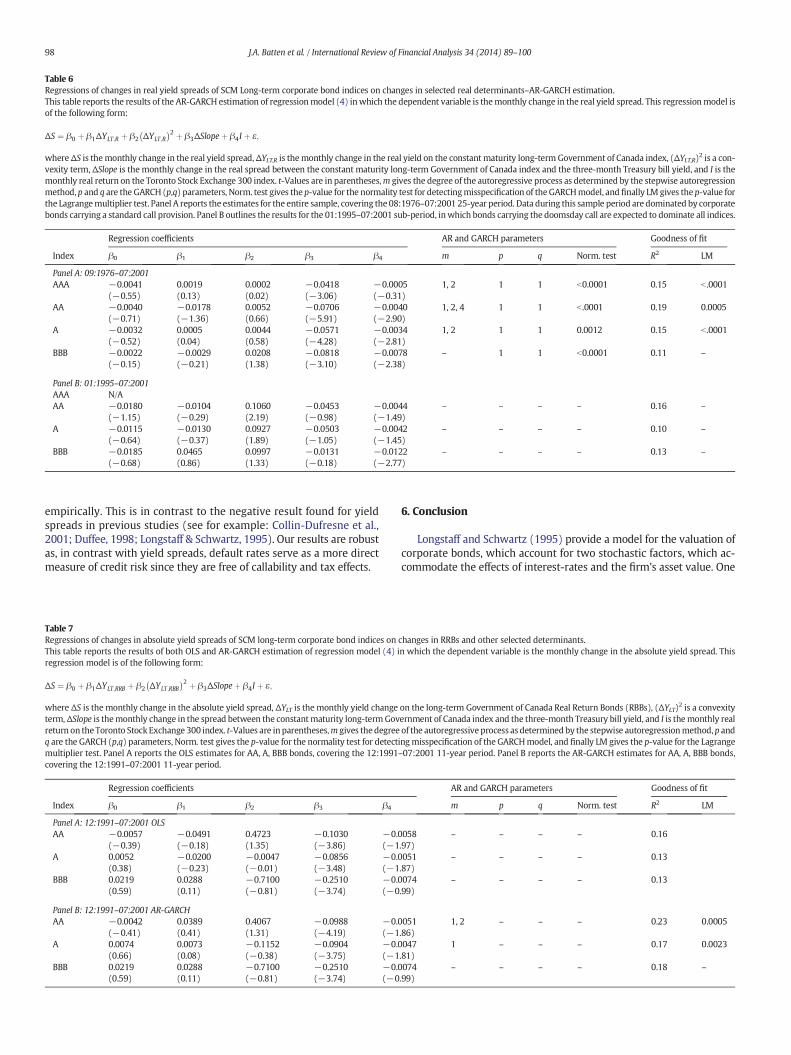
Table 6Regressions of changes in real yield spreads of SCM Long-term corporate bond indices on changes in selected real determinants–AR-GARCH estimation.This table reports the results of the AR-GARCH estimation of regressionmodel (4) inwhich the dependent variable is themonthly change in the real yield spread. This regressionmodel isof the following form:
ΔS ¼ β0 þ β1ΔYLT;R þ β2 ΔYLT;R
� �2 þ β3ΔSlopeþ β4I þ ε;
whereΔS is themonthly change in the real yield spread,ΔYLT,R is themonthly change in the real yield on the constant maturity long-term Government of Canada index, (ΔYLT,R)2 is a con-vexity term, ΔSlope is the monthly change in the real spread between the constant maturity long-term Government of Canada index and the three-month Treasury bill yield, and I is themonthly real return on the Toronto Stock Exchange 300 index. t-Values are in parentheses,m gives the degree of the autoregressive process as determined by the stepwise autoregressionmethod, p and q are the GARCH (p,q) parameters, Norm. test gives the p-value for the normality test for detectingmisspecification of theGARCHmodel, and finally LM gives the p-value forthe Lagrangemultiplier test. Panel A reports the estimates for the entire sample, covering the 08:1976–07:2001 25-year period. Data during this sample period are dominated by corporatebonds carrying a standard call provision. Panel B outlines the results for the 01:1995–07:2001 sub-period, inwhich bonds carrying the doomsday call are expected to dominate all indices.
Regression coefficients AR and GARCH parameters Goodness of fit
Index β0 β1 β2 β3 β4 m p q Norm. test R2 LM
Panel A: 09:1976–07:2001AAA −0.0041 0.0019 0.0002 −0.0418 −0.0005 1, 2 1 1 b0.0001 0.15 b .0001
(−0.55) (0.13) (0.02) (−3.06) (−0.31)AA −0.0040 −0.0178 0.0052 −0.0706 −0.0040 1, 2, 4 1 1 b .0001 0.19 0.0005
(−0.71) (−1.36) (0.66) (−5.91) (−2.90)A −0.0032 0.0005 0.0044 −0.0571 −0.0034 1, 2 1 1 0.0012 0.15 b .0001
(−0.52) (0.04) (0.58) (−4.28) (−2.81)BBB −0.0022 −0.0029 0.0208 −0.0818 −0.0078 – 1 1 b0.0001 0.11 –
(−0.15) (−0.21) (1.38) (−3.10) (−2.38)
Panel B: 01:1995–07:2001AAA N/AAA −0.0180 −0.0104 0.1060 −0.0453 −0.0044 – – – – 0.16 –
(−1.15) (−0.29) (2.19) (−0.98) (−1.49)A −0.0115 −0.0130 0.0927 −0.0503 −0.0042 – – – – 0.10 –
(−0.64) (−0.37) (1.89) (−1.05) (−1.45)BBB −0.0185 0.0465 0.0997 −0.0131 −0.0122 – – – – 0.13 –
(−0.68) (0.86) (1.33) (−0.18) (−2.77)
98 J.A. Batten et al. / International Review of Financial Analysis 34 (2014) 89–100
empirically. This is in contrast to the negative result found for yieldspreads in previous studies (see for example: Collin-Dufresne et al.,2001; Duffee, 1998; Longstaff & Schwartz, 1995). Our results are robustas, in contrast with yield spreads, default rates serve as a more directmeasure of credit risk since they are free of callability and tax effects.
Table 7Regressions of changes in absolute yield spreads of SCM long-term corporate bond indices onThis table reports the results of both OLS and AR-GARCH estimation of regression model (4) iregression model is of the following form:
ΔS ¼ β0 þ β1ΔYLT;RRB þ β2 ΔYLT;RBB
� �2 þ β3ΔSlopeþ β4I þ ε;
where ΔS is the monthly change in the absolute yield spread, ΔYLT is the monthly yield changeterm,ΔSlope is themonthly change in the spread between the constantmaturity long-termGovreturn on the Toronto Stock Exchange 300 index. t-Values are inparentheses,m gives thedegreeq are the GARCH (p,q) parameters, Norm. test gives the p-value for the normality test for detectmultiplier test. Panel A reports the OLS estimates for AA, A, BBB bonds, covering the 12:1991covering the 12:1991–07:2001 11-year period.
Regression coefficients
Index β0 β1 β2 β3 β4
Panel A: 12:1991–07:2001 OLSAA −0.0057 −0.0491 0.4723 −0.1030 −0.0
(−0.39) (−0.18) (1.35) (−3.86) (−1A 0.0052 −0.0200 −0.0047 −0.0856 −0.0
(0.38) (−0.23) (−0.01) (−3.48) (−1BBB 0.0219 0.0288 −0.7100 −0.2510 −0.0
(0.59) (0.11) (−0.81) (−3.74) (−0
Panel B: 12:1991–07:2001 AR-GARCHAA −0.0042 0.0389 0.4067 −0.0988 −0.0
(−0.41) (0.41) (1.31) (−4.19) (−1A 0.0074 0.0073 −0.1152 −0.0904 −0.0
(0.66) (0.08) (−0.38) (−3.75) (−1BBB 0.0219 0.0288 −0.7100 −0.2510 −0.0
(0.59) (0.11) (−0.81) (−3.74) (−0
6. Conclusion
Longstaff and Schwartz (1995) provide a model for the valuation ofcorporate bonds, which account for two stochastic factors, which ac-commodate the effects of interest-rates and the firm's asset value. One
changes in RRBs and other selected determinants.n which the dependent variable is the monthly change in the absolute yield spread. This
on the long-term Government of Canada Real Return Bonds (RBBs), (ΔYLT)2 is a convexityernment of Canada index and the three-month Treasury bill yield, and I is themonthly realof the autoregressive process as determinedby the stepwise autoregressionmethod,p andingmisspecification of the GARCHmodel, and finally LM gives the p-value for the Lagrange–07:2001 11-year period. Panel B reports the AR-GARCH estimates for AA, A, BBB bonds,
AR and GARCH parameters Goodness of fit
m p q Norm. test R2 LM
058 – – – – 0.16.97)051 – – – – 0.13.87)074 – – – – 0.13.99)
051 1, 2 – – – 0.23 0.0005.86)047 1 – – – 0.17 0.0023.81)074 – – – – 0.18 –
.99)
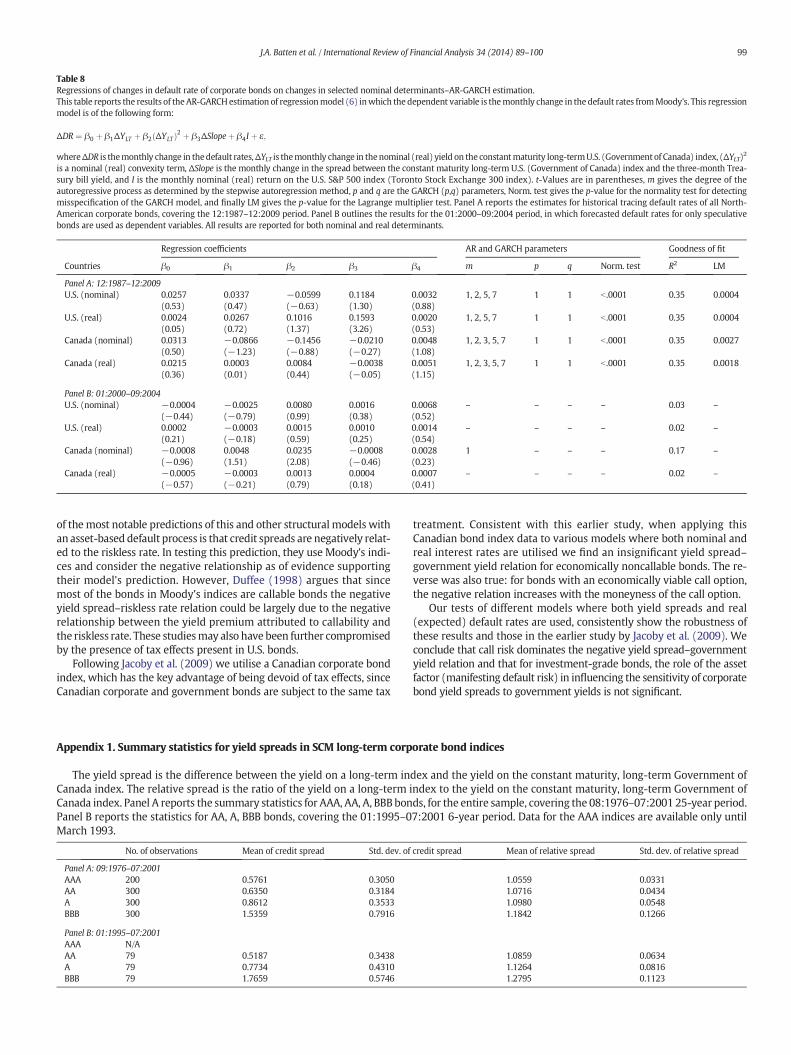
Table 8Regressions of changes in default rate of corporate bonds on changes in selected nominal determinants–AR-GARCH estimation.This table reports the results of theAR-GARCHestimation of regressionmodel (6) inwhich the dependent variable is themonthly change in the default rates fromMoody's. This regressionmodel is of the following form:
ΔDR ¼ β0 þ β1ΔYLT þ β2 ΔYLTð Þ2 þ β3ΔSlopeþ β4I þ ε;
whereΔDR is themonthly change in thedefault rates,ΔYLT is themonthly change in thenominal (real) yield on the constantmaturity long-termU.S. (Government of Canada) index, (ΔYLT)2
is a nominal (real) convexity term, ΔSlope is the monthly change in the spread between the constant maturity long-term U.S. (Government of Canada) index and the three-month Trea-sury bill yield, and I is the monthly nominal (real) return on the U.S. S&P 500 index (Toronto Stock Exchange 300 index). t-Values are in parentheses, m gives the degree of theautoregressive process as determined by the stepwise autoregression method, p and q are the GARCH (p,q) parameters, Norm. test gives the p-value for the normality test for detectingmisspecification of the GARCH model, and finally LM gives the p-value for the Lagrange multiplier test. Panel A reports the estimates for historical tracing default rates of all North-American corporate bonds, covering the 12:1987–12:2009 period. Panel B outlines the results for the 01:2000–09:2004 period, in which forecasted default rates for only speculativebonds are used as dependent variables. All results are reported for both nominal and real determinants.
Regression coefficients AR and GARCH parameters Goodness of fit
Countries β0 β1 β2 β3 β4 m p q Norm. test R2 LM
Panel A: 12:1987–12:2009U.S. (nominal) 0.0257 0.0337 −0.0599 0.1184 0.0032 1, 2, 5, 7 1 1 b .0001 0.35 0.0004
(0.53) (0.47) (−0.63) (1.30) (0.88)U.S. (real) 0.0024 0.0267 0.1016 0.1593 0.0020 1, 2, 5, 7 1 1 b .0001 0.35 0.0004
(0.05) (0.72) (1.37) (3.26) (0.53)Canada (nominal) 0.0313 −0.0866 −0.1456 −0.0210 0.0048 1, 2, 3, 5, 7 1 1 b .0001 0.35 0.0027
(0.50) (−1.23) (−0.88) (−0.27) (1.08)Canada (real) 0.0215 0.0003 0.0084 −0.0038 0.0051 1, 2, 3, 5, 7 1 1 b .0001 0.35 0.0018
(0.36) (0.01) (0.44) (−0.05) (1.15)
Panel B: 01:2000–09:2004U.S. (nominal) −0.0004 −0.0025 0.0080 0.0016 0.0068 – – – – 0.03 –
(−0.44) (−0.79) (0.99) (0.38) (0.52)U.S. (real) 0.0002 −0.0003 0.0015 0.0010 0.0014 – – – – 0.02 –
(0.21) (−0.18) (0.59) (0.25) (0.54)Canada (nominal) −0.0008 0.0048 0.0235 −0.0008 0.0028 1 – – – 0.17 –
(−0.96) (1.51) (2.08) (−0.46) (0.23)Canada (real) −0.0005 −0.0003 0.0013 0.0004 0.0007 – – – – 0.02 –
(−0.57) (−0.21) (0.79) (0.18) (0.41)
99J.A. Batten et al. / International Review of Financial Analysis 34 (2014) 89–100
of themost notable predictions of this and other structural models withan asset-based default process is that credit spreads are negatively relat-ed to the riskless rate. In testing this prediction, they use Moody's indi-ces and consider the negative relationship as of evidence supportingtheir model's prediction. However, Duffee (1998) argues that sincemost of the bonds in Moody's indices are callable bonds the negativeyield spread–riskless rate relation could be largely due to the negativerelationship between the yield premium attributed to callability andthe riskless rate. These studiesmay also have been further compromisedby the presence of tax effects present in U.S. bonds.
Following Jacoby et al. (2009) we utilise a Canadian corporate bondindex, which has the key advantage of being devoid of tax effects, sinceCanadian corporate and government bonds are subject to the same tax
No. of observations Mean of credit spread Std. dev. of
Panel A: 09:1976–07:2001AAA 200 0.5761 0.3050AA 300 0.6350 0.3184A 300 0.8612 0.3533BBB 300 1.5359 0.7916
Panel B: 01:1995–07:2001AAA N/AAA 79 0.5187 0.3438A 79 0.7734 0.4310BBB 79 1.7659 0.5746
Appendix 1. Summary statistics for yield spreads in SCM long-term corp
The yield spread is the difference between the yield on a long-term inCanada index. The relative spread is the ratio of the yield on a long-term iCanada index. Panel A reports the summary statistics for AAA, AA, A, BBB bonPanel B reports the statistics for AA, A, BBB bonds, covering the 01:1995–0March 1993.
treatment. Consistent with this earlier study, when applying thisCanadian bond index data to various models where both nominal andreal interest rates are utilised we find an insignificant yield spread–government yield relation for economically noncallable bonds. The re-verse was also true: for bonds with an economically viable call option,the negative relation increases with the moneyness of the call option.
Our tests of different models where both yield spreads and real(expected) default rates are used, consistently show the robustness ofthese results and those in the earlier study by Jacoby et al. (2009). Weconclude that call risk dominates the negative yield spread–governmentyield relation and that for investment-grade bonds, the role of the assetfactor (manifesting default risk) in influencing the sensitivity of corporatebond yield spreads to government yields is not significant.
credit spread Mean of relative spread Std. dev. of relative spread
1.0559 0.03311.0716 0.04341.0980 0.05481.1842 0.1266
1.0859 0.06341.1264 0.08161.2795 0.1123
orate bond indices
dex and the yield on the constant maturity, long-term Government ofndex to the yield on the constant maturity, long-term Government ofds, for the entire sample, covering the 08:1976–07:2001 25-year period.7:2001 6-year period. Data for the AAA indices are available only until
100 J.A. Batten et al. / International Review of Financial Analysis 34 (2014) 89–100
References
Afik, Z., Arad, O., & Galil, K. (2012). Using Merton model: An empirical assessment ofalternatives. Available at SSRN: http://ssrn.com/abstract=2032678, http://dx.doi.org/10.2139/ssrn.2032678 (February 6).
Afik, Z., & Benninga, S. (2010). A model of implied expected bond returns. Available atSSRN: http://ssrn.com/abstract=1564001, http://dx.doi.org/10.2139/ssrn.1564001(February 23, 2010).
Avino, Davide, Lazar, Emese, & Varotto, Simone (2013). Price discovery of credit spreadsin tranquil and crisis periods. International Review of Financial Analysis, 30, 242–253(December 2013).
Berndt, A., Ritchken, P., & Sun, Z. (2010). On correlation and default clustering in creditmarkets. Review of Financial Studies, 23, 2680–2729.
Breitenfellner, Bastian, &Wagner, Niklas (2012). Explaining aggregate credit default swapspreads. International Review of Financial Analysis, 22, 18–29 (April 2012).
Campbell, J. Y., & Taksler, G. B. (2003). Equity volatility and corporate bond yields. Journalof Finance, 58, 2321–2349.
Chen, I. -Ju (2014). Financial crisis and the dynamics of corporate governance: Evidencefrom Taiwan's listed firms. International Review of Economics & Finance1059-0560,32, 3–28, http://dx.doi.org/10.1016/j.iref.2014.01.004 (July 2014).
Chen, Mei-Peng, Chen, Pei-Fen, & Lee, Chien-Chiang (2013). Asymmetric effects of inves-tor sentiment on industry stock returns: Panel data evidence. Emerging MarketsReview, 14, 35–54, http://dx.doi.org/10.1016/j.ememar.2012.11.001 (March 2013,ISSN 1566-0141).
Chen, R., Fabozzi, F. J., & Sverdlove, R. (2010). Corporate credit default swap liquidity andits implications for corporate bond spreads. Journal of Fixed Income, 20, 31–57.
Chen, L., Lesmond, D. A., & Wei, J. (2007). Corporate yield spreads and bond liquidity.Journal of Finance, 62, 119–149.
Chung, H. -L., & Chan, W. -S. (2010). Impact of credit spreads, monetary policy and con-vergence trading on swap spreads. International Review of Financial Analysis, 19(2),118–126.
Claessens, Stijn, & Yurtoglu, B. Burcin (2013). Corporate governance in emergingmarkets:A survey. Emerging Markets Review, 15, 1–33, http://dx.doi.org/10.1016/j.ememar.2012.03.002 (June 2013, ISSN 1566-0141).
Collin-Dufresne, P., Goldstein, R. S., & Helwege, J. (2010). Is credit event risk priced?Modeling contagion via the updating of beliefs. No. w15733. National Bureau ofEconomic Research.
Collin-Dufresne, P., Goldstein, R. S., & Martin, J. (2001). The determinants of credit spreadchanges. Journal of Finance, 56, 2177–2207.
Covitz, D., & Downing, C. (2007). Liquidity or credit risk? The determinants of very short-term corporate yield spreads. The Journal of Finance, 62, 2303–2328.
Cremers, M., Driessen, J., Maenhout, P., & Weinbaum, D. (2008). Individual stock-optionprices and credit spreads. Journal of Banking & Finance, 32, 2706–2715.
Dabrowski, M. (2010). The global financial crisis: Lessons or European integration.Economic Systems, 34(1), 38–54.
David, A. (2008). Inflation uncertainty, asset valuations, and the credit spreads puzzle.Review of Financial Studies, 21, 2487–2534.
Davies, A. (2008). Credit spread determinants: An 85 year perspective. Journal of FinancialMarkets, 11, 180–197.
Del Brio, Esther B., Mora-Valencia, Andrés, & Perote, Javier (2014). VaR performanceduring the subprime and sovereign debt crises: An application to emerging markets.Emerging Markets Review1566-0141, http://dx.doi.org/10.1016/j.ememar.2014.05.001 (Available online 22 May 2014).
Dionne, G., Gauthier, G., Hammami, K., Maurice, M., & Simonato, J. -G. (2011). A reducedform model of default spreads with Markov-switching macroeconomic factors.Journal of Banking & Finance, 35, 1984–2000.
Domler, F. (2013). A critical evaluation of the European credit default swap reform: Itschallenges and adverse effects as a result of insufficient assumptions. Journal ofBanking Regulation, 14, 33–60.
Duffee, G. R. (1998). The relation between treasury yields and corporate bond yieldspreads. Journal of Finance, 53, 2225–2241.
Duffie, D., & Singleton, K. J. (1999). Modeling term structures of defaultable bonds. Reviewof Financial Studies, 12, 687–720.
Elton, E. J., Gruber, M. J., Agrawal, D., & Mann, C. (2001). Explaining the rate spread oncorporate bonds. Journal of Finance, 56, 247–277.
Eom, Y. H., Helwege, J., & Huang, J. -Z. (2004). Structural models of corporate bondpricing: An empirical analysis. Review of Financial Studies, 17, 499–544.
Ericsson, J., Jacobs, K., & Oviedo, R. (2009). The determinants of credit default swapPremia. Journal of Financial & Quantitative Analysis, 44, 109–132.
Ericsson, J., & Renault, O. (2006). Liquidity and credit risk. Journal of Finance, 61,2219–2250.
Fridson, M., Garman, C., & Wu, S. (1997). Real interest rates and the default rate on high-yield bonds. Journal of Fixed Income, 25, 55–61.
Gemmill, G., & Keswani, A. (2011). Downside risk and the size of credit spreads. Journal ofBanking and Finance, 35, 2021–2036.
González-Rozada, M., & Yeyati, E. (2008). Global factors and emerging market spreads.Economic Journal, 118, 1917–1936.
Gorton, G. (2009). The subprime panic. European Financial Management, 15, 10–46.Gozgor, Giray (2014). Determinants of domestic credit levels in emerging markets: The
role of external factors. Emerging Markets Review, 18, 1–18, http://dx.doi.org/10.1016/j.ememar.2013.11.003 (March 2014, ISSN 1566-0141).
Greatrex, C. (2009). Credit default swap market determinants. Journal of Fixed Income, 18,18–32.
Hackbarth, D., Miao, J., & Morellec, E. (2006). Capital structure, credit risk, and macroeco-nomic conditions. Journal of Financial Economics, 82(3), 519–550 (December 2006).
Hwang, Y., Min, H., McDonald, J. A., Kim, H., & Kim, B. (2010). Using the credit spread as anoption-risk factor: Size and value Effects in CAPM. Journal of Banking and Finance, 34,2995–3009.
Jacoby, G., Liao, R. C., & Batten, J. A. (2009). Testing the elasticity of corporate yieldspreads. Journal of Financial and Quantitative Analysis, 44, 641–656.
Jacoby, G., & Roberts, G. S. (2003). Default- and call-adjusted duration for corporatebonds. Journal of Banking and Finance, 27, 2297–2321.
Jaramillo, Laura, & Weber, Anke (2013). Bond yields in emerging economies: It matterswhat state you are in. Emerging Markets Review1566-0141, 17, 169–185, http://dx.doi.org/10.1016/j.ememar.2013.09.003 (December 2013).
Jarrow, R. A., Lando, D., & Turnbull, S. M. (1997). AMarkovmodel for the term structure ofcredit risk spreads. The Review of Financial Studies, 10, 481–523.
Jordan, B.D., & Jordan, S. D. (1991). Tax options and the pricing of treasury bond triplets:Theory and evidence. Journal of Financial Economics, 30, 135–164.
Jorion, Philippe, & Goetzmann, William N. (1999). Global stock markets in the twentiethcentury. Journal of Finance, 54(3), 953–980.
Keenan, S. C., Sobehart, J., & Hamilton, D. T. (1999). Predicting default rates: A forecastingmodel for Moody’s issuer-based default rates. Moody’s Investors Services (WorkingPaper).
Lee, Yen-Hsien (2013). Global and regional range-based volatility spillover effects.Emerging Markets Review1566-0141, 14, 1–10 (March 2013).
Li, Wei-Xuan, Chia-Sheng Chen, Clara, & French, Joseph J. (2012). The relationshipbetween liquidity, corporate governance, and firm valuation: Evidence from Russia.Emerging Markets Review1566-0141, 13(4), 465–477 (December 2012).
Loncarski, Igor, & Szilagyi, Peter G. (2012). Empirical analysis of credit spread changes ofUS corporate bonds. International Review of Financial Analysis, 24, 12–19 (September2012).
Longstaff, F. A., Mithal, S., & Neis, E. (2005). Corporate yield spreads: Default risk orliquidity? New evidence from the credit-default swap market. Journal of Finance,60, 2213–2253.
Longstaff, F. A., & Schwartz, E. S. (1995). A simple approach to valuing risky fixed andfloating rate debt. Journal of Finance, 50, 789–819.
Mann, S. V., & Powers, E. V. (2003). Indexing a bond's call price: An analysis of make-whole call provisions. Journal of Corporate Finance, 9, 535–554.
Martinez, Lisana B., Terceño, Antonio, & Teruel, Mercedes (2013). Sovereign bond spreadsdeterminants in Latin American countries: Before and during the XXI financial crisis.Emerging Markets Review1566-0141, 17, 60–75, http://dx.doi.org/10.1016/j.ememar.2013.08.004 (December 2013).
Mensi, Walid, Hammoudeh, Shawkat, Carlos Reboredo, Juan, & Khuong Nguyen, Duc(2014). Do global factors impact BRICS stock markets? A quantile regressionapproach. Emerging Markets Review1566-0141, 19, 1–17, http://dx.doi.org/10.1016/j.ememar.2014.04.002 (June 2014).
Merton, R. C. (1974). On the pricing of corporate debt: The risk structure of interest rates.The Journal of Finance, 29, 449–470.
Moody's Investor Services (2011). Corporate Default and Recovery Rates, 1920–2010.(February 28, 2011).
Plantin, G. (2009). Learning by holding and liquidity. Review of Economic Studies, 76,395–412.
Riedel, Christoph, Thuraisamy, Kannan S., & Wagner, Niklas (2013). Credit cycle depen-dent spread determinants in emerging sovereign debt markets. Emerging MarketsReview1566-0141, 17, 209–223, http://dx.doi.org/10.1016/j.ememar.2013.03.002(December 2013).
Ronen, T., & Zhou, X. (2013). Trade and information in the corporate bondmarket. Journalof Financial Markets, 16, 61–103.
Sottile, Pedro (2013). On the political determinants of sovereign risk: Evidence from aMarkov-switching vector autoregressive model for Argentina. Emerging MarketsReview1566-0141, 15, 160–185, http://dx.doi.org/10.1016/j.ememar.2013.02.005(June 2013).
Tauchen, G., & Zhou, H. (2011). Realized jumps on financial markets and predicting creditspreads. Journal of Econometrics, 160, 102–118.
Thuraisamy, K. S., Gannon, G., & Batten, J. A. (2008). The credit spread dynamics of LatinAmerican Euro issues in international bondmarkets. Journal of Multinational FinancialManagement, 18, 328–345.
van Rixtel, A., & Upper, C. (2012). Highlights of the BIS international statistics. BISQuarterly Review, 1, 11–22.
Vasicek, O. (1977). An equilibrium characterization of the term structure. Journal ofFinancial Economics, 5, 177–188.
Wagner, Niklas, Hogan, Warren P., & Batten, Jonathan A. (2005). Interest rates, stockmar-ket returns, and variations in German credit spreads. Economic Notes, 34(1), 35–50.
Yen, Ju-Fang, Chen, Yan-Shing, Shen, Chung-Hua, & Lin, Chih-Yung (2014). Why do firmsallow their CEOs to join trade associations? An embeddedness view. InternationalReview of Economics & Finance, 32, 47–61, http://dx.doi.org/10.1016/j.iref.2014.01.006 (July 2014, ISSN 1059-0560).
Zinna, Gabriele (2014). Identifying risks in emerging market sovereign and corporatebond spreads. Emerging Markets Review, http://dx.doi.org/10.1016/j.ememar.2014.05.002 (Available online 23 May 2014, ISSN 1566-0141).