Cost control and beyond: The CFO’s agenda for corporate travel

1

Corporate Value Analysis II
Module 3: CFO and Corporate
Financial Management
2
รศ.ดร.สรศาสตร ์สขุเจริญสิน คณะพฒันาการเศรษฐกิจ
สถาบนับณัฑิตพฒันบริหารศาสตร ์

�Shareholder’s value identification � Investment Decision and Value Creation�Risk management decision and value management
Outline:
�Risk management decision and value management�Workshop / Case study
3

Investment Decisions and Value Management
• Analysis of potential additions to fixed assets.
• Long-term decisions; involve large expenditures.
• Very important to firm’s future.
The investors:
- shareholders
- debt holders
The business
proposalInvestor provide the initial cash
Required to finance the proposal.
The proposal generates future cash
returns to investors.
4

Net Present Value
niCF
NPV CF= +∑
• NPV describes an added value from investment decisions of the company.
• The General Tools for value creating projects.
CFi = Cash flows at period ik = Appropriate discount rate
( )0
1 1
ii
i
CFNPV CF
k=
= ++
∑
5

Rationale for the NPV method
NPV = PV of inflows – Cost
= Benefits - Cost
= Net gain in wealth
• If projects are independent, accept if the project • If projects are independent, accept if the project NPV > 0.
• If projects are mutually exclusive, accept projects with the highest positive NPV, those that add the most value.
6
Creating Value by using Real Options
• In a world with certainty, there can be no options.
• A real option is an option where the underlying asset is a real asset.
• Real option presents a marriage of basic asset pricing and corporate finance. corporate finance.
• Uncertainty = Opportunity
• Standard tools do not link strategy with investment decisions
• Strategically important projects often fail internal financial tests.
7

Real Options in Capital Budgeting
Real Option analysis helpful in examining multi-stage projects
Embedded options arise naturally from investment;
Called real options to distinguish from financial options.Called real options to distinguish from financial options.
Value of a project equals value captured by NPV + option value
Can transform negative NPV projects into positive NPV!
8

Project value, not includingthe value of the flexibility
• Traditional method to evaluate projects will have outcomes that end up with a standard "bell" curve. The "most likely" value is in the center, "worst case" analyses are to the left of center, and "best cases" are to the right of center.
9

• The difference between the expected value with and without flexibility is the value that the flexibility provides.
Project value, not includingthe value of the flexibility
10

Investment
timing / Defer
Expand /
Contract
Abandon
To wait before taking an action until more is known or timing is expected to be more favorableTo increase or decrease the scale of a operation in response to demand
To discontinue an operation and
DescriptionOption
Adding or subtracting to the daily flights on an airline route or adding memory to a computer
When to harvest a stand of trees, introduce a new product, or replace an existing piece of equipment
Discontinuing a research project,
Examples
Examples of Real Option
Extending brand names to new products or marketing through existing distribution channels
Abandon
Flexibility
Growth
To discontinue an operation and liquidate the assets
To alter the mix of inputs or outputs of a production process in response to market prices
To expand the scope of activities to capitalize on new perceived opportunities
Discontinuing a research project, closing a store, or resigning from current employment
The output mix of refined crude oil products or substituting coal for natural gas to produce electricity
11

Example
Project Y:
• Project Y has an initial, up-front cost of $200,000, at t = 0. The project is expected to produce after-tax net cash flows of $80,000 for the next three years.
• At a 10% discount rate, what is Project Y’s NPV? What is your investment • At a 10% discount rate, what is Project Y’s NPV? What is your investment decision?
0 1 2 3
-$200,000 80,000 80,000 80,000
k = 10%
NPV = -$1,051.84
12
Abandonment option
• Project Y’s A-T net cash flows depend critically upon customer acceptance of the product.
• There is a 60% probability that the product will be wildly successful and produce A-T net CFs of wildly successful and produce A-T net CFs of $150,000, and a 40% chance it will produce annual A-T net CFs of -$25,000.
13

Abandonment decision tree
-$200,00060% prob.
40% prob.
1 2 3 Years0
150,000 150,000 150,000
-25,000 -25,000 -25,000
• If the customer uses the product, NPV is $173,027.80.
• If the customer does not use the product, NPV is -$262,171.30.
• E(NPV) = 0.6(173,027.8) + 0.4(-262,171.3)
= -1,051.84
14
Issues with abandonment options
• The company does not have the option to delay the project.
• The company may abandon the project after a year, if the customer has not adopted the product.customer has not adopted the product.
• If the project is abandoned, there will be no operating costs incurred nor cash inflows received after the first year.
15
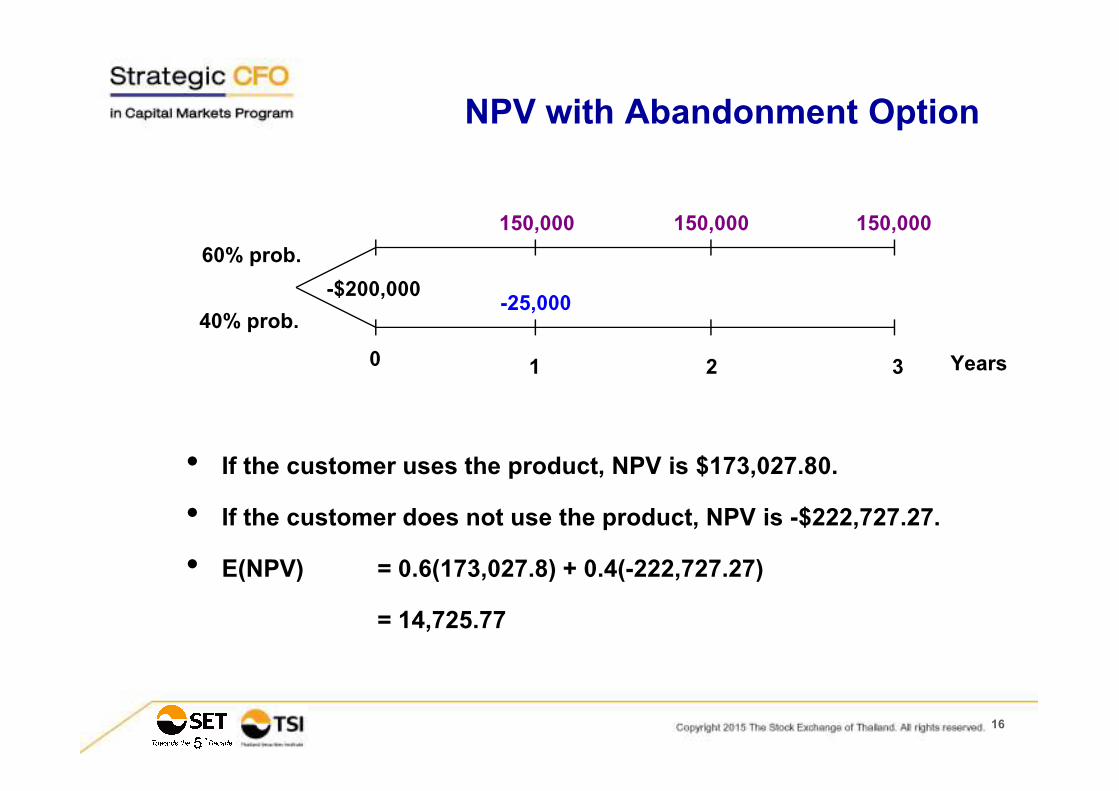
NPV with Abandonment Option
-$200,00060% prob.
40% prob.
1 2 3 Years0
150,000 150,000 150,000
-25,000
• If the customer uses the product, NPV is $173,027.80.
• If the customer does not use the product, NPV is -$222,727.27.
• E(NPV) = 0.6(173,027.8) + 0.4(-222,727.27)
= 14,725.77
16
A CFO’s role in Risk Management
•
• Risk management must be integrated into the rhythm of the business – strategy, operations, legal and others – to “risk adjust” business approaches that extend well beyond traditional risk management functions.
• CFOs should holistically evaluate their companies’ risks while challenging their internal audit teams to ensure that their strategy is aligned with the imperatives of the company but also structured to identify emerging risks.
• CFOs should consider marrying risk management and performance measures. There’s a strong correlation between the two, and by unifying the scope, the organization can achieve a better return on its risk management investment.
17
management functions.
http://www.ey.com/GL/en/Issues/Managing-finance/CFOneedtoknow-AM-Risk-management#taxtable

Example: Integrated Risk Dashboard
18

Example: Project Risk Dashboard
19
WORKSHOP / CASE STUDYCorporate Value Analysis
20
Workshop
Real OptionReal Option
21
Growth Option
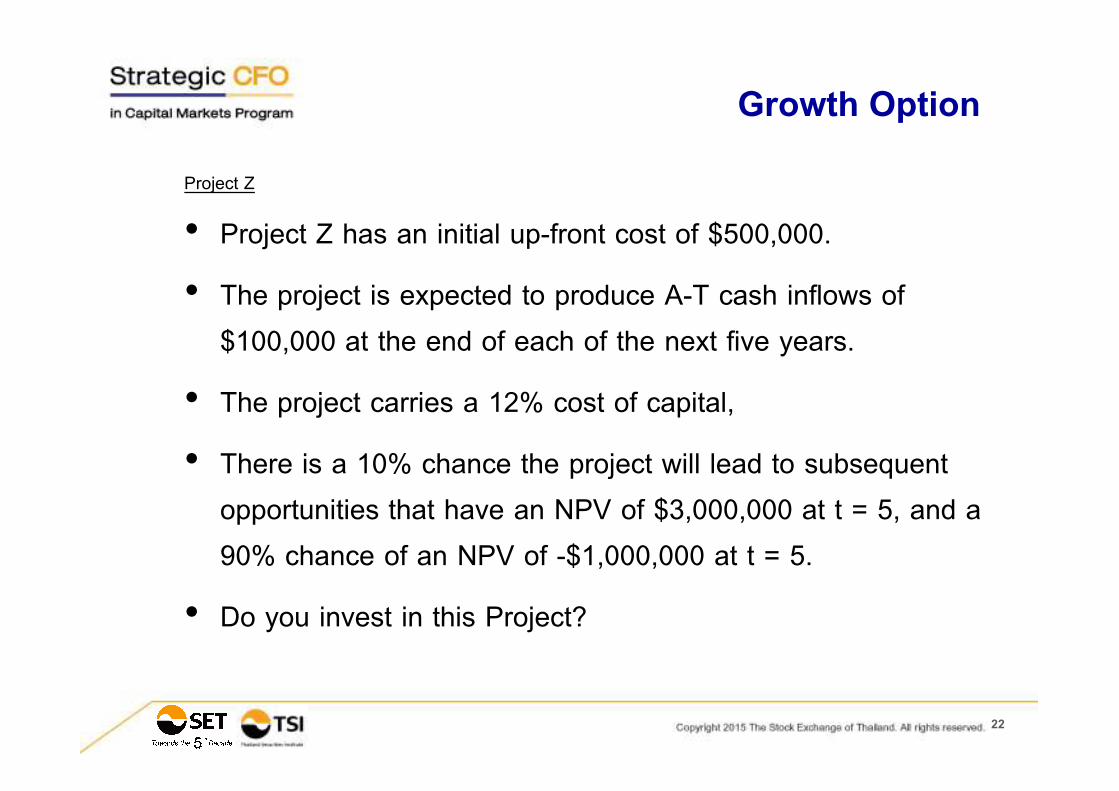
Project Z
• Project Z has an initial up-front cost of $500,000.
• The project is expected to produce A-T cash inflows of
$100,000 at the end of each of the next five years.
• The project carries a 12% cost of capital, • The project carries a 12% cost of capital,
• There is a 10% chance the project will lead to subsequent
opportunities that have an NPV of $3,000,000 at t = 5, and a
90% chance of an NPV of -$1,000,000 at t = 5.
• Do you invest in this Project?
22

100,000 100,000 100,000 100,000 100,000
-$500,000
10% prob.
90% prob.
1 2 3 4 50
100,000 100,000 100,000 100,000 100,000
-$1,000,000
$3,000,000
NPV with the growth option
23
1 2 3 4 5Years
0
NPV with the growth option
24

25
Q & A