Corporate Update 1H FY2014 Financial Results -...
22
28 August 2014 Corporate Update 1H FY2014 Financial Results
-
Upload
doannguyet -
Category
Documents
-
view
215 -
download
0
Transcript of Corporate Update 1H FY2014 Financial Results -...

28 August 2014
Corporate Update
1H FY2014 Financial Results

Achieved 2Q FY14 PATMI of RM89.5m, +132.5% y-o-yAchieved 1H FY14 PATMI of RM97.3m, +18.5% y-o-y
Total property sales amounted to RM935m Tropicana Collections Campaign garnered bookings of over RM600m
Inked land sales worth RM951m, including 308.72 acres of Canal City land to Eco World on 19 Mar 2014 for RM471m 3.14 acres of land along Jalan Bukit Bintang to Agile Property Holdings on 8 May 2014 for RM448m
Strategic Initiatives JV with Agile on property development – Potential GDV of RM2.5bn to RM3.0bn JV with LAPIS on International School – RM235m investment
Net Gearing of 0.59x @ Jun 2014
1H Launches of RM590m
Appointment of Lim Lai Seng as Chief Financial Officer on 28 August 2014 Previously Group Financial Controller at IOI Corp Bhd
Highest Profit Growth Company in the Property and REIT Sector (compounded 3-year PBT) The Edge Billion Club Corporate Awards 2014
2
1H 2014 Key Highlights
1H FY14 Financial Review
4
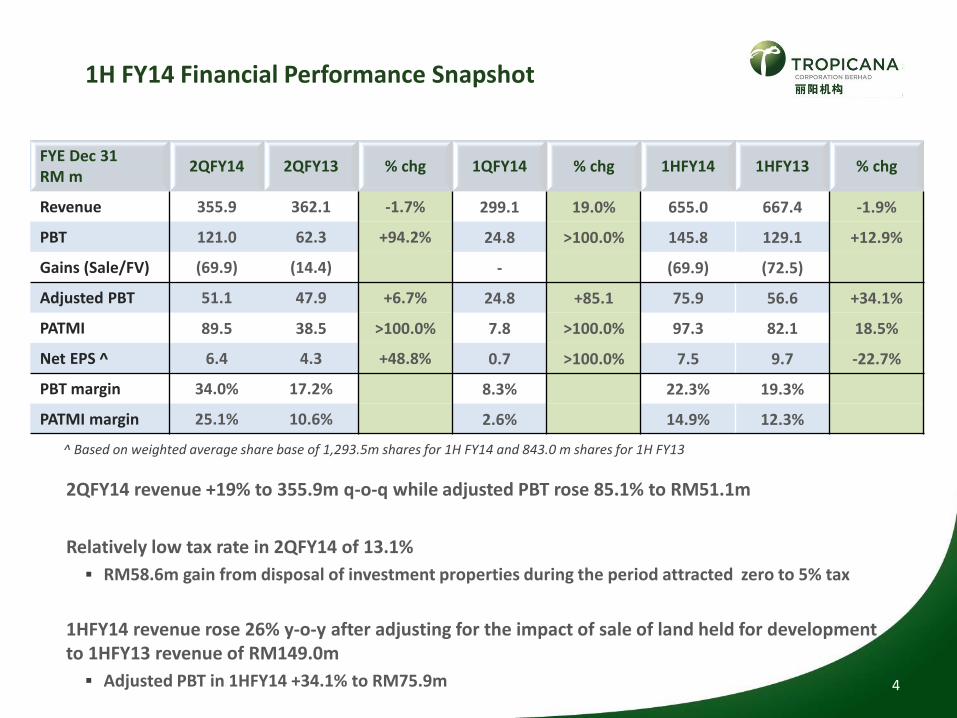
1H FY14 Financial Performance Snapshot
FYE Dec 31RM m
2QFY14 2QFY13 % chg 1QFY14 % chg 1HFY14 1HFY13 % chg
Revenue 355.9 362.1 -1.7% 299.1 19.0% 655.0 667.4 -1.9%
PBT 121.0 62.3 +94.2% 24.8 >100.0% 145.8 129.1 +12.9%
Gains (Sale/FV) (69.9) (14.4) - (69.9) (72.5)
Adjusted PBT 51.1 47.9 +6.7% 24.8 +85.1 75.9 56.6 +34.1%
PATMI 89.5 38.5 >100.0% 7.8 >100.0% 97.3 82.1 18.5%
Net EPS ^ 6.4 4.3 +48.8% 0.7 >100.0% 7.5 9.7 -22.7%
PBT margin 34.0% 17.2% 8.3% 22.3% 19.3%
PATMI margin 25.1% 10.6% 2.6% 14.9% 12.3%
^ Based on weighted average share base of 1,293.5m shares for 1H FY14 and 843.0 m shares for 1H FY13
2QFY14 revenue +19% to 355.9m q-o-q while adjusted PBT rose 85.1% to RM51.1m
Relatively low tax rate in 2QFY14 of 13.1%
RM58.6m gain from disposal of investment properties during the period attracted zero to 5% tax
1HFY14 revenue rose 26% y-o-y after adjusting for the impact of sale of land held for development to 1HFY13 revenue of RM149.0m
Adjusted PBT in 1HFY14 +34.1% to RM75.9m

5
Segmental Analysis
6 months ended 30 June(RM m)
Property Development
Property Invst & Resort
Invst Holding & Others
Consolidated
2014 2013 2014 2013 2014 2013 2014 2013
Revenue 468.1 582.5 72.0 69.0 115.0 15.8 655.0 667.4
Results from operations 71.1 121.5 89.5 42.2 1.6 (8.5) 162.2 155.1
Gains from Land Sales & Fair Value Adjustments
- (60.4) (58.6) (12.1) - - (58.6) (72.5)
Adjusted Results from ops. 71.1 61.1 30.9 42.2 1.6 (8.5) 103.6 82.6
Net finance cost (12.3) (11.7) (7.0) (2.6) (11.5) (14.7) (30.8) (29.1)
Associates - - - - 0.3 4.1 0.3 4.1
Jointly controlled entities - - - 14.2 (1.1) 14.2 (1.1)
PBT 58.8 109.8 82.5 39.5 4.5 (20.2) 145.8 129.1
Property Development Adjusted results from operations were up 16.4% in 1HFY14
Sustained by ongoing projects in Central Region (Tropicana Gardens and Metropark) and Southern Region (Tropez and Bora phases at Tropicana Danga Bay)
Property Investment & Resort segment boosted by gain on sale of land amounting to RM58.6m
Sharp improvement in performance of Investment Holding segment attributed to full impact of consolidation of Tenaga Kimia Sdn Bhd as a subsidiary effective May 2013 onwards
6
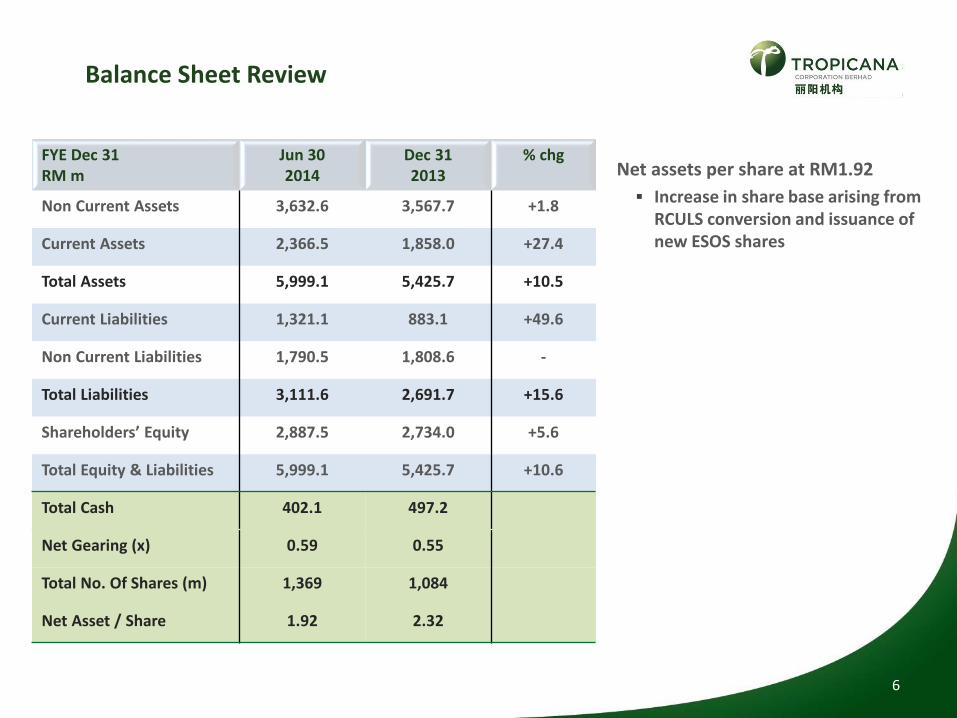
Balance Sheet Review
FYE Dec 31RM m
Jun 302014
Dec 312013
% chg
Non Current Assets 3,632.6 3,567.7 +1.8
Current Assets 2,366.5 1,858.0 +27.4
Total Assets 5,999.1 5,425.7 +10.5
Current Liabilities 1,321.1 883.1 +49.6
Non Current Liabilities 1,790.5 1,808.6 -
Total Liabilities 3,111.6 2,691.7 +15.6
Shareholders’ Equity 2,887.5 2,734.0 +5.6
Total Equity & Liabilities 5,999.1 5,425.7 +10.6
Total Cash 402.1 497.2
Net Gearing (x) 0.59 0.55
Total No. Of Shares (m) 1,369 1,084
Net Asset / Share 1.92 2.32
Net assets per share at RM1.92
Increase in share base arising from RCULS conversion and issuance of new ESOS shares
7
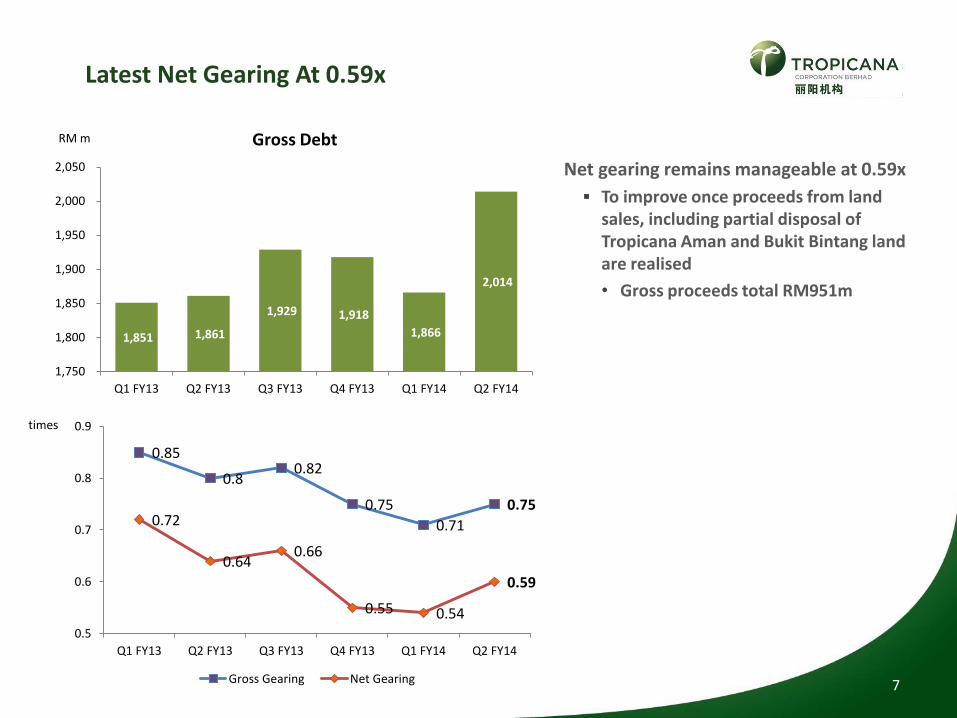
Latest Net Gearing At 0.59x
1,851 1,861
1,929 1,918
1,866
2,014
1,750
1,800
1,850
1,900
1,950
2,000
2,050
Q1 FY13 Q2 FY13 Q3 FY13 Q4 FY13 Q1 FY14 Q2 FY14
Gross Debt
0.85
0.80.82
0.75
0.71
0.750.72
0.640.66
0.55 0.54
0.59
0.5
0.6
0.7
0.8
0.9
Q1 FY13 Q2 FY13 Q3 FY13 Q4 FY13 Q1 FY14 Q2 FY14
Gross Gearing Net Gearing
RM m
times
Net gearing remains manageable at 0.59x
To improve once proceeds from land sales, including partial disposal of Tropicana Aman and Bukit Bintang land are realised
• Gross proceeds total RM951m

8
Quarterly Financial Snapshots
DEVELOPMENT SALES (RM m) GROUP REVENUE (RM m)
PROFIT BEFORE TAX (RM m) EARNINGS PER SHARE (sen)
145
289 269 261209
260
125
23 10235
5094
82
90
96
0
100
200
300
400
500
Q1 FY13 Q2 FY13 Q3 FY13 Q4 FY13 Q1 FY14 Q2 FY14
Prop. Dev. Land Sales Others
67 50 49
117
25
12112
208
0
50
100
150
200
250
300
350
Q1 FY13 Q2 FY13 Q3 FY13 Q4 FY13 Q1 FY14 Q2 FY14
Core Profits Fair Value Adjsts
5.53.1 2.2
5.3 0.76.41.2
17.9
0
5
10
15
20
25
Q1 FY13 Q2 FY13 Q3 FY13 Q4 FY13 Q1 FY14 Q2 FY14
Core EPS FV Adjsts
249
804 853
260
395
540
0
100
200
300
400
500
600
700
800
900
Q1 FY13 Q2 FY13 Q3 FY13 Q4 FY13 Q1 FY14 Q2 FY14

9
Sizeable Land Disposals Signed & Pending Completion
Landbank Sold Acquired AcresBook Value
(RM/psf)Sale Price (RM/psf)
StatusGross
Proceeds (RM m)
Net Gain(RM m)
Canal City land* 2013 308.72 18 35SPA signed,
19 Mar 2014471 170
Jalan Bukit Bintang, KL 2012 3.14 1,609 3,280SPA signed,8 May 2014
448 145
Kota Kinabalu, Sabah(2 parcels)
2012 1.91 303 380SPA signed,18 Jun 2014
32 1
Subtotal 951 316
* Partial disposal
1H FY14 land transactions to raise gross proceeds of RM951m on completion
Targeting more divestments of sizeable assets to improve gearing position
Sales Update

347
967
2,160
935
2011 2012 2013 1HFY2014
206
185172
127
44 44 39 37 3219 15 15
T. Heights Trop.Metropark
Trop. DangaBay
218Macalister
Others PenangWorld City
Trop. DangaCove
Trop.Cheras
Trop.Gardens
Trop.Landmark
Trop.Avenue
Trop.Grande 11
1H FY14 Sales Of RM935m
RM m
RM m
Breakdown of 1H FY14 SalesCentral Region
Northern Region
Southern Region
East Malaysia
1H FY14 SALES
Achieved RM935m sales in 1H FY14
57% of sales from Central Region projects
• Driven by Tropicana Metropark & Tropicana Heights
Targeting RM2bn sales in FY14
To be driven by RM2.6bn new launches in 2H FY14
57%23%
18%
2%

Sustained high unbilled sales of RM2.691bn as at 30 June 2014
Will continue to focus on project execution and delivery to translate this to revenue
12
High Unbilled Sales At RM2.7bn
57%24%
18%
1%
UNBILLED SALES As At 30 Jun 14Breakdown of Unbilled Sales As At 30 Jun 14 Central Region
Northern Region
Southern Region
East Malaysia
518
469 455 438
321
181
125
60 48 41 333
PenangWorld City
Trop.Gardens
Trop.Metropark
Trop.Danga Bay
Trop.Avenue
Trop.Heights
218Macalister
Trop.Cheras
Others Trop.DangaCove
Trop.Landmark
Trop.Grande
1,647
2,214 2,183 2,388
2,691
2QFY13 3QFY13 4QFY13 1QFY14 2QFY14

13
RM3.2bn planned launches in FY14
Development Estimated FY14 Launches(RM m)
Target Launch Period
1H FY14 Launches2H FY14 To Be
LaunchedLaunch Value(RM m)
Take-up Rate(%)
Tropicana Aman 381 4Q 2014 - - 381
Tropicana Heights 742 1Q&4Q 2014 270 83% 472
Tropicana Gardens 474 4Q 2014 - - 474
The Residences 832 4Q 2014 - - 832
Tropicana Danga Bay 216 4Q 2014 - - 216
Penang World City 235 4Q 2014 - - 235
218 Macalister 320 1Q 2014 320 57% -
GRAND TOTAL 3,200 590 2,610
RM2.6bn planned launches in 2H FY14
Strategic focus on Central Region launches, with estimated projects GDV of RM2.2bn
Includes 2nd phase of terrace and cluster homes in Tropicana Heights and maiden launch in Tropicana Aman

14
RM2.6bn Upcoming Launches in 2H FY14
Development2H FY14 Launches
(RM m)Project
TypeNo. of Units
Project Details
Tropicana Aman 381 Terrace Homes 432 Maiden launch
Tropicana Heights 472 Terrace & Cluster Homes 396 Phase 2 of Fairfield Residences
Tropicana Gardens 474 Serviced Apartments 454 RT3; after Arnica and Bayberry
The Residences 832 Serviced Apartments 350At KL City Centre. Part of mixed development featuring W Hotel
Tropicana Danga Bay 216 Serviced Apartments 118Tower 2 of Bora Residences; Tower 1 launched in 3Q 2013
Penang World City 235 Condominiums 437Block E & F, Tropicana Bay Residences. Blocks A-D launched in 3Q 2013
GRAND TOTAL 2,610
2HFY14 GDV BY REGION
83%
8%
9%
Central
Southern
Northern
2HFY14 GDV BY PRODUCT TYPE
33%
67%
Landed Products
HighRise Products

Strategic Initiatives
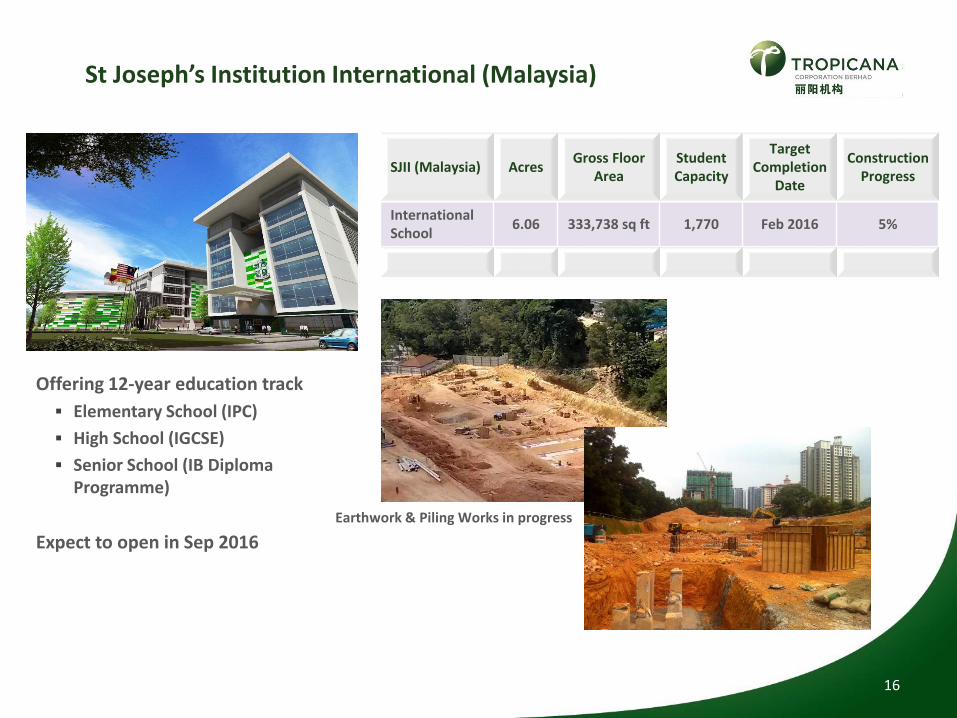
Offering 12-year education track
Elementary School (IPC)
High School (IGCSE)
Senior School (IB Diploma Programme)
Expect to open in Sep 2016
16
St Joseph’s Institution International (Malaysia)
SJII (Malaysia) AcresGross Floor
AreaStudent Capacity
Target Completion
Date
Construction Progress
InternationalSchool
6.06 333,738 sq ft 1,770 Feb 2016 5%
Earthwork & Piling Works in progress

JV with HK-listed Agile Property Holdings Ltd (“Agile”) to develop Bukit Bintang land
Through 70:30 JV company owned by Agile and Tropicana respectively
3.75 acres prime land in Bukit Bintang earmarked for mixed commercial development
Signing Ceremony on 8 May 2014
17
JV With Agile Property Group
Prospects & Outlook
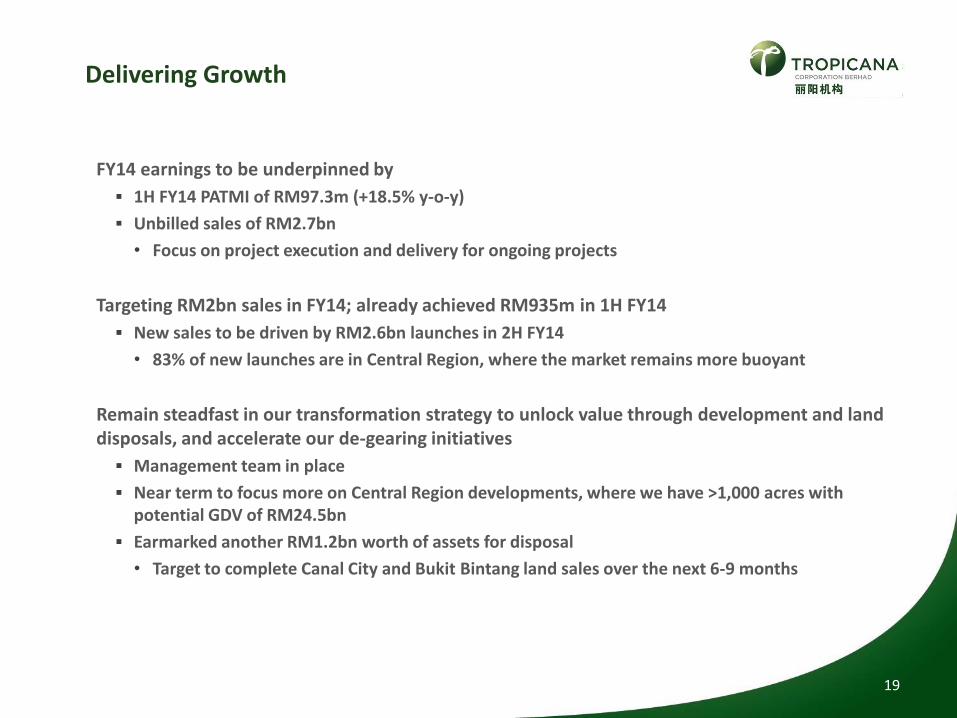
FY14 earnings to be underpinned by
1H FY14 PATMI of RM97.3m (+18.5% y-o-y)
Unbilled sales of RM2.7bn
• Focus on project execution and delivery for ongoing projects
Targeting RM2bn sales in FY14; already achieved RM935m in 1H FY14
New sales to be driven by RM2.6bn launches in 2H FY14
• 83% of new launches are in Central Region, where the market remains more buoyant
Remain steadfast in our transformation strategy to unlock value through development and land disposals, and accelerate our de-gearing initiatives
Management team in place
Near term to focus more on Central Region developments, where we have >1,000 acres with potential GDV of RM24.5bn
Earmarked another RM1.2bn worth of assets for disposal
• Target to complete Canal City and Bukit Bintang land sales over the next 6-9 months
19
Delivering Growth
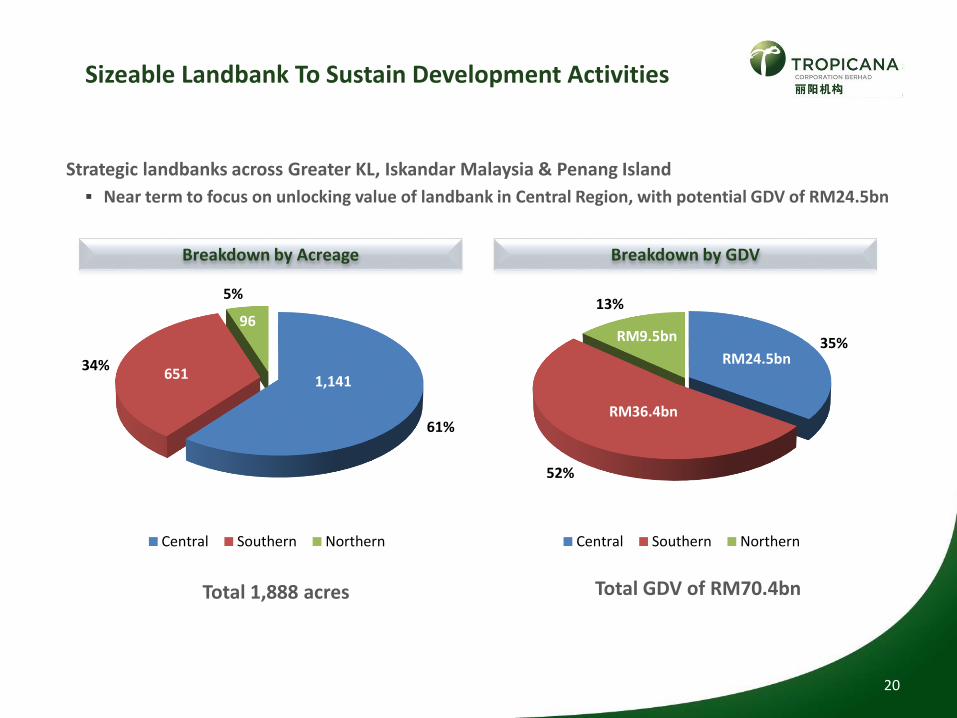
Strategic landbanks across Greater KL, Iskandar Malaysia & Penang Island
Near term to focus on unlocking value of landbank in Central Region, with potential GDV of RM24.5bn
20
Sizeable Landbank To Sustain Development Activities
Breakdown by GDVBreakdown by Acreage
Total 1,888 acres Total GDV of RM70.4bn
35%
52%
13%
Central Southern Northern
61%
34%
5%
Central Southern Northern
1,141651
96
RM36.4bn
RM9.5bn
RM24.5bn

New Launches Interest TenureRemaining
Land (acre)
Land Cost
(RM m)
Total GDV
(RM m)
Remaining GDV
@ Jun 2014
(RM m)
Development
Period
Tropicana Gardens 70% Leasehold 14.1 5.6 2,679 2,044 7 yrs
Tropicana Metropark 100% Freehold 80.7 351.7 7,165 6,335 16 yrs
Tropicana Heights 100% Freehold 173.4 204.5 1,726 1,456 11 yrs
Tropicana Danga Bay 60% Freehold 28.5 235.6 8,370 7,190 14 yrs
Tropicana Danga Cove 50% Freehold 215.3 208.7 12,140 11,708 13 yrs
Penang World City 55% Freehold 95.5 998.7 10,086 9,466 15 yrs
New Projects
The Residences 100% Freehold 1.3 123.0 1,150 1,150 4 yrs
Tropicana Aman 100% Leasehold 863.1 955.5 13,000 13,000 20 yrs
Casa Damansara 3 100% Freehold 1.1 3.5 135 135 3 yrs
Bukit Bintang Land 30% Freehold 3.8 541.6 n.a. n.a. n.a.
Others 100% Various 4.2 52.2 394 394 Various
Tropicana City Centre 100% Freehold 21.9 146.0 3,602 3,602 8 yrs
Tropicana Danga Lagoon 100%Freehold /
Leasehold62.2 130.6 2,500 2,500 15 yrs
TDB Hotel & Residences 60% Freehold 6.0 85.9 1,336 1,336 4 yrs
Tropicana Gelang Patah 100% Freehold 256.6 366.6 6,440 6,440 10 yrs
Senibong Waterfront 70% Freehold 60.0 444.3 3,673 3,673 7 yrs
GRAND TOTAL 1,887.7 74,396 70,429
21
Summary Of Future Launches
Thank you
For further information, please contact :
Mr Justin Law, Corporate Finance & Investor Relations
T : +603 7710 1018 ext 408
E : [email protected] / [email protected]
W : www.TROPICANACORP.com.my
IMPORTANT DISCLAIMERThe presentation pack is intended to provide financial and management information about Tropicana CorporationBerhad (“Company”) for investors’ information only and shall not be construed as an attempt by the Company toencourage, recommend or advise any transaction and the Company makes no guarantees in any manner as to theaccuracy of its contents.
The plans, strategies and decisions of the Company in this presentation pack except those derived from actualhistorical events, are expressions of future prospects prepared based on the information and hypothesis currentlyavailable to the management of the Company and may include various risks and uncertainties which may result ina variation of the performance and records actually announced in the future.
We encourage that you make your own decision in making your investments. The Company assumes noresponsibility in any way and shall bear no liability for the results of any and all transactions conducted by youbased on the use and/or referencing of the contents in this presentation pack.