Corporate Social Responsibility Initiatives and...
35
Corporate Social Responsibility Initiatives and Consumer Preferences in the Dairy Industry Oana Deselnicu, Marco Costanigro and Dawn Thilmany Department of Agricultural and Resource Economics, Colorado State University. Deselnicu: Ph.D. candidate, [email protected] Costanigro: Assistant Professor, [email protected] Thilmany: Professor [email protected] Selected Paper prepared for presentation at the Agricultural & Applied Economics Association’s 2012 AAEA Annual Meeting, Seattle, Washington, August 12-14, 2012 Copyright 2012 by Deselnicu Costanigro and Thilmany. All rights reserved. Readers may make verbatim copies of this document for non-commercial purposes by any means, provided that this copyright notice appears on all such copies.
-
Upload
nguyenminh -
Category
Documents
-
view
216 -
download
1
Transcript of Corporate Social Responsibility Initiatives and...

Corporate Social Responsibility Initiatives and Consumer Preferences in the Dairy Industry
Oana Deselnicu, Marco Costanigro and Dawn Thilmany
Department of Agricultural and Resource Economics,
Colorado State University.
Deselnicu: Ph.D. candidate, [email protected]
Costanigro: Assistant Professor, [email protected]
Thilmany: Professor [email protected]
Selected Paper prepared for presentation at the Agricultural & Applied Economics Association’s 2012 AAEA Annual Meeting, Seattle, Washington, August 12-14, 2012
Copyright 2012 by Deselnicu Costanigro and Thilmany. All rights reserved. Readers may make verbatim copies of this document for non-commercial purposes by any means, provided that this copyright notice appears on all such copies.
Abstract We conduct a best worst-ranking exercise to investigate consumers’ perception of the importance of twelve possible actions for a dairy farm engaging in Corporate Social Responsibility. Animal welfare is clearly identified as the most preferred activity and a top priority for most consumers. Sustainable agricultural practices, energy consumption, and waste management are ranked as second, third, and fourth respectively. Company involvement in the community has the lowest priority amongst the surveyed consumers. The perceptual profile of four fluid milk labels (Organic, Colorado Proud, Validus and Rbst free) is also investigated, showing that common milk labels do convey some information related to CSR activities. Most prominently, the Validus certification is immediately connected to improved animal welfare. Similarly, Colorado Proud sends a strong message related to locality and community involvement. USDA Organic and RBST-free convey a more complex message, where information cues include better nutrition, taste, and sustainable agriculture. Willingness to pay for the differentiating labels was estimated (stated preferences) to be $0.55/gallon for Colorado proud, $0.64/gallon for USDA organic, $0.49/gallon for RBST-free and $0.46/gallon for Validus. However, a very small share of these price premia could directly be attributed to consumers’ perceptions of implemented CSR activities. The Validus label is a clear exception: as currently framed, it elicits a strong perception of improved animal welfare, which in turn directly affects valuation of fluid milk.
Introduction Since the early 1990s, companies have been under increasing pressure to develop more environmentally sustainable and socially conscious business practices, and become active partners in the community (Mohr et al., 2001). Increased awareness from consumers, employees, media, and various special interest groups, but also a desire to innovate and find new market niches, have been some of the drivers of this development. Even though the corpus of the existing research on corporate social responsibility (CSR henceforth) originated from the managerial and financial literature (see Belkaoui, 1976 for an early contribution), Maloni and Brown (2006) recently emphasized the crucial role of social responsibility in the food system. In short, the food supply chain is a crucial part of a nation’s economy (7.7 percent of GDP and 12 percent of the labor force in the US according to Martinez, 2002), and the share is larger for developing countries. Unethical behavior within the food system has the potential to damage vast numbers of consumers (see Xiu and Klein ,2012, regarding the melamine incident in China, where more than 290,000 consumers, most of them children, where poisoned), and discussion of social equity issues is also particularly acute.
While the declared objective of CSR activities is serving a socio-environmental stewardship mission, researchers have pointed out how social responsibility can also enhance firm reputations and create a loyal base of consumers (Pirsch et al., 2012), attract a quality workforce (Greening, 2011), or differentiate own products from competitors allowing a firm to consistently charge a price premium. Regarding the latter, cases of successful differentiation in the food industry based on CSR involved efforts to improve practices for agricultural products imported from developing countries (e.g. fair trade coffee, see De Pelsmacker et al. 2005; Loureiro & Lotade 2005), where environmental and labor regulations are otherwise considered lax by contemporary western standards. More recently, CSR standards in the US food supply chain are commonly implemented in response to pressures from large distributors and retailing chains desiring to insure against negative publicity and media scandals (e.g. Costco and WalMart, see Martinez and Kaufman, 2008). From the limited empirical evidence that exists, it appears that food sector firms engaging in social responsibility may be able to collect a premium price for their products.
This study investigates the plausibility of using CSR to differentiate the products (fluid milk) of a profit-maximizing dairy farm. Arguably, the potential for environmental externalities and the rising consumer awareness of animal welfare issues in livestock operations (Lusk et al., 2011) make the dairy industry a particularly relevant testing ground for CSR-based product differentiation strategies. By committing to specific CSR goals, firms may improve animal welfare as well as mitigate potential harmful effects to air quality (by reducing methane and/or other emissions), soil (via appropriate grazing and waste management practices), and water (by monitoring waste runoff) (Center for US Dairy, 2010, EPA, 2007).
Quite obviously, CSR-driven purchases will occur only if consumers: 1) value the CSR activities implemented by a firm, and perceive that not all firms engage in such activities; and 2)
have access to relevant CSR information at the moment of purchase. Accordingly, the specific objectives of this study are: I) to assess consumer preferences and priorities for specific CSR initiatives for U.S. dairy operations; II) to examine if and how existing or commonly used milk labels convey information related to CSR activities; and, III) determine whether willingness to pay (WTP) for fluid milk increases when specific CSR activities are implemented. Corporate Social Responsibility Background
In this section we provide a brief overview of the current state of the debate over CSR. In doing so, we loosely follow a recent exposition by Hartmann (2011).Mohr et al. (2001) define CSR as “a company’s commitment to minimizing or eliminating any harmful effects and maximizing its long-run beneficial impact on society”. Thus, CSR entails a proactive role of firms in internalizing negative social and environmental externalities, or more generally, the provision (reduction) of a public good (bad). As neoclassical economics defines profit maximization as the main purpose of firms (Hart, 1989; Friedman, 1970), the active engagement of firms in the provision of public goods has been criticized as being outside the responsibilities of a profit-maximizing firm, and under the jurisdiction of law-enforcing governments (Kitzmueller, 2010; Benabou and Tirole, 2010).
However, CSR is not incompatible with profit-maximizing firm behavior, nor does it necessarily betray shareholders’ interests. The utility derived by the CSR assurances can be either monetary, i.e., higher product prices, or non-monetary, i.e., social prestige or feeling good about firm’s actions. The literature integrates both the monetary and non-monetary aspects as complementary parts of the total utility derived from having a CSR (Kitzmueller, 2010). Thus, firms may engage in “strategic CSR” and be socially responsible with the anticipation of deriving long-term benefits from their actions (Baron, 2001; McWilliams and Siegel, 2001; Bagnoli and Watts, 2003). Alternatively, CSR can directly reward company stakeholders (consumers, employees) who have preferences aligned with social responsibility in a nonpecuniary manner (Kitzmueller, 2010). In summary, CSR activities can be positioned at the intersection between the disinterested provision of public benefits and profit-maximizing firm behavior (Kitzmueller, 2010).
Even though CSR activities are generally not expected to directly change intrinsic product characteristics in a tangible way, the portfolio of CSR activities may influence consumers’ perceptions about the product sold by a firm. As one example, Harper (2002) finds that animal welfare is one of the main reasons for buying organic food, and consumers may associate animal well-being with food quality outcomes. It is not yet clear however to what extent consumers are motivated by concern for the animal or concern about the impact of the animal’s quality of life on the food product.
Regardless of whether it is “strategic” or not, once enacted CSR may have several consequences for firms and consumers alike. On the producer side, CSR may prove useful in attracting a quality workforce (Greening, 2011). In the supply chain, it can play the role of partial insurance against unforeseen scandals and negative media releases about the firm’s business
practices. Competitive trends related to brand positioning, marketing and innovation (Spar et al., 2003; Maignan et al., 2002) and increased pressure from the market forces of globalization, heightened regulatory pressure, and sustainable development (Panapanaan, 2003) are added reasons for CSR adoption. On the consumer side, CSR may help create a loyal base of consumers (Pirsch et al., 2012), help a nascent firm gain a market foothold if competing CSR product lines don’t yet exist, and positively contribute to the development of a firm’s reputation. From a social welfare perspective, CSR is beneficial when negative firm externalities on society and the environment are internalized by the firm.
In a retail setting, provided that it aligns with consumer preferences for certain initiatives,
CSR could be used as a purchase criterion. At parity of other characteristics important to consumers, a firm displaying a better CSR record may sell its products at a price premium if CSR-based product differentiation is feasible. This is especially true in the context of the contemporary shift in preferences and values, especially among more affluent Western consumers, towards more environmentally and socially friendly products in the wake of a more rapid spread of information through advancing communication technologies (Moon and Vogel, 2009; Benabou and Tirole, 2010).
However, while consumer interest in CSR has been surely increasing, only a limited number of consumers may actually use it as a purchase criterion. One study found that , out of the consumers who are likely to make a CSR-based purchase, only a minority (21%) actually use a company’s CSR position as a purchase criterion (Mohr et al., 2001), a phenomenon that has been referred to as “the paradox of CSR” (Öberseder et al., 2011).
Interviews about how people incorporate CSR information in purchase decisions reveal three factors that predict consumer behavior with respect to CSR (core, central, and peripheral factors), Öberseder et al., 2011. Core decision-making factors include obtaining information about CSR initiatives and the presence of personal concern from consumers towards these initiatives. While the former lies mostly within the company’s power, the latter is subjective, personal, and cannot be influenced by companies. The central factor is the price, or how much the consumer is able and willing to pay for the product based on company CSR initiatives. Peripheral factors include (1) the image of the company, (2) the credibility of the CSR initiative (i.e., must be aligned with company’s core business and must have a credible channel of communication), and (3) the influence of peer groups (word-of-mouth about the reputation of the company).
According to this classification, the purchase decision-making process involving CSR is hierarchical (Öberseder et al., 2011). Once the core factors are met (obtaining information about CSR initiatives and personal concern towards these initiatives), consumers can initiate the CSR-based purchase if the central factor (price) corresponds to their willingness to pay. Peripheral factors explain why some consumers are still skeptical about purchasing even when the core and central factors are met.
The core factors are essential in initiating the purchase decision-making process. While personal identification with CSR initiatives is subjective and cannot be influenced by companies, corporations can investigate what most of its customers are interested in and prioritize improvements or policy changes in those CSR areas. In addition, identifying the best ways to convey CSR information to consumers is critical in initiating the purchase. In fact, research indicates that consumers rarely have access to CSR information in market situations (Hartmann et al., 2011), which is a major obstacle in allowing firms to use CSR as a marketing and product differentiation tool (Mohr et al., 2001; Du et al., 2010).
Drawing on the literature outlined above, this study investigates the possibility of having a “strategic CSR” in the dairy industry in the context of product differentiation. The CSR-purchase core factors of (1) identifying consumer preferences for CSR activities and (2) obtaining information about CSR overlap perfectly with the first two objectives of this study.
The first objective is to assess consumer preferences and priorities for specific CSR initiatives in dairy operations, essentially formulating an impactful core for consumers. The second goal is to examine if and how existing, commonly used milk labels convey information related to CSR activities. Alternatively, the third objective investigates the effectiveness of product differentiation and its relationship to the “central factor” outlined above. In short, we wish to determine whether willingness to pay for fluid milk increases when specific CSR activities are implemented. Survey Methodology
A survey of milk consumers recruited amongst Colorado State University (CSU) was carried out in the summer of 2011. A total of 96 individuals were included in the study, based on a first-reply policy to an invitation e-mail which was sent to the entire administrative staff population at CSU. The invitation was not sent to CSU students and faculty. The survey was administered via computer in a controlled setting in a computer laboratory in a CSU facility. Survey sessions included 20-25 participants each. In addition to a section soliciting socio-demographic information, surveys consisted of three types of tasks, which directly relate to each one of the stated research objectives.
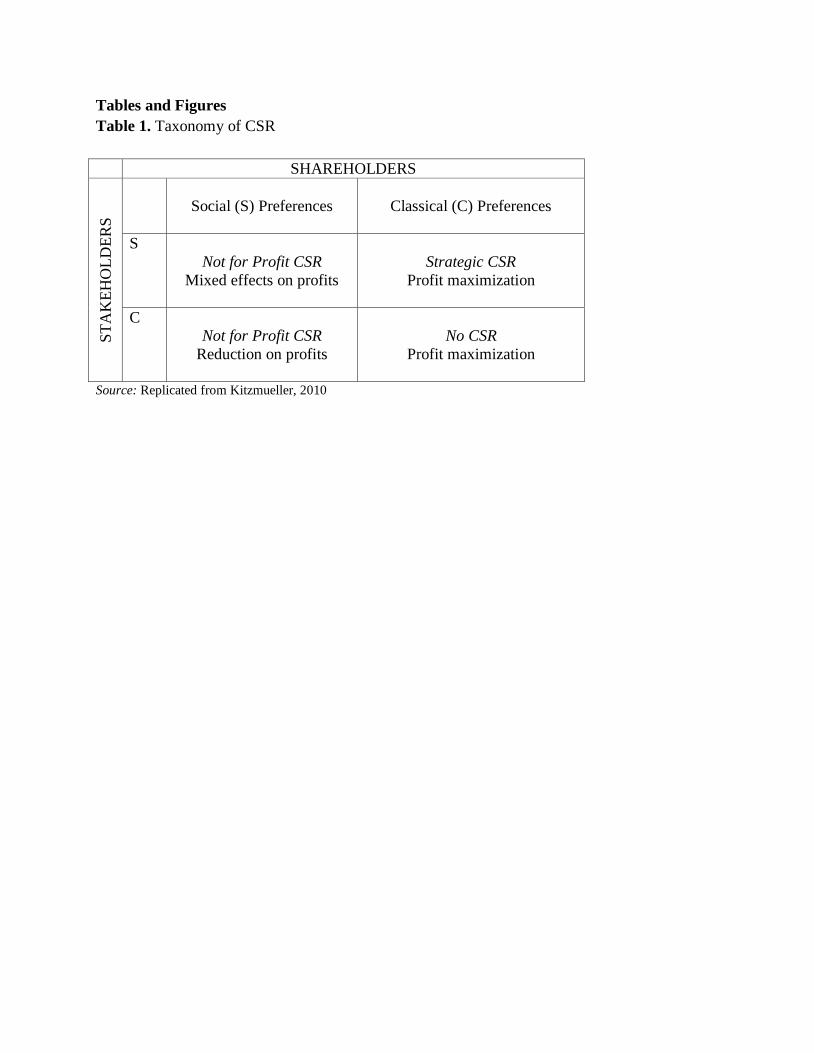
I. Best-worst ranking In a best-worst exercise (Finn et al., 2006) participants ranked the involvement of a hypothetical dairy farm in nine alternative CSR activities based on the importance they placed on the following activities: animal welfare, energy consumption, water consumption, air pollution, community involvement, employee opportunities, local operation, waste management, and sustainable agricultural practices. The description of each CSR activity provided to the participants is reproduced in Table 2.
(Insert Table 2 here)
A balanced incomplete block design (BIBD) was used to create 12 choice sets of six CSR alternatives each1. Respondents were asked to choose the most important and the least important CSR area to them, as it is shown in Figure 1.
(Insert Figure 1 here)
The best-worst method, sometimes also called the max-diff approach, extracts a final ranking of consumer preferences by repeatedly asking them to compare all the pairs of alternative CSR actions available in a set and choose the one which maximizes the utility difference between the best and the worst (Finn et al., 1992). Best-worst surveys have several advantages over traditional measures of preference such as Likert scales. First, it forces people to make trade-offs by choosing a best and a worst alternative while, with a scale system, all alternatives could be viewed as “best/ important” or “worst/ least important” (Lusk, 2009). Second, people interpret ordinal scales differently. When a person chooses a 5 from a scale of 1 to 5, this might actually represent a 4 for another respondent (Lusk, 2009). However, there is no bias in the best-worst scale as there is only one best-worst pair each consumer can choose (Cohen et al., 2002). Therefore, best-worst coefficients are directly comparable between people and result in individual as well as aggregate ranking scales. Third, despite the sometimes large number of choice sets and the repetitiveness of the exercise, participants find the task easy and quick to complete (Goodman et al., 2005, Auger et al., 2004, Cohen et al., 2002).
II. Label mapping Next, participants were asked to use a quantitative scale (from -5 “much worse” to + 5 for
“much better”, in increments of one) to express how fluid milk displaying a specific label certification (USDA Organic, RBST-free, Validus, and Local Colorado Proud) was perceived to perform in the nine selected CSR areas when compared to a similar fluid milk without the labeled certification. A description of each of the labels used in this study is provided in Table 3.
(Insert Table 3 here) The slider bar for this exercise covers the -5 to +5 range, and initially it is set at zero. By
moving it left (performs worse), right (performs better), or leaving it at zero (performs the same), respondents indicate the degree they associate the milk label with for each specific CSR area. The set-up of this type of question can be examined in Figure 2.
(Insert Figure 2 here)
III. Valuation 1 In SAS, the %mktbsize and %mktbibd macros were used to generate a BIBD with 9 attributes, 6 attributes per choice set, and 6 overall appearances by each attribute across choice sets

Finally, for each of the four mentioned labels, participants used a sliding bar tool (from -$2.00 to +$2.00 in increments of 10 cents) to express how much more or less they would be willing to pay for a gallon of milk displaying the label (USDA Organic, RBST-free, Validus, and Local Colorado Proud), compared to a gallon of milk without it. The exercise was then repeated, but, rather than their own valuation, participants were asked to estimate how much the general consumer population would be willing to pay for the label2. Examples of this type of question eliciting own and peer valuation are provided in Figure 3.
(Insert Figure 3 here)
Data Description and Survey Participants Characteristics
The study sample statistics provided in Table 4 are comparable to state of Colorado demographics provided by the US Census Bureau (US Census Quick facts, 2012). In terms of racial composition the statistics show: whites (non-Hispanic) make up 70% of the population in Colorado, but are 83% of our sample, while those self-identifying as black are 4% of both samples. This study under-represents two minorities including those identifying as Asian (which make up 2.8% of Coloradans and 2% of our sample) and Hispanics (11.3% of Coloradans and 5.2% of our sample). The median household income in the state of Colorado (years 2006-2010) was $56,456. This is comparable to our sample’s median income category of $50,000-75,000.
(Insert Table 4 here)
Demographic data on gender, age, and race is presented in Figure 4. Most of the participants are female (74%). Since females are generally the primary shopper in the household, and the most represented gender among grocery store customers, the sample may be representative of the appropriate target demographic for milk buyers.
(Insert Figure 4 here)
The average age of the sample is 42 years old, with most of the sample falling into the 30-39 years old bracket (34%), followed by the 50-59 age group (24% of the sample). Some of the household characteristics of our sample are presented in Figure 5.
(Insert Figure 5 here)
2 Research shows that individuals under scrutiny (in a research survey situation, for example) tend to over-state their WTP on socially desirable issues (Fisher, 1993). If their own reported WTP is inflated, perhaps due to the social desirability bias phenomenon, a question eliciting their peers’ WTP may offer a more realistic statistic
Generally, the sample is composed of families of two members (55%) or one member (28%). In terms of households with children, who are generally frequent milk-consumers, 24% of the sample has one or more kids.
Education and household income statistics are presented in Figure 6. In terms of socio-economic characteristics, our sample may be slightly more educated than the state’s average as almost half of the sample (49%) has a graduate degree.
(Insert Figure 6 here)
Next, 29% of respondents have a college degree, while the rest have technical (9%), some graduate (10%), and high school (2%) studies. In terms of income, there is a wide variation with the lowest self-reported income under $20,000 and the highest one reported as over $150,000. Generally however, the highest percentage of respondents report a household income of about $50-74,000 (30%), followed by $35-49,000 (19%) and $75-99,000 (19%). Figure 7 presents the average willingness to pay (WTP) statistics for our sample. As expected, the average own WTP is consistently higher at a sample level and by label than the peer WTP.
(Insert Figure 7 here) The largest gap in valuation is for the Validus label (about $0.3), while the smaller is for Colorado Proud label (under $0.1). The Organic label commends the highest own average WTP, followed by Validus, RBST-free and Colorado Proud. In terms of average peer WTP, the Organic label is still associated with the highest average WTP, but it is followed by Colorado Proud, RBST-free, and finally, Validus. This changes in ordinal own and peer WTPs may suggest some peripheral issues for CSR and perceptions of social norms among respondents. Data Analysis
The data analysis follows our three objectives closely. Related to the first objective, we use a best-worst (maxdiff) exercise to rank of the nine CSR activities based on consumer preferences. If there is heterogeneity in consumer CSR ranking, segmenting consumers based on the similarity of their CSR preferences is the follow-up to this analysis.
The best-worst data is analyzed using the counting method (Lusk et al, 2009). This implies that the final “score” of a particular alternative, j, is calculated as the difference between the amount of times it has been voted “best” and the amount of times it has been voted “worst” across all study participants:
Where i=individual, j=CSR activity, n=1-12 choice sets
When the results obtained in this fashion are sorted in decreasing order, the CSR activity with the highest “score” is ranked first and interpreted as being the overall most important to consumers, the next one is the second highest in importance, and so on.
When ranking heterogeneity is high, groups of consumers displaying similar CSR preference may be identified. A principal component analysis (PCA) is applied to each individual’s personal ranking of each activity. Our goal is to extract the underlying patterns in people’s ranking preferences that make them behave similarly in the marketplace. These underlying principal components that capture behavior can be subsequently used to segment consumers with similar preferences. K-means clustering of these principal components is used to identify these consumer clusters. The K-means method computes the distance of every individual from the mean of each cluster and assigns the participants to their nearest cluster (Wishart, 2001). While K-means clustering is criticized for problems with determining the appropriate distance measure and appropriate number of clusters (Green et al., 1967, Frank et al., 1968), anchoring it in principal components that are orthogonal and linearly uncorrelated can help improve the quality of this analysis.
Next, the valuation data is examined. As a general framework for this analysis, Figure 8 illustrates that when consumer preferences for CSR activities map into consumer perceptions of milk labels as CSR information media, they may lead to consumer valuation of milk products.
(Insert Figure 8 here) In the first regression model (1) we investigate if and how any of the CSR and non CSR
factors included in our study influence consumer WTP for fluid milk. An OLS fixed-effects panel regression is applied to the pooled data of label valuations. The dependent variable in Model (1) is the peer (rather than personal) WTP for each of the four labels in our study, and the regressors are consumers’ subjective perceptions of the label across the nine CSR dimensions in the study, plus four label-specific dummy variables (fixed effects). Model (1) is expected to capture the individual effects of CSR actions on (any) label valuations.
(1)
Where i=individual, j=label Model (2) investigates the effect of CSR label perceptions on each label separately.
Certain CSR activities might be relevant only to specific labels. Own and peer WTP measures
are used as dependent variables one at a time. The independent variables consist of the CSR areas that display “spikes” in each of the label mappings (that is, other areas are omitted). These independent variables are mean-centered to indicate an average perception of the CSR activities. In this case, the constant term, α0, represents the contribution of all other non-CSR factors to the valuation of the label. We expect these contributions to own WTP to be generally higher than peer WTP, if social desirability bias exists in this sample.
(2)
Where i=CSR Activity, j= label
Results and Discussion Presentation of the results follows the same outline of methods presented above, and in the order of research questions originally framing this study. In essence, each set of results is an important element of how a food business would measure potential customer base, potential impacts on product revenues and appropriate promotional approaches to a CSR strategy.
CSR Priorities for Consumers
Table 5 presents the overall ranking of the CSR activities obtained from the best-worst exercise. The overwhelming majority of participants stated that investment in improving Animal Welfare practices is the most important CSR activity. Next, sustainable agriculture practices showing the company’s commitment to maintaining good soil health, ranks second. The third issue of high importance to consumers is energy consumption. According to our results, the least important activities are water management (somewhat surprising in the water-constrained Colorado region) and community involvement.
(Insert Table 5 here) While the low ranking of some CSR activities is perhaps surprising, we find evidence of
heterogeneous preferences amongst consumers. That is, a specific CSR activity may not be very important for the general population, but be extremely significant for a niche of consumers. For example, “local” was voted the most important practice in 100 choice decisions (third highest in terms of “best” votes) but its overall rank is 7th. Regardless of this heterogeneity, similarities in individual ranking patterns between consumers can be used to identify groups of consumers (segments) with similar priorities. While areas unanimously ranked as “best” (animal welfare) and “worst” (community involvement) are not expected to change ranking across consumer segments, the importance of other “mid-range” activities varies.

In order to identify consumer segments, we used a K-means clustering algorithm identifying similarities in the pattern of best-worst responses (more precisely, five principal component factor scores extracted from the data). This clustering approach simultaneously maximizes within-group similarity and cross-group differences in stated CSR priorities (Bond et al., 2008). CSR preferences within each group as well as group characteristics are provided in Table 6. Two specific consumer sub-groups emerge from the results: one emphasizes local business, equal opportunities for employees, and sustainable agricultural practices; while the other prioritizes air pollution, energy consumption, water quality, and waste management. The CSR preferences of the third group (Mixed) are quite similar to those we previously identified for the general population.
(Insert Table 6 here) While all the nine investigated CSR activities entail desirable social and public welfare
outcomes, the difference between the first two consumer segments seem to reside in the link between the proposed CSR activity and the nature of the resulting outcome. The first group of consumers prioritizes outcomes which the individual firm can accomplish independently (e.g. enforcing equal opportunities for their employees). We label this cluster as the “local” group as the beneficiaries of these CSR activities are the local communities and employees of the company. The second group prioritizes more “global” or collective outcomes including: air and water quality, energy consumption, and proper waste management imply the concerted efforts of a large number of firms. The beneficiaries of these CSR activities are not only the communities around the firm, but also the general population and broader ecosystems.
The local development consumer cluster has a high household income, the highest average own willingness to pay (WTP) for milk labels and it should be noted that 85.7% of that group drink milk “Often”. However, this is a rather small segment (22%) of our sample. The Mixed group represents the bulk of our sample (60%), and despite their relatively smaller household income, their average own WTP for milk labels is second highest. They are also heavy milk drinkers (72.5% drink it “Often”). Plain milk consumption patterns of our sample are provided in Figure 9.
(Insert Figure 9 here) Do Milk Labels Convey CSR Information?
Product labels may be a vehicle for transmitting CSR involvement information in a
grocery store setting where consumer purchase decisions are made. Figure 10 shows how perceived CSR outcomes (averaged across study participants) map into existing labels/certifications. A profile of the information carried by each label in the eyes of consumers is thus created. Results suggest that the Organic label is positively associated with animal
welfare, energy, sustainable agriculture, waste management, taste, nutrition. The RBST-free label strongly maps to taste, safety and nutrition, and to a lesser degree, into animal welfare, energy and sustainable agriculture. The Colorado Proud labels is associated with reduced air pollution, community involvement, local business, and taste, while the Validus label transmits strong information cues about animal welfare, and less robust signals regarding employee opportunities, sustainable agriculture, waste management, taste, safety, and nutrition.
(Insert Figure 10 here)
Examining Figure 10, we note that milk labels can be categorized according to the dimensionality of the information carried. Multidimensional labels (e.g. Organic) communicate cues mapping into a wide spectrum of outcomes and may have the advantage of appealing to a large number of consumers having various preferences. In contrast, mono-dimensional labels (Colorado Proud, Validus) present a single major “spike” in one product attribute and may have the advantage of transmitting a single strong, clear message to consumers. It should be noted that, in a marketplace with an increasingly large amount of information to process, these more clear signals may be more effective in differentiation than those that are overly complex.
Do CSR Claims contribute to label valuations?
Two key pre-requisites have been identified for the occurrence of a CSR-based purchase: (1) whether consumers personally identify with the CSR activity portrayed; and (2) if they have access to information on that CSR activity at the moment of purchase (Öberseder et al., 2011). In the following results, we try to establish a link between consumer preference for CSR actions, consumer perceptions of these labels, and consumer valuation of existing milk labels as vehicles for transmitting CSR information in the store at the moment of purchase. Thus, the connection between consumer WTP and CSR actions is not direct, but rather disentangled from how consumer perceptions about the information conveyed by labels contribute to their valuation of these labels.
Results from this model (1) presented in Table 7 show that the only CSR activity that is positive and statistically significant (at1% level) in contributing to consumer WTP is animal welfare. We estimate that, across the four labels, increasing perceptions about the impact on animal welfare by one unit (on an importance scale of 1 to 5) contributes to WTP by an average of $0.07 per gallon of milk. CSR activities that do not influence WTP are either not valued by consumers, or are not sufficiently conveyed by the labels investigated in this study.
(Insert Table 7 here)
Estimates of the label-specific fixed effects are presented in Table 8. Controlling for the
CSR contribution to valuation, all the other (non-CSR) contributions collect a WTP amounting to $0.53 per gallon for the Colorado Proud label, $0.44 per gallon for the Organic label, $0.32 per
gallon for the RBST-free label, and $0.20 per gallon for the presence of the Validus label (all estimates are significant at the 1% level). The contribution of the CSR-related consumer perceptions to label valuation is presented in the last column of the table. The valuation attributable to CSR outcomes is largest for the Validus label ($0.26), which is not surprising given it maps so closely to animal welfare, followed by the Organic label ($0.20). If introduced in the market, the Validus label has the potential, among the labels investigated, to collect the highest price premium due to CSR perceptions. We can also explore the connections between these labels and CSR areas more fully.
(Insert Table 8 here) Model (2) investigates each label separately, with a part-worth estimate of how each CSR
area may contribute to that label’s value. Results presented in Table 9 show whether consumer label perceptions of CSR areas contribute to the valuation of that label. For example, a 1-unit increase (on a scale of 1-5) of animal welfare perceptions contributes to the valuation of the Validus label by $0.12/gal. A one-unit increase in perceptions of community involvement and water management associated with the Colorado Proud label contribute, respectively, $0.11/gallon and $0.08/gallon to the label valuation. For the Organic label, increase in perceptions of sustainable agricultural practices contributes to label valuation by $0.08, while water consumption perceptions may actually negatively impact this label.
(Insert Table 9 here)
Conclusions and Marketing Implications
This study investigates three dimensions of consumer perceptions of CSR activities relevant to the dairy industry. First, we examine consumer preferences and priorities over a set of nine alternative CSR-related activities. Second, we assess if and how four milk labels may convey information related to CSR outcomes. Finally, we obtain consumer willingness to pay for each milk label, and explore whether, at least for some labels, a link between CSR activities and WTP can be established.
Based on the results of the ranking exercise, animal welfare is clearly identified as the most preferred activity and a top priority for most consumers. This finding was somewhat expected given increased consumer sensitivity towards livestock production practices, but the overwhelming consensus for prioritizing animal welfare initiatives is striking. Sustainable agricultural practices, energy consumption, and waste management are ranked as second, third, and fourth respectively; while company involvement in the community has the lowest priority amongst consumers.
With the exception of animal welfare, rankings of CSR initiatives display some degree of heterogeneity across participants. Two differentiated groups of milk consumers can be identified using clustering techniques based on consumer preferences for local (employee opportunities,
sustainable agricultural practices) vs. global (air or water pollution) CSR actions. A third group, containing the majority of our sample (60%) does not seem to make this distinction so discriminating among consumers solely on the basis of CSR preferences may not be particularly insightful unless a food company is trying to gain a foothold in the market by serving the needs of a small, but well-defined buyers.
In the second part of the study, we mapped the perceptual profiles of four labels: USDA Organic, CO Proud, RBST-free and Validus (animal welfare). The profiles disentangle the information content of each label by mapping them into perceived outcomes across several CSR dimensions, as well as taste, nutrition and food safety. As one may expect, consumers associate the Validus certification primarily to improved animal welfare, but also to somewhat better nutrition, taste and food safety. Similarly, Colorado Proud sends a strong message related to locality and community involvement. In contrast, the USDA Organic and RBST free labels convey a more complex message: Organic maps into sustainable agricultural practices (as expected), but also is aligned with better nutrition, taste, and animal welfare in the minds of consumers. Similarly, Rbst free is associated with animal welfare, food safety, and sustainable agricultural practices among potential buyers.
The distinction between single-dimension (Validus and Colorado Proud) and multidimensional (Organic and Rbst) labels arising from the perceptual label profiles has relevant marketing implications. While multidimensional labels are able to convey a more elaborate and complex message, one-dimensional labels deliver a focused message and can elicit a “perceptual spike”. Thus, it is possible that multidimensional labels may be suitable for targeting a broader consumer population (with heterogeneous preferences), while one-dimensional ones may appeal to more specific consumer niches who may make purchase decisions anchored on a specific issue of great importance to their values.
While we find that consumers are willing to pay a premium for fluid milk carrying the Organic, Rbst free, Colorado Proud and Validus labels, the link between label valuation and CSR is generally weak, either because consumers are not willing to pay extra for such activities, or because CSR messages are not effectively transmitted by the examined labels. The Validus certification is a clear exception: out of all the CSR activities considered, study participants attributed the highest priority to animal welfare, and the Validus label triggered an increase in product valuation because, as currently framed, it is strongly aligned with animal welfare improvements. This suggests that product differentiation based on animal welfare may be a viable option for the dairy industry to effectively target a large cross-section of milk consumers.
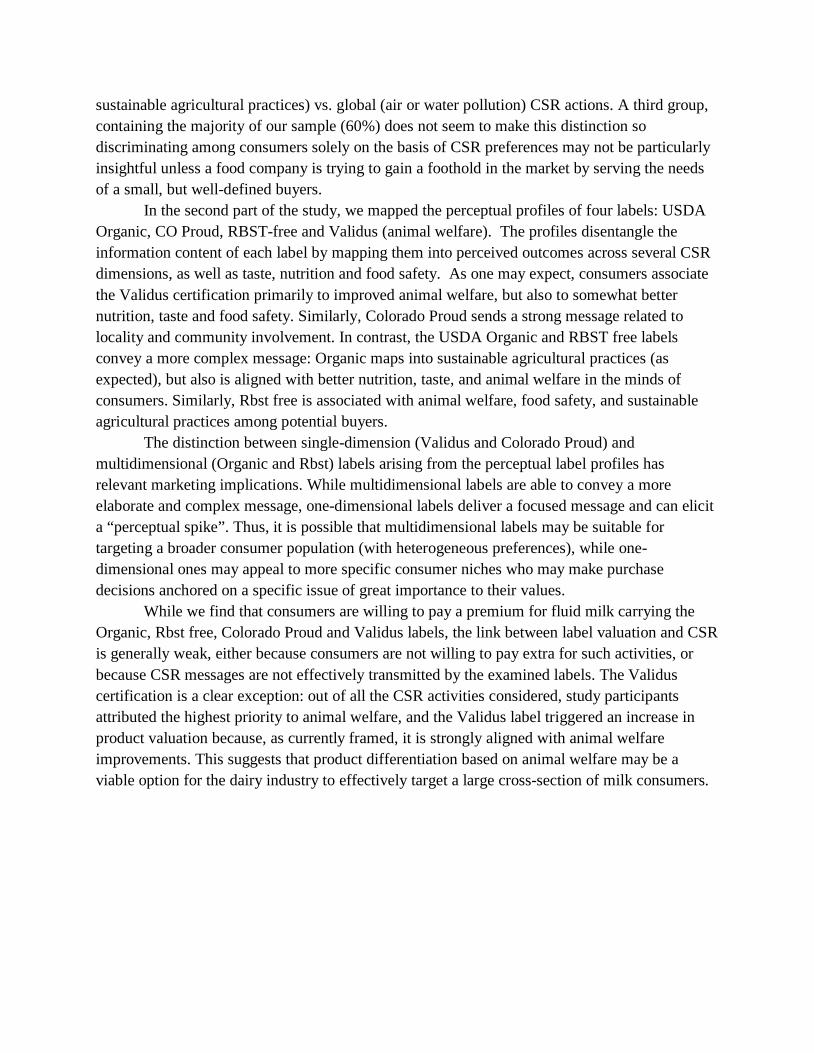
Tables and Figures Table 1. Taxonomy of CSR SHAREHOLDERS
STA
KEH
OLD
ERS
Social (S) Preferences
Classical (C) Preferences
S Not for Profit CSR
Mixed effects on profits
Strategic CSR
Profit maximization
C Not for Profit CSR
Reduction on profits
No CSR
Profit maximization
Source: Replicated from Kitzmueller, 2010
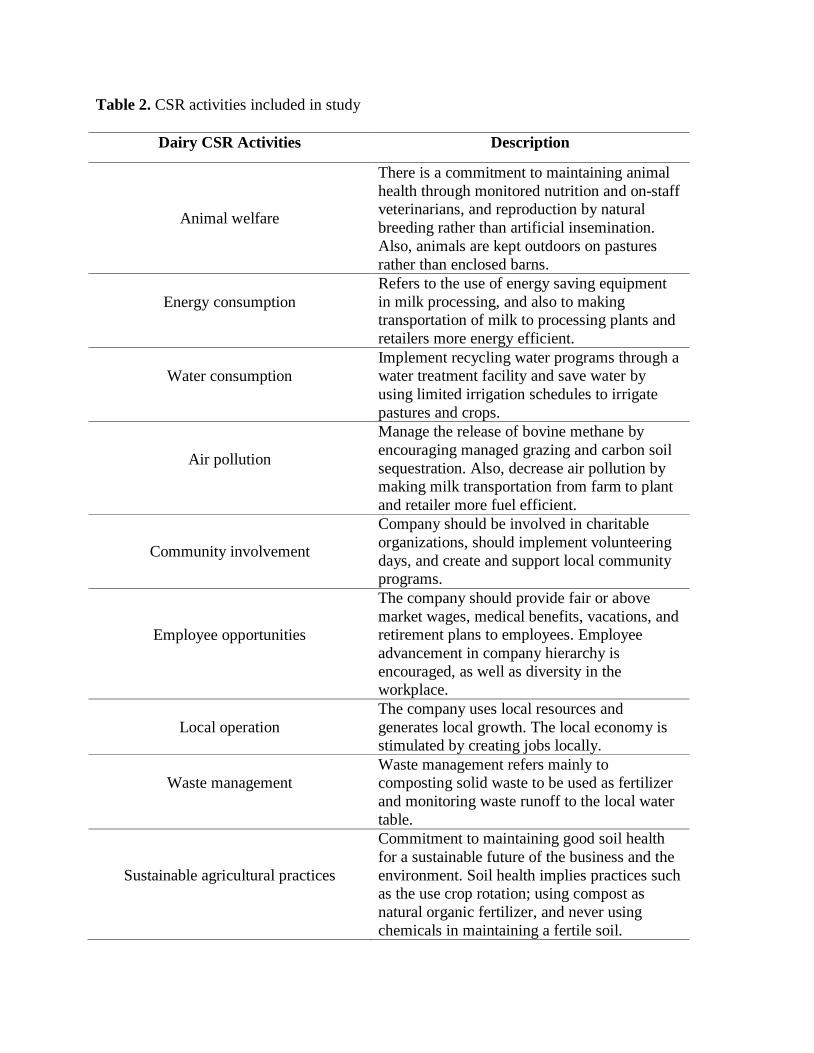
Table 2. CSR activities included in study
Dairy CSR Activities Description
Animal welfare
There is a commitment to maintaining animal health through monitored nutrition and on-staff veterinarians, and reproduction by natural breeding rather than artificial insemination. Also, animals are kept outdoors on pastures rather than enclosed barns.
Energy consumption
Refers to the use of energy saving equipment in milk processing, and also to making transportation of milk to processing plants and retailers more energy efficient.
Water consumption
Implement recycling water programs through a water treatment facility and save water by using limited irrigation schedules to irrigate pastures and crops.
Air pollution
Manage the release of bovine methane by encouraging managed grazing and carbon soil sequestration. Also, decrease air pollution by making milk transportation from farm to plant and retailer more fuel efficient.
Community involvement
Company should be involved in charitable organizations, should implement volunteering days, and create and support local community programs.
Employee opportunities
The company should provide fair or above market wages, medical benefits, vacations, and retirement plans to employees. Employee advancement in company hierarchy is encouraged, as well as diversity in the workplace.
Local operation The company uses local resources and generates local growth. The local economy is stimulated by creating jobs locally.
Waste management
Waste management refers mainly to composting solid waste to be used as fertilizer and monitoring waste runoff to the local water table.
Sustainable agricultural practices
Commitment to maintaining good soil health for a sustainable future of the business and the environment. Soil health implies practices such as the use crop rotation; using compost as natural organic fertilizer, and never using chemicals in maintaining a fertile soil.

Figure 1. Best-worst question example with CSR development actions
Table 3. Labels included in survey and their descriptions
Certification Logo Description
Certified USDA Organic
Indicates that this product is produced using organic methods or made with organic ingredients. Certification is conducted by entities that have been approved by the US Department of Agriculture, using national standards that define organic production.
Validus Animal Welfare
The Dairy Animal Welfare Review Program verifies a farmer’s animal welfare practices Specific areas reviewed include: Animal handling practices, Body condition, Feed and water access and quality, Herd health, Facilities/housing, Animal hygiene, Special needs management, Parlor management, Animal behavior, Management and employee training
Colorado Proud
This label indicates that the product is produced locally in Colorado.
No rbST
This label indicates that the company does not use rbST on its cattle.
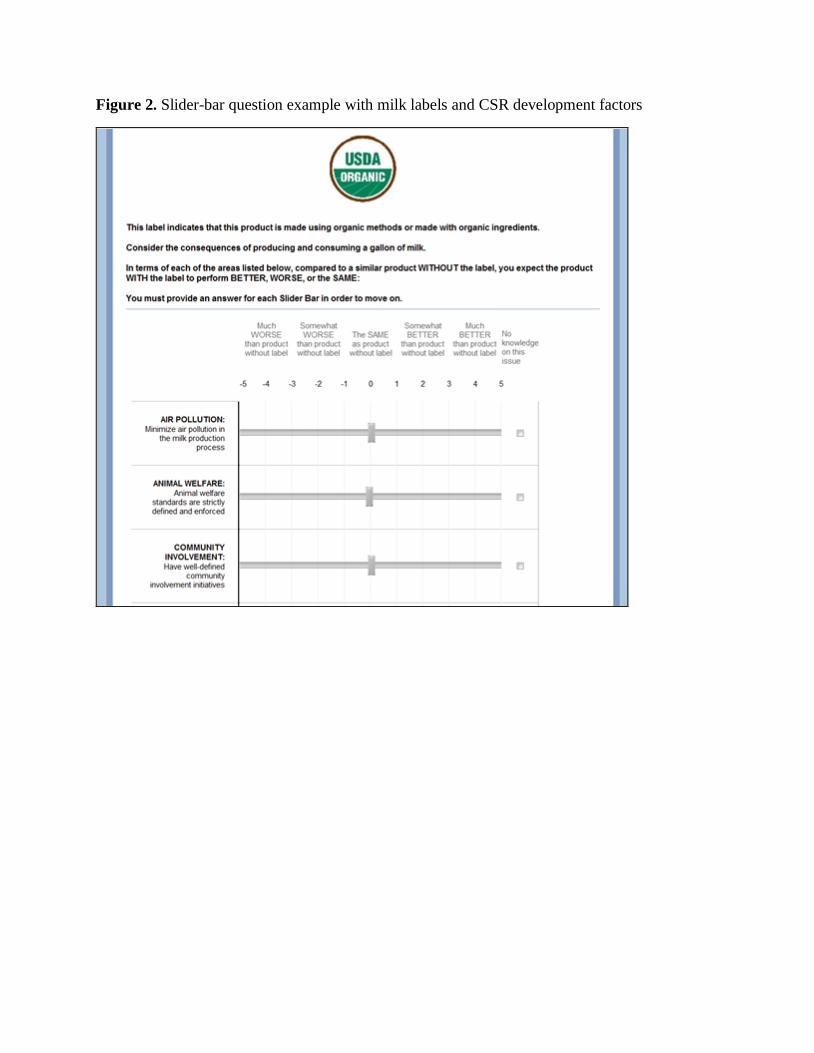
Figure 2. Slider-bar question example with milk labels and CSR development factors
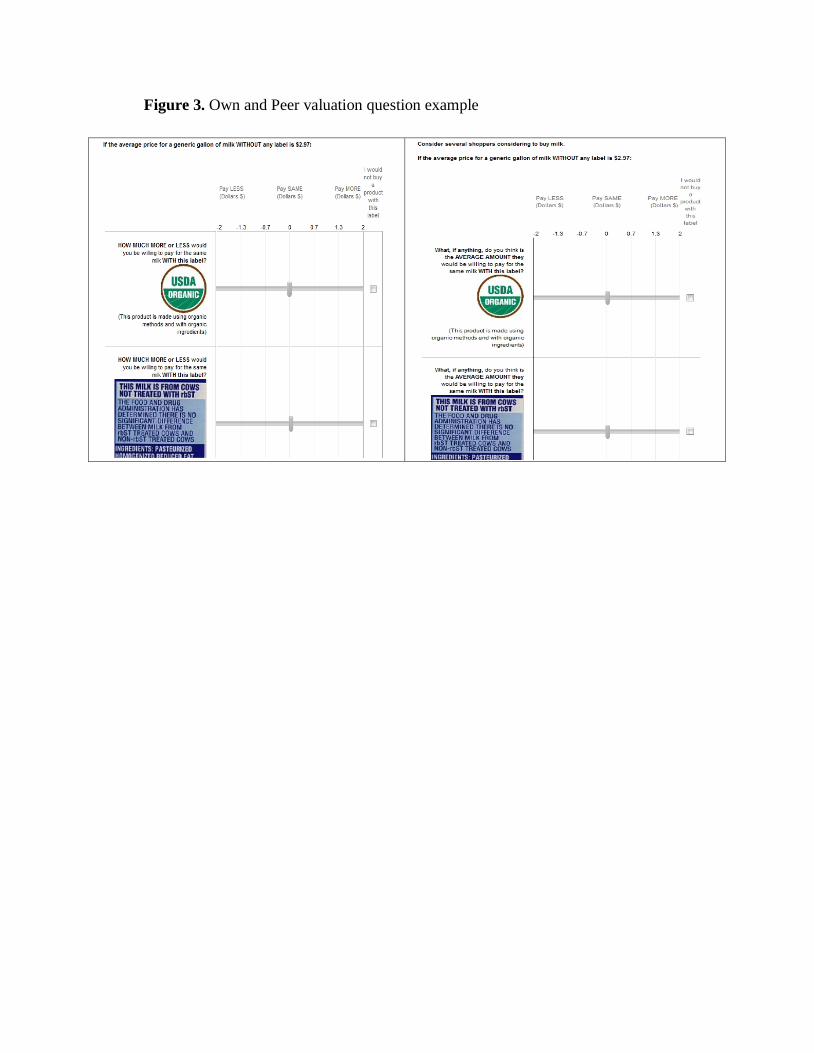
Figure 3. Own and Peer valuation question example
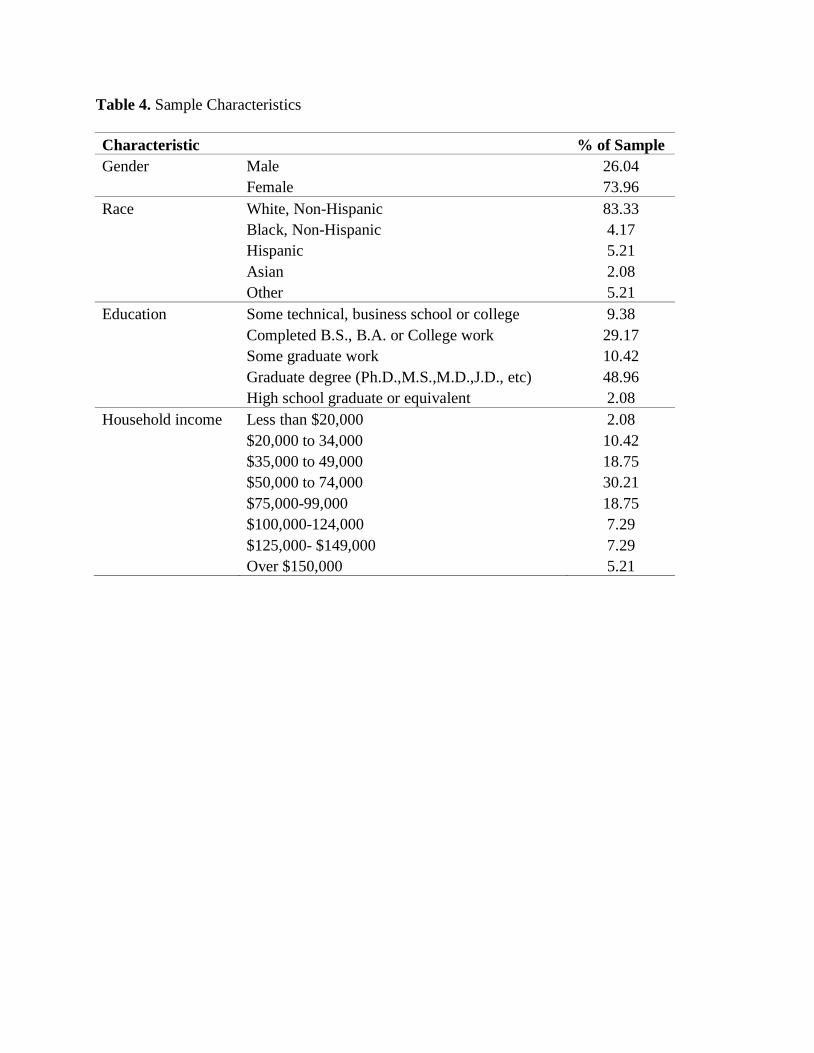
Table 4. Sample Characteristics
Characteristic % of Sample Gender Male 26.04 Female 73.96 Race White, Non-Hispanic 83.33 Black, Non-Hispanic 4.17 Hispanic 5.21 Asian 2.08 Other 5.21 Education Some technical, business school or college 9.38 Completed B.S., B.A. or College work 29.17 Some graduate work 10.42 Graduate degree (Ph.D.,M.S.,M.D.,J.D., etc) 48.96 High school graduate or equivalent 2.08 Household income Less than $20,000 2.08 $20,000 to 34,000 10.42 $35,000 to 49,000 18.75 $50,000 to 74,000 30.21 $75,000-99,000 18.75 $100,000-124,000 7.29 $125,000- $149,000 7.29 Over $150,000 5.21

Figure 4. Sample Demographics: Gender, Age, Race
< 29 years (16%)
30-39 years (34%)40-49
years (19%)
50-59 years (24%)
> 60 years (7%)
Age
Figure 5. Sample Household Characteristics

Figure 6. Sample socio-economic characteristics: Education and Income
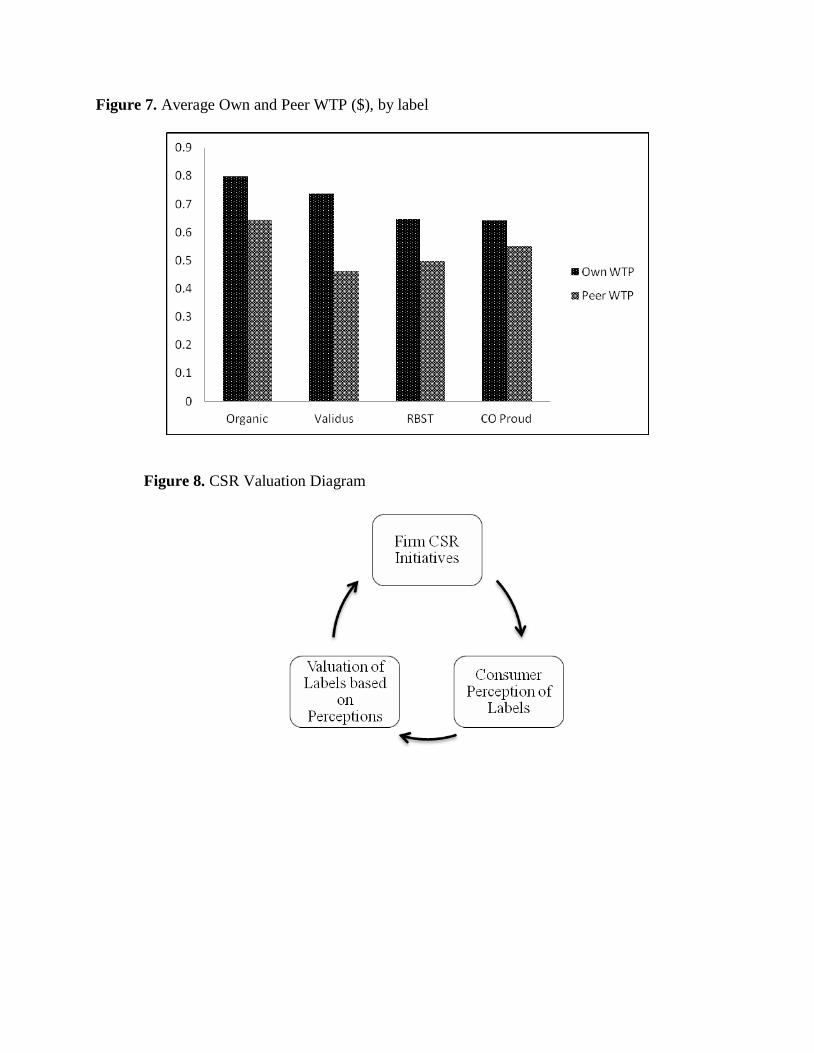
Figure 7. Average Own and Peer WTP ($), by label
Figure 8. CSR Valuation Diagram
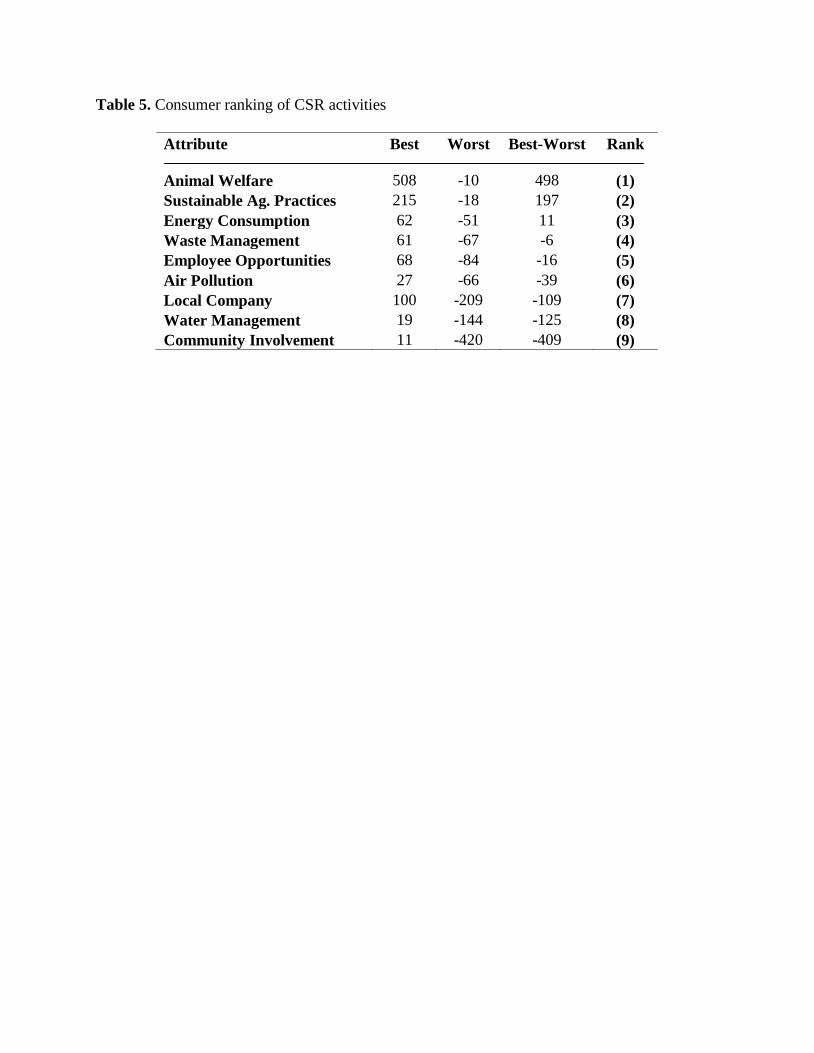
Table 5. Consumer ranking of CSR activities
Attribute Best Worst Best-Worst Rank Animal Welfare 508 -10 498 (1) Sustainable Ag. Practices 215 -18 197 (2) Energy Consumption 62 -51 11 (3) Waste Management 61 -67 -6 (4) Employee Opportunities 68 -84 -16 (5) Air Pollution 27 -66 -39 (6) Local Company 100 -209 -109 (7) Water Management 19 -144 -125 (8) Community Involvement 11 -420 -409 (9)
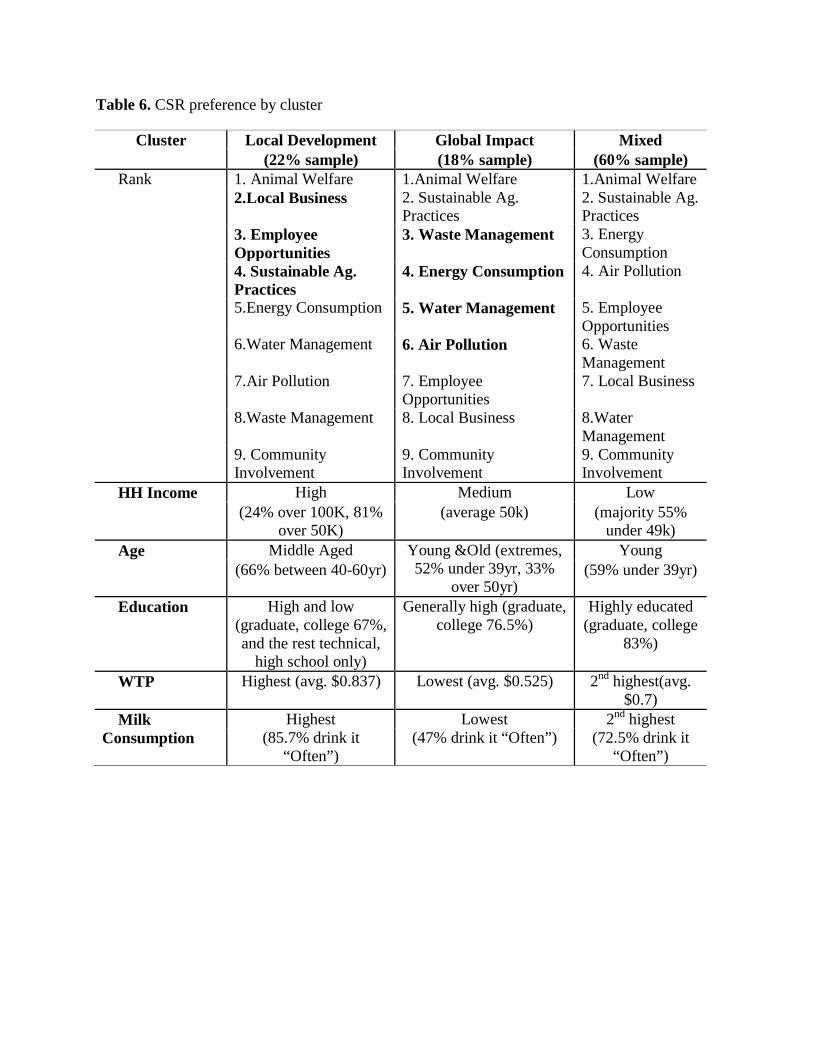
Table 6. CSR preference by cluster
Cluster Local Development Global Impact Mixed (22% sample) (18% sample) (60% sample)
Rank 1. Animal Welfare 1.Animal Welfare 1.Animal Welfare 2.Local Business 2. Sustainable Ag.
Practices 2. Sustainable Ag. Practices
3. Employee Opportunities
3. Waste Management 3. Energy Consumption
4. Sustainable Ag. Practices
4. Energy Consumption 4. Air Pollution
5.Energy Consumption 5. Water Management 5. Employee Opportunities
6.Water Management 6. Air Pollution 6. Waste Management
7.Air Pollution 7. Employee Opportunities
7. Local Business
8.Waste Management 8. Local Business 8.Water Management
9. Community Involvement
9. Community Involvement
9. Community Involvement
HH Income High Medium Low (24% over 100K, 81%
over 50K) (average 50k) (majority 55%
under 49k) Age Middle Aged Young &Old (extremes,
52% under 39yr, 33% over 50yr)
Young (66% between 40-60yr) (59% under 39yr)
Education High and low (graduate, college 67%, and the rest technical,
high school only)
Generally high (graduate, college 76.5%)
Highly educated (graduate, college
83%)
WTP Highest (avg. $0.837) Lowest (avg. $0.525) 2nd highest(avg. $0.7)
Milk Highest Lowest 2nd highest Consumption (85.7% drink it
“Often”) (47% drink it “Often”) (72.5% drink it
“Often”)
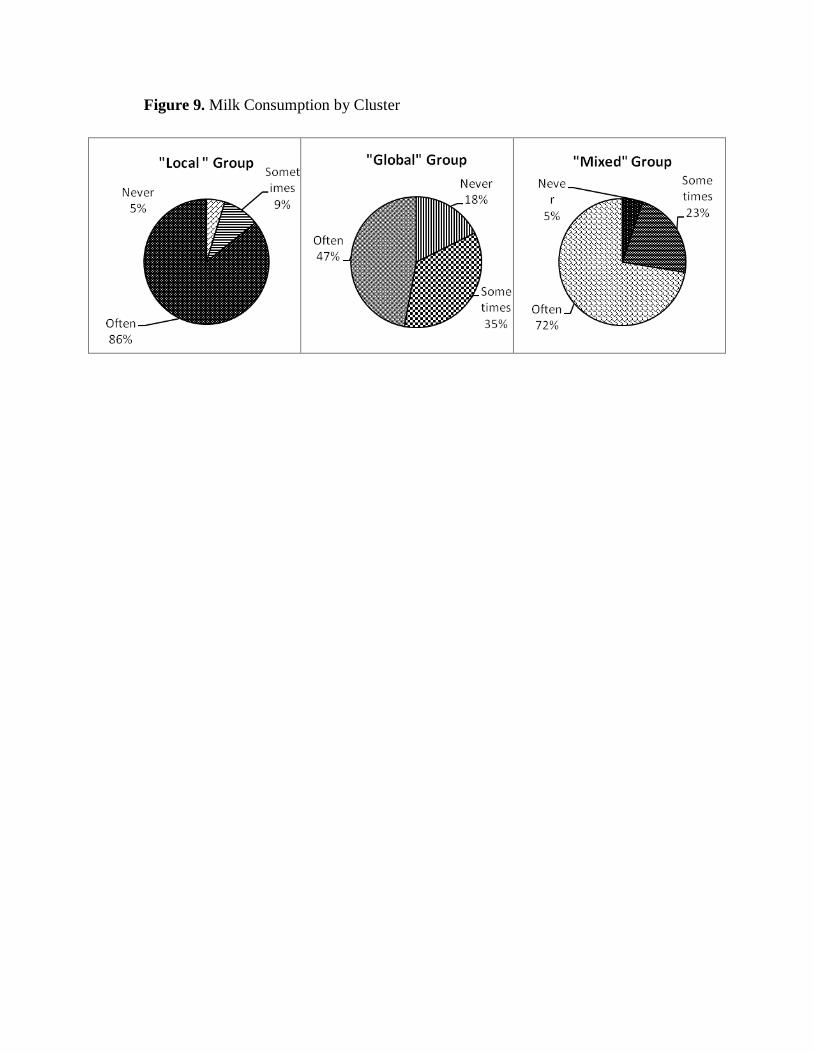
Figure 9. Milk Consumption by Cluster
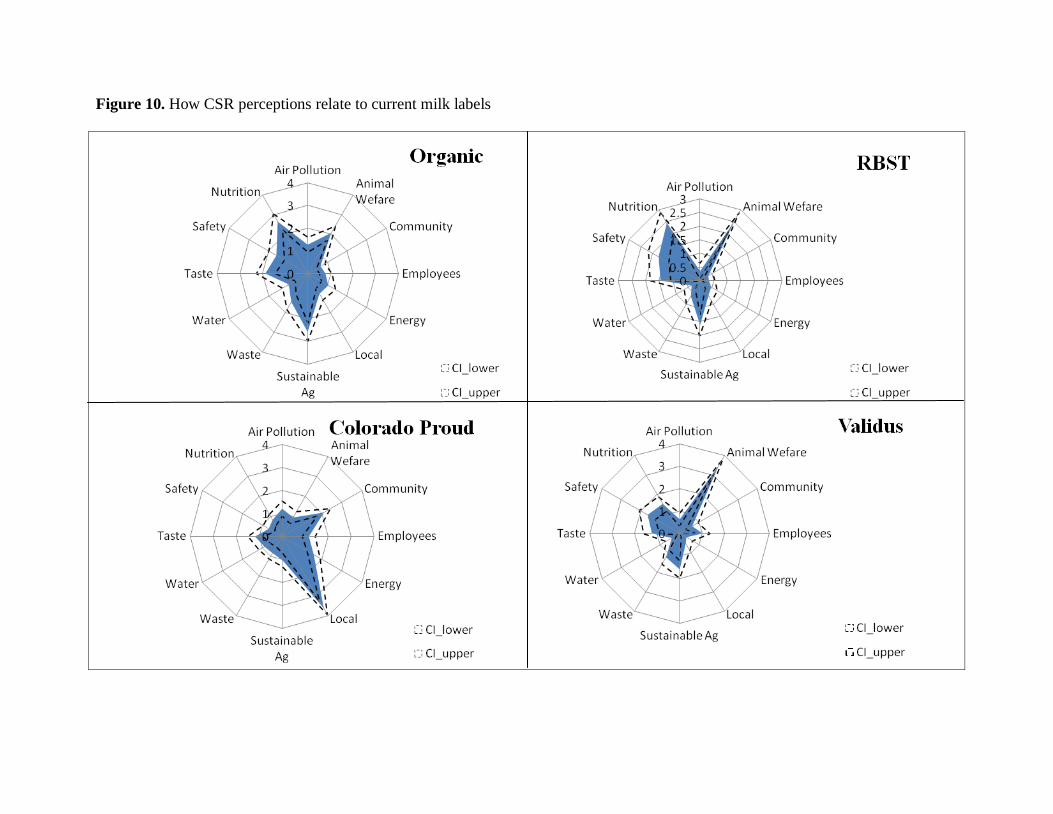
Figure 10. How CSR perceptions relate to current milk labels

Table 7. Pooled label valuation model
Peer WTP Estimate t-stat Air Pollution 0.026 0.98 Animal Welfare 0.068*** 3.32 Community Involvement 0.02 0.78 Employee Opportunities -0.025 -0.1 Energy Consumption -0.015 -0.57 Local Business 0.005 0.21 Sustainable Ag. Practices 0.009 0.44 Waste Management 0.037 1.42 Water Management -0.033 -1.13 Taste 0.018 0.79 Safety -0.013 -0.66 Nutrition -0.007 -0.30 Organic Label 0.444*** 6.22 Validus Label 0.201** 2.6 RBST Label 0.314*** 4.49 CO Proud Label 0.453*** 5.15 Obs 350 Adj. R2 0.546
***Significant at 1% level, **Significant at 5% level, *Significant at 10% level
Table 8. WTP Estimates for fluid milk labels and perceived CSR outcomes
Label Average Valuation ($)
Valuation Attributable to non-CSR outcomes ($)
Valuation Attributable to CSR
CO Proud 0.55 0.53 0.02 USDA Organic 0.64 0.44 0.20 RBST-free 0.49 0.32 0.17 Validus Animal Welfare
0.46 0.20 0.26
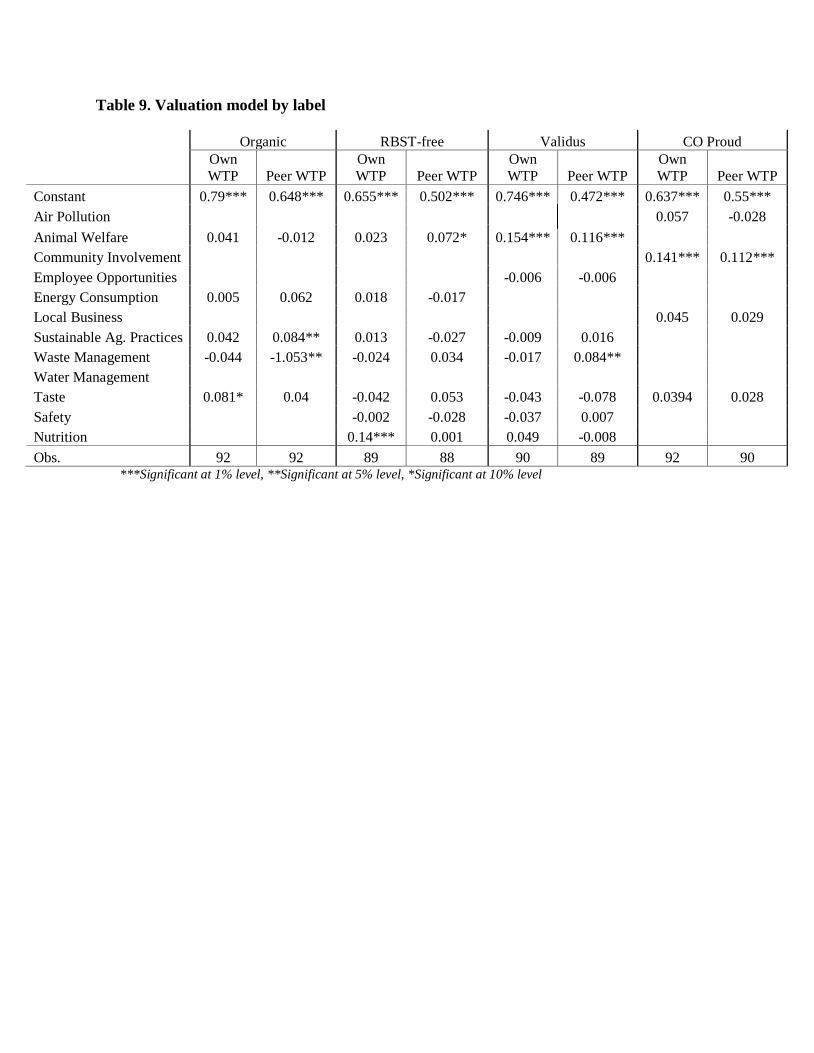
Table 9. Valuation model by label
Organic RBST-free Validus CO Proud
Own WTP Peer WTP
Own WTP Peer WTP
Own WTP Peer WTP
Own WTP Peer WTP
Constant 0.79*** 0.648*** 0.655*** 0.502*** 0.746*** 0.472*** 0.637*** 0.55*** Air Pollution
0.057 -0.028
Animal Welfare 0.041 -0.012 0.023 0.072* 0.154*** 0.116*** Community Involvement 0.141*** 0.112*** Employee Opportunities -0.006 -0.006 Energy Consumption 0.005 0.062 0.018 -0.017 Local Business 0.045 0.029 Sustainable Ag. Practices 0.042 0.084** 0.013 -0.027 -0.009 0.016 Waste Management -0.044 -1.053** -0.024 0.034 -0.017 0.084** Water Management
Taste 0.081* 0.04 -0.042 0.053 -0.043 -0.078 0.0394 0.028 Safety -0.002 -0.028 -0.037 0.007 Nutrition 0.14*** 0.001 0.049 -0.008 Obs. 92 92 89 88 90 89 92 90
***Significant at 1% level, **Significant at 5% level, *Significant at 10% level
Works Cited
De Pelsmacker, P. et al., 2005. Do Consumers Care about Ethics? Willingness to Pay for Fair‐Trade Coffee, Do Consumers Care about Ethics? Willingness to Pay for Fair‐Trade Coffee. Journal of Consumer Affairs, Journal of Consumer Affairs, 39, 39(2, 2), pp.363, 363–385, 385.
Auger, P., Devinney, T.M. and Louviere, J.J. 2004. Consumer’s social beliefs, an international
investigation using Best-Worst scaling methodology. Working paper, University of Melbourne, Melbourne Business School, Melbourne, Victoria, AU
Bagnoli, M. and S. Watts, 2003. Selling to socially responsible consumers: Competition and
the private provision of public goods, Journal of Economics and Management Strategy, 12: 419-445
Baron, David, 2001. Private politics, corporate social responsibility and integrated strategy, Journal of Economics and Management Strategy, 10: 7-45
Belkaoui, A., 1976. The Impact of the Disclosure of the Environmental Effects of Organizational Behavior on the Market. Financial Management, 5(4), pp.26–31.
Benabou, R. and Tirole, J., 2010. Individual and corporate social responsibility. Economica (77): 1–19 Bond, C., Thilmany, D., Bond, J. K. 2008. Understanding consumer interest in product and
process-based attributes for fresh produce. Agribusiness 24(2): 231–252, Spring Center for US Dairy, 2010. US Dairy Sustainability Commitment Program, December,
Report_12-2012 (http://www.usdairy.com/Sustainability/Measurement/Pages/Reporting.aspx)
Cohen, S. H., Markowitz, P. 2002. Renewing Market Segmentation: Some New Tools to
Correct Old Problems, ESOMAR (September)
De Pelsmacker, P. et al., 2005. Do Consumers Care about Ethics? Willingness to Pay for Fair‐Trade Coffee, Do Consumers Care about Ethics? Willingness to Pay for Fair‐Trade Coffee. Journal of Consumer Affairs, Journal of Consumer Affairs, 39, 39(2, 2), pp.363, 363–385, 385.
Du, S., Bhattacharya, C. B. and Sankar, S., 2010. Maximizing business returns to corporate social responsibility (CSR): the role of CSR communication. International Journal of Management Reviews 12: 8–19

Environmental Protection Agency. 2007. Ruminant Livestock, Frequent Questions, URL:
http://www.epa.gov/rlep/faq.html Finn A. Louviere, J. 2006. Determining the Appropriate Response to Evidence of Public
Concern: The Case of Food Safety. Journal of Public Policy 11(2): 12-25 Fisher, Robert J., 1993. Social Desirability Bias and the Validity of Indirect Questioning, Journal
of Consumer Research, Vol. 20 (2), Sep., pp. 303-315
Frank, R. E. and P. E. Green, 1968, "Numerical Taxonomy in Marketing Analysis: A Review Article," Journal of Marketing Research, 5 (February), 83-93 Friedman, M., 1970. The social responsibility of business is to increase its profits. New York Times Magazine 13: 122–126 Goodman, S.P., Lockshin, L., and Cohen, E. 2005. Best-worst Scaling: a Simple Method to
Determine Drinks and Wine Style Preferences. International Wine Marketing Symposium (2nd: 2005: Sonoma)
Green, P. E., R. E. Frank, and P. J. Robinson, 1967, "Cluster Analysis in Test Market Selection," Management Science, 13 (April), B387-B400 Greening, D.W. & Turban, D.B., 2000. Corporate Social Performance as a Competitive
Advantage in Attracting a Quality Workforce. Business & Society, 39(3), pp.254 -280
Harper, G, Makatouni, A., 2002. Consumer perception of organic food production and farm animal welfare. British Food Journal 104 (3/4/5):287-299
Hart, Oliver, 1757. Economist's Perspective on the Theory of the Firm, Columbia Law Review 89(7), Contractual Freedom in Corporate Law (Nov., 1989), pp. 1757-1774
Hartmann, Monika, Heinen, S., Melis, S. and Simons, J., 2011. Consumers’ Awareness of CSR in the German Pork Industry. Working Paper. Bonn: Department of Food and Resource Economics, University of Bonn Hartmann, Monika, 2011. Corporate social responsibility in the food sector. European Review of
Agricultural Economics, 38(3): 297-324
Kong, D., 2012. Does corporate social responsibility matter in the food industry? Evidence from a nature experiment in China. Food Policy, 37(3), pp.323–334.
Kitzmueller, M., 2010. Economics and corporate social responsibility. Working Paper. Italy:
European University Institute Loureiro, M.L. & Lotade, J., 2005. Do fair trade and eco-labels in coffee wake up the consumer
conscience? Ecological Economics, 53(1), pp.129–138.
Lusk, J., Norwood, F. B. 2011. Speciesism, altruism and the economics of animal welfare, European Review of Agricultural Economic, pp. 1-24
Maignan, I.,Hillebrand B., McAlister D., 2002. Managing Socially-Responsible Buying: How to Integrate Non-Economic Criteria into the Purchasing Process. European Management Journal 20(6), 641–648.
Maloni, M.J. & Brown, M.E., 2006. Corporate Social Responsibility in the Supply Chain: An
Application in the Food Industry. Journal of Business Ethics, 68, pp.35–52.
Martinez, 2002. The U.S. Food Marketing System, 2002. Competition, Coordination and
Technological Innovations into the 21st Century. Economic Research Service/USDA. AER-881
Martinez, S. and P. Kaufman. Twenty years of Competition Reshape the U.S. Food Marketing
System. Amber Waves. April 2008.
McWilliams, A., and Siegel, D., 2001. Corporate social responsibility: A theory of the
firm perspective, Academy of Management Review, 26(1): 117-127
Mohr, L.A., Webb, D.J., Harris, K., 2001. Do consumers expect companies to be socially responsible? The impact of corporate social responsibility on buying behavior. Journal of Consumer Affairs 35(1): 45-72
Moon, J. and Vogel, D. (2009). Corporate social responsibility, government, and civil society.
In: A. Crane, A. McWilliams, D. Matten, J. Moon and D. S. Siegel (eds), The Oxford Handbook of Corporate Social Responsibility. Oxford: Oxford University Press, 303–326
Öberseder, M., Schlegelmilch, B. B., Gruber, V. 2011. Why Don’t Consumers Care About
CSR? A Qualitative Study Exploring the Role of CSR in Consumption Decisions. Journal of Business Ethics 104:449-460
Panapanaan, V. M., Linnanen L., Karvonen, M.-M., Phan, V. T., 2003. Roadmapping Corporate Social Responsibility in Finnish Companies. Journal of Business Ethics 44(2/3): 133–148
Pirsch, J., Gupta, S., Grau, Landreth, S. 2012. An Exploratory Study Framework for
Understanding Programs corporte Social Responsibility as a Continuum : An Exploratory Study. Journal of Business 70(2): 125-140
Spar, D. L., Mure L. T. L., 2003. The Power of Activism: Assessing the Impact of NGOs on Global Business. California Management Review
U.S. Census Bureau: State and County QuickFacts. 2012. Data derived from Population
Estimates, American Community Survey, Census of Population and Housing, State and County Housing Unit Estimates, County Business Patterns, Nonemployer Statistics, Economic Census, Survey of Business Owners, Building Permits, Consolidated Federal Funds Report; Last Revised: 17-Jan-2012
Wishart D, k-Means Clustering with Outlier Detection, Mixed Variables and Missing Values, in
Exploratory Data Analysis in Empirical Research, Schwaiger, M, and Opitz, O (eds), Springer, 2001, 215-226


![[Shiseido’s Corporate Social Responsibility] · Shiseido's Corporate Social Responsibility Back Issues 2010 [Shiseido’s Corporate Social Responsibility] "Beautiful Society, Bright](https://static.fdocuments.net/doc/165x107/5f170ccfbe73e76f437bb14c/shiseidoas-corporate-social-responsibility-shiseidos-corporate-social-responsibility.jpg)