Corporate Social Responsibility and Financial Performance
16
Academy of Management is collaborating with JSTOR to digitize, preserve and extend access to The Academy of Management Journal. http://www.jstor.org Corporate Social Responsibility and Financial Performance Author(s): Philip L. Cochran and Robert A. Wood Source: The Academy of Management Journal, Vol. 27, No. 1 (Mar., 1984), pp. 42-56 Published by: Academy of Management Stable URL: http://www.jstor.org/stable/255956 Accessed: 14-09-2015 16:56 UTC REFERENCES Linked references are available on JSTOR for this article: http://www.jstor.org/stable/255956?seq=1&cid=pdf-reference#references_tab_contents You may need to log in to JSTOR to access the linked references. Your use of the JSTOR archive indicates your acceptance of the Terms & Conditions of Use, available at http://www.jstor.org/page/ info/about/policies/terms.jsp JSTOR is a not-for-profit service that helps scholars, researchers, and students discover, use, and build upon a wide range of content in a trusted digital archive. We use information technology and tools to increase productivity and facilitate new forms of scholarship. For more information about JSTOR, please contact [email protected]. This content downloaded from 121.52.153.182 on Mon, 14 Sep 2015 16:56:46 UTC All use subject to JSTOR Terms and Conditions
-
Upload
fahad-ashraf -
Category
Documents
-
view
2 -
download
0
description
Relationship between CSR & Finance
Transcript of Corporate Social Responsibility and Financial Performance

Academy of Management is collaborating with JSTOR to digitize, preserve and extend access to The Academy of ManagementJournal.
http://www.jstor.org
Corporate Social Responsibility and Financial Performance Author(s): Philip L. Cochran and Robert A. Wood Source: The Academy of Management Journal, Vol. 27, No. 1 (Mar., 1984), pp. 42-56Published by: Academy of ManagementStable URL: http://www.jstor.org/stable/255956Accessed: 14-09-2015 16:56 UTC
REFERENCESLinked references are available on JSTOR for this article:
http://www.jstor.org/stable/255956?seq=1&cid=pdf-reference#references_tab_contents
You may need to log in to JSTOR to access the linked references.
Your use of the JSTOR archive indicates your acceptance of the Terms & Conditions of Use, available at http://www.jstor.org/page/ info/about/policies/terms.jsp
JSTOR is a not-for-profit service that helps scholars, researchers, and students discover, use, and build upon a wide range of content in a trusted digital archive. We use information technology and tools to increase productivity and facilitate new forms of scholarship. For more information about JSTOR, please contact [email protected].
This content downloaded from 121.52.153.182 on Mon, 14 Sep 2015 16:56:46 UTCAll use subject to JSTOR Terms and Conditions

?Academy of Management Journal 1984, Vol. 27, No. 1, 42-56.
Corporate Social Responsibility and Financial Performance1 PHILIP L. COCHRAN ROBERT A. WOOD Pennsylvania State University
The relationship between corporate social responsibility and financial performance is reexamined using a new methodology, improved technique, and industry-specific control groups. Average age of corporate assets is found to be highly correlated with social responsibility ranking. After controlling for this factor, there still is some cor- relation between corporate social responsibility andfinan- cial performance.
The relationship between a firm's corporate social responsibility (CSR)- or, more recently, its corporate social responsiveness-and its financial per- formance has been the subject of a lively debate since the 1960s. Researchers have reached no real consensus on the relationship between these variables. In fact, a recent work reviewed seven earlier empirical studies and concluded that "economic performance is not directly linked, in either a positive or negative fashion, to social responsiveness" (Arlow & Gannon, 1982, p. 240).
Whether or not a relationship exists clearly is an important issue for cor- porate management. If certain actions (classified as socially responsible) tend to be negatively correlated with financial performance of firms, then managers might be advised to be cautious in this area. If, on the other hand, a positive relationship can be shown to exist, then management might be encouraged to pursue such activities with increased vigor or to investigate the underlying causes of this relationship. The focus of this paper is on the question of whether these two factors (CSR and financial performance) are related. Only once this question is answered can the question of causa- tion be addressed.
This paper extends prior empirical research in three areas. Certain fac- tors omitted in previous studies are explicitly controlled for by use of im- proved financial performance measures and additional variables. A statistical tool, logit analysis, more suited to the data is employed. Finally, the
'The authors would like to express their appreciation to Anthony Curley, Keith Ord, Robert Pitts, Steven Wartick, and three anonymous referees for their helpful comments and suggestions.
42
This content downloaded from 121.52.153.182 on Mon, 14 Sep 2015 16:56:46 UTCAll use subject to JSTOR Terms and Conditions

Cochran and Wood
sample is enhanced by utilizing a large industry-specific control group and using two test intervals.
Results of these improvements indicate the crucial role of firm assets in test outcomes. Consequently, asset turnover and asset age are added as ex- planatory variables. This expanded analysis reveals that the key correlate with CSR is asset age and that the omission of this variable in previous studies may have led to spurious positive correlations between CSR and financial performance. Nonetheless, with this variable included, there still is weak evidence of a positive correlation between CSR and financial performance.
Previous Research
Although the examination of previous research does, to a certain extent, parallel the work of Arlow and Gannon, the number of studies examined herein is considerably larger. In addition, this survey of earlier work pro- vides the rationale for the bulk of this paper, namely, a new and considerably more extensive empirical test of this research question.
Measurement of Corporate Social Responsibility
There are two generally accepted methods of measuring CSR. The first method is the reputation index. In this method knowledgeable observers rate firms on the basis of one or more dimensions of social performance. This method has some advantages. First, it tends to be internally consis- tent because one evaluator is applying the same (albeit usually subjective) criteria to each firm. Second, it makes no pretence of applying a rigorous objective measure to a dimension that may be innately subjective. Third, it may summarize the perceptions of a key constituency of various firms. This alone may be an important factor in determining the relationship be- tween CSR and financial performance.
There are, however, disadvantages as well. The most important (and most obvious) is that such rankings are highly subjective and thus may vary sig- nificantly from one observer to another. This raises the spectre of unreli- ability. A second problem is one of sample size. Most reputation indexes generated to date cover only a relatively small number of firms. Thus one must be cautious about generalizing from the results of these studies.
The first reputation index was a fairly narrow one, generated by the Coun- cil of Economic Priorities (CEP) in the late 1960s and early 1970s. In this study the CEP ranked the pollution control performance of 24 firms in the pulp and paper industry (Council of Economic Priorities, 1971). This measure of CSR has been used by a number of other studies, including Bragdon and Marlin (1972), Folger and Nutt (1975), and Spicer (1978).
A second reputation index was generated by Milton Moskowitz, who over a period of several years rated a number of firms as "outstanding," "honor- able mention," or "worst" (Moskowitz, 1972, 1975). The 1972 version of
1984 43
This content downloaded from 121.52.153.182 on Mon, 14 Sep 2015 16:56:46 UTCAll use subject to JSTOR Terms and Conditions

Academy of Management Journal
this index was used by Moskowitz and a composite of his 1972-1975 in- dexes was used by Sturdivant and Ginter (1977) in their studies of the rela- tionship between CSR and financial performance.
Another popular reputation index also can be traced back to Moskowitz. A survey was conducted by the National Association of Concerned Busi- ness Students ("How business school students rate corporations," 1972) in which 300 graduate students of business administration were questioned about their views on the social responsibility of some of the Fortune 500 firms. Indexes generated by this study were used subsequently by Vance (1975), Heinze (1976), and Alexander and Buchholz (1978).
The second method of measuring CSR is content analysis. Normally, in content analysis the extent of the reporting of CSR activities in various firm publications and especially in the annual report is measured. This can consist of simply noting whether or not a particular item (such as pollu- tion control) is discussed either qualitatively or numerically, or it can mean actually counting a number of items. A commonly used source for content analysis is a series of studies conducted by Beresford (1973, 1975, 1976).
Content analysis has two significant advantages. First, once the particu- lar variables have been chosen (a subjective process), the procedure is rea- sonably objective. Therefore the results are independent of the particular research. Second, because this technique is more mechanical, larger sam- ple sizes are possible.
However, content analysis also has some drawbacks. The choice of vari- ables to measure is subjective. Further, content analysis is only an indica- tion of what firms say they are doing, and this may be very different from what they actually are doing. At best, one certainly could postulate that firms that are aware of these issues are those that will discuss them as well as act on them. On the other hand, one could imagine that firms that are doing poorly on this front would feel an extra incentive to make themselves look good by touting their achievements in their annual reports.
The first study to use content analysis was Bowman and Haire (1975). In this study the authors examined only the food processing industry and developed their own index based on the number of lines of the annual report devoted to CSR. Subsequently, several other studies (Abbott & Monsen, 1979; Anderson & Frankle, 1980; Ingram, 1978; Preston, 1978) used con- tent analysis indexes based on Beresford's work.
Neither content analysis nor reputation indexes can be considered wholly adequate measures of CSR. The problem of measuring social responsibil- ity or responsiveness of firms needs considerably more attention in this lit- erature. Yet, at the moment there obviously are not better measures available.
Measurement of Financial Performance
Although one might have expected a certain diversity of measures of CSR, there is no real consensus on the proper measure of financial
44 March
This content downloaded from 121.52.153.182 on Mon, 14 Sep 2015 16:56:46 UTCAll use subject to JSTOR Terms and Conditions

Cochran and Wood
performance either. In fact, there is a wide range of such measures. How- ever, most measures of financial performance fall into two broad categories: investor returns and accounting returns. Both have enjoyed periods of pop- ularity, and both have evolved considerably over the course of the past decade.
Investor Returns. The basic idea underlying investor returns is that returns should be measured from the perspective of the shareholders. The first studies to employ investor returns as a measure of financial performance were those of Moskowitz (1972) and Vance (1975). In both of these studies changes in price per share was used as the investor returns index. As most subsequent studies have noted, this measure is clearly flawed. The change in price per share is only one element of investor returns. Dividend income is the other, and it must be included in any measure of investor returns.
Abbott and Monsen (1979) used the change in share price plus dividends as their measure of investor returns. However, this, too, is insufficient. Simple returns (change in price per share plus dividends) fail to capture another dimension of vital importance to investors-namely, risk.
In accepted finance theory, the risk of holding assets is measured by the covariance of the expected return on the asset with that of the overall market. This measure, which is commonly referred to as "beta," typically is ob- tained for a stock by regressing its realized returns on those of a broad based market index. The regression slope coefficient provides the beta esti- mate. An average beta is 1. A stock with a beta above 1 is considered an aggressive stock because it will tend to move faster, either up or down, than the market. Correspondingly, a stock with a beta below 1 is considered a defensive stock (Curley & Bear, 1979).
It was precisely this failure to adjust for risk that led to the (apparently) contradictory results of Moskowitz (1972) and of Vance (1975). Moskowitz's study indicated that firms with high CSR ratings outperformed the market. Vance, two years later, concluded just the opposite. An examination of Moskowitz's high CSR firms over the 1970-1979 period indicates that the portfolio of these firms had a beta of 1.56. The period that Moskowitz examined, the first half of 1972, was a bull market (i.e., rising), and the period that Vance looked at, 1972 through 1974, was a bear market (i.e., falling). Therefore, the apparent contradiction between their results can be explained by the riskiness of the returns of the firms that they had clas- sified as socially responsible and not by the variable they believed they were examining.
Two studies did use risk adjusted measures of investor returns. These were Alexander and Buchholz (1978) and Anderson and Frankle (1980). However, there is a problem with the use of even a "clean" measure of investor returns for this type of study. This problem is summarized by one of the tenets of modern finance theory, the efficient markets hypothesis. Simply stated, this tenet posits that as information that might affect future cash flows of a firm becomes available, it immediately will be reflected in its current share price. The implication of this is that even if CSR does lead to improved financial performance, as soon as the market becomes aware
1984 45
This content downloaded from 121.52.153.182 on Mon, 14 Sep 2015 16:56:46 UTCAll use subject to JSTOR Terms and Conditions

Academy of Management Journal
of any change in a firm's CSR rating it will immediately alter price per share to reflect that information. As Alexander and Buchholz (1978) noted, after this reaction only new information regarding a firm's social respon- sibility will have any affect on the firm's financial performance. Thus, if the perception of a firm's social responsibility changed in 1975 and a naive researcher examined only the period 1977-1979, then he or she probably would conclude that CSR and financial performance are unrelated. In order to employ investor returns measures of financial performance properly, the researcher must conduct an "event study." Failure to do so could lead the researcher incorrectly to the conclusion that there is no relationship be- tween CSR and financial performance, even if one actually exists.
One particularly innovative methodology that avoids many of the earlier problems with investor returns is employed by Ingram (1978). Ingram tests for a correlation between social responsibility disclosures (used by others as a proxy for CSR) and financial performance while controlling for both risk and industry effects. The procedure may be viewed as a reverse cluster analysis, in which the sample is iteratively split into subgroups, with the grouping criterion being maximization of the difference of a functional rela- tionship between each of the two subgroups at each iteration. The func- tional relationship that Ingram uses is excess market return for each firm as the dependent variable; he uses fiscal year, excess accounting earnings, and industry as explanatory variables.
Ingram's procedure divides his sample of 116 firms into 10 subgroups wherein each subgroup has two sets of firms-one having higher excess market returns than the other. In seven of these subgroupings, firms in the higher excess market return category have better CSR ratings than do those in the lower excess market return category. The reverse is true for the remaining three subgroups.
Although this technique avoids many of the problems encountered by earlier studies, one must be cautious in interpreting Ingram's results as sup- port for a correlation between CSR and financial performance. If, in fact, Ingram's null hypothesis, that is, that there is no relationship between social responsibility disclosures and financial performance, were true, then 7 or more of the 10 groups would have disclosure ratings in the higher finan- cial performance categories with a frequency of 11.32 percent. This clear- ly is not a strong rejection of the null hypothesis.
Accounting Returns. Accounting returns are the other primary method of measuring financial performance. The basic idea behind using account- ing returns as a measure of financial performance is to focus on how firm earnings respond to different managerial policies. The most common mea- sures of accounting returns used in studies of this question are simply earn- ings per share (EPS) or price/earnings (P/E) ratios. Bragdon and Marlin (1972), Bowman and Haire (1975), Folger and Nutt (1975), Heinze (1976), Preston (1978), and Spicer (1978) all used EPS, P/E ratios, or some algebraic variation of them as at least one of the measures of financial performance in their studies.
46 March
This content downloaded from 121.52.153.182 on Mon, 14 Sep 2015 16:56:46 UTCAll use subject to JSTOR Terms and Conditions
Cochran and Wood
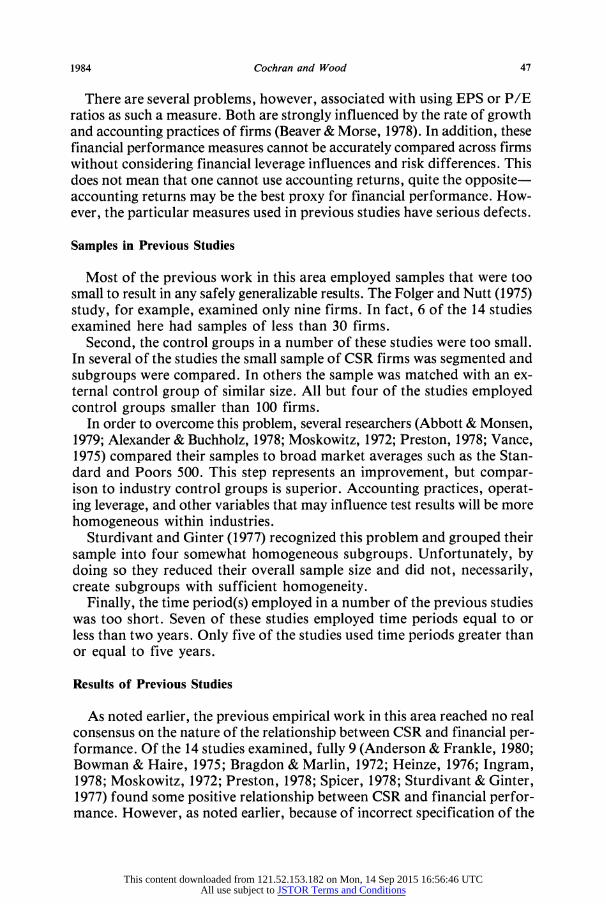
There are several problems, however, associated with using EPS or P/E ratios as such a measure. Both are strongly influenced by the rate of growth and accounting practices of firms (Beaver & Morse, 1978). In addition, these financial performance measures cannot be accurately compared across firms without considering financial leverage influences and risk differences. This does not mean that one cannot use accounting returns, quite the opposite- accounting returns may be the best proxy for financial performance. How- ever, the particular measures used in previous studies have serious defects.
Samples in Previous Studies
Most of the previous work in this area employed samples that were too small to result in any safely generalizable results. The Folger and Nutt (1975) study, for example, examined only nine firms. In fact, 6 of the 14 studies examined here had samples of less than 30 firms.
Second, the control groups in a number of these studies were too small. In several of the studies the small sample of CSR firms was segmented and subgroups were compared. In others the sample was matched with an ex- ternal control group of similar size. All but four of the studies employed control groups smaller than 100 firms.
In order to overcome this problem, several researchers (Abbott & Monsen, 1979; Alexander & Buchholz, 1978; Moskowitz, 1972; Preston, 1978; Vance, 1975) compared their samples to broad market averages such as the Stan- dard and Poors 500. This step represents an improvement, but compar- ison to industry control groups is superior. Accounting practices, operat- ing leverage, and other variables that may influence test results will be more homogeneous within industries.
Sturdivant and Ginter (1977) recognized this problem and grouped their sample into four somewhat homogeneous subgroups. Unfortunately, by doing so they reduced their overall sample size and did not, necessarily, create subgroups with sufficient homogeneity.
Finally, the time period(s) employed in a number of the previous studies was too short. Seven of these studies employed time periods equal to or less than two years. Only five of the studies used time periods greater than or equal to five years.
Results of Previous Studies
As noted earlier, the previous empirical work in this area reached no real consensus on the nature of the relationship between CSR and financial per- formance. Of the 14 studies examined, fully 9 (Anderson & Frankle, 1980; Bowman & Haire, 1975; Bragdon & Marlin, 1972; Heinze, 1976; Ingram, 1978; Moskowitz, 1972; Preston, 1978; Spicer, 1978; Sturdivant & Ginter, 1977) found some positive relationship between CSR and financial perfor- mance. However, as noted earlier, because of incorrect specification of the
1984 47
This content downloaded from 121.52.153.182 on Mon, 14 Sep 2015 16:56:46 UTCAll use subject to JSTOR Terms and Conditions

Academy of Management Journal
financial performance proxy, small sample size, and questionable meth- odology, these results must be viewed with suspicion.
Three studies (Abbott & Monsen, 1979; Alexander & Buchholz, 1978; Folger & Nutt, 1975) found no real link between these variables. Alexander and Buchholz, as well as Abbott and Monsen, used forms of investor returns as proxies for financial performance. Abbott and Monsen, however, failed to account properly for risk. Alexander and Buchholz did properly account for risk, but they did not employ an event study and thus could have failed to discover a relationship even if one did exist.
One study (Vance, 1975) found a negative relationship between these vari- ables. However, as discussed earlier, his proxy for investor returns (only change in share price) clearly was insufficient.
Method
Measures of Social Responsibility
As noted earlier, neither of the two major categories of CSR measures (reputation indexes and content analyses) is wholly adequate. However, because it has been used extensively in the literature on this subject, a specific reputation index, the combined Moskowitz list (as used by Sturdivant and Ginter), is employed by this study (see Table 1).
In order to avoid some of the problems of inadequate samples encoun- tered in previous studies, each firm on this list is independently compared to its industry group as defined by the four-digit Standard and Poor In- dustry Codes.
The 61 firms (6 firms were eliminated because they no longer existed in their original form) are contained in 42 such groups. Of these groups, 13 were eliminated either because there were insufficient data on the Compu- stat tapes for calculating the three financial performance measures over each of two five year periods (1970-1974, 1975-1979) or because there was less than a total of 10 firms in the industry (thus making industry averages suspect).
Therefore, in the first time period (1970-1974) the sample contained 39 firms in 29 industries, which were compared to 386 firms in their industry control groups. In the second period (1975-1979) there were 36 firms in 28 industries and a total of 366 firms in the control groups.
Two time periods were studied to increase the sample size. Averaging accounting data across five years will control for unusual accounting en- tries in any one year that might distort test results.
Measures of Financial Performance
This study followed the precedent of most of the previous studies of this question and used accounting data to measure financial performance. The use of accounting data raises the possibility of distortions from inflation
48 March
This content downloaded from 121.52.153.182 on Mon, 14 Sep 2015 16:56:46 UTCAll use subject to JSTOR Terms and Conditions

Table 1 Firms in Sample
CSR SIC #a Firm # Industry
2 Amax, Inc. 3 American Brands, Inc.b 3 American Can Co. 3 American Home Products Corp. 2 American Telephone & Telegraph 2 Atlantic Richfield Co. 3 Bethlehem Steel Corp. 2 Campbell Soup Co.b 3 Colgate-Palmolive Co. 2 Dayton-Hudson Corp. 1 Dow Chemical 3 DuPont (E. I.) de Nemours 2 Eastern Gas & Fuel Assoc. 3 Farah Mfg. Co. 2 Giant Food, Inc. 3 Goodyear Tire & Rubber Co. 2 International Business Machines Corp. I Jewel Cos., Inc. I Johnson & Johnson 3 K Mart Corp. 2 Koppers Co. 3 Kraft, Inc. 2 Masco Corp. 1 McGraw-Hill, Inc. 2 Mobil Corp. 3 Nabisco, Inc. I Owens-Illinois, Inc. 2 Phillips-Van Heusen 2 Polaroid Corp. 1 Quaker Oats Co. 2 RCA Corp.b 3 Standard Oil Co. (California) I Standard Oil Co. (Indiana) I Syntex Corp. 3 Texaco, Inc. 3 U.S. Steel Corp. 1 Weyerhaeuser Co. I Whirlpool Corp. 1 Xerox Corp.
1000 2111 3410 2830 4811 2911 3310 2030 2841 5311 2800 2800 1211 2300 5411 3000 3570 5411 3841 5331 2800 2020 3430 2731 2911 2000 3221 2300 3861 2000 3651 2911 2911 2830 2911 3310 2400 3630 3570
Metal mining Cigarettes Metal cans & shipping containers Drugs Telephone communication Petroleum refining Blast furnaces & steel works Canned-preserved fruits-vegetables Soap & other detergents Retail-department stores Chemicals & allied products Chemicals & allied products Bituminous coal & lignite mining Apparel & other finished products Retail-grocery stores Rubber & miscellaneous plastics products Office computing & accounting machines Retail-grocery stores Surgical & medical instruments & appliances Retail-variety stores Chemicals & allied products Dairy products Heating equipment & plumbing fixtures Books: publishing & printing Petroleum refining Food & kindred products Glass containers Apparel & other finished products Photographic equipment & supplies Food & kindred products Radio-TV receiving sets Petroleum refining Petroleum refining Drugs Petroleum refining Blast furnaces & steel works Lumber & wood products Household appliances Office computing & accounting machines
aCSR #s: 1. best; 2. honorable mention; 3. worst. bThese three firms were used in the first period only; all others were used in both periods.
differences across firms as well as different applications of accounting prin- ciples. These distortions were controlled for insofar as possible.
Three accounting returns measures were employed initially: (1) the ratio of operating earnings to assets, (2) the ratio of operating earnings to sales, and (3) excess market valuation. Each has certain strengths and weaknesses.
The ratio of operating earnings (as measured by operating earnings be- fore depreciation, Compustat data item 13, less depreciation and amorti- zation, Compustat data item 14) to assets measures the relative efficiency of asset utilization. A major strength of this ratio is that it is free from the effects of bias that can result from differences in capital structure be- tween firms. However, it can be distorted by the effect of inflation on the book value of the assets. For example, two firms may have identical physical
1984 Cochran and Wood 49
This content downloaded from 121.52.153.182 on Mon, 14 Sep 2015 16:56:46 UTCAll use subject to JSTOR Terms and Conditions

Academy of Management Journal
assets that they purchased at different times. If so, the book value of these assets, in all likelihood, will be different, reflecting the effect of inflation on nominal asset prices.
Further sources of distortion are depreciation, which is stated as a his- torical rather than a current cost, and the impact of inflation on book in- ventory values. Comparing sample firms against others in their industry will partially control for these distortions.
The ratio of operating earnings to sales, though free from leverage dif- ferences, also is subject to inflation distortion of depreciation. However, it too has a serious weakness-it fails to capture the relative effectiveness of the use of assets by competitors.
The third measure of financial performance employed in this study is excess value (EV). This is a relatively new measure in the finance literature, used by Thomadakis (1977) and Errunza and Senbet (1981). Excess value is defined as the difference between total firm market value (market value of equity and book value of debt) and the book value of assets, normal- ized by sales or, in the absence of wealth transfers of the agency tradition:
Market Value of Equity and Book Value of Debt - Total Assets Sales
This measure captures the value premiums or discounts accorded by the market to various companies. Thus if CSR is correlated with superior or inferior future prospects, then it will be correlated with EV. However, to the extent that the inflation distortion of asset values and income (and thereby retained earnings) vary across firms, a potential for bias exists. An advantage of this measure is that it reflects the market's evaluation of each firm.
Empirical Results
Initial Analysis. The initial analysis phase of this study basically repli- cates earlier work in this area by evaluating the relationship between CSR and financial performance through analysis of covariance. The three finan- cial performance measures for each firm are (separately) regressed upon industry dummy variables and dummy variables for the Moskowitz CSR categories with the constant term omitted. Specifically, the three regres- sion models tested for each interval were:
FPi =bjCSRj +bkINDk + , i= 1, 2, 3
where FPi are the averaged financial performance measures described above for each firm, CSRj are 0, 1 dummy variables reflecting the Mos- kowitz categories, INDk are 0, 1 dummy variables reflecting industry. Recall that 29 industries were included in the first test interval and 28 in
50 March
This content downloaded from 121.52.153.182 on Mon, 14 Sep 2015 16:56:46 UTCAll use subject to JSTOR Terms and Conditions

Cochran and Wood
the second. This regression can be considered an analysis of covariance that tests for CSR effects while controlling for industry effects.
The purpose of this analysis is to examine if CSR is significantly corre- lated with either superior or inferior financial performance within industry groups. The results of these regressions are shown in Table 2.
Table 2 Regression Results
t Statistics for CSR Dummy Variables__ Coeficient of
Dependent Variable/ Honorable Multiple Determination Interval Best Mention Worst (Adjusted for d.f.)
Financial performance measures Operating earnings/sales
1970-1974 1.44* .91 .09 .47 1975-1979 2.19** 1.34* -1.34 .59
Operating earnings/assets 1970-1974 .35 .57 -.21 .29 1975-1979 .42 .58 -.89 .15
Excess value 1970-1974 4.03*** 1.92* -.04 .50 1975-1979 3.19** 1.05 1.13 .38
Supplemental measures Asset age
1970-1974 1.07 .24 -2.07** .29 1975-1979 1.22 .59 -2.24** .34
Asset turnover 1970-1974 -1.24 -.68 .08 .76 1975-1979 -1.78* -1.04 -.02 .69
"*p<. 1 **p< .05
***p<.01
With operating earnings/sales as the financial performance measure, firms with "best" ratings outperform "honorable mention" firms, which, in turn, outperform "worst" firms. This pattern is repeated for the excess value measure, with a slight reversal between "worst" and "honorable mention" categories in the 1975-1979 interval.
However, the pattern differs for the operating earnings/assets measure. All statistical significance is lost, and "honorable mention" firms appear slightly superior to "best" firms. This result, also found by Bowman and Haire (1975), raises interesting questions concerning the nature of the assets, or their use, by these firms. Why might this puzzling result occur? Pos- sible explanations are differences in the effectiveness of the use of assets or differences in asset age between the CSR groups.
Further Test Procedures. In order to explore further these influences, two additional variables are introduced. Asset turnover, or the ratio of sales to assets, is used to measure the effectiveness of the use of assets by firms. This ratio is equal to the operating earnings to assets ratio divided by the operating earnings to sales ratio. In addition, the ratio of net fixed assets
1984 51
This content downloaded from 121.52.153.182 on Mon, 14 Sep 2015 16:56:46 UTCAll use subject to JSTOR Terms and Conditions

Academy of Management Journal
to gross fixed assets is used to measure asset age. The newer a firm's assets, the closer this ratio will be to unity. As a firm's assets age, this ratio will approach zero.
When these new variables are regressed on the industry and CSR dum- mies, it is obvious that the above suspicions are confirmed (Table 2). Asset age and asset turnover are related with Moskowitz's CSR categories. In particular, asset age is strongly and significantly negatively correlated with the "worst" CSR firms. In addition, asset turnover is weakly correlated to Moskowitz's ratings.
There are two possible explanations for these results. First, firms that are more socially responsible may utilize their assets in a less efficient man- ner. This explanation, however, clearly is not consistent with the evidence regarding return on sales. A second explanation is that inflation has seriously distorted reported asset values. The positive correlation of asset age and CSR rankings support this explanation. Newer firms have higher CSR ratings and higher reported asset values relative to their older competitors.
At this stage, four of the five variables employed appear to be significantly related to CSR. The relative strength of each is not yet clear. Note that EV has the highest t statistic and asset turnover has the highest coefficient of multiple determination. Also, there is evidence of interactions between the variables, so proxying may be occurring within each regression. There- fore, the next step is to test simultaneously the association between CSR and the various measures of financial performance.
Logit Analysis. Another statistical technique, logit analysis, provides an appropriate test procedure by which the underlying assumptions of the model are met by the data. The apparent problem of multicollinearity is a factor in considering which explanatory variables to include in the logit analysis. Correlations between possible explanatory variables are shown in Table 3 for both test intervals. Operating earnings/asset and operating earnings/sales have the highest correlations in both time periods. Because the latter vari- able has a higher correlation with CSR, operating earnings/assets is ex- cluded in the logit analysis. The remaining correlations indicate a possible
Table 3 Financial Variable Correlation
1970-1974, 1975-1979a
Operating Operating Earnings/ Earnings/ Asset Asset Excess
Assets Sales Age Turnover Value
Operating earn- ings/assets 1.000 (1.000) .587 (.823) .055 (.136) .115 (.249) .570 (.561)
Operating earn- ings/sales 1.000 (1.000) .241 (.102) -.469 (-.226) .567 (.656)
Asset age 1.000 (1.000) -.036 (-.233) .207 (.062) Asset turnover 1.000 (1.000) -.178 (.005) Excess value 1.000 (1.000)
al975-1979 data in parentheses.
52 March
This content downloaded from 121.52.153.182 on Mon, 14 Sep 2015 16:56:46 UTCAll use subject to JSTOR Terms and Conditions

1984 Cochran and Wood 53
multicollinearity problem between EV and operating earnings/sales. There- fore the test was repeated with the inclusion of each and both of these variables.
Logit analysis provides a chi-square test for the significance of each ex- planatory variable in predicting the CSR category in which an observation (firm) will fall. The logit model estimated is:
CSR = a0 + a1OES + a2AGE + a3TURN + a4EV + E,
where the accounting variables are averaged in each test interval. For this model, industry influences are controlled by subtracting industry averages from the firm variables.
The chi-square statistic is reported for each pairwise combination of CSR categories. The results shown in Table 4 indicate that asset age is statistically
Table 4 Logit Results
Effect
Intercept
Operating earnings/sales
Asset age
Asset turnover
Excess value
Effect
Intercept
Operating earnings/sales
Asset age
Asset turnover
Excess value
*p< .05
Pairwise CSR Comparisons
Best/worst Honorable mention/worst Best/honorable mention
Best/worst Honorable mention/worst Best/honorable mention
Best/worst Honorable mention/worst Best/honorable mention
Best/worst Honorable mention/worst Best/honorable mention
Best/worst Honorable mention/worst Best/honorable mention
1970-1974
Coefficient Estimate
-.408 .237 .645
-6.219 -2.121 -4.098 19.616 15.346 4.271 -.957 -.533 -.425 1.611 .974 .637
1975-1979
Coefficient Estimate
.416
.994
.578 38.745 48.046 -9.301 45.035 41.604
3.431 -2.242 -3.768 -1.374 -1.606 -.868 2.162
Chi-Square Statistic
.53
.25 1.61 .08 .01 .08
5.05* 4.08*
.38
.36
.15
.10 1.80 .70 .92
Chi-Square Statistic
.29 2.00 1.02 2.93 4.46*
.33 5.63* 5.02*
.22
.94 2.40
.71
.50
.16 1.32
This content downloaded from 121.52.153.182 on Mon, 14 Sep 2015 16:56:46 UTCAll use subject to JSTOR Terms and Conditions

Academy of Management Journal
significant in the 1975-1979 time interval at the .018 confidence level for the best/worst distinction, at the .025 level for the honorable mention/worst distinction, and at the .636 level for the best/honorable mention distinc- tion. Asset age is the only variable that is significant in predicting whether or not an observation (firm) will be best versus worst or honorable men- tion versus worst in both time periods. No variables significantly classify firms between the best and honorable mention categories.
Operating earnings/sales is significant at the .035 level in distinguishing between honorable mention/worst and significant at the .087 level in dis- tinguishing between best and worst in the second five-year period. It is in- significant in both respects for the 1970-1974 interval.
In order to examine the possibility of bias in coefficient significance tests from multicollinearity, the analysis was modified for both intervals by al- ternatively dropping the EV and operating earnings variables. In every case, the significance of the asset age variable increased, and in most cases the significance of the remaining financial performance variables increased. The EV best/worst pair became marginally significant in the first interval. Operating earnings best/worst became significant and honorable men- tion/worst dropped to marginal significance in the second interval. Con- sequently, multicollinearity does not appear to alter the test outcome significantly.
With all variables included, asset age is significant, and operating earn- ings/sales and EV are alternatively marginally significant. When asset age is dropped, either EV or operating earnings/sales become significant, sug- gesting that these variables may have proxied for asset age in previous tests. The evidence strongly suggests that the financial variable most significant- ly associated with CSR is asset age-specifically, firms with older assets have lower CSR ratings. The association is strongest with the best/worst comparison. This is understandable. The CSR measurement error would be minimized for this comparison. The association of CSR and financial performance, however, still is marginally significant.
Conclusions and Implications
This paper extends the study of financial performance and corporate social responsibility by using an enhanced sample, industry-specific control groups, and statistical tools new to this area of research. The major conclusion is that within industry groups the financial variable most strongly correlated with CSR is asset age and that omission of this variable results in a spurious correlation of CSR and financial performance. Specifically, firms with older assets have lower CSR ratings.
The source of the correlation between asset age and CSR is of interest. One possible explanation is that firms with older assets constructed plants in a period when regulatory constraints were less severe than they are today. For example, if a firm built a plant prior to the mid-sixties there is an ex- cellent chance that its facility pollutes more than one built in the recent past.
54 March
This content downloaded from 121.52.153.182 on Mon, 14 Sep 2015 16:56:46 UTCAll use subject to JSTOR Terms and Conditions
Cochran and Wood
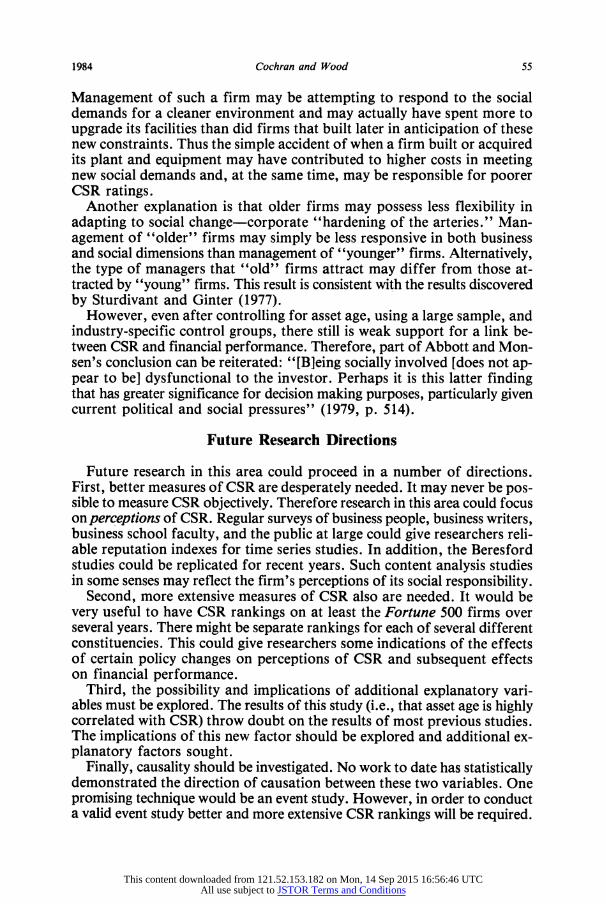
Management of such a firm may be attempting to respond to the social demands for a cleaner environment and may actually have spent more to upgrade its facilities than did firms that built later in anticipation of these new constraints. Thus the simple accident of when a firm built or acquired its plant and equipment may have contributed to higher costs in meeting new social demands and, at the same time, may be responsible for poorer CSR ratings.
Another explanation is that older firms may possess less flexibility in adapting to social change-corporate "hardening of the arteries." Man- agement of "older" firms may simply be less responsive in both business and social dimensions than management of "younger" firms. Alternatively, the type of managers that "old" firms attract may differ from those at- tracted by "young" firms. This result is consistent with the results discovered by Sturdivant and Ginter (1977).
However, even after controlling for asset age, using a large sample, and industry-specific control groups, there still is weak support for a link be- tween CSR and financial performance. Therefore, part of Abbott and Mon- sen's conclusion can be reiterated: "[B]eing socially involved [does not ap- pear to be] dysfunctional to the investor. Perhaps it is this latter finding that has greater significance for decision making purposes, particularly given current political and social pressures" (1979, p. 514).
Future Research Directions
Future research in this area could proceed in a number of directions. First, better measures of CSR are desperately needed. It may never be pos- sible to measure CSR objectively. Therefore research in this area could focus on perceptions of CSR. Regular surveys of business people, business writers, business school faculty, and the public at large could give researchers reli- able reputation indexes for time series studies. In addition, the Beresford studies could be replicated for recent years. Such content analysis studies in some senses may reflect the firm's perceptions of its social responsibility.
Second, more extensive measures of CSR also are needed. It would be very useful to have CSR rankings on at least the Fortune 500 firms over several years. There might be separate rankings for each of several different constituencies. This could give researchers some indications of the effects of certain policy changes on perceptions of CSR and subsequent effects on financial performance.
Third, the possibility and implications of additional explanatory vari- ables must be explored. The results of this study (i.e., that asset age is highly correlated with CSR) throw doubt on the results of most previous studies. The implications of this new factor should be explored and additional ex- planatory factors sought.
Finally, causality should be investigated. No work to date has statistically demonstrated the direction of causation between these two variables. One promising technique would be an event study. However, in order to conduct a valid event study better and more extensive CSR rankings will be required.
1984 55
This content downloaded from 121.52.153.182 on Mon, 14 Sep 2015 16:56:46 UTCAll use subject to JSTOR Terms and Conditions

56 Academy of Management Journal March
References
Abbott, W. F., & Monsen, R. J. On the measurement of corporate social responsibility: Self-report disclosure as a method of measuring social involvement. Academy of Management Journal, 1979, 22, 501-515.
Alexander, G. J., & Buchholz, R. A. Corporate social responsibility and stock market performance. Academy of Management Journal, 1978, 21, 479-486.
Anderson, J. C., & Frankle, A. W. Voluntary social reporting: An iso-beta portfolio analysis. The Accounting Review, 1980, 55(3), 467-479.
Arlow, P., & Gannon, M. J. Social responsiveness, corporate structure and economic performance. Academy of Management Review, 1982, 7, 235-241.
Beaver, W., & Morse, D. What determines price-earnings ratios? Financial Analysts Journal, 1978, 34(4), 65-86.
Beresford, D. R. Compilation of social measurement disclosures in Fortune 500 annual reports-1973. Ernst and Ernst, 1973.
Beresford, D. R. Social responsibility disclosure in 1974 Fortune 500 annual reports. Ernst and Ernst, 1975.
Beresford, D. R. Social responsibility disclosure-1975 survey of Fortune 500 annual reports. Ernst and Ernst, 1976.
Bowman, E. H., & Haire, M. A strategic posture toward corporate social responsibility. California Management Review, 1975, 18(2), 49-58.
Bragdon, J. H., & Marlin, J. A. T. Is pollution profitable? Risk Management, 1972, 19(4), 9-18.
Council of Economic Priorities. Economic priorities report, 1971, 1(6), 13-23.
Curley, A. J., & Bear, R. M. Investment analysis and management. New York: Harper, 1979.
Errunza, V. R., & Senbet, L. W. The effects of international operations on the market value of the firm: Theory and evidence. Journal of Finance, 1981, 36(2), 401-417.
Folger, H. R., & Nutt, F. A note on social responsibility and stock valuation. Academy of Manage- ment Journal, 1975, 18, 155-159.
Heinze, D. C. Financial correlates of a social involvement measure. Akron Business and Economic Review, 1976, 7(1), 48-51.
How business school students rate corporations. Business and Society Review, 1972, 2, 20-21.
Ingram, R. W. An investigation of the information content of (certain) social responsibility disclosures. Journal of Accounting Research, 1978, 16, 270-285.
Moskowitz, M. Choosing socially responsible stocks. Business and Society Review, 1972, 1, 71-75.
Moskowitz, M. Profiles in corporate responsibility. Business and Society Review, 1975, 13, 29-42.
Preston, L. E. Analyzing corporate social performance: Methods and results. Journal of Contemporary Business, 1978, 7(1), 135-149.
Spicer, B. H. Investors, corporate social performance and information disclosure: An empirical study. The Accounting Review, 1978, 53(1), 94-111.
Sturdivant, F. D., & Ginter, J. L. Corporate social responsiveness: Management attitudes and economic performance. California Management Review, 1977, 19(3), 30-39.
Thomadakis, S. A value-based test of profitability and the market structure. The Review of Economics and Statistics, 1977, 59(2), 179-185.
Vance, S. Are socially responsible corporations good investment risks? Management Review, 1975, 64(8), 18-24.
Philip L. Cochran is Assistant Professor of Business Adminis- tration at Pennsylvania State University.
Robert A. Wood is Assistant Professor of Finance at Pennsyl- vania State University.
This content downloaded from 121.52.153.182 on Mon, 14 Sep 2015 16:56:46 UTCAll use subject to JSTOR Terms and Conditions