Corporate Semantic Web Report VI Validation and Evaluation
64
Corporate Semantic Web Report VI Validation and Evaluation Technical Report TR-B-13-01 Adrian Paschke, G¨ okhan Coskun, Marko Harasic, Ralf Heese, Radoslaw Oldakowski, Ralph Sch¨ afermeier, Olga Streibel, Kia Teymourian and Alexandru Todor Freie Universit¨at Berlin Department of Mathematics and Computer Science Corporate Semantic Web 31 January 2013
Transcript of Corporate Semantic Web Report VI Validation and Evaluation
Corporate Semantic WebReport VI
Validation and Evaluation
Technical Report TR-B-13-01
Adrian Paschke, Gokhan Coskun, Marko Harasic, Ralf Heese,Radoslaw Oldakowski, Ralph Schafermeier, Olga Streibel,
Kia Teymourian and Alexandru Todor
Freie Universitat BerlinDepartment of Mathematics and Computer Science
Corporate Semantic Web
31 January 2013

Corporate Semantic Web
Report VI
Validation and Evaluation
Adrian Paschke Gokhan Coskun Marko HarasicRalf Heese Radoslaw Oldakowski Ralph SchafermeierOlga Streibel Kia Teymourian Alexandru Todor
Freie Universitat BerlinDepartment of Mathematics and Computer Science
Corporate Semantic WebKonigin-Luise-Str. 24-2614195 Berlin, Germany
paschke,coskun,harasic,heese,oldakowski,schaef,streibel,kia,[email protected]
Technical Report TR-B-13-01
31 January 2013

Abstract
In this technical report, we present prototypical implementations of innova-tive tools and methods for personalized and contextualized (multimedia) search,collaborative ontology evolution, ontology evaluation and cost models, and dy-namic access and trends in distributed (semantic) knowledge, developed accord-ing to the working plan outlined in Technical Report TR-B-12-04 [34].
The prototypes complete the next milestone on the path to an integral Cor-porate Semantic Web architecture based on the three pillars Corporate Ontol-ogy Engineering, Corporate Semantic Collaboration, and Corporate SemanticSearch, as envisioned in [33].
Contents
1 Introduction 3
2 Corporate Ontology Engineering 42.1 Ontology Evaluation (WP 12) . . . . . . . . . . . . . . . . . . . . 5
2.1.1 Understanding Ontologies . . . . . . . . . . . . . . . . . . 52.2 Cost Factors in Agile Ontology Development (WP 11) . . . . . . 8
2.2.1 Experiments . . . . . . . . . . . . . . . . . . . . . . . . . 92.2.2 Survey . . . . . . . . . . . . . . . . . . . . . . . . . . . . . 132.2.3 Conclusion and Outlook . . . . . . . . . . . . . . . . . . . 14
3 Corporate Semantic Collaboration 153.1 Dynamic Access To Distributed Knowledge (AP 7) . . . . . . . . 15
3.1.1 Experimental Evaluation of eXTS . . . . . . . . . . . . . 153.2 Ontology and Knowledge Evolution through Collaborative Work
(AP 8) . . . . . . . . . . . . . . . . . . . . . . . . . . . . . . . . . 173.2.1 Related Work . . . . . . . . . . . . . . . . . . . . . . . . . 183.2.2 User Studies on Visualizing Annotations . . . . . . . . . . 193.2.3 Conclusion . . . . . . . . . . . . . . . . . . . . . . . . . . 23
3.3 Semantic Complex Event Processing (AP 5) . . . . . . . . . . . . 233.3.1 Event Query Rules and Their Categories . . . . . . . . . . 233.3.2 Experiments . . . . . . . . . . . . . . . . . . . . . . . . . 263.3.3 Conclusion and Outlook . . . . . . . . . . . . . . . . . . . 29
4 Corporate Semantic Search 304.1 Searching Non-Textual Data (AP3) . . . . . . . . . . . . . . . . . 30
4.1.1 Video Annotation . . . . . . . . . . . . . . . . . . . . . . 314.1.2 Presentation Slides Annotation . . . . . . . . . . . . . . . 344.1.3 Conclusion . . . . . . . . . . . . . . . . . . . . . . . . . . 37
4.2 Evaluation of Recommender Systems (AP 4) . . . . . . . . . . . 384.2.1 Evaluation . . . . . . . . . . . . . . . . . . . . . . . . . . 394.2.2 Conclusion . . . . . . . . . . . . . . . . . . . . . . . . . . 43
4.3 Integrated Personalized Views (AP 14) . . . . . . . . . . . . . . . 434.3.1 OntoMaven - Distributed Maven-based Ontology Project
Management . . . . . . . . . . . . . . . . . . . . . . . . . 444.3.2 Concept - Rule-Based Agent Architecture . . . . . . . . . 454.3.3 Proof of Concept Implementation . . . . . . . . . . . . . . 484.3.4 Demonstrator . . . . . . . . . . . . . . . . . . . . . . . . . 494.3.5 Conclusion . . . . . . . . . . . . . . . . . . . . . . . . . . 51
1

5 Conclusion and Outlook 52
A Work Packages 53
B Acknowledgment 55
2
Chapter 1
Introduction
In this technical report, we present prototypical implementations and evalua-tions of innovative tools and methods for personalized and contextualized (mul-timedia) search, collaborative ontology evolution, ontology evaluation and costmodels, and dynamic access and trends in distributed (semantic) knowledge, de-veloped according to the working plan outlined in Technical Report TR-B-12-04[34].
The proof-of-concept prototypes complete the next milestone on the pathto an integral Corporate Semantic Web architecture based on the three pillarsCorporate Ontology Engineering, Corporate Semantic Collaboration, and Cor-porate Semantic Search, as envisioned in [33]. The prototypes were partiallydeveloped in tight co-operation with our industrial partners and evaluated onthe basis of industrial use cases and demonstrators.
In chapter 2 we present our results in ontology evaluation and cost estimationin agile ontology engineering processes. This addresses the pragmatic aspectsof (re-)using and engineering ontologies in enterprise settings.
In chapter 3 we present the evaluation and experimental results of the de-veloped concepts for Corporate Semantic Collaboration.
Chapter 4 covers the implementation and evaluation results in the CorporateSemantic Search pillar with a specific focus on search in multi-media data,semantic context-based recommendations, and integration of personalized views.
3
Chapter 2
Corporate OntologyEngineering
In traditional development methods of knowledge-based systems creating on-tologies are heavyweight processes, including detailed domain and applicationanalysis. Before the ontology is deployed it passes through different tests until itreaches a satisfying maturity level. Maintenance in this case might be a rathersmall issue, as it is very unlikely that further refinement is necessary while theontology is in use, apart from small corrections.
But bringing ontologies into enterprise environments poses new challenges forontology engineering methodologies. Running businesses have strict constraintswith respect to the capital expenditure as well as the operational expenditure.Long-lasting and cumbersome development processes with a long-term invest-ment return are not acceptable. In fact, agile processes allowing for quicklyexploitable initial versions are desired.
In the context of agile ontology engineering methodologies cost-estimationtechniques as well as efficient reuse and maintenance support needs special at-tention. On the one hand reusing existing ontologies reduces investment costs.On the other hand ontology maintenance in case of agile processes can be con-sidered as equal to forward engineering forming the overall evolution process.In this regard maintenance does not include only low-level activities like addingnew elements, updating, refining, merging, and removing existing elements italso comprises the complete refactoring. Thus, for the sake of efficiency it isessential to understand and to quantify the overall improvement in order to jus-tify the maintenance process. That means it is important to estimate the costfor the maintenance on the one hand and the benefit and profit on the otherhand.
An important assumption for efficient reuse and maintenance is the abilityto evaluate the ontology adequately. Because the decision whether to reuse anontology depends on the degree of its reusability for the envisioned system andon the necessary customization. With respect to maintenance it is importantthat the overall quality is increased by each step.
In this regard this chapter presents ontology evaluation in section 2.1 andcost estimation considerations and factors in agile ontology engineering pro-cesses in section 2.2.
4

2.1 Ontology Evaluation (WP 12)
Development strategy in IT seeks for abstraction, encapsulation and reusabilityin various levels. This caused different paradigms like object-oriented program-ming, agent-oriented programming, aspect oriented programming and differenttechniques like middleware and application containers. The distinction betweenthe program logic and the information model is suggested throughout theseapproaches. The reason for this is twofold, avoiding dependency between themodel and the programming logic, and secondly, allowing for reusable compo-nents. For that reason, reusability is an inherent feature of ontologies, whichare the semantically enriched information models of knowledge-based systems.According to (Dzbor & Motta 2008) “the reuse of existing, possibly imperfect,ontologies becomes the key engineering task.”
The reuse process commonly starts with the intention to utilize ontologies inan envisioned IT system. That means that the developer has an application anda domain in mind. Based on this the developer starts searching for candidateontologies, which might be reused. Different search engines (dıAquin, Sabou, etal. 2007) and ontology libraries (dıAquin & Natalya F Noy 2012) are availableto support this discovery process. Having obtained a list of potential candidateontologies an analysis and decision taking step has to be done. The coverageand level of detail of each candidate has to be evaluated, in order to answer thequestion if an ontology is reusable for the targeted system. If it is, the secondquestion is, to which extend it can be reused and whether it needs some kindof customization. Reuse can range from an inspiring input up to the completeadoption without any customization. It is also possible that a candidate isreused partially, which would assume some modularization step to be taken.It is very important that these decisions are taken quickly and correctly. Ifthe analysis process cannot be done efficiently or the decision is made wrong,the reuse effort would lead to waste of time and resource, although its primarymotivation was to save resources and time.
Careful documentation of the development process and the created artifact isbroadly accepted as an important means to support reuse. It is frequently usedin the field of Software Engineering, where tools like javadoc are very popular.In the field of ontology engineering in contrary the lack of good documentationmakes reuse difficult because the decision process of the applicability of a can-didate ontology becomes time-consuming. But on the other hand the processof documentation is an additional effort for the ontology developer which stilllacks of an appropriate support system.
2.1.1 Understanding Ontologies
In previous work [34] we propose a structure-based ontology partitioning tech-nique to create concept groups for the documentation in a (semi-) automaticway. This technique was evaluated by comparing the results with existing con-cept groups from documentations. In this regard the existing groups have beenconsidered as being a gold standard because they were created by the ontologydevelopers. An additional assumption was that this kind of grouping withina documentation is a good support to understand the content of an ontology.This in fact was to be proved.
We executed a user study where we created two groups of users. The groups
5
had to answer questions about an ontology where the first group had accessonly to an alphabetically sorted list of concepts while the second group of usershad to answer the same questions but had access to concept groupings. Thesegroupings were created with our structure-based partitioned approach. If theaforementioned assumption is true, the second group of users will understandthe ontology faster and will answer the questions quickly. A questionnaire is awell-known technique to measure the knowledge of a user.
The Setup
For the user study it was important that the users have basic experience withontologies and are familiar with concepts of semantic technologies. We selectedthe following three ontologies which model a very generic domain:
1. ECOS: Enterprise Competence Organization Schema
2. PO: BBC Programmes Ontology
3. SWCO: Semantic Web Conference Ontology
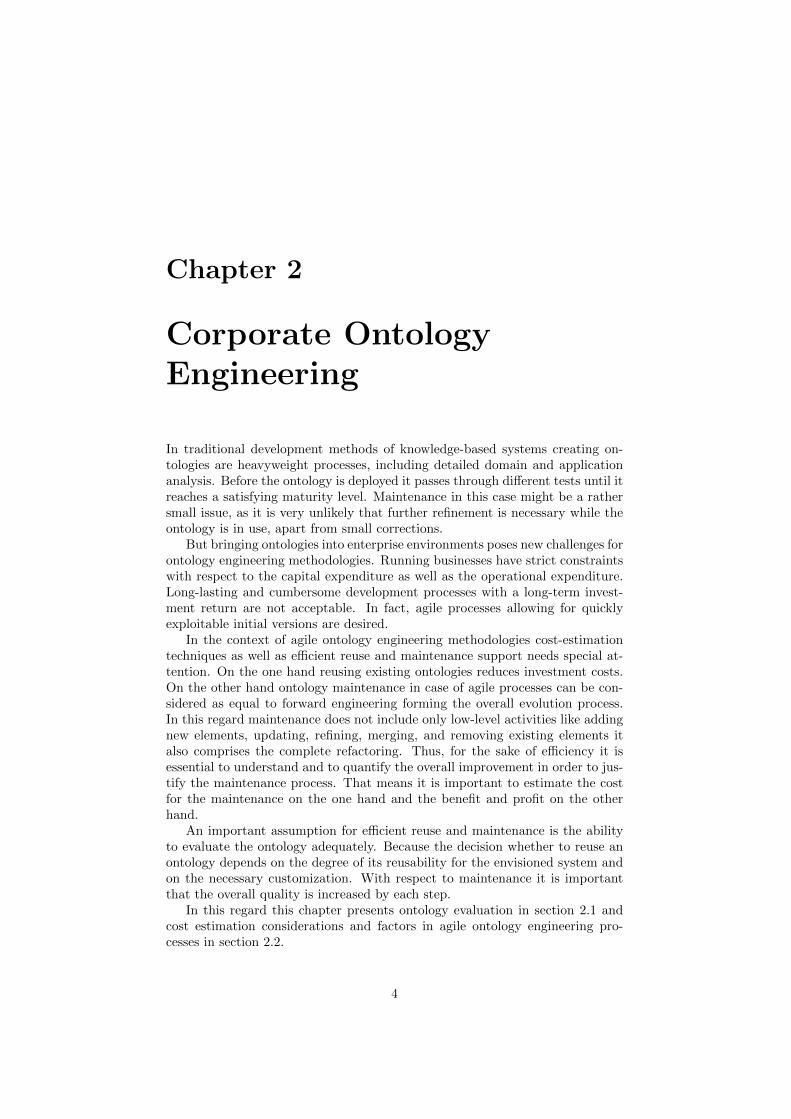
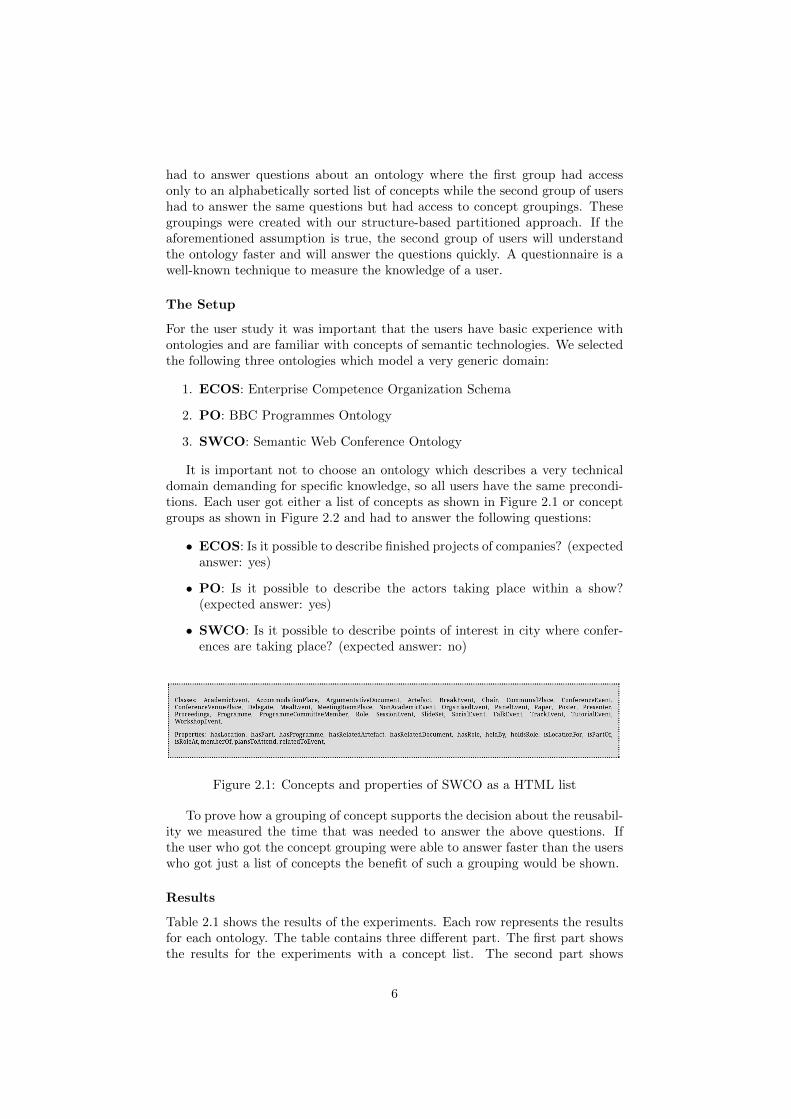
It is important not to choose an ontology which describes a very technicaldomain demanding for specific knowledge, so all users have the same precondi-tions. Each user got either a list of concepts as shown in Figure 2.1 or conceptgroups as shown in Figure 2.2 and had to answer the following questions:
• ECOS: Is it possible to describe finished projects of companies? (expectedanswer: yes)
• PO: Is it possible to describe the actors taking place within a show?(expected answer: yes)
• SWCO: Is it possible to describe points of interest in city where confer-ences are taking place? (expected answer: no)
Figure 2.1: Concepts and properties of SWCO as a HTML list
To prove how a grouping of concept supports the decision about the reusabil-ity we measured the time that was needed to answer the above questions. Ifthe user who got the concept grouping were able to answer faster than the userswho got just a list of concepts the benefit of such a grouping would be shown.
Results
Table 2.1 shows the results of the experiments. Each row represents the resultsfor each ontology. The table contains three different part. The first part showsthe results for the experiments with a concept list. The second part shows
6
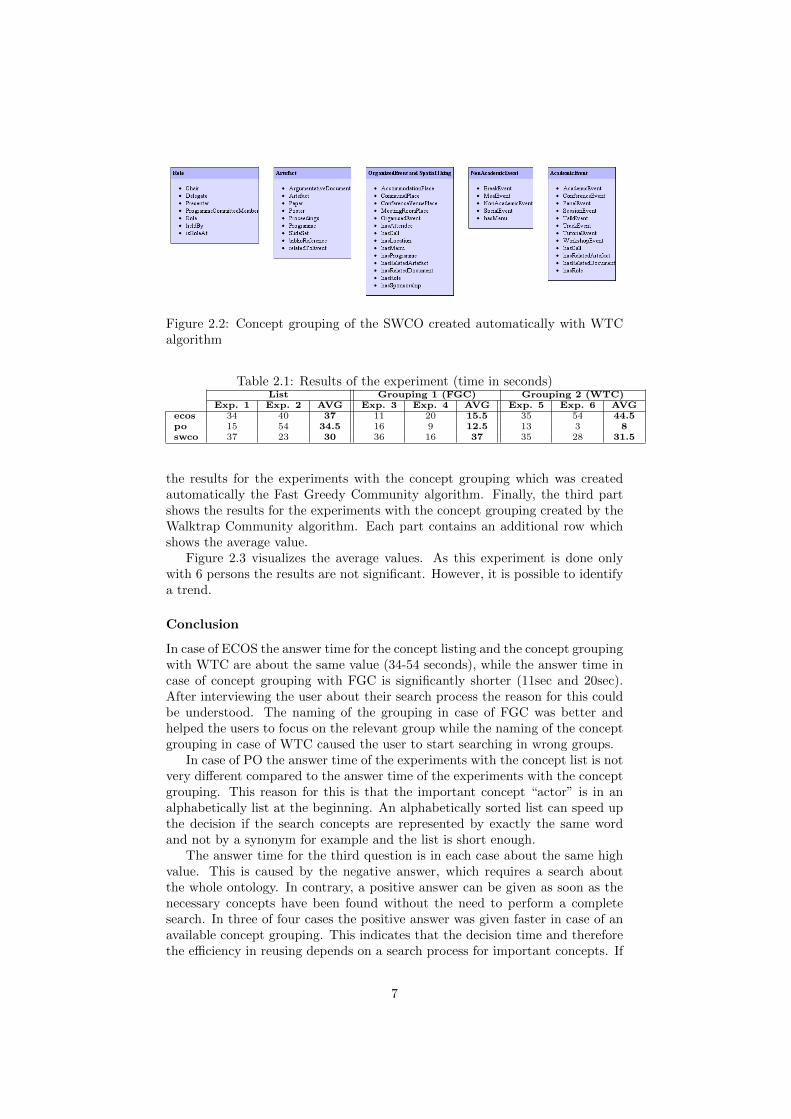
Figure 2.2: Concept grouping of the SWCO created automatically with WTCalgorithm
Table 2.1: Results of the experiment (time in seconds)List Grouping 1 (FGC) Grouping 2 (WTC)
Exp. 1 Exp. 2 AVG Exp. 3 Exp. 4 AVG Exp. 5 Exp. 6 AVGecos 34 40 37 11 20 15.5 35 54 44.5po 15 54 34.5 16 9 12.5 13 3 8swco 37 23 30 36 16 37 35 28 31.5
the results for the experiments with the concept grouping which was createdautomatically the Fast Greedy Community algorithm. Finally, the third partshows the results for the experiments with the concept grouping created by theWalktrap Community algorithm. Each part contains an additional row whichshows the average value.
Figure 2.3 visualizes the average values. As this experiment is done onlywith 6 persons the results are not significant. However, it is possible to identifya trend.
Conclusion
In case of ECOS the answer time for the concept listing and the concept groupingwith WTC are about the same value (34-54 seconds), while the answer time incase of concept grouping with FGC is significantly shorter (11sec and 20sec).After interviewing the user about their search process the reason for this couldbe understood. The naming of the grouping in case of FGC was better andhelped the users to focus on the relevant group while the naming of the conceptgrouping in case of WTC caused the user to start searching in wrong groups.
In case of PO the answer time of the experiments with the concept list is notvery different compared to the answer time of the experiments with the conceptgrouping. This reason for this is that the important concept “actor” is in analphabetically list at the beginning. An alphabetically sorted list can speed upthe decision if the search concepts are represented by exactly the same wordand not by a synonym for example and the list is short enough.
The answer time for the third question is in each case about the same highvalue. This is caused by the negative answer, which requires a search aboutthe whole ontology. In contrary, a positive answer can be given as soon as thenecessary concepts have been found without the need to perform a completesearch. In three of four cases the positive answer was given faster in case of anavailable concept grouping. This indicates that the decision time and thereforethe efficiency in reusing depends on a search process for important concepts. If
7
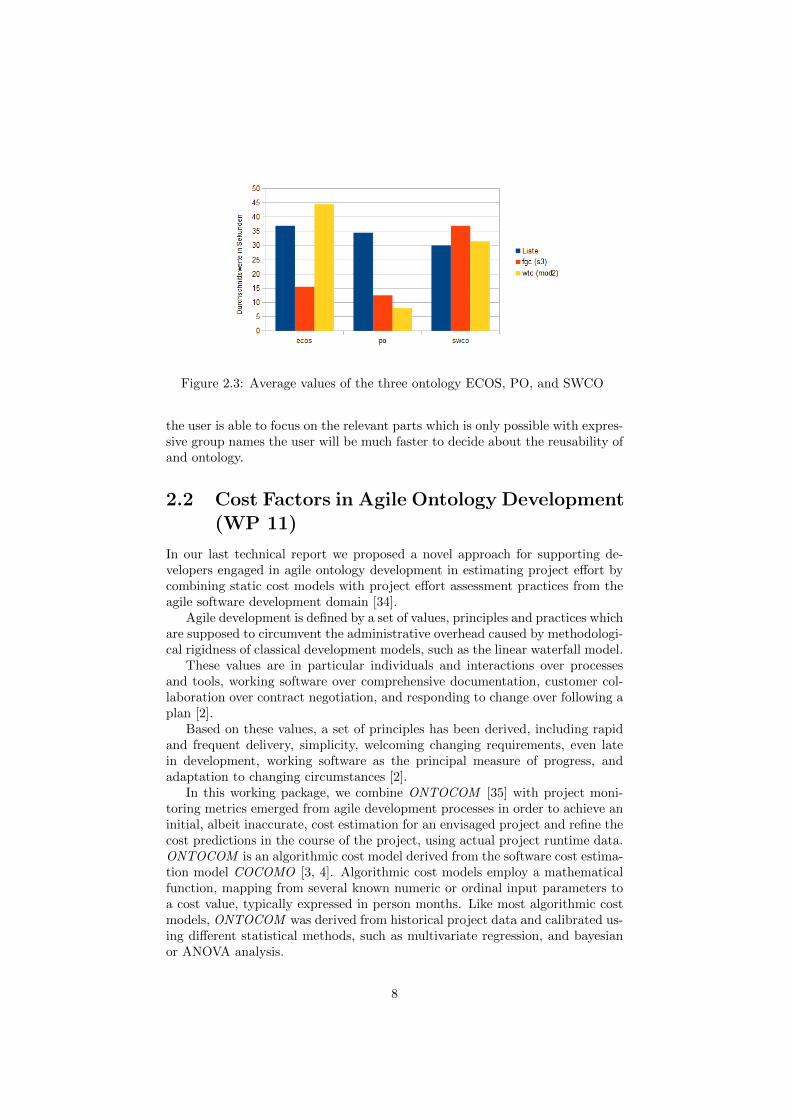
Figure 2.3: Average values of the three ontology ECOS, PO, and SWCO
the user is able to focus on the relevant parts which is only possible with expres-sive group names the user will be much faster to decide about the reusability ofand ontology.
2.2 Cost Factors in Agile Ontology Development(WP 11)
In our last technical report we proposed a novel approach for supporting de-velopers engaged in agile ontology development in estimating project effort bycombining static cost models with project effort assessment practices from theagile software development domain [34].
Agile development is defined by a set of values, principles and practices whichare supposed to circumvent the administrative overhead caused by methodologi-cal rigidness of classical development models, such as the linear waterfall model.
These values are in particular individuals and interactions over processesand tools, working software over comprehensive documentation, customer col-laboration over contract negotiation, and responding to change over following aplan [2].
Based on these values, a set of principles has been derived, including rapidand frequent delivery, simplicity, welcoming changing requirements, even latein development, working software as the principal measure of progress, andadaptation to changing circumstances [2].
In this working package, we combine ONTOCOM [35] with project moni-toring metrics emerged from agile development processes in order to achieve aninitial, albeit inaccurate, cost estimation for an envisaged project and refine thecost predictions in the course of the project, using actual project runtime data.ONTOCOM is an algorithmic cost model derived from the software cost estima-tion model COCOMO [3, 4]. Algorithmic cost models employ a mathematicalfunction, mapping from several known numeric or ordinal input parameters toa cost value, typically expressed in person months. Like most algorithmic costmodels, ONTOCOM was derived from historical project data and calibrated us-ing different statistical methods, such as multivariate regression, and bayesianor ANOVA analysis.
8
A first version of ONTOCOM was based on empirical data from 36 Ontol-ogy Engineering projects. In a second pass, the data set has been extended to148 projects [40]. The ONTOCOM model considers a number of ordinal costdrivers which are supposed to influence the overall cost of an ontology develop-ment project and which appear as weighting factors in the cost function. Thecalibrated results from the second survey suggest that from 11 cost drivers onlysix explain most of the behavior of the model. These are:
• Domain Analysis Complexity (DCPLX): accounts for those features ofthe application setting which influence the complexity of the engineeringoutcomes,
• Evaluation Complexity (OE): accounts for the additional efforts eventuallyinvested in generating test cases and evaluating test results,
• Ontologist/Domain Expert Capability (OCAP/DECAP): accounts for theperceived ability and efficiency of the single actors involved in the process(ontologist and domain expert) as well as their teamwork capabilities,
• Documentation Needs (DOCU): states the additional costs caused by highdocumentation requirements,
• Language/Tool Experience (LEXP/TEXP): measures the level of expe-rience of the project team w. r. t. the representation language and theontology management tools, and
• Personnel Continuity (PCON): mirrors the frequency of the personnelchanges in the team.
In this work, we used the idea of the burndown chart and the velocity mea-sure in order to calibrate an initial cost estimate achieved by using ONTOCOM.While the initial ONTOCOM estimate lacks reliable accuracy, the estimatesby the team members expressed in story points are affected by the problemthat there is no mapping between story points and real time units. Our self-calibrating cost model takes the story estimates and normalizes them by usingthe initial ONTOCOM estimate, yielding a rough estimate for each story interms of workdays our hours. During each iteration, the prediction is adaptedby calculating the current project velocity.
In case of a significant discrepancy between the estimated and the actualproject effort, the team leader is asked to assess the possible factors for thediscrepancy at the end of the release cycle, where the factors correspond to thecost drivers used by ONTOCOM. This assessment is then transferred back tothe ONTOCOM database and used for calibration of the cost factors.
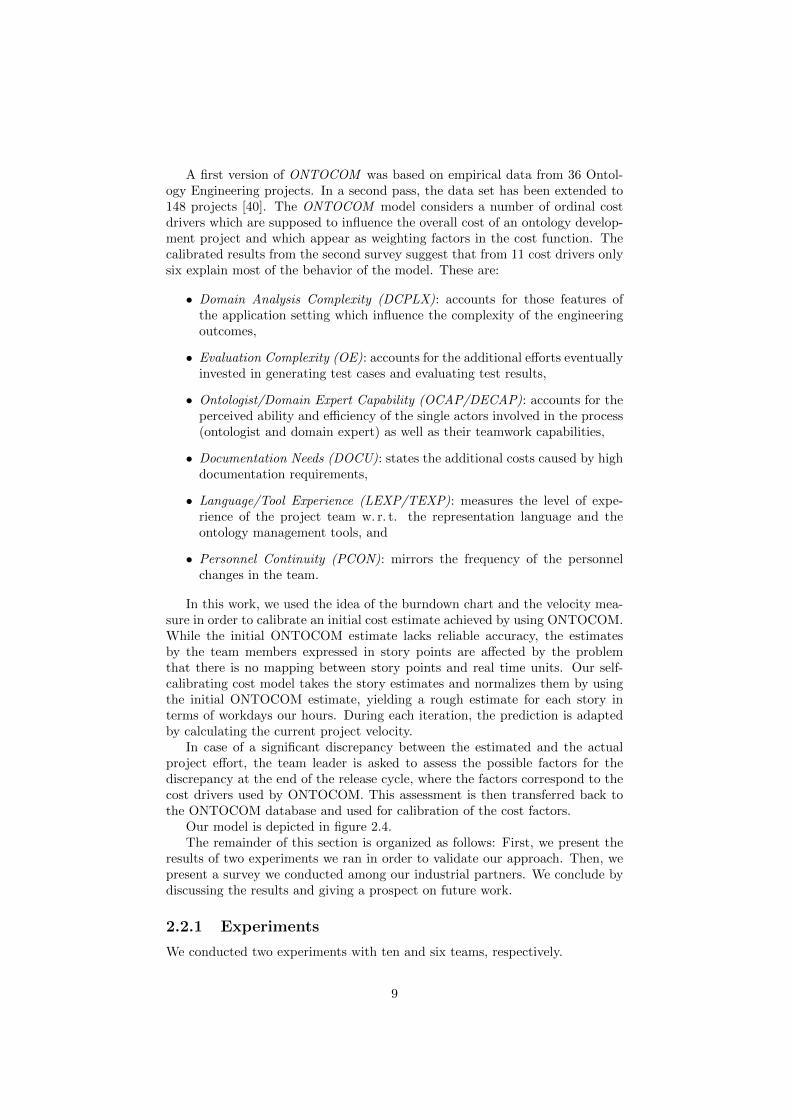
Our model is depicted in figure 2.4.The remainder of this section is organized as follows: First, we present the
results of two experiments we ran in order to validate our approach. Then, wepresent a survey we conducted among our industrial partners. We conclude bydiscussing the results and giving a prospect on future work.
2.2.1 Experiments
We conducted two experiments with ten and six teams, respectively.
9
ONTOCOM initial
estimate
PCONLEXP/TEXP
DOCU
DCPLX
OE
OCAP/DECAP
PM
Sprint
Story
Story
Story
Sprint
Story
Story
Initialsprint
estimateSP
Initialsprint
estimateSP
Initialrelease
estimateSP
Initialrelease
estimatePM
Burndown
PM: Person MonthsSP: Story PointsDCPLX: Domain Analysis ComplexityOE: Evaluation ComplexityOCAP/DECAP: Ontologist/Domain Expert CapabilityDOCU: Documentation NeedsLEXP/TEXP: Language/Tool ExperiencePCON: Personnel Continuity
Refinedrelease
estimatePM
Validation/Verification
COLMEngineering
Selection/Integration/Development
Figure 2.4: Hybrid cost model for agile ontology development processes
Setup
The setup of the experiment was as follows: Each team was presented with ascenario and asked to systematically develop an ontology for the given scenario,making use of agile development principles.
The teams were asked to plan their projects according to the followingphases:
• Requirements elicitation: Gather requirements in the form of compe-tency questions which the intended application should be able to answeron the basis of the ontology (as proposed in [44]).
• Initial cost estimation: Once a sufficient number of competency ques-tions have been gathered in order to describe the expected aspects of themodel, estimate the effort using the ONTOCOM model and an indepen-dent estimate.
– Ontology size: Estimate the prospective size of the ontology interms of numbers of axioms.
– Cost drivers: Asses the relevance of each of the cost drivers usedby the ONTOCOM model in the context of the project.
– Independent estimate: Make an estimate for each of the compe-tency questions in terms of effort or story points, based on the projectteam’s own experience.
• Sprints: Once the requirements have been defined and an initial effortestimation has been made, start modeling. Split up the work along thegiven tasks and competency questions, and perform the work by complet-ing several sprints.
10
In addition to the advices on how to proceed, the following tasks had to beaccomplished:
• Model the ontology according to the competency questions.• Localize the ontology, for example by adding labels in different languages.• Search for existing ontologies that cover the domain and goals of the ap-
plications scenario and integrate them.
Results
The outcome of the experiments consisted of ten ontologies and project docu-mentation containing
• stories in the form of competency questions• effective effort spent on each development task• documentation of factors influencing the effort spent
The size of the resulting ontologies varied between 45 and 168 entities. Theeffort spent for the entire development process, including the requirements elici-tation phase, the sprints, ontology integration tasks, ontology localization tasks,and team discussions varied between one and three entire working days, whichcoincided well with the predictions made by the developers but deviated sig-nificantly from the predictions obtained by using ONTOCOM. However, mostteams faced difficulties with implications for the development effort.
The problems reported by the participants fell into either of the followingclasses:
• Tool support (TOOL)• Overlapping roles/requirements (OLREQ)• Unclear requirements (UCREQ)• Necessity to refactor during a later sprint (REF)• Initial difficulties determining the best way of modeling certain facts (MOD)
The identified classes of causes for project backlog can be further brokendown into the following categories:
TOOL: Causes for project backlog related to tool support vary from gen-eral problems operating the modeling tool (Usability issues, modeling tool orreasoner crashing due to uncaught errors or too large ontologies).
OLREQ: Participants reported different problems concerning the require-ments elicitation process or the following implementation of the requirements.
Common among the problems reported when dealing with requirements wasthe phenomenon of overlapping roles or requirements. Developers either haddifficulties separating concerns of certain concepts at the modeling stage whenthe concepts in question where involved in multiple (functional and/or non-functional) requirements (e. g. a person in the role as the originator of pieces ofinformation and, at the same time, in the role as a customer) or later refactoringof concepts with ambiguous roles.
Along these lines, participants reported problems deciding whether conceptsshould be modelled as concepts (classes), individuals (instances) or relationships
11
role ambiguity was present, resulting in later refactoring or redundant modelingof the same concepts.
UCREQ: Another common difficulty encountered was missing specificityof requirements due to underspecification during first customer communication.Participants also reported difficulties in determining the exact boundaries ofthe domain of interest, leading to disagreement on where to stop modeling andextended need for communication.
REF: Participants reported need for late refactoring for two reasons, thefirst being inconsistencies introduced early during the requirements specifica-tion phase. These differ from the problem of unclear requirements because thisproblem category cannot be attributed to the nature of the requirements alonebut to discrepancies between the formalisms used for representing the require-ments and their incompatibility to the modeling language or approach usedduring the development phase. The second instance of late refactoring was atthe stage of relationship introduction. This represents a special case of the firstone but is mentioned here because participants reported this case repeatedly.
MOD: Cases where participating project teams encountered project backlogdue to modeling problems can be characterized by initial disagreement on thestructure of the ontology or the way of modeling complex facts. These lead tofurther effort spent on communication and planning.
Most of the incidents reported that fall under this category, however, con-cerned the task of integrating external ontologies. Problems encountered in-cluded difficulties in identifying suitable existing ontologies for a given set ofrequirements, high effort spent on the integration process due to insufficientmodularity of the external ontologies, and arising need for late refactoring dueto incompatibilities between own and external ontologies.
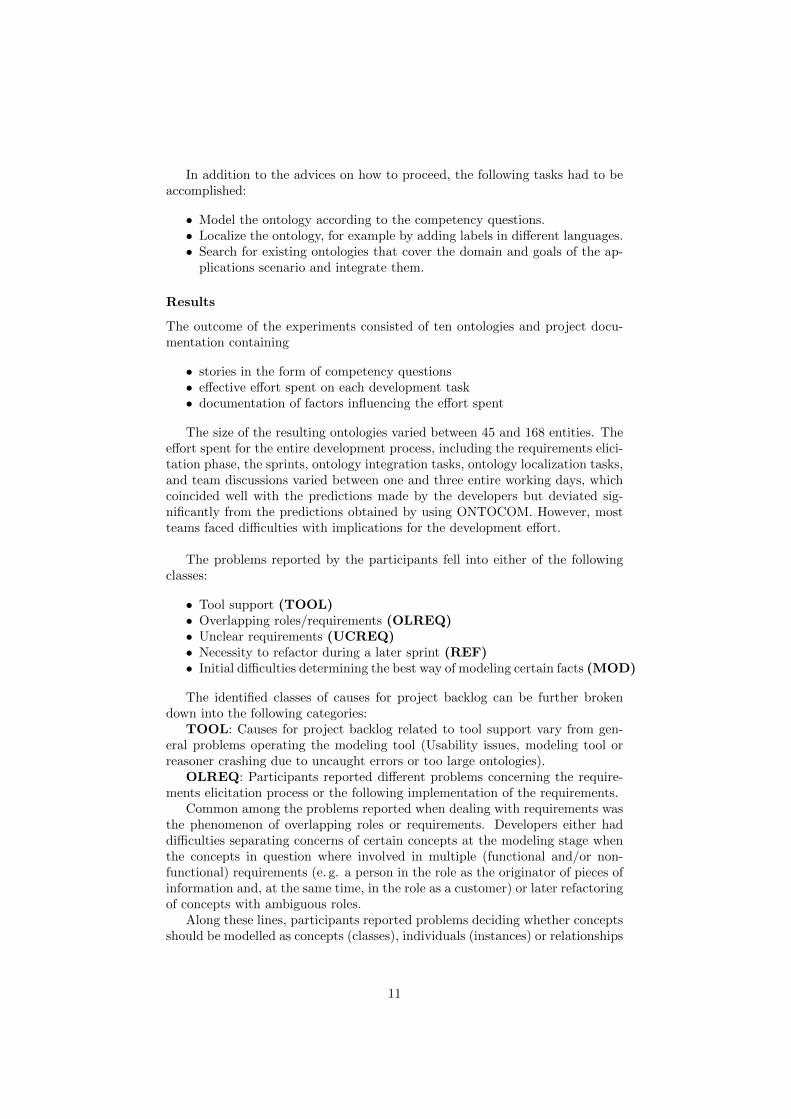
The frequency of incidents of each of the categories is shown in figure 2.5.
0
1
2
3
4
5
Number of reports (out of ten teams)
Reported causes of project backlog
Problems operating modeling toolRequirements too unspecificUnderestimated effort of integrating external ontologiesUnclear where to stop (boundaries of application/domain)Cross-cutting rolesModeling tool/reasoner problems due to large/complex ontologiesNeed to refactor when relationships where introducedNeed to refactor due to inconsistencies in conceptualizationDifficulties in deciding whether to model a fact as a concept or an individualDisagreement on structure of ontology/way of modeling complex facts
Figure 2.5: Number of reported causes of project backlog out of ten teams.
CauseGroup
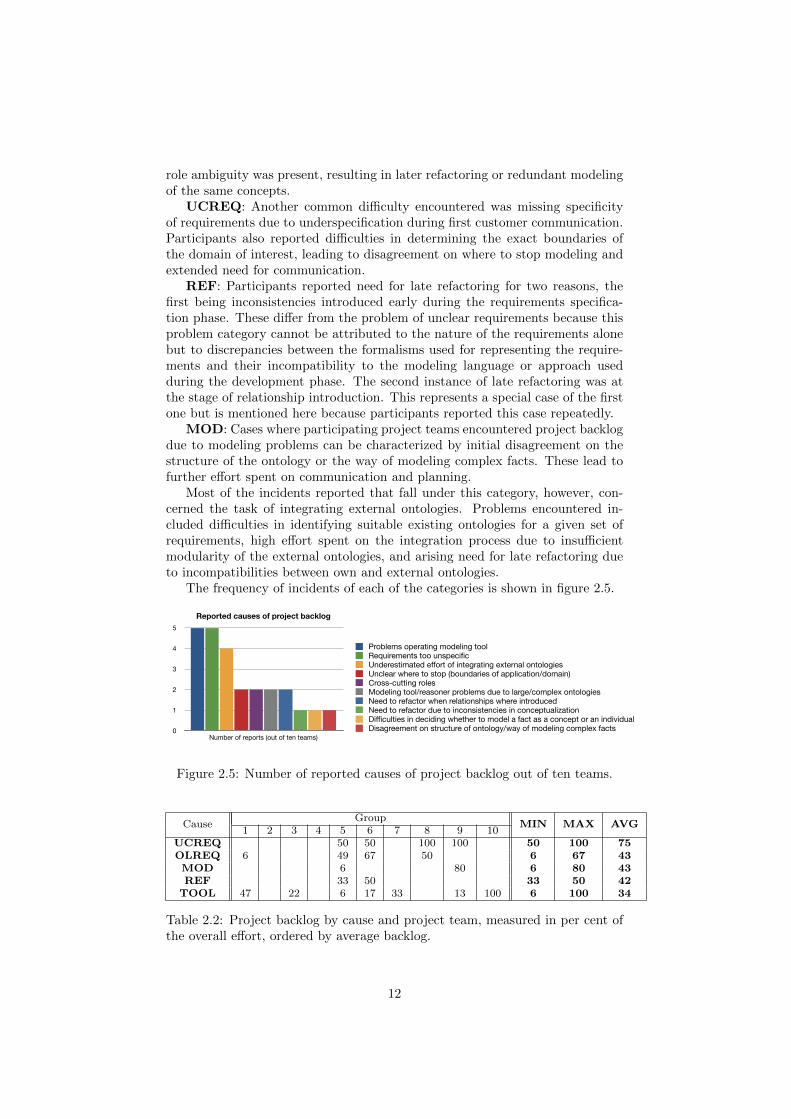
MIN MAX AVG1 2 3 4 5 6 7 8 9 10
UCREQ 50 50 100 100 50 100 75OLREQ 6 49 67 50 6 67 43MOD 6 80 6 80 43REF 33 50 33 50 42TOOL 47 22 6 17 33 13 100 6 100 34
Table 2.2: Project backlog by cause and project team, measured in per cent ofthe overall effort, ordered by average backlog.
12
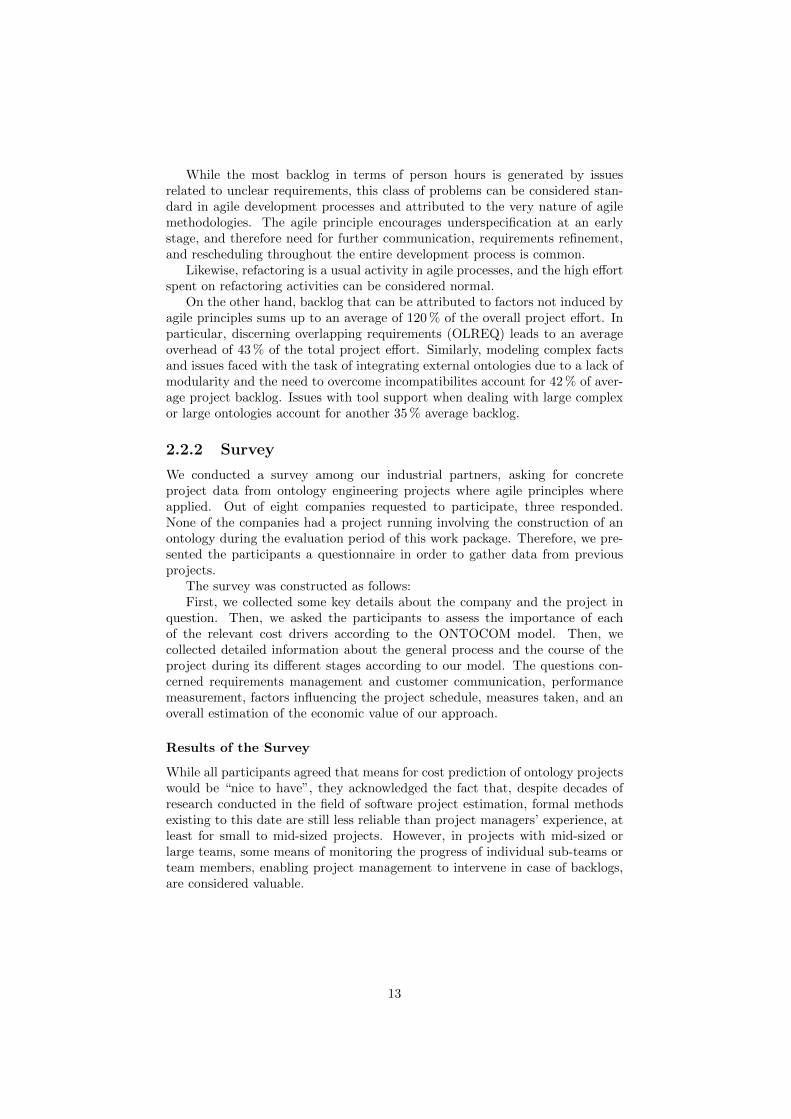
While the most backlog in terms of person hours is generated by issuesrelated to unclear requirements, this class of problems can be considered stan-dard in agile development processes and attributed to the very nature of agilemethodologies. The agile principle encourages underspecification at an earlystage, and therefore need for further communication, requirements refinement,and rescheduling throughout the entire development process is common.
Likewise, refactoring is a usual activity in agile processes, and the high effortspent on refactoring activities can be considered normal.
On the other hand, backlog that can be attributed to factors not induced byagile principles sums up to an average of 120 % of the overall project effort. Inparticular, discerning overlapping requirements (OLREQ) leads to an averageoverhead of 43 % of the total project effort. Similarly, modeling complex factsand issues faced with the task of integrating external ontologies due to a lack ofmodularity and the need to overcome incompatibilites account for 42 % of aver-age project backlog. Issues with tool support when dealing with large complexor large ontologies account for another 35 % average backlog.
2.2.2 Survey
We conducted a survey among our industrial partners, asking for concreteproject data from ontology engineering projects where agile principles whereapplied. Out of eight companies requested to participate, three responded.None of the companies had a project running involving the construction of anontology during the evaluation period of this work package. Therefore, we pre-sented the participants a questionnaire in order to gather data from previousprojects.
The survey was constructed as follows:First, we collected some key details about the company and the project in
question. Then, we asked the participants to assess the importance of eachof the relevant cost drivers according to the ONTOCOM model. Then, wecollected detailed information about the general process and the course of theproject during its different stages according to our model. The questions con-cerned requirements management and customer communication, performancemeasurement, factors influencing the project schedule, measures taken, and anoverall estimation of the economic value of our approach.
Results of the Survey
While all participants agreed that means for cost prediction of ontology projectswould be “nice to have”, they acknowledged the fact that, despite decades ofresearch conducted in the field of software project estimation, formal methodsexisting to this date are still less reliable than project managers’ experience, atleast for small to mid-sized projects. However, in projects with mid-sized orlarge teams, some means of monitoring the progress of individual sub-teams orteam members, enabling project management to intervene in case of backlogs,are considered valuable.
13

2.2.3 Conclusion and Outlook
The results from the experiments described in section 2.2.1 support our hy-pothesis that agile ontology development circumvents some of the difficulties ofpredicting ontology development costs, especially the lack of accuracy of arith-metic cost prediction models. However, hybrid approaches for cost estimationin agile projects involve experience, more accurate documentation and rigidproject management.
The experiments reveal further need for methodological and technical sup-port during the development process. While recent research and the activitiesof the Corporate Semantic Web group have ameliorated the situation to someextent, the experiments reveal a lack of general formal and technical supportfor modularizing and integrating ontologies. One important obstacle is the in-termingling of cross-cutting concerns. Therefore, we argue that formalisms forthe separation of cross-cutting aspects in ontologies are imperatively needed.
For a deeper understanding of the economical aspects of ontologies, it wouldbe necessary to assess not only the cost but also the benefit in terms of revenuethe deployment of ontologies produces. The wide use of ontologies and ontology-based applications has set off in recent years, and data on generated revenue issparse at the time of this writing but will be available to increasing degrees in thecoming years. However, unlike software systems as a whole, the attribution ofrevenue change to the deployment of ontologies is not trivial. In order to fullyunderstand and quantify the economic implications of the use of ontologies,further research is needed.
14
Chapter 3
Corporate SemanticCollaboration
One of the most important part of corporate knowledge can be extracted fromcorporate environment which can be observed in different types and situa-tions like, corporate user activities, organizational memory, internal or externalevents. In the previous reports on our research, we presented concepts for theutilization of corporate environment knowledge. We focus on approaches for“Dynamic Access to Distributed Knowledge”, “Ontology and Knowledge Evolu-tion through Collaborative Work” and “Semantic Complex Event Processing”.
In this chapter, we present the evaluation and experimental results of thedeveloped concepts for Corporate Semantic Collaboration. Section 3.1.1 con-tains the description of eXTS- serious game evaluation. Regarding evaluationof trend ontologies, please see our separate technical report: [43]. In Section3.2 we describe the user studies about manual annotation using light-weight an-notation tools and discuss their results. Section 3.3 presents our experimentalresults on knowledge-based complex event processing and the process of fusionof external knowledge bases with a stream of events.
3.1 Dynamic Access To Distributed Knowledge(AP 7)
3.1.1 Experimental Evaluation of eXTS
eXTS as a Serious Game
In order to evaluate the racing game we start a test run. The technical setup ofthe evaluation run is:1
• The initial set of words consists of all entities generated during the eval-uation of the basic eXTS implementation. The set has a size of 1398words.
• The game is playable for a period of 14 days to have comparable conditionswith the first evaluation. The results of the evaluation are:
1This section contains contribution written by Denis Hartrampf
15
1 There were 34 users that played the game.
2 The players created a total of 1824 taggings.
3 The taggings have no relation, because there was no initial possibilityof giving one.
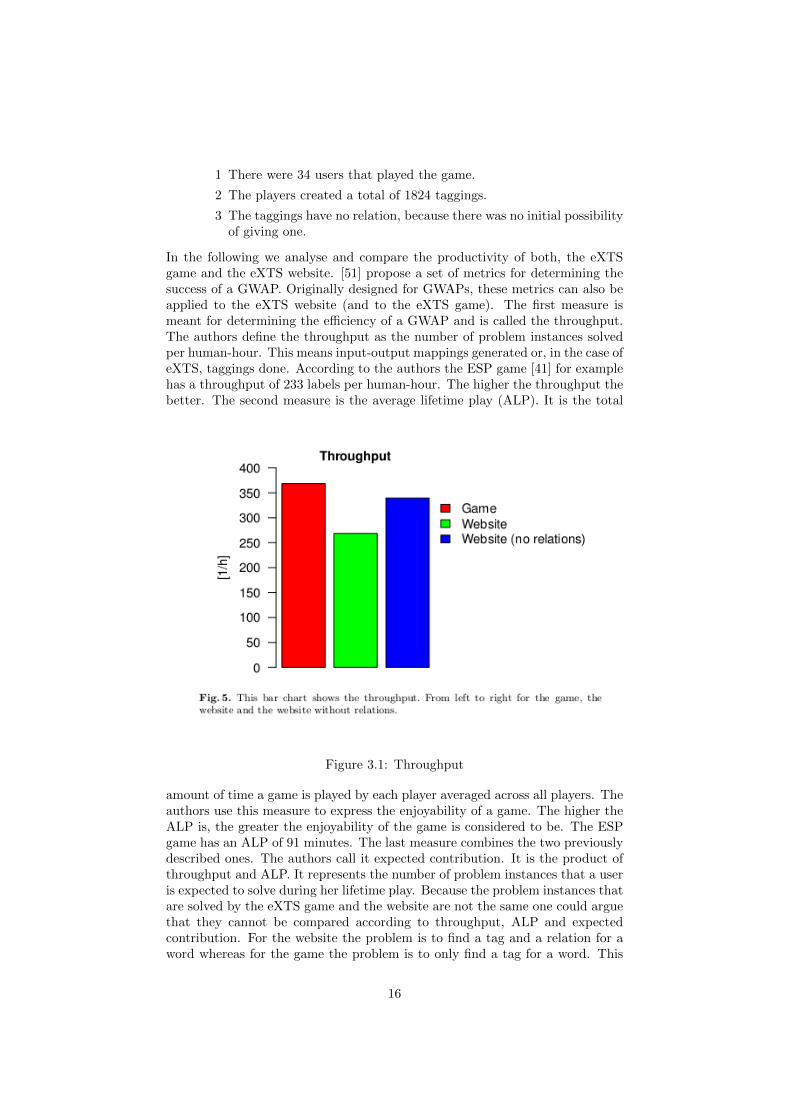
In the following we analyse and compare the productivity of both, the eXTSgame and the eXTS website. [51] propose a set of metrics for determining thesuccess of a GWAP. Originally designed for GWAPs, these metrics can also beapplied to the eXTS website (and to the eXTS game). The first measure ismeant for determining the efficiency of a GWAP and is called the throughput.The authors define the throughput as the number of problem instances solvedper human-hour. This means input-output mappings generated or, in the case ofeXTS, taggings done. According to the authors the ESP game [41] for examplehas a throughput of 233 labels per human-hour. The higher the throughput thebetter. The second measure is the average lifetime play (ALP). It is the total
Figure 3.1: Throughput
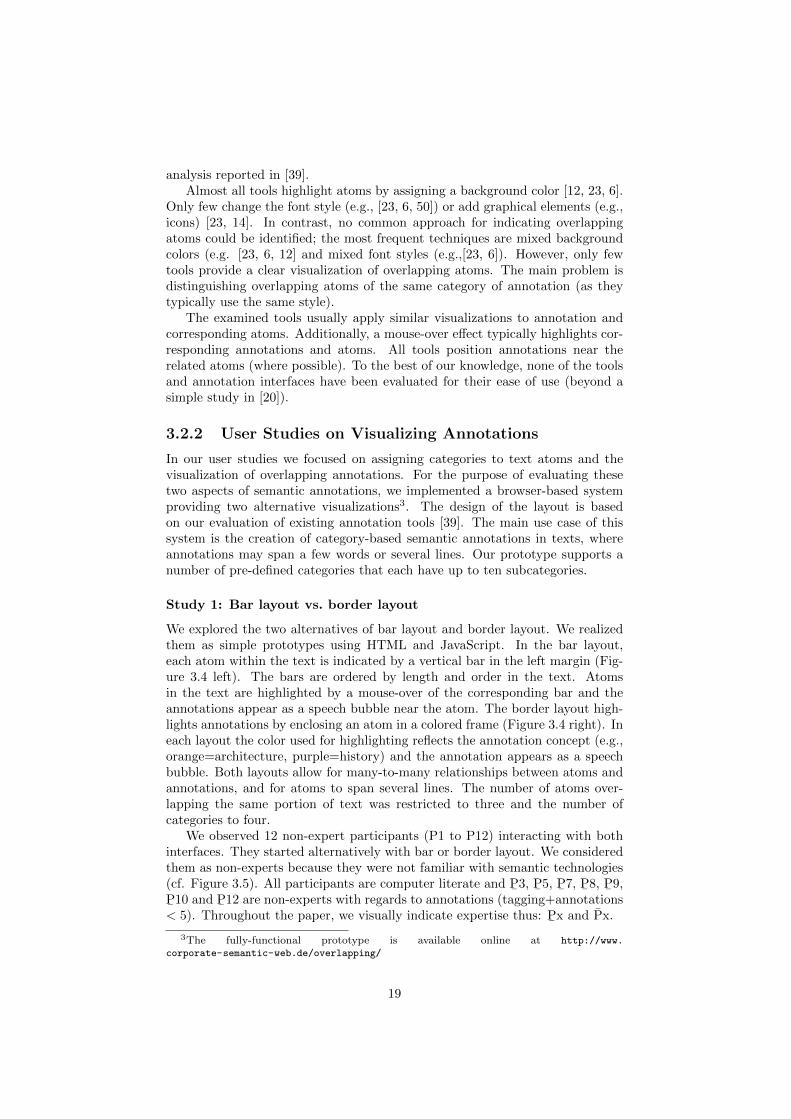
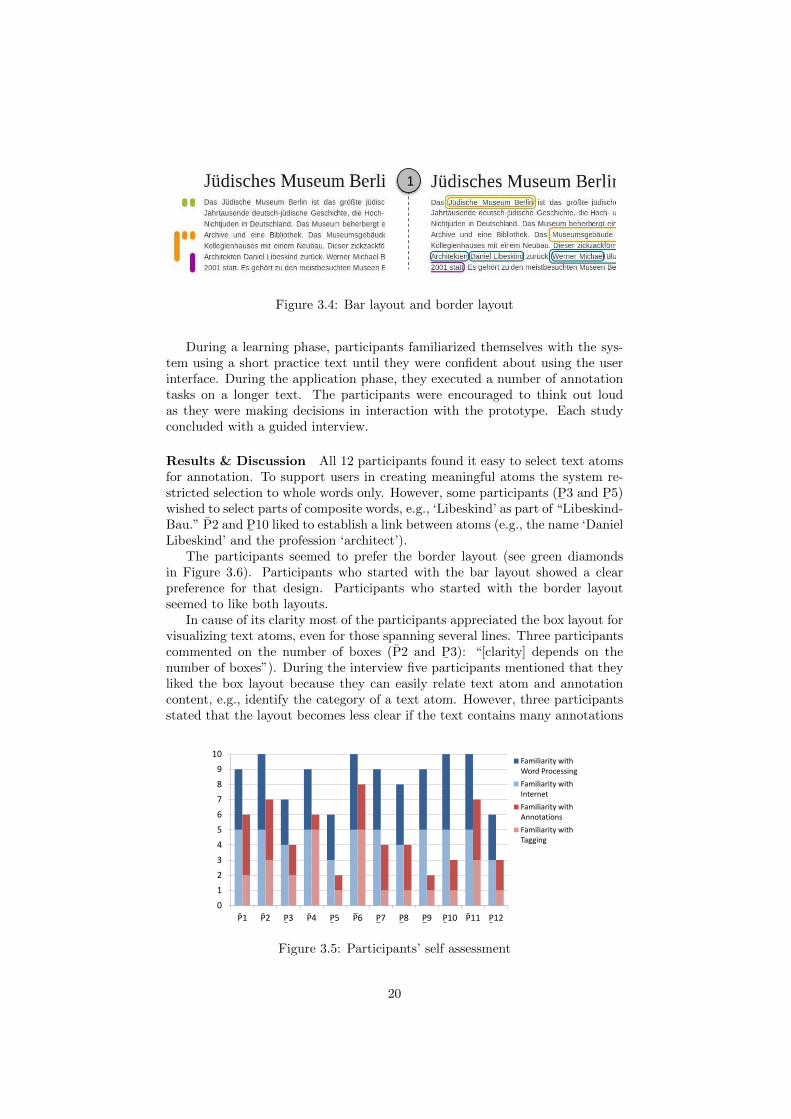
amount of time a game is played by each player averaged across all players. Theauthors use this measure to express the enjoyability of a game. The higher theALP is, the greater the enjoyability of the game is considered to be. The ESPgame has an ALP of 91 minutes. The last measure combines the two previouslydescribed ones. The authors call it expected contribution. It is the product ofthroughput and ALP. It represents the number of problem instances that a useris expected to solve during her lifetime play. Because the problem instances thatare solved by the eXTS game and the website are not the same one could arguethat they cannot be compared according to throughput, ALP and expectedcontribution. For the website the problem is to find a tag and a relation for aword whereas for the game the problem is to only find a tag for a word. This
16
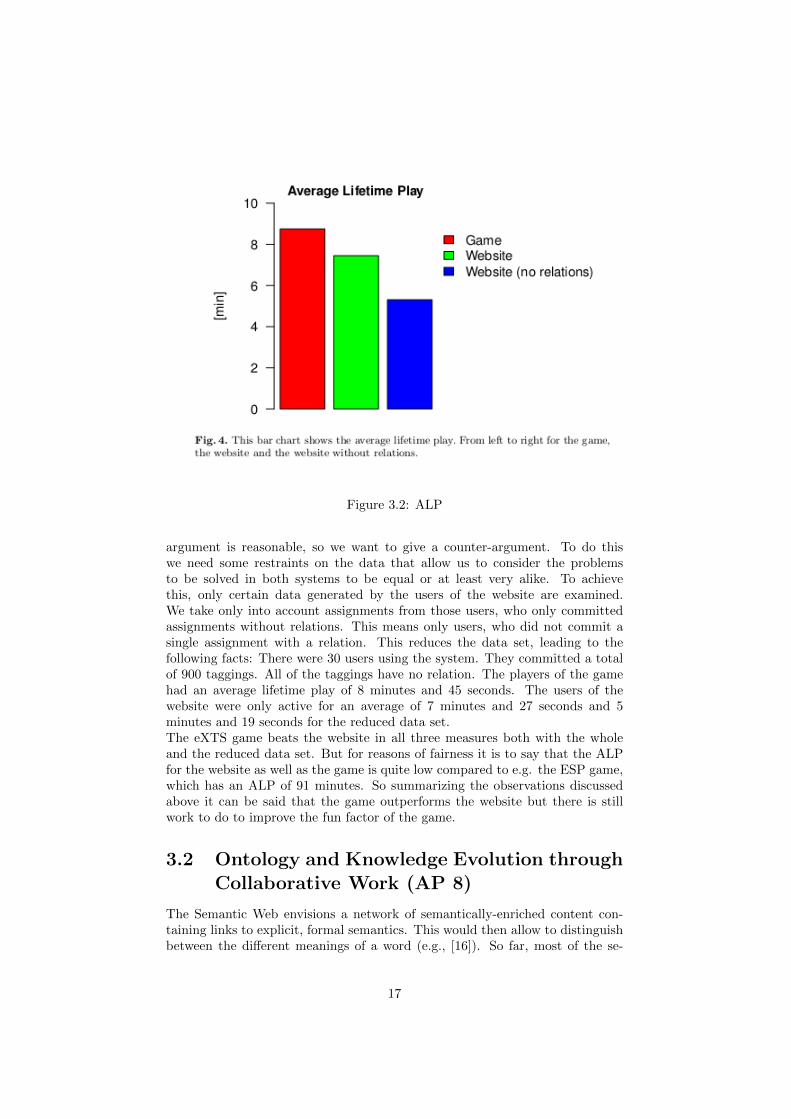
Figure 3.2: ALP
argument is reasonable, so we want to give a counter-argument. To do thiswe need some restraints on the data that allow us to consider the problemsto be solved in both systems to be equal or at least very alike. To achievethis, only certain data generated by the users of the website are examined.We take only into account assignments from those users, who only committedassignments without relations. This means only users, who did not commit asingle assignment with a relation. This reduces the data set, leading to thefollowing facts: There were 30 users using the system. They committed a totalof 900 taggings. All of the taggings have no relation. The players of the gamehad an average lifetime play of 8 minutes and 45 seconds. The users of thewebsite were only active for an average of 7 minutes and 27 seconds and 5minutes and 19 seconds for the reduced data set.The eXTS game beats the website in all three measures both with the wholeand the reduced data set. But for reasons of fairness it is to say that the ALPfor the website as well as the game is quite low compared to e.g. the ESP game,which has an ALP of 91 minutes. So summarizing the observations discussedabove it can be said that the game outperforms the website but there is stillwork to do to improve the fun factor of the game.
3.2 Ontology and Knowledge Evolution throughCollaborative Work (AP 8)
The Semantic Web envisions a network of semantically-enriched content con-taining links to explicit, formal semantics. This would then allow to distinguishbetween the different meanings of a word (e.g., [16]). So far, most of the se-
17
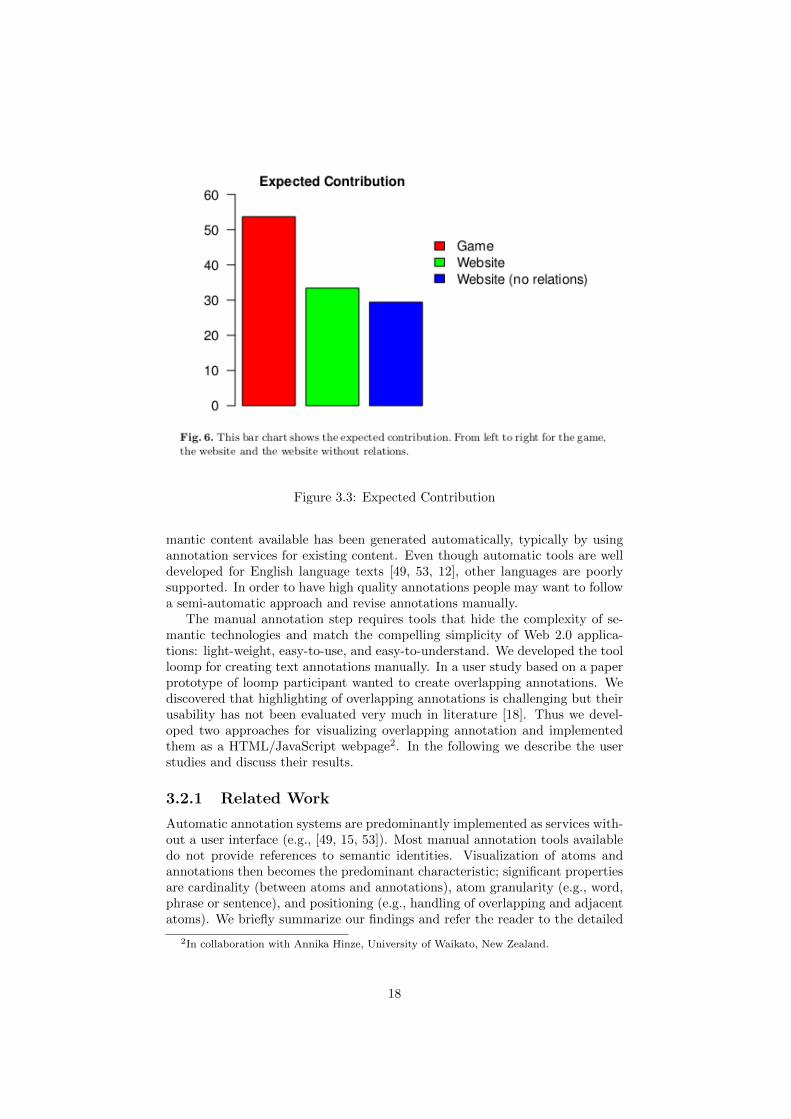
Figure 3.3: Expected Contribution
mantic content available has been generated automatically, typically by usingannotation services for existing content. Even though automatic tools are welldeveloped for English language texts [49, 53, 12], other languages are poorlysupported. In order to have high quality annotations people may want to followa semi-automatic approach and revise annotations manually.
The manual annotation step requires tools that hide the complexity of se-mantic technologies and match the compelling simplicity of Web 2.0 applica-tions: light-weight, easy-to-use, and easy-to-understand. We developed the toolloomp for creating text annotations manually. In a user study based on a paperprototype of loomp participant wanted to create overlapping annotations. Wediscovered that highlighting of overlapping annotations is challenging but theirusability has not been evaluated very much in literature [18]. Thus we devel-oped two approaches for visualizing overlapping annotation and implementedthem as a HTML/JavaScript webpage2. In the following we describe the userstudies and discuss their results.
3.2.1 Related Work
Automatic annotation systems are predominantly implemented as services with-out a user interface (e.g., [49, 15, 53]). Most manual annotation tools availabledo not provide references to semantic identities. Visualization of atoms andannotations then becomes the predominant characteristic; significant propertiesare cardinality (between atoms and annotations), atom granularity (e.g., word,phrase or sentence), and positioning (e.g., handling of overlapping and adjacentatoms). We briefly summarize our findings and refer the reader to the detailed
2In collaboration with Annika Hinze, University of Waikato, New Zealand.
18
analysis reported in [39].Almost all tools highlight atoms by assigning a background color [12, 23, 6].
Only few change the font style (e.g., [23, 6, 50]) or add graphical elements (e.g.,icons) [23, 14]. In contrast, no common approach for indicating overlappingatoms could be identified; the most frequent techniques are mixed backgroundcolors (e.g. [23, 6, 12] and mixed font styles (e.g.,[23, 6]). However, only fewtools provide a clear visualization of overlapping atoms. The main problem isdistinguishing overlapping atoms of the same category of annotation (as theytypically use the same style).
The examined tools usually apply similar visualizations to annotation andcorresponding atoms. Additionally, a mouse-over effect typically highlights cor-responding annotations and atoms. All tools position annotations near therelated atoms (where possible). To the best of our knowledge, none of the toolsand annotation interfaces have been evaluated for their ease of use (beyond asimple study in [20]).
3.2.2 User Studies on Visualizing Annotations
In our user studies we focused on assigning categories to text atoms and thevisualization of overlapping annotations. For the purpose of evaluating thesetwo aspects of semantic annotations, we implemented a browser-based systemproviding two alternative visualizations3. The design of the layout is basedon our evaluation of existing annotation tools [39]. The main use case of thissystem is the creation of category-based semantic annotations in texts, whereannotations may span a few words or several lines. Our prototype supports anumber of pre-defined categories that each have up to ten subcategories.
Study 1: Bar layout vs. border layout
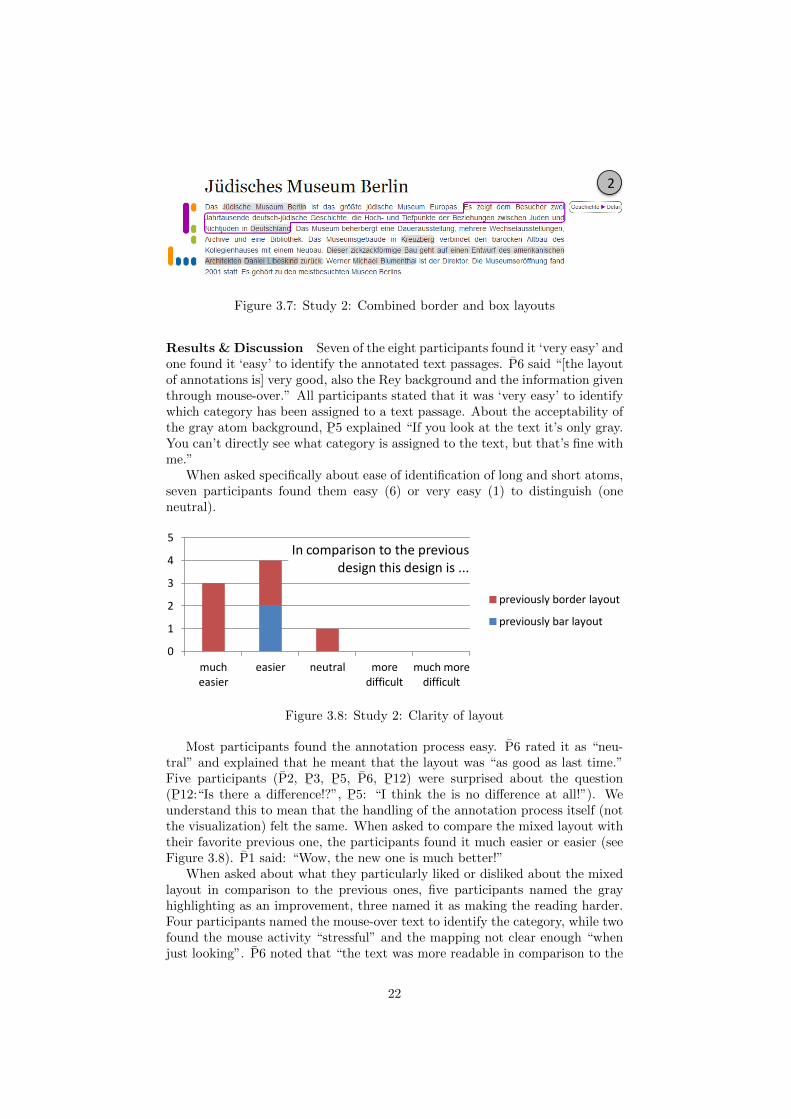
We explored the two alternatives of bar layout and border layout. We realizedthem as simple prototypes using HTML and JavaScript. In the bar layout,each atom within the text is indicated by a vertical bar in the left margin (Fig-ure 3.4 left). The bars are ordered by length and order in the text. Atomsin the text are highlighted by a mouse-over of the corresponding bar and theannotations appear as a speech bubble near the atom. The border layout high-lights annotations by enclosing an atom in a colored frame (Figure 3.4 right). Ineach layout the color used for highlighting reflects the annotation concept (e.g.,orange=architecture, purple=history) and the annotation appears as a speechbubble. Both layouts allow for many-to-many relationships between atoms andannotations, and for atoms to span several lines. The number of atoms over-lapping the same portion of text was restricted to three and the number ofcategories to four.
We observed 12 non-expert participants (P1 to P12) interacting with bothinterfaces. They started alternatively with bar or border layout. We consideredthem as non-experts because they were not familiar with semantic technologies(cf. Figure 3.5). All participants are computer literate and P
¯3, P
¯5, P
¯7, P
¯8, P
¯9,
P¯
10 and P¯
12 are non-experts with regards to annotations (tagging+annotations< 5). Throughout the paper, we visually indicate expertise thus: P
¯x and Px.
3The fully-functional prototype is available online at http://www.
corporate-semantic-web.de/overlapping/
19
1
Figure 3.4: Bar layout and border layout
During a learning phase, participants familiarized themselves with the sys-tem using a short practice text until they were confident about using the userinterface. During the application phase, they executed a number of annotationtasks on a longer text. The participants were encouraged to think out loudas they were making decisions in interaction with the prototype. Each studyconcluded with a guided interview.
Results & Discussion All 12 participants found it easy to select text atomsfor annotation. To support users in creating meaningful atoms the system re-stricted selection to whole words only. However, some participants (P
¯3 and P
¯5)
wished to select parts of composite words, e.g., ‘Libeskind’ as part of “Libeskind-Bau.” P2 and P
¯10 liked to establish a link between atoms (e.g., the name ‘Daniel
Libeskind’ and the profession ‘architect’).The participants seemed to prefer the border layout (see green diamonds
in Figure 3.6). Participants who started with the bar layout showed a clearpreference for that design. Participants who started with the border layoutseemed to like both layouts.
In cause of its clarity most of the participants appreciated the box layout forvisualizing text atoms, even for those spanning several lines. Three participantscommented on the number of boxes (P2 and P
¯3): “[clarity] depends on the
number of boxes”). During the interview five participants mentioned that theyliked the box layout because they can easily relate text atom and annotationcontent, e.g., identify the category of a text atom. However, three participantsstated that the layout becomes less clear if the text contains many annotations
P1 P2 P3 P4 P5 P6 P7 P8 P9 P10 P11 P12
0
1
2
3
4
5
6
7
8
9
10 Familiarity with Word Processing
Familiarity with Internet
Familiarity with Annotations
Familiarity with Tagging
Figure 3.5: Participants’ self assessment
20

0
1
2
3
4
5
6
completely agree
agree neutral disagree completely disagree
"The bar layout is clear."
started with bar layout
started with border layout
sum
0
1
2
3
4
5
6
completely agree
agree neutral disagree completely disagree
"The border layout is clear."
started with bar layout
started with border layout
sum
Figure 3.6: Study 1: Clarity of layout
or several categories are assigned to a text atom. All participants preferredthe bars to be ordered by length. Seven suggested ordering largest to smallest,four suggested from smallest to largest; one was indecisive. Participants whopreferred ordering largest to smallest argued that it would be easier to identifythe lines of text (atoms) belonging to the smaller bars. The other group felt thedesign was clearer when the longer bars were close to the text.
Interviewing the participants we observed that they saw the bar layout tobe more suitable for annotating larger text passages because many (small) barson the left side potentially make the interface less clear. The bar layout wasfound to be well suited for reading and annotating since texts themselves donot contain any highlighting. Participants found the border layout to be moresuited for annotating short text passages because they could easily recognize theatoms, and the relationship between atoms and annotations was clear. How-ever, participants noted that users may get confused by the borders if they areconfronted with too many atoms.
Overlapping annotations constituted a considerate proportion of all createdannotations (used by 8 of 12; up to 30 % of all annotations). They were identifiedas part of a typical annotation process and should not be treated as special cases.
Conclusions for Study 1. We concluded that users seem to be accustomedto the task of assigning categories to text passages. Furthermore, we foundthat systems should provide a view on the text with two characteristics: (1) aclear view on the text for unhindered reading, a quick overview of the text andlocating atoms and annotations at a glance (e.g., bar layout) and (2) detailedinformation about the annotated text passages for creating annotations (e.g.,border layout).
Study 2: Mixed layout
To verify our conclusion we developed a new user interface prototype combiningthe properties of the bar and border layout (Figure 3.7). We extended the barlayout to highlight the annotated text passages with a light-gray backgroundcolor. On a mouse-over of a bar the corresponding text is highlighted in thecolor of the bar using the box from the box layout. Overlapping annotationswere indicated by darkening the gray background color.
In this study we observed and interviewed eight participants. The studystructure was similar to Study 1: participants had a learning phase for the newlayout, an application phase, and a guided interview. All of them also partici-pated in Study 1; we continue using P1–P
¯12 as references for the participants
(omitting P4, P6, P¯
7 and P¯
10).
21
2
Figure 3.7: Study 2: Combined border and box layouts
Results & Discussion Seven of the eight participants found it ‘very easy’ andone found it ‘easy’ to identify the annotated text passages. P6 said “[the layoutof annotations is] very good, also the Rey background and the information giventhrough mouse-over.” All participants stated that it was ‘very easy’ to identifywhich category has been assigned to a text passage. About the acceptability ofthe gray atom background, P
¯5 explained “If you look at the text it’s only gray.
You can’t directly see what category is assigned to the text, but that’s fine withme.”
When asked specifically about ease of identification of long and short atoms,seven participants found them easy (6) or very easy (1) to distinguish (oneneutral).
0
1
2
3
4
5
much easier
easier neutral more difficult
much more difficult
In comparison to the previous design this design is ...
previously border layout
previously bar layout
Figure 3.8: Study 2: Clarity of layout
Most participants found the annotation process easy. P6 rated it as “neu-tral” and explained that he meant that the layout was “as good as last time.”Five participants (P2, P
¯3, P
¯5, P6, P
¯12) were surprised about the question
(P¯
12:“Is there a difference!?”, P¯
5: “I think the is no difference at all!”). Weunderstand this to mean that the handling of the annotation process itself (notthe visualization) felt the same. When asked to compare the mixed layout withtheir favorite previous one, the participants found it much easier or easier (seeFigure 3.8). P1 said: “Wow, the new one is much better!”
When asked about what they particularly liked or disliked about the mixedlayout in comparison to the previous ones, five participants named the grayhighlighting as an improvement, three named it as making the reading harder.Four participants named the mouse-over text to identify the category, while twofound the mouse activity “stressful” and the mapping not clear enough “whenjust looking”. P6 noted that “the text was more readable in comparison to the
22
border layout.” Several participants particularly mentioned that they liked thecombination of bar and border view (P6: “[it] draws from the advantages ofboth border and bar view”).
Conclusions for Study 2. Both annotation experts and non-experts were ableto successfully create annotations. Even a change of interface and visualizationdid not influence the participants’ ability to create concept-based annotations.Recognizing existing annotations (as necessary for as post-processing of auto-matic annotations) has given mixed results – some participants liked the newlayout, others felt it still needed improvements (e.g., for easy recognition ofannotation categories without mouse-over).
3.2.3 Conclusion
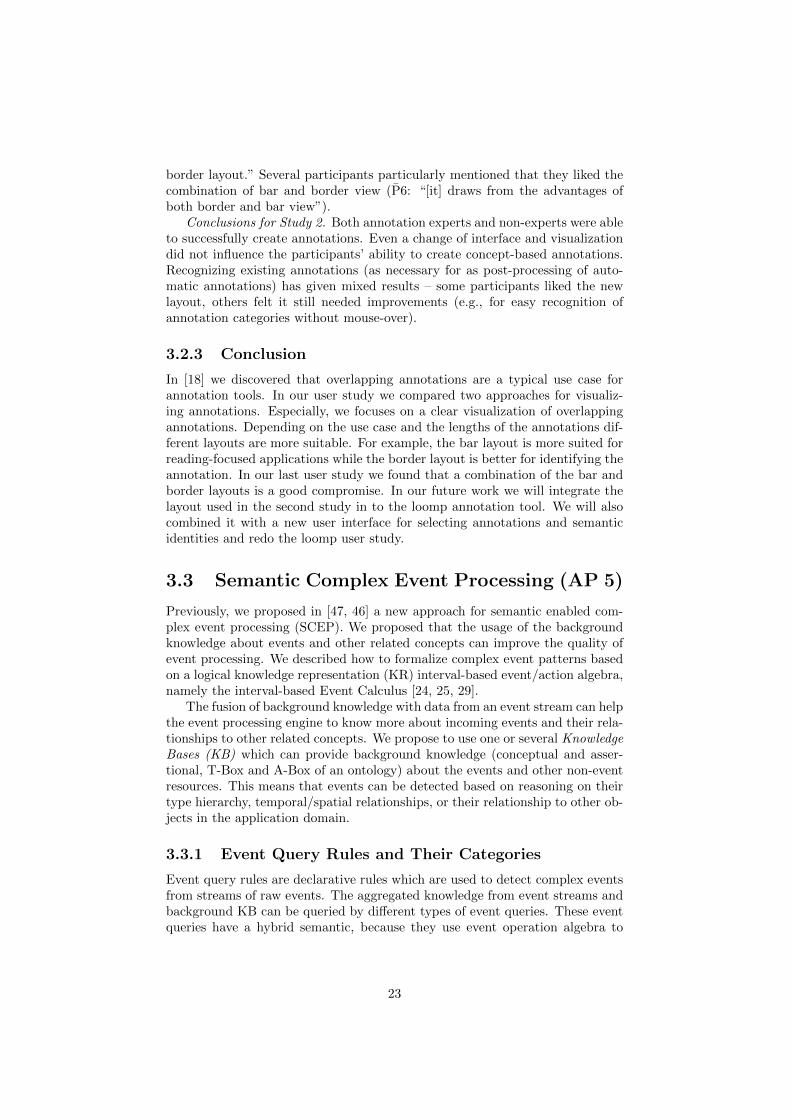
In [18] we discovered that overlapping annotations are a typical use case forannotation tools. In our user study we compared two approaches for visualiz-ing annotations. Especially, we focuses on a clear visualization of overlappingannotations. Depending on the use case and the lengths of the annotations dif-ferent layouts are more suitable. For example, the bar layout is more suited forreading-focused applications while the border layout is better for identifying theannotation. In our last user study we found that a combination of the bar andborder layouts is a good compromise. In our future work we will integrate thelayout used in the second study in to the loomp annotation tool. We will alsocombined it with a new user interface for selecting annotations and semanticidentities and redo the loomp user study.
3.3 Semantic Complex Event Processing (AP 5)
Previously, we proposed in [47, 46] a new approach for semantic enabled com-plex event processing (SCEP). We proposed that the usage of the backgroundknowledge about events and other related concepts can improve the quality ofevent processing. We described how to formalize complex event patterns basedon a logical knowledge representation (KR) interval-based event/action algebra,namely the interval-based Event Calculus [24, 25, 29].
The fusion of background knowledge with data from an event stream can helpthe event processing engine to know more about incoming events and their rela-tionships to other related concepts. We propose to use one or several KnowledgeBases (KB) which can provide background knowledge (conceptual and asser-tional, T-Box and A-Box of an ontology) about the events and other non-eventresources. This means that events can be detected based on reasoning on theirtype hierarchy, temporal/spatial relationships, or their relationship to other ob-jects in the application domain.
3.3.1 Event Query Rules and Their Categories
Event query rules are declarative rules which are used to detect complex eventsfrom streams of raw events. The aggregated knowledge from event streams andbackground KB can be queried by different types of event queries. These eventqueries have a hybrid semantic, because they use event operation algebra to
23
c3
?S3
c1
?S1
?S4
p1
Knowledge Base
Timee1
a1
a2
a1
a2
a1
a2
Events
c2
?S2
?S6
?S5
p4p5
p3
e2e3 e1
p2
{ { (?e1, c1, ?s1) .
(?s1, p*, ?s) . }% SEQ event algebra operation
[?e1 SEQ ?e2][Within 5 min.]
{ (?e2, c2, ?s2) .
(?s2, p*, ?s) . } }
[?e2 SEQ e3] [Within 5 min.]
{ (?e3, c3, ?s3) .
(?s3, p*, ?s) . } }
Figure 3.9: Relation of Events to Resources in the Background Knowledge andPseudocode of Event Detection Pattern
detect events and they use SPARQL queries to include background knowledgeabout these events and their relationships.
Lets consider an Event type E1 which can be instantiated with n (attribute,value) tuples like: e11((a1, v1), . . . , (an, vn)). The figure 3.9 shows the eventstream and the relationships of events to resources in the background knowl-edge. An event instance e1 can be connected to one or more resources in thebackground knowledge by using a connecting predicate c1 using one or moreattribute value pairs of the event instance.
Our event query rules allow simple event algebra operations, similar to Snoop[11] (i.e. event operations like AND, SEQ, OR, NOT), to query the eventstream as well as higher interval-based event operations like (BEFORE, MEETS,OVERLAP, . . . ). Our event query rules can include SPARQL query predicateto query external KBs. The results of SPARQL queries are used in combinationwith event stream to detect complex events. This means that a complex eventpattern is defined based on the event operation algebra in combination withSPARQL queries (basic graph patterns plus inferencing on knowledge graph).
One event detection pattern of the relationship shown in the figure 3.9 can berepresented by the given pseudocode. The event e1 is connected to the resources1 in the background knowledge by the predicate c1. In the same way the evente2 is connected to the resource s2 by predicate c2. The predicate p4 connectthe two resources s4 and s5, so that it connects the two sub-graphs.
In this report, we describe the most important and interesting categoriesof event query rules. This categorization is not a complete classification of allpossible rule combinations, our aim is more to emphasize interesting rule com-binations which can be processed using different event processing approaches.Our implementation of these event query rules and our initial experiments withthese rules are described in [48].
Category A - Single SPARQL Query: In this category, the event queryrule includes only one single knowledge query and uses its results in one or morevariables within the event detection rule. A SPARQL query is used to import
24
knowledge about event instances or types. One or more attributes of events areused to build the basic triple pattern inside the SPARQL query. Category Aevent query rules can be categorized into three subcategories:
Category A1 - Raw SPARQL: This category of event query rule is thesimplest form of these event query rule. The included SPARQL query is onlyabout the resources in the background knowledge. The background knowledgequery is independent from the event stream, however the complex event detec-tion is defined on the results of this query in combination with the event stream.In some cases, on each event the SPARQL query should be resent to the KB toupdate the latest results from the KB.
Category A2 - Generated SPARQL: In this category of event queryrules with each incoming event a different SPARQL query is generated and sentto the target knowledge base. The attribute/values of an event instance are usedto generate basic triple patterns of a SPARQL query. Based on user definitionssome of the tuples (attribute, value) of an event instance are selected and usedto generate a single SPARQL Query.
Category A3 - Generated SPARQL from Multiple Events: Thequery is similar to A2, but the SPARQL query is generated from multiple events.Within a data window (e.g., a sliding time window) from two or more eventsa single SPARQL query is generated. Multiple events are used to generate thesingle SPARQL query, the event processing waits for receiving some new eventsand then generate a SPARQL query based on the emitted events, and query forthe background knowledge about them.
Category B - Several SPARQL Queries: Queries of this category in-clude several SPARQL queries and combine them with event detection rules.This means that several A category rules are combined together which canbuild a category B. The category B of rules are able to combine results fromKBs with events using event operation algebra.
Category B1 - Several SPARQL Queries in AND, OR and SEQOperations: The category B1 is based on the category B, but the results fromthe SPARQL query predicates are combined with AND, OR, SEQ or similarevent algebra operations. The whole query is evaluated on sliding windows ofevent streams. The SPARQL query predicates are not depending on each other,i.e., the results from one is not used in another SPARQL predicate, so that theyare not depending on the results of the other SPARQL query.
Category B2 - Chaining SPARQL Queries: In category B2 severalSPARQL queries are generated and executed in sequence. They can be gener-ated based on the results of the previous SPARQL query. Each SPARQL querycan be generated from a set of events (e.g., included in a slide of event streamby means of a sliding window, a counting or timing window). This means thatdifferent data windows can be defined to wait until some events happened andthen a SPARQL query is executed. SPARQL queries might be defined in asequence chain. The results are directly used for event processing or used inanother following SPARQL query.
Category B3 - Chained and Combined SPARQL Queries: In thiscategory SPARQL queries are used in combination with all possible event al-gebra operations like, AND
∧, OR
∨, SEQ
⊕, Negation ¬ , etc. The event
operations are used for combining the results from several SPARQL queries orseveral SPARQL queries are used in combination with event algebra operationslike: ((sparql1
⊕sparql2)
∧sparql3
∨¬sparql4). This category of event query
25
rules is the general form of queries and has the highest possible complexity,because the results from external KBs are used in combination with event op-erations or the attribute/values from incoming events are used for generation ofcomplex SPARQL queries.
3.3.2 Experiments
For our experiments we required two kinds of data, 1. live real world data fromstock market and 2. background knowledge about these events. We used twodata sources: background knowledge about companies from DBpedia and thelive event stream from Yahoo finance 4. In addition to these two data sources,we needed to have some mapping between resources in these two data sets. Wemanually created a mapping hash list between stock market symbols to the URLresources of these companies, for example by searching the DBpedia URL forstock market symbol:“MSFT” − > “http://dbpedia.org/resource/Microsoft”
We have set up two machines, one for an external knowledge base, andanother one for the main event processing. Our two machines have Quad CoreIntel(R) Xeon(R) CPU E31245 @ 3.30GHz with 16 GB RAM and Debian Linuxkernel x86 64 3.0.0-16. The two machines are connected by a dedicated 1000Megabit/s (Gigabit-Ethernet) LAN.
We installed on one machine Virtuoso Triple store5 and deployed a com-plete mirror of DBpedia dataset (version 3.7). The dataset of DBpedia consistsof 288 million pieces of information (RDF triples). We configured the virtu-oso for the best performance for 8 GB, NumberOfBuffers=680000, MaxDirty-Buffers=500000. The level of reasoning on the dataset is up to RDFS level andbelow the OWL-lite. Several triple store systems are available which providedifferent performance and scalability. For our experiments, we only need to useone of them for the comparison of our processing approaches.
For event processing on one of the machines, we used Prova rule engine.Prova can be run as a java application which we used with 2 GB initial and14 GB maximum java heap size. The highest event processing throughput thatwe could measure with a simplest event query rule, listing 3.1, is about 450000events/s (up to 500000 events/s).
:− eva l ( s e r v e r ( ) ) .s e r v e r ( ) :− rcvMult (XID, Protocol , From , MSG, {} ) ,
sendMsg (XID, osg i , From , reply , {} ) .
Listing 3.1: Properties for a Company in DBpedia.
The scenario for our experiments is that we have huge amount of backgroundknowledge (288 Million RDF triples) and a high frequency event stream. To thebest of our knowledge it is impossible to use one of the existing event process-ing engines and load such huge amount of background knowledge to the mainmemory, so that we can compare the existing CEP engines with our approach.However, we compare the improvements achieved by applying different eventprocessing approaches which are proposed in this paper and compare them toeach other on the same experimental environment. We have done the followingexperiments:
4http://finance.yahoo.com5http://virtuoso.openlinksw.com , retrieved May 2012
26
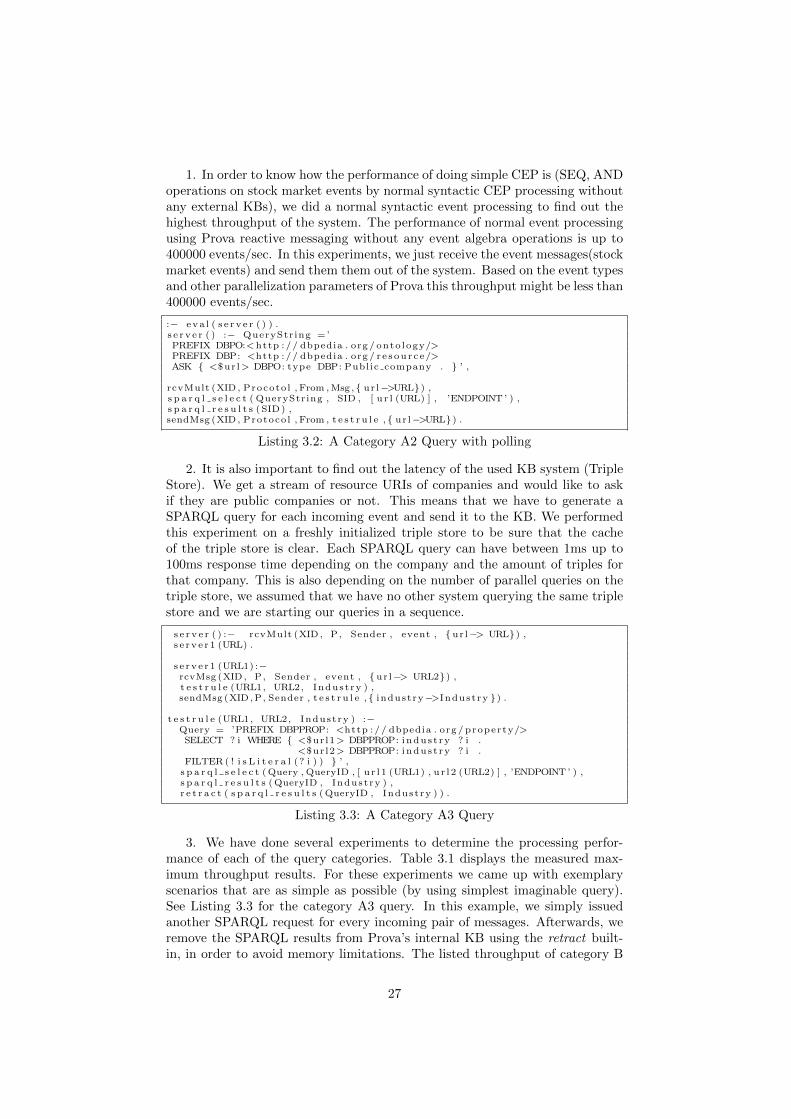
1. In order to know how the performance of doing simple CEP is (SEQ, ANDoperations on stock market events by normal syntactic CEP processing withoutany external KBs), we did a normal syntactic event processing to find out thehighest throughput of the system. The performance of normal event processingusing Prova reactive messaging without any event algebra operations is up to400000 events/sec. In this experiments, we just receive the event messages(stockmarket events) and send them them out of the system. Based on the event typesand other parallelization parameters of Prova this throughput might be less than400000 events/sec.
:− eva l ( s e r v e r ( ) ) .s e r v e r ( ) :− QueryString =’PREFIX DBPO:<http :// dbpedia . org / onto logy/>PREFIX DBP: <http :// dbpedia . org / r e sou r c e/>ASK { <$ur l> DBPO: type DBP: Public company . } ’ ,
rcvMult (XID , Procotol , From ,Msg ,{ ur l−>URL}) ,s p a r q l s e l e c t ( QueryString , SID , [ u r l (URL) ] , ’ENDPOINT’ ) ,s p a r q l r e s u l t s (SID) ,sendMsg (XID, Protocol , From , t e s t r u l e ,{ ur l−>URL}) .
Listing 3.2: A Category A2 Query with polling
2. It is also important to find out the latency of the used KB system (TripleStore). We get a stream of resource URIs of companies and would like to askif they are public companies or not. This means that we have to generate aSPARQL query for each incoming event and send it to the KB. We performedthis experiment on a freshly initialized triple store to be sure that the cacheof the triple store is clear. Each SPARQL query can have between 1ms up to100ms response time depending on the company and the amount of triples forthat company. This is also depending on the number of parallel queries on thetriple store, we assumed that we have no other system querying the same triplestore and we are starting our queries in a sequence.
s e r v e r ( ) :− rcvMult (XID, P, Sender , event , {ur l−> URL}) ,s e rv e r1 (URL) .
s e rv e r1 (URL1) :−rcvMsg (XID, P, Sender , event , {ur l−> URL2}) ,t e s t r u l e (URL1, URL2, Industry ) ,sendMsg (XID,P, Sender , t e s t r u l e ,{ industry−>Industry }) .
t e s t r u l e (URL1, URL2, Industry ) :−Query = ’PREFIX DBPPROP: <http :// dbpedia . org / property/>SELECT ? i WHERE { <$url1> DBPPROP: indust ry ? i .
<$url2> DBPPROP: indust ry ? i .FILTER( ! i s L i t e r a l (? i ) ) } ’ ,s p a r q l s e l e c t (Query , QueryID , [ u r l 1 (URL1) , u r l 2 (URL2) ] , ’ENDPOINT’ ) ,s p a r q l r e s u l t s (QueryID , Industry ) ,r e t r a c t ( s p a r q l r e s u l t s (QueryID , Industry ) ) .
Listing 3.3: A Category A3 Query
3. We have done several experiments to determine the processing perfor-mance of each of the query categories. Table 3.1 displays the measured max-imum throughput results. For these experiments we came up with exemplaryscenarios that are as simple as possible (by using simplest imaginable query).See Listing 3.3 for the category A3 query. In this example, we simply issuedanother SPARQL request for every incoming pair of messages. Afterwards, weremove the SPARQL results from Prova’s internal KB using the retract built-in, in order to avoid memory limitations. The listed throughput of category B
27
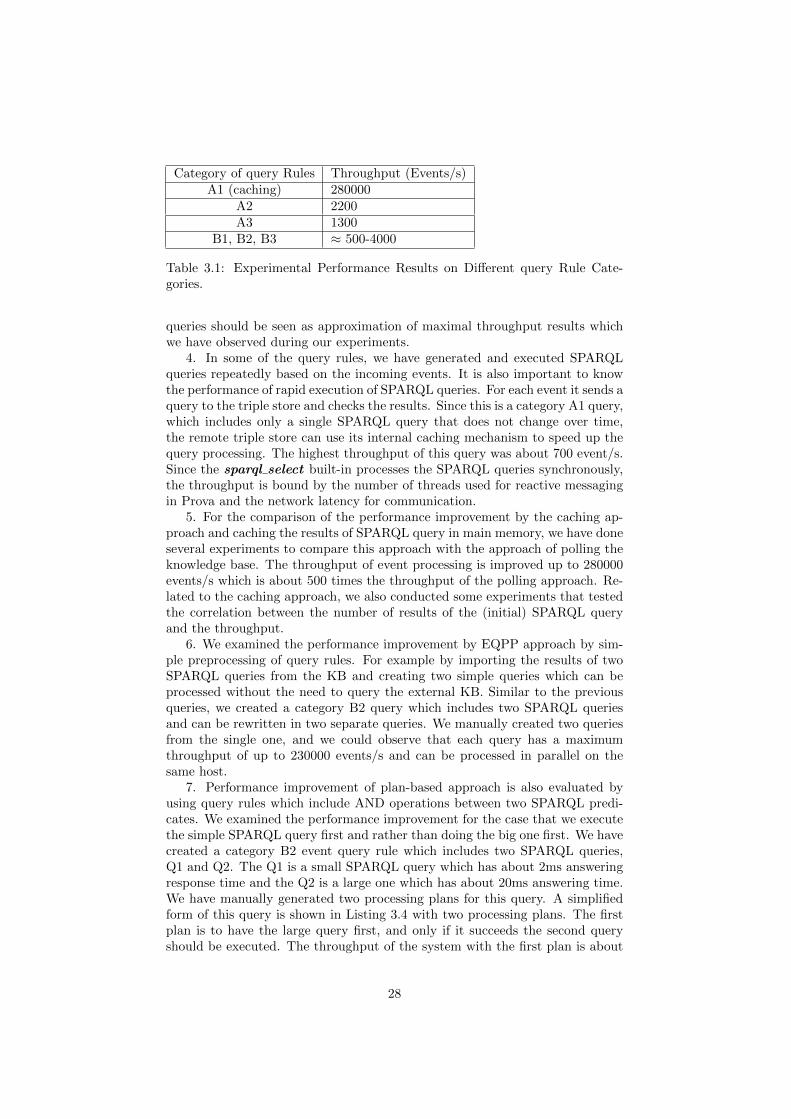
Category of query Rules Throughput (Events/s)A1 (caching) 280000
A2 2200A3 1300
B1, B2, B3 ≈ 500-4000
Table 3.1: Experimental Performance Results on Different query Rule Cate-gories.
queries should be seen as approximation of maximal throughput results whichwe have observed during our experiments.
4. In some of the query rules, we have generated and executed SPARQLqueries repeatedly based on the incoming events. It is also important to knowthe performance of rapid execution of SPARQL queries. For each event it sends aquery to the triple store and checks the results. Since this is a category A1 query,which includes only a single SPARQL query that does not change over time,the remote triple store can use its internal caching mechanism to speed up thequery processing. The highest throughput of this query was about 700 event/s.Since the sparql select built-in processes the SPARQL queries synchronously,the throughput is bound by the number of threads used for reactive messagingin Prova and the network latency for communication.
5. For the comparison of the performance improvement by the caching ap-proach and caching the results of SPARQL query in main memory, we have doneseveral experiments to compare this approach with the approach of polling theknowledge base. The throughput of event processing is improved up to 280000events/s which is about 500 times the throughput of the polling approach. Re-lated to the caching approach, we also conducted some experiments that testedthe correlation between the number of results of the (initial) SPARQL queryand the throughput.
6. We examined the performance improvement by EQPP approach by sim-ple preprocessing of query rules. For example by importing the results of twoSPARQL queries from the KB and creating two simple queries which can beprocessed without the need to query the external KB. Similar to the previousqueries, we created a category B2 query which includes two SPARQL queriesand can be rewritten in two separate queries. We manually created two queriesfrom the single one, and we could observe that each query has a maximumthroughput of up to 230000 events/s and can be processed in parallel on thesame host.
7. Performance improvement of plan-based approach is also evaluated byusing query rules which include AND operations between two SPARQL predi-cates. We examined the performance improvement for the case that we executethe simple SPARQL query first and rather than doing the big one first. We havecreated a category B2 event query rule which includes two SPARQL queries,Q1 and Q2. The Q1 is a small SPARQL query which has about 2ms answeringresponse time and the Q2 is a large one which has about 20ms answering time.We have manually generated two processing plans for this query. A simplifiedform of this query is shown in Listing 3.4 with two processing plans. The firstplan is to have the large query first, and only if it succeeds the second queryshould be executed. The throughput of the system with the first plan is about
28
55 events/sec. In the second plan, we process first the small query, and only ifit succeeds the large query is executed. The throughput of this second plan isup to 600 events/s which is about 10 times more than the first plan. In the casethat we execute both of the queries in parallel, the throughput is much lowerwith only around 47 events/sec.
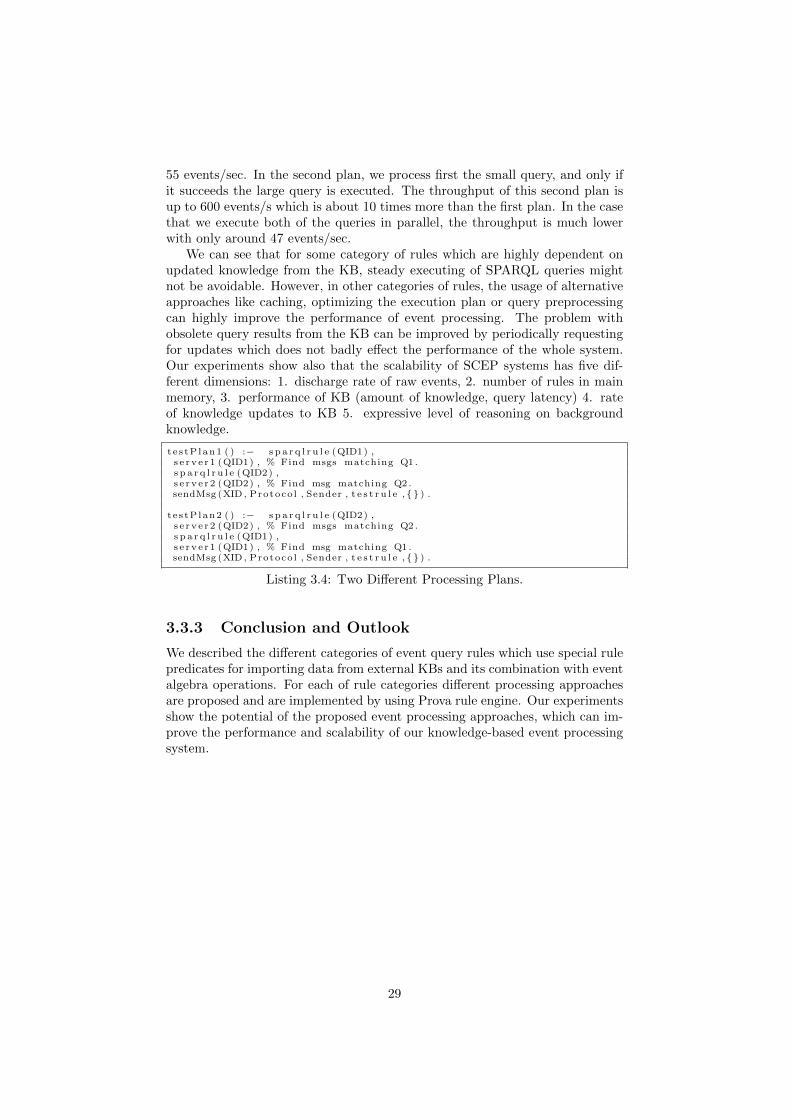
We can see that for some category of rules which are highly dependent onupdated knowledge from the KB, steady executing of SPARQL queries mightnot be avoidable. However, in other categories of rules, the usage of alternativeapproaches like caching, optimizing the execution plan or query preprocessingcan highly improve the performance of event processing. The problem withobsolete query results from the KB can be improved by periodically requestingfor updates which does not badly effect the performance of the whole system.Our experiments show also that the scalability of SCEP systems has five dif-ferent dimensions: 1. discharge rate of raw events, 2. number of rules in mainmemory, 3. performance of KB (amount of knowledge, query latency) 4. rateof knowledge updates to KB 5. expressive level of reasoning on backgroundknowledge.
t e s tP lan1 ( ) :− s p a r q l r u l e (QID1) ,s e rv e r1 (QID1) , % Find msgs matching Q1 .s p a r q l r u l e (QID2) ,s e rv e r2 (QID2) , % Find msg matching Q2 .sendMsg (XID, Protocol , Sender , t e s t r u l e ,{} ) .
t e s tP lan2 ( ) :− s p a r q l r u l e (QID2) ,s e rv e r2 (QID2) , % Find msgs matching Q2 .s p a r q l r u l e (QID1) ,s e rv e r1 (QID1) , % Find msg matching Q1 .sendMsg (XID, Protocol , Sender , t e s t r u l e ,{} ) .
Listing 3.4: Two Different Processing Plans.
3.3.3 Conclusion and Outlook
We described the different categories of event query rules which use special rulepredicates for importing data from external KBs and its combination with eventalgebra operations. For each of rule categories different processing approachesare proposed and are implemented by using Prova rule engine. Our experimentsshow the potential of the proposed event processing approaches, which can im-prove the performance and scalability of our knowledge-based event processingsystem.
29
Chapter 4
Corporate Semantic Search
Following sections give an overview over the implementation and evaluationof concepts developed in the previous phases of the research pillar CorporateSemantic Search. In our research, we first explored the many possibilities ofapplying semantic search approaches to the corporate context theoretically andthen concentrated on few of them in order to accomplish the proof-of-conceptfor our approaches. Most of the methods demonstrated below are the result ofour work under the industrial cooperation.
4.1 Searching Non-Textual Data (AP3)
In the last years we’ve observed an exponential growth of multimedia content onthe World Wide Web. However, non-textual content is one of the last frontiersfor search technologies and at the same time the most challenging one. Searchinginside images or videos has long been deemed impractical due to the processingpower required and the need for new and more efficient algorithms. Nevertheless,not even the latest breakthroughs in artificial intelligence and the computationalresources large companies have at their disposal have yet yielded what we cancall an efficient video search at the web scale. One of the main challengesmultimedia search engines are posed with, is the need to efficiently recognizeobjects in images and video sequences. Machine learning algorithms can achievethis to a certain degree, but fail when a high level of detail is required. Forexample, it is possible to recognize people walking on a street, but it is a lotharder to recognize what jacket or what brand of shoes they wear. Use casessuch as these are especially interesting for companies that look to monetize theadvertising possibilities offered by contextual advertisement placement. In [34]we introduced an system for the annotation and retrieval of multimedia contentthat makes use of Semantic Web technologies such as Ontologies and LinkedData, as well as croudsourcing[19] and machine learning approaches, in orderto overcome some the problems faced by existing multimedia search systems.In the first part of this section, entitled “Video Annotation”, we describe andevaluate our prototypical implementation in regards to the specific use cases ofour corporate partners. In the second part of this section, called “PresentationSlides Annotation”, we present a proof of concept semantic presentation slidegenerator, that we developed in order to test different concepts for manual
30
semantic annotation of multimedia data.
4.1.1 Video Annotation
Video files are traditionally the most complex form of multimedia to process andextract useful information from. In our research project we tried to accomplishthis by levareging crowdsourcing approaches coupled with semantic annotationsand machine learning.
The Annotation System
One of the approaches we used in order to extract information from non-textualfiles is that of manual annotations. Our system allows users to pick an object ofinterest and to annotate it by selecting a tag out of a predefined ontology. Thatontology is either an application, or domain ontology that has been purposelybuilt for a specific annotation task, or a world-view ontology such as DBpedia orFreebase. During our research we have observed two very different annotationscenarios. The first consists of collaborative social annotations, where usersinteract directly with the system and annotate objects based on their interests.Another scenario is represented by automated crowdsourcing systems, such asAmazon Mechanical Turk, where “workers” are paid for annotation tasks. Bothscenarios present unique challenges, however after exploring both approacheswe focus our work on the second scenario since it is the only one that can beeasily be employed by companies, and thereby monetized.
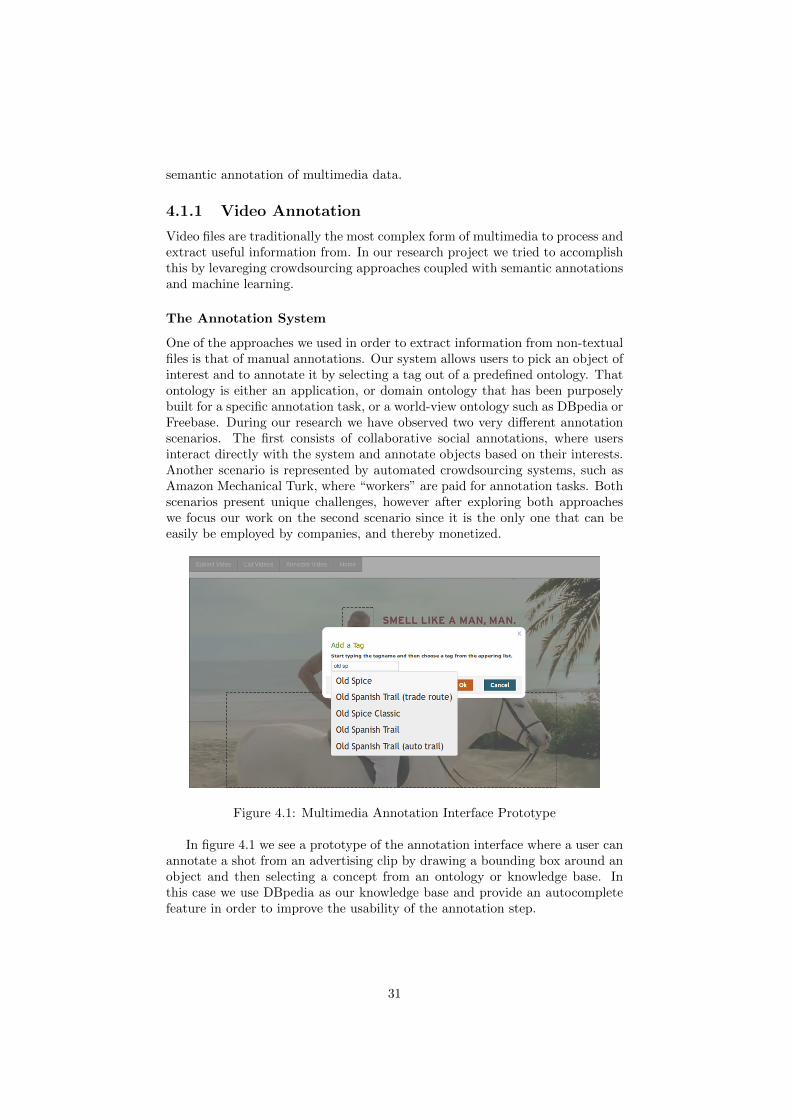
Figure 4.1: Multimedia Annotation Interface Prototype
In figure 4.1 we see a prototype of the annotation interface where a user canannotate a shot from an advertising clip by drawing a bounding box around anobject and then selecting a concept from an ontology or knowledge base. Inthis case we use DBpedia as our knowledge base and provide an autocompletefeature in order to improve the usability of the annotation step.
31
Evaluation
After running our first experiments we came to some noteworthy conclusions:
• The general aspect of the interface is unimportant since it is decided by thegeneral guidelines of the API provider and we have little to no influenceon it. This is a big difference to social annotations where users are askedto annotate images without financial motivation.
• Since the motivations of the users annotating the objects are different, wehad to introduce quality assurance criteria that ensure reliable results inthe annotations.
• Considering the fact that most of the users that create annotations onsuch crowdsourcing systems are from non-English speaking countries orhave poor English skills, we needed to adapt our system in order to belanguage agnostic.
We tried to make our system more language independent by making useof the advantages offered by Linked Data resources like DBpedia. In thesesemantic knowledge bases we can find labels in multiple languages for most ofthe concepts in our ontology. For concepts that do not have a label in thedesired language we used Google Translate 1.
We also observed that for crowdsourced annotations based on API systemssuch as Amazon Mechanical Turk 2 or the evaluation requirements are verydifferent from those of social annotations.
In order to improve the quality of the annotations produced by our system wetried various approaches. [42] presents 3 different aspects to quality assurance:a) Clearly stating the annotation task and making sure the users understand itb) Detection and prevention of cheating attempts and c) Cleaning up errors.
The paper also describes 3 strategies to deal with these problems:
• worker consensus: namely collecting annotations for the same objects frommultiple users, and only validating an annotation when multiple usersagree on one annotation
• worker control: creating a gold standard with pre-annotated images wherethe annotations are known to be of good quality, the workers are thenpresented with some of these images in order to annotate them. If aworker miss-annotated them frequently we can deduce that he is eitherincompetent or cheating
• worker grading: creating a separate grading task where workers grade theannotations of other workers
Experimental resultsWe ran an experiment with where we took a sample of 10 preselected video
clips. Since annotating each frame would inquire a high cost, we used shot detec-tion and face recognition to significantly reduce the number of frames needed tobe annotated. We then submitted a HITs (human intelligence task) to Amazon
1http://translate.google.com/2Amazon Mechanical Turk: https://www.mturk.com/mturk/welcome
32
Mechanical Turk where “workers” were required to annotate the clothing peoplewear. In the annotation process they were limited to a predefined clothing on-tology. Furthermore the workers were required to also specify the material thepeople were wearing. In order to create a gold standard to evaluate our resultswe annotated the images ourselves with the best possible attention to detail.
Figure 4.2: Comparison of Quality Control Approaches
In figure 4.2 we compared the results of our annotation experiment withone of the quality control measures to our gold standard. The worker consen-sus approach yielded the best results even though it increases the cost of theannotations. In this approach 85% of the clothing objects in the videos were an-notated correctly. This higher accuracy was due to the fact that we only acceptan annotation as valid if at least 2 of 3 workers produce the same annotation.If we want or need to to further increase the accuracy we can choose a 4 out of5 approach, or combine this approach with the other 2 approaches. The otherapproaches resulted in lower accuracies and only yielded 63%, respectively 72%accuracy, compared to our gold standard.
The Search System
In order to demonstrate the added benefit of adding semantic annotations toimages and video we build a proptoypical search system. However, we notethat our scope was not to build a better video or image search system but tobuild a crowdsourced annotation tool that would enable companies to bettermonetize multimedia content by optimizing the placement of advertising andcomplementary information.
The system consists of a simple search interface where a user introduce asearch query and is presented with a list of results consisting of multimediafiles related to the search query. In order to offer a semantic search system formultimedia content we make use of the research results developed in a previouswork package 3 . In contrast to keywords based systems, our system worksby matching the search query to the semantic annotations and performing asemantic search as described in the Museumsportal Use Case.
3http://www.corporate-semantic-web.de/applications-and-use-cases/articles/
museumsportal-berlin.html
33
Evaluation
Since multimedia content is inherently different from textual content and usersreact different to it we needed to perform a new evaluation, separate but buildingupon the evaluation of the previous semantic search work packages.Evaluatingsemantic search approaches, and search engines in general is a complex task dueto the fact that it is prone to subjectivity.
The approach we took in order to evaluate our system to traditional keywordbased systems is to do a side-by-side comparison similar to the “Bing It On”challenge that Microsoft used to compare the Bing.com search engine to Google4.For our evaluation we generated a test dataset composed of 10 videos of fashionshows. We the proceeded to split the dataset in 2 different sets containing all the10 videos but differing in the amount of annotation information for each video.One dataset consisted of videos annotated only with the video metadata andtextual descriptions of the videos, and the other one included that informationand added scene-level semantic annotations. We then proceeded to implemented2 search systems, a traditional keyword based search engine that uses the firstdata set and the semantic search engine we described previously. For our testgroup we selected 15 people and asked them to perform various queries forclothing items such as “red jacket” or “blue jeans”. The searches results werepresented simultaneously on both systems, with identical interfaces and a sideby side display.
At the end of the users interaction with the search systems, after they havetried out various queries which they found interesting, the users were askedwhich search engine they preferred and why. Out of 15 users 12 preferred thesemantic approach. In discussions with the users we found out that they likedthe fact that they could find results at a scene or shot level in addition to variousgeneral benefits of semantic search such as resolving synonyms, homonyms,aliases, misspellings and performing query expansion. What we found out wheninterrogating the users that preferred the keyword based approach was that theydisliked the fact that one system presented more results than the other. Thisis due to the fact that the semantic annotation approach presents more resultsdue to the different scenes contained in a single video and the users just wantedto watch the entire video.
4.1.2 Presentation Slides Annotation
One of the byproducts of a corporate environment consists in a large amount ofdata that is stored in complex and/or proprietary file formats. This informationcan be valuable for companies but is hard to index and process for search enginesand internal document management systems. Furthermore, these presentationsoften contain other multimedia filetypes such as photographs, charts, sound orvideo files. These embedded multimedia files are almost impossible to find onceplaced into a presentation since in most cases there is no associated metadata.
In order to address these problems and create a presentation slide systemthat would allow companies to efficiently index and reuse the information storedin presentation slides.[22]
4http://www.bing.com/blogs/site_blogs/b/search/archive/2012/09/06/
challenge-announce.aspx
34
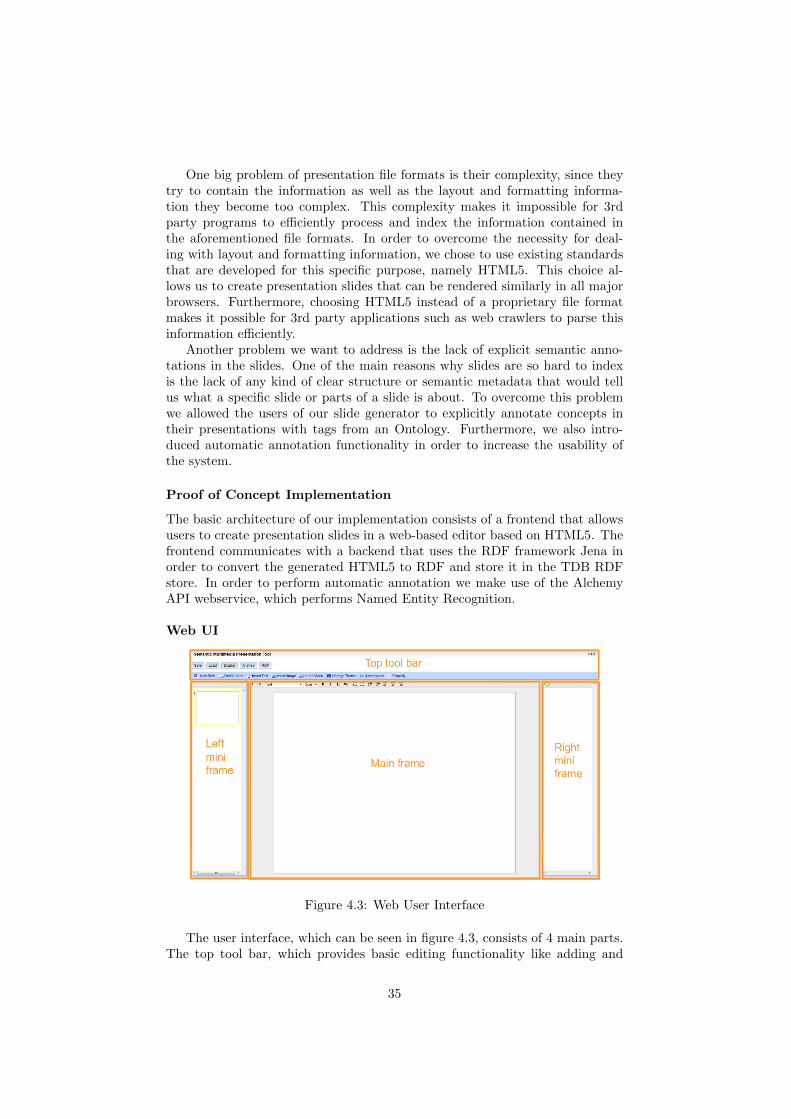
One big problem of presentation file formats is their complexity, since theytry to contain the information as well as the layout and formatting informa-tion they become too complex. This complexity makes it impossible for 3rdparty programs to efficiently process and index the information contained inthe aforementioned file formats. In order to overcome the necessity for deal-ing with layout and formatting information, we chose to use existing standardsthat are developed for this specific purpose, namely HTML5. This choice al-lows us to create presentation slides that can be rendered similarly in all majorbrowsers. Furthermore, choosing HTML5 instead of a proprietary file formatmakes it possible for 3rd party applications such as web crawlers to parse thisinformation efficiently.
Another problem we want to address is the lack of explicit semantic anno-tations in the slides. One of the main reasons why slides are so hard to indexis the lack of any kind of clear structure or semantic metadata that would tellus what a specific slide or parts of a slide is about. To overcome this problemwe allowed the users of our slide generator to explicitly annotate concepts intheir presentations with tags from an Ontology. Furthermore, we also intro-duced automatic annotation functionality in order to increase the usability ofthe system.
Proof of Concept Implementation
The basic architecture of our implementation consists of a frontend that allowsusers to create presentation slides in a web-based editor based on HTML5. Thefrontend communicates with a backend that uses the RDF framework Jena inorder to convert the generated HTML5 to RDF and store it in the TDB RDFstore. In order to perform automatic annotation we make use of the AlchemyAPI webservice, which performs Named Entity Recognition.
Web UI
Figure 4.3: Web User Interface
The user interface, which can be seen in figure 4.3, consists of 4 main parts.The top tool bar, which provides basic editing functionality like adding and
35
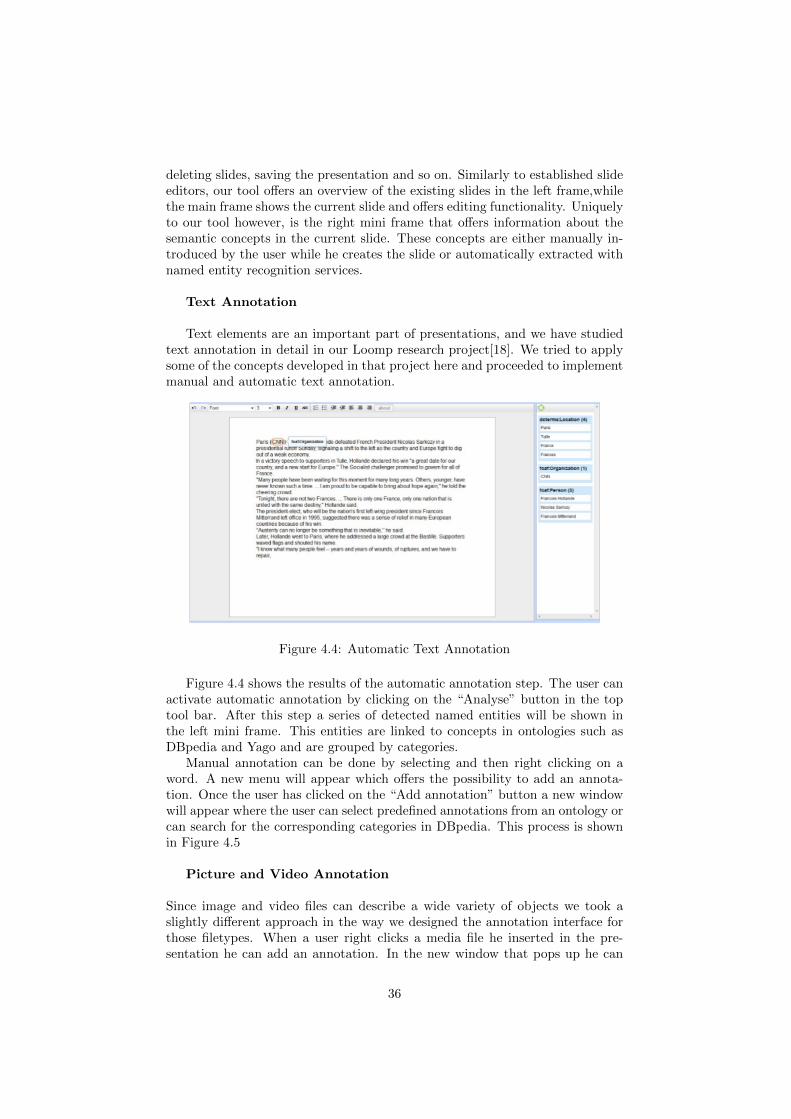
deleting slides, saving the presentation and so on. Similarly to established slideeditors, our tool offers an overview of the existing slides in the left frame,whilethe main frame shows the current slide and offers editing functionality. Uniquelyto our tool however, is the right mini frame that offers information about thesemantic concepts in the current slide. These concepts are either manually in-troduced by the user while he creates the slide or automatically extracted withnamed entity recognition services.
Text Annotation
Text elements are an important part of presentations, and we have studiedtext annotation in detail in our Loomp research project[18]. We tried to applysome of the concepts developed in that project here and proceeded to implementmanual and automatic text annotation.
Figure 4.4: Automatic Text Annotation
Figure 4.4 shows the results of the automatic annotation step. The user canactivate automatic annotation by clicking on the “Analyse” button in the toptool bar. After this step a series of detected named entities will be shown inthe left mini frame. This entities are linked to concepts in ontologies such asDBpedia and Yago and are grouped by categories.
Manual annotation can be done by selecting and then right clicking on aword. A new menu will appear which offers the possibility to add an annota-tion. Once the user has clicked on the “Add annotation” button a new windowwill appear where the user can select predefined annotations from an ontology orcan search for the corresponding categories in DBpedia. This process is shownin Figure 4.5
Picture and Video Annotation
Since image and video files can describe a wide variety of objects we took aslightly different approach in the way we designed the annotation interface forthose filetypes. When a user right clicks a media file he inserted in the pre-sentation he can add an annotation. In the new window that pops up he can
36
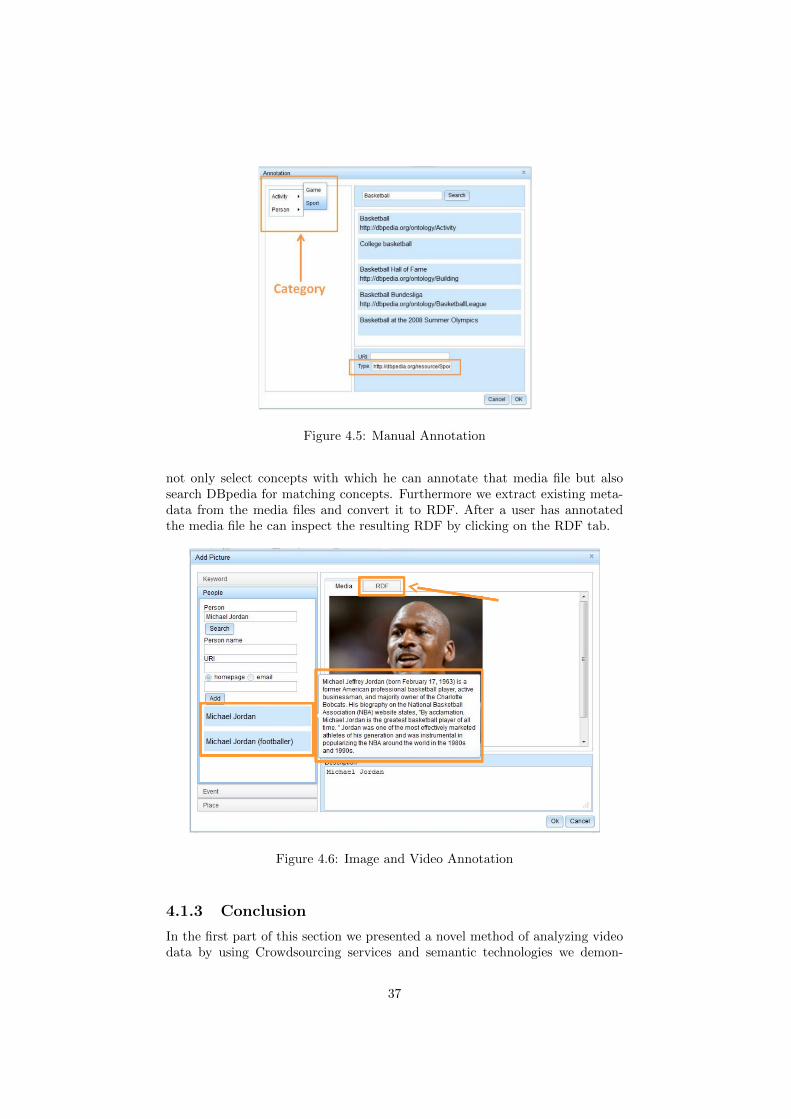
Figure 4.5: Manual Annotation
not only select concepts with which he can annotate that media file but alsosearch DBpedia for matching concepts. Furthermore we extract existing meta-data from the media files and convert it to RDF. After a user has annotatedthe media file he can inspect the resulting RDF by clicking on the RDF tab.
Figure 4.6: Image and Video Annotation
4.1.3 Conclusion
In the first part of this section we presented a novel method of analyzing videodata by using Crowdsourcing services and semantic technologies we demon-
37
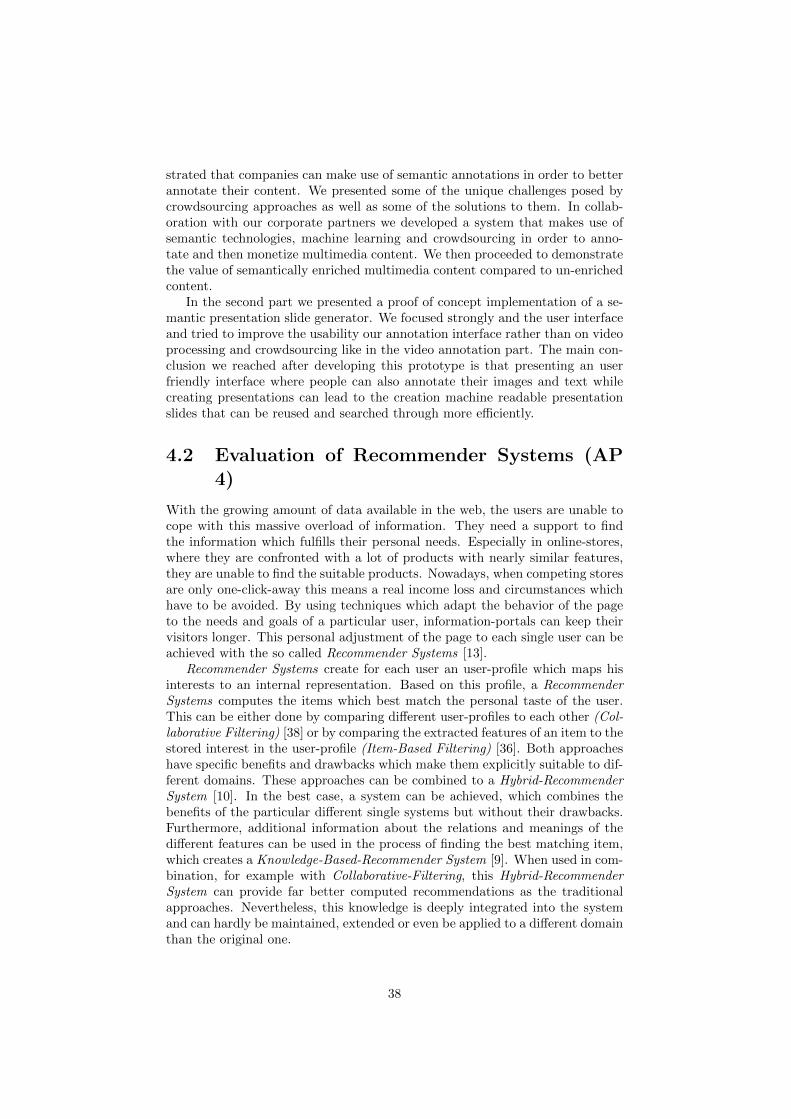
strated that companies can make use of semantic annotations in order to betterannotate their content. We presented some of the unique challenges posed bycrowdsourcing approaches as well as some of the solutions to them. In collab-oration with our corporate partners we developed a system that makes use ofsemantic technologies, machine learning and crowdsourcing in order to anno-tate and then monetize multimedia content. We then proceeded to demonstratethe value of semantically enriched multimedia content compared to un-enrichedcontent.
In the second part we presented a proof of concept implementation of a se-mantic presentation slide generator. We focused strongly and the user interfaceand tried to improve the usability our annotation interface rather than on videoprocessing and crowdsourcing like in the video annotation part. The main con-clusion we reached after developing this prototype is that presenting an userfriendly interface where people can also annotate their images and text whilecreating presentations can lead to the creation machine readable presentationslides that can be reused and searched through more efficiently.
4.2 Evaluation of Recommender Systems (AP4)
With the growing amount of data available in the web, the users are unable tocope with this massive overload of information. They need a support to findthe information which fulfills their personal needs. Especially in online-stores,where they are confronted with a lot of products with nearly similar features,they are unable to find the suitable products. Nowadays, when competing storesare only one-click-away this means a real income loss and circumstances whichhave to be avoided. By using techniques which adapt the behavior of the pageto the needs and goals of a particular user, information-portals can keep theirvisitors longer. This personal adjustment of the page to each single user can beachieved with the so called Recommender Systems [13].
Recommender Systems create for each user an user-profile which maps hisinterests to an internal representation. Based on this profile, a RecommenderSystems computes the items which best match the personal taste of the user.This can be either done by comparing different user-profiles to each other (Col-laborative Filtering) [38] or by comparing the extracted features of an item to thestored interest in the user-profile (Item-Based Filtering) [36]. Both approacheshave specific benefits and drawbacks which make them explicitly suitable to dif-ferent domains. These approaches can be combined to a Hybrid-RecommenderSystem [10]. In the best case, a system can be achieved, which combines thebenefits of the particular different single systems but without their drawbacks.Furthermore, additional information about the relations and meanings of thedifferent features can be used in the process of finding the best matching item,which creates a Knowledge-Based-Recommender System [9]. When used in com-bination, for example with Collaborative-Filtering, this Hybrid-RecommenderSystem can provide far better computed recommendations as the traditionalapproaches. Nevertheless, this knowledge is deeply integrated into the systemand can hardly be maintained, extended or even be applied to a different domainthan the original one.
38
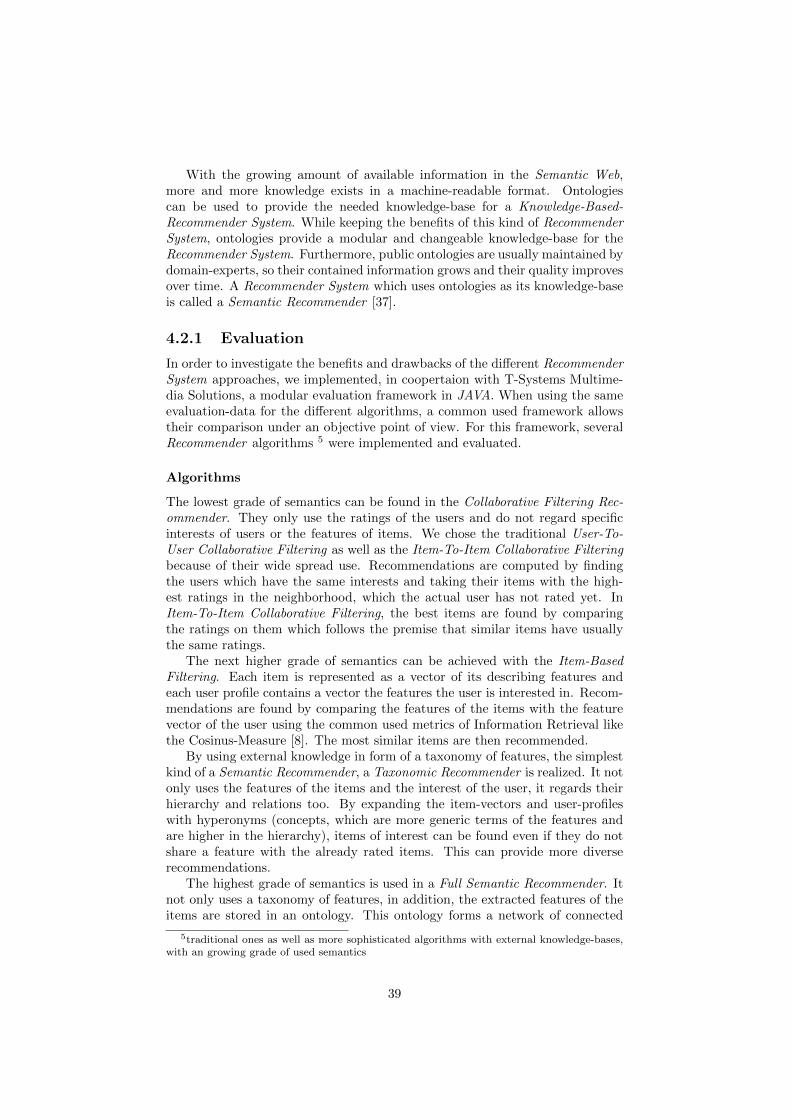
With the growing amount of available information in the Semantic Web,more and more knowledge exists in a machine-readable format. Ontologiescan be used to provide the needed knowledge-base for a Knowledge-Based-Recommender System. While keeping the benefits of this kind of RecommenderSystem, ontologies provide a modular and changeable knowledge-base for theRecommender System. Furthermore, public ontologies are usually maintained bydomain-experts, so their contained information grows and their quality improvesover time. A Recommender System which uses ontologies as its knowledge-baseis called a Semantic Recommender [37].
4.2.1 Evaluation
In order to investigate the benefits and drawbacks of the different RecommenderSystem approaches, we implemented, in coopertaion with T-Systems Multime-dia Solutions, a modular evaluation framework in JAVA. When using the sameevaluation-data for the different algorithms, a common used framework allowstheir comparison under an objective point of view. For this framework, severalRecommender algorithms 5 were implemented and evaluated.
Algorithms
The lowest grade of semantics can be found in the Collaborative Filtering Rec-ommender. They only use the ratings of the users and do not regard specificinterests of users or the features of items. We chose the traditional User-To-User Collaborative Filtering as well as the Item-To-Item Collaborative Filteringbecause of their wide spread use. Recommendations are computed by findingthe users which have the same interests and taking their items with the high-est ratings in the neighborhood, which the actual user has not rated yet. InItem-To-Item Collaborative Filtering, the best items are found by comparingthe ratings on them which follows the premise that similar items have usuallythe same ratings.
The next higher grade of semantics can be achieved with the Item-BasedFiltering. Each item is represented as a vector of its describing features andeach user profile contains a vector the features the user is interested in. Recom-mendations are found by comparing the features of the items with the featurevector of the user using the common used metrics of Information Retrieval likethe Cosinus-Measure [8]. The most similar items are then recommended.
By using external knowledge in form of a taxonomy of features, the simplestkind of a Semantic Recommender, a Taxonomic Recommender is realized. It notonly uses the features of the items and the interest of the user, it regards theirhierarchy and relations too. By expanding the item-vectors and user-profileswith hyperonyms (concepts, which are more generic terms of the features andare higher in the hierarchy), items of interest can be found even if they do notshare a feature with the already rated items. This can provide more diverserecommendations.
The highest grade of semantics is used in a Full Semantic Recommender. Itnot only uses a taxonomy of features, in addition, the extracted features of theitems are stored in an ontology. This ontology forms a network of connected
5traditional ones as well as more sophisticated algorithms with external knowledge-bases,with an growing grade of used semantics
39
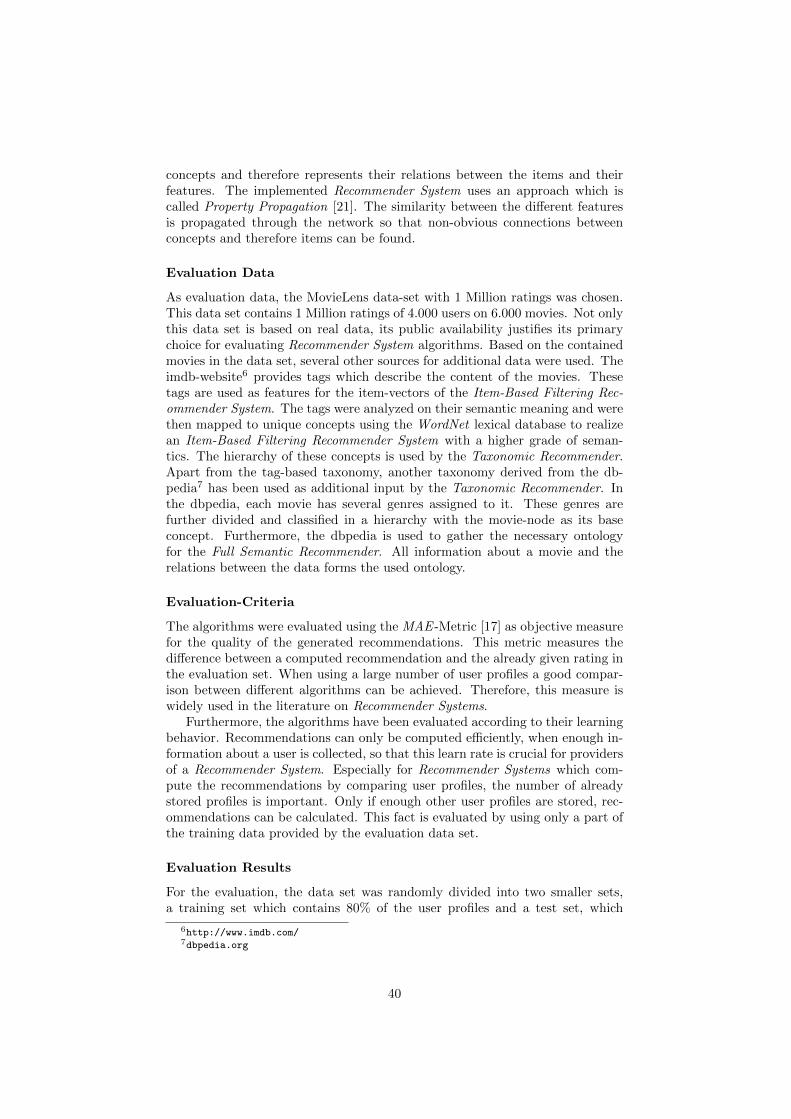
concepts and therefore represents their relations between the items and theirfeatures. The implemented Recommender System uses an approach which iscalled Property Propagation [21]. The similarity between the different featuresis propagated through the network so that non-obvious connections betweenconcepts and therefore items can be found.
Evaluation Data
As evaluation data, the MovieLens data-set with 1 Million ratings was chosen.This data set contains 1 Million ratings of 4.000 users on 6.000 movies. Not onlythis data set is based on real data, its public availability justifies its primarychoice for evaluating Recommender System algorithms. Based on the containedmovies in the data set, several other sources for additional data were used. Theimdb-website6 provides tags which describe the content of the movies. Thesetags are used as features for the item-vectors of the Item-Based Filtering Rec-ommender System. The tags were analyzed on their semantic meaning and werethen mapped to unique concepts using the WordNet lexical database to realizean Item-Based Filtering Recommender System with a higher grade of seman-tics. The hierarchy of these concepts is used by the Taxonomic Recommender.Apart from the tag-based taxonomy, another taxonomy derived from the db-pedia7 has been used as additional input by the Taxonomic Recommender. Inthe dbpedia, each movie has several genres assigned to it. These genres arefurther divided and classified in a hierarchy with the movie-node as its baseconcept. Furthermore, the dbpedia is used to gather the necessary ontologyfor the Full Semantic Recommender. All information about a movie and therelations between the data forms the used ontology.
Evaluation-Criteria
The algorithms were evaluated using the MAE -Metric [17] as objective measurefor the quality of the generated recommendations. This metric measures thedifference between a computed recommendation and the already given rating inthe evaluation set. When using a large number of user profiles a good compar-ison between different algorithms can be achieved. Therefore, this measure iswidely used in the literature on Recommender Systems.
Furthermore, the algorithms have been evaluated according to their learningbehavior. Recommendations can only be computed efficiently, when enough in-formation about a user is collected, so that this learn rate is crucial for providersof a Recommender System. Especially for Recommender Systems which com-pute the recommendations by comparing user profiles, the number of alreadystored profiles is important. Only if enough other user profiles are stored, rec-ommendations can be calculated. This fact is evaluated by using only a part ofthe training data provided by the evaluation data set.
Evaluation Results
For the evaluation, the data set was randomly divided into two smaller sets,a training set which contains 80% of the user profiles and a test set, which
6http://www.imdb.com/7dbpedia.org
40
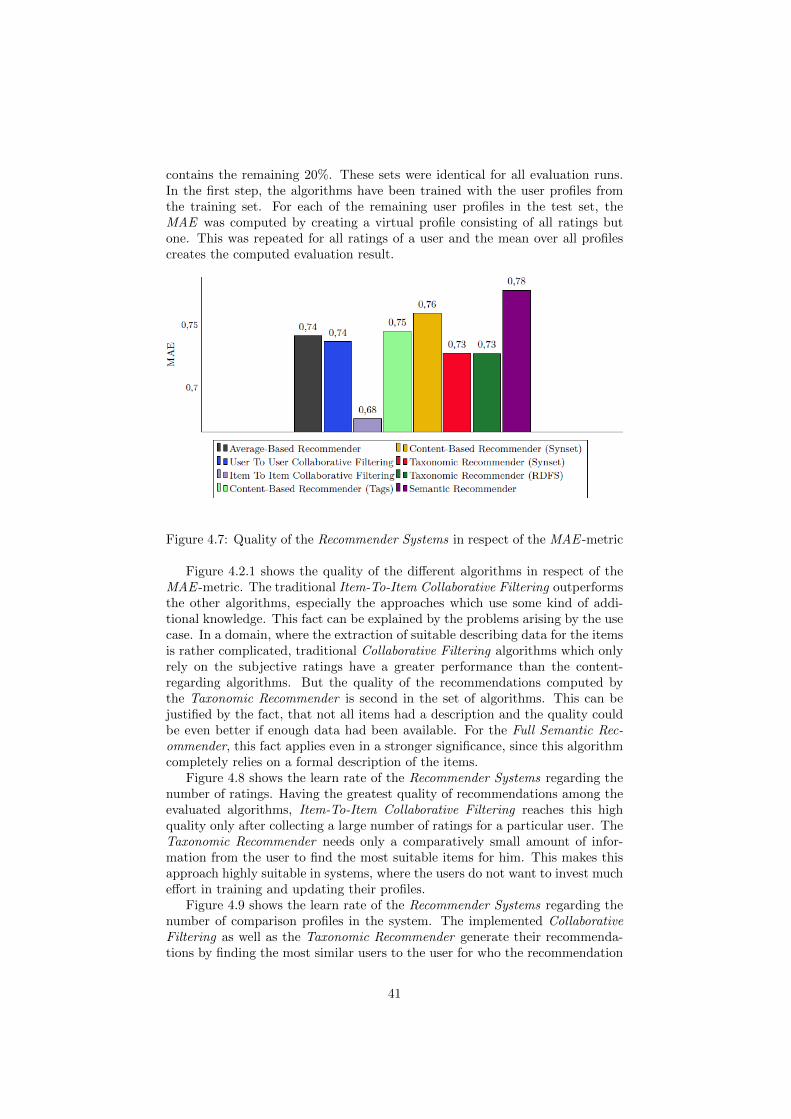
contains the remaining 20%. These sets were identical for all evaluation runs.In the first step, the algorithms have been trained with the user profiles fromthe training set. For each of the remaining user profiles in the test set, theMAE was computed by creating a virtual profile consisting of all ratings butone. This was repeated for all ratings of a user and the mean over all profilescreates the computed evaluation result.
Figure 4.7: Quality of the Recommender Systems in respect of the MAE -metric
Figure 4.2.1 shows the quality of the different algorithms in respect of theMAE -metric. The traditional Item-To-Item Collaborative Filtering outperformsthe other algorithms, especially the approaches which use some kind of addi-tional knowledge. This fact can be explained by the problems arising by the usecase. In a domain, where the extraction of suitable describing data for the itemsis rather complicated, traditional Collaborative Filtering algorithms which onlyrely on the subjective ratings have a greater performance than the content-regarding algorithms. But the quality of the recommendations computed bythe Taxonomic Recommender is second in the set of algorithms. This can bejustified by the fact, that not all items had a description and the quality couldbe even better if enough data had been available. For the Full Semantic Rec-ommender, this fact applies even in a stronger significance, since this algorithmcompletely relies on a formal description of the items.
Figure 4.8 shows the learn rate of the Recommender Systems regarding thenumber of ratings. Having the greatest quality of recommendations among theevaluated algorithms, Item-To-Item Collaborative Filtering reaches this highquality only after collecting a large number of ratings for a particular user. TheTaxonomic Recommender needs only a comparatively small amount of infor-mation from the user to find the most suitable items for him. This makes thisapproach highly suitable in systems, where the users do not want to invest mucheffort in training and updating their profiles.
Figure 4.9 shows the learn rate of the Recommender Systems regarding thenumber of comparison profiles in the system. The implemented CollaborativeFiltering as well as the Taxonomic Recommender generate their recommenda-tions by finding the most similar users to the user for who the recommendation
41
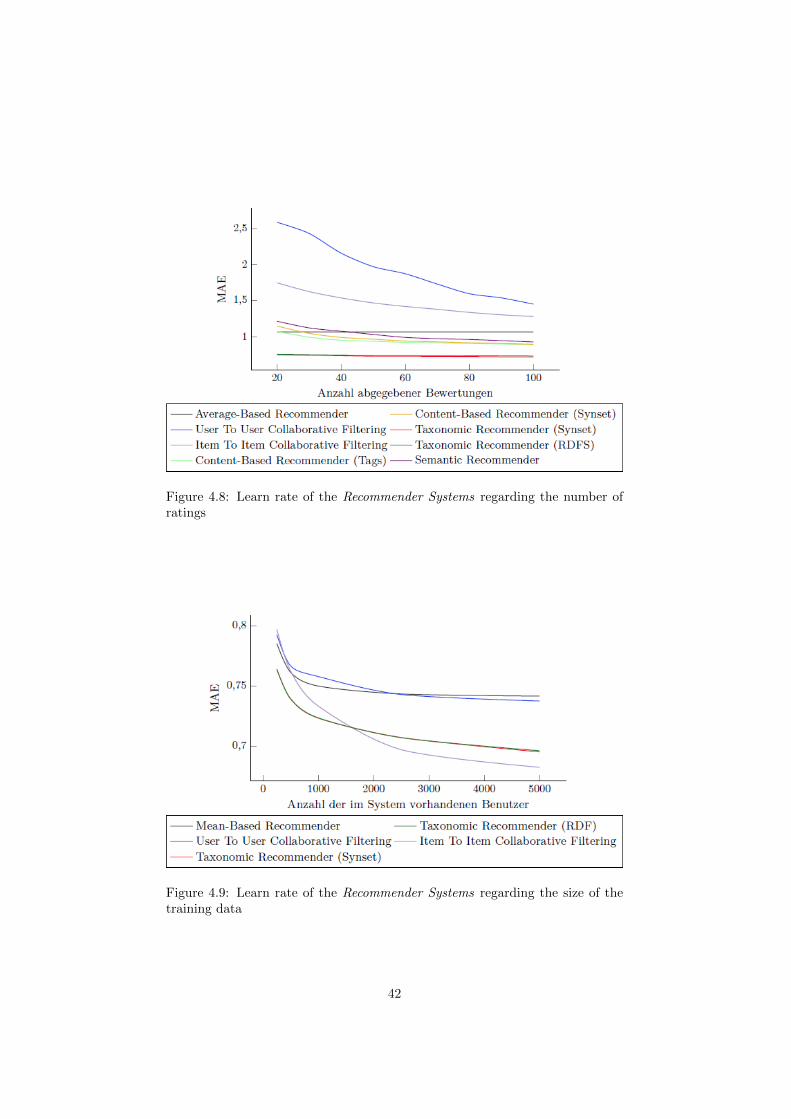
Figure 4.8: Learn rate of the Recommender Systems regarding the number ofratings
Figure 4.9: Learn rate of the Recommender Systems regarding the size of thetraining data
42
should be calculated for. Therefore, they need a certain amount of alreadystored user profiles to find matching other profiles. The Taxonomic Recom-mender outperform the other algorithms because they need a smaller numberof stored profiles then the traditional Collaborative Filtering. Because of the pro-file expansion, they can find relations between the profiles even if the differentusers have no common rated items. Nevertheless, the Item-To-Item Collabora-tive Filtering generates recommendation of a higher quality, once enough datais stored in the system.
4.2.2 Conclusion
Especially the Taxonomic Recommender shows an overall better performancethan the traditional approaches. Even if the Item-To-Item Collaborative Fil-tering generates recommendations of a higher overall quality according to theused evaluation-metric, the Taxonomic Recommender outperforms the tradi-tional Recommender Systems in other areas, especially in its learning behavior.It needs less data, to provide recommendations with a good quality. The evalu-ated Taxonomic Recommender could not show its full potential since it workedonly on a partial data set. The same problem had the Full Semantic Rec-ommender, but even in a higher grade, since his behavior fully depends on aformal representation of the domain. If data for all items had been available,even better results can be expected.
Many items in online-stores are classified in taxonomies and today, thesestores use more and more semantic technologies to describe their items. Withthe growing amount of publicly available data in a formal representation format,the Semantic Recommender Systems could be the next step in the evolutionof Recommender Systems. They overcome several restrictions of traditionalapproaches and with the additional knowledge they use, they can provide betterrecommendations.
4.3 Integrated Personalized Views (AP 14)
On top of the syntactic (XML, relational, unstructured) and semantic (RDF,RDFS,OWL) data/knowledge layer, rules play an important role to automatically andcontextually transform data and integrate existing knowledge in order to de-rive new conclusions and decisions. [26] Rules provide a powerful and declara-tive way to represent and control the manifold personalized views on corporateknowledge. Semantic agents can exploit rules to represent their decisions onhow to use knowledge in a particular personalized view. These views definethe agent’s purposes or goals such as active selection and negotiation aboutrelevant (semantic) meanings, achievement of tasks, and internal and externalreactions on occurred events, changing conditions or new contexts. This extendsthe Corporate Semantic Web to a rule-based Pragmatic Web 8 [52] which putsthe independent corporate ontologies and domain-specific data of a personalizedview into a pragmatic context, such as collaborative situations, organizationalnorms, purposes or individual goals and values. In this section we will furtherdescribe this agent-based approach for personalized views which integrate corpo-
8http://www.pragmaticweb.info/
43
rate data and knowledge by rule technologies and which makes use of corporate(context) ontologies managed in distributed Maven repositories.
4.3.1 OntoMaven - Distributed Maven-based Ontology ProjectManagement
OntoMaven is a set of Maven plug-ins supporting the management and engineer-ing of ontologies from distributed (Maven) ontology repositories. OntoMavenextends the Apache Maven tool and adapts it for distributed ontology engineer-ing and ontology-based software engineering.
OntoMaven dynamically downloads ontologies and plug-ins for ontology en-gineering from distributed OntoMaven repositories and stores them in a localcache. OntoMaven repositories are extensions of Maven repositories with ontol-ogy version and maintenance metadata. Via plug-ins for search and transforma-tion it can also use ontology search engine interfaces and APIs (such as OMGODM, OMG API4KB, web search engines such as SWOOGLE) to publicly ac-cessible ontology repositories and distributed KBs (given appropriate semantictransformations and interoperations are defined in the search and transforma-tion tasks).
It extents an OntoMaven POM file to describe the ontology project beingbuilt, its dependencies on other external modules and components, the buildorder, directories, and required plug-ins. It comes with pre-defined targets forperforming certain well-defined tasks such as:
• Versioning
• Dependency Management for (distributed) Ontologies
• Ontology Documentation
• Testing
• IDEs/APIs tasks for download, transformation-integration/import-compilation,installation and deployment as e.g. ontology service or ontology API
OntoMaven is built using Mavenas plugin-based architecture that allows itto make use of any application controllable through standard input. Therefore itencapsulates several of the CSW technologies, such as SVont, Concept Groupingfor Documentation, Semantic Matchmaking, together with other APIs and IDEfunctionalties into Mojo PlugIns, such as the SVoNT ontology versioning, theontology modularization algorithms and concept grouping functionalities in theontology documentation.
As described in Technical Report TR-B-12-04 [34] an ontological model forrepresenting context information consists of several different vertical and hor-izontal layers of modular ontologies from top level to domain, task, and ap-plication ontologies. OntoMaven supports the management, maintenance, in-tegration and deployment of such modular context ontologies from distributed(extended) Maven ontology repositories.
44
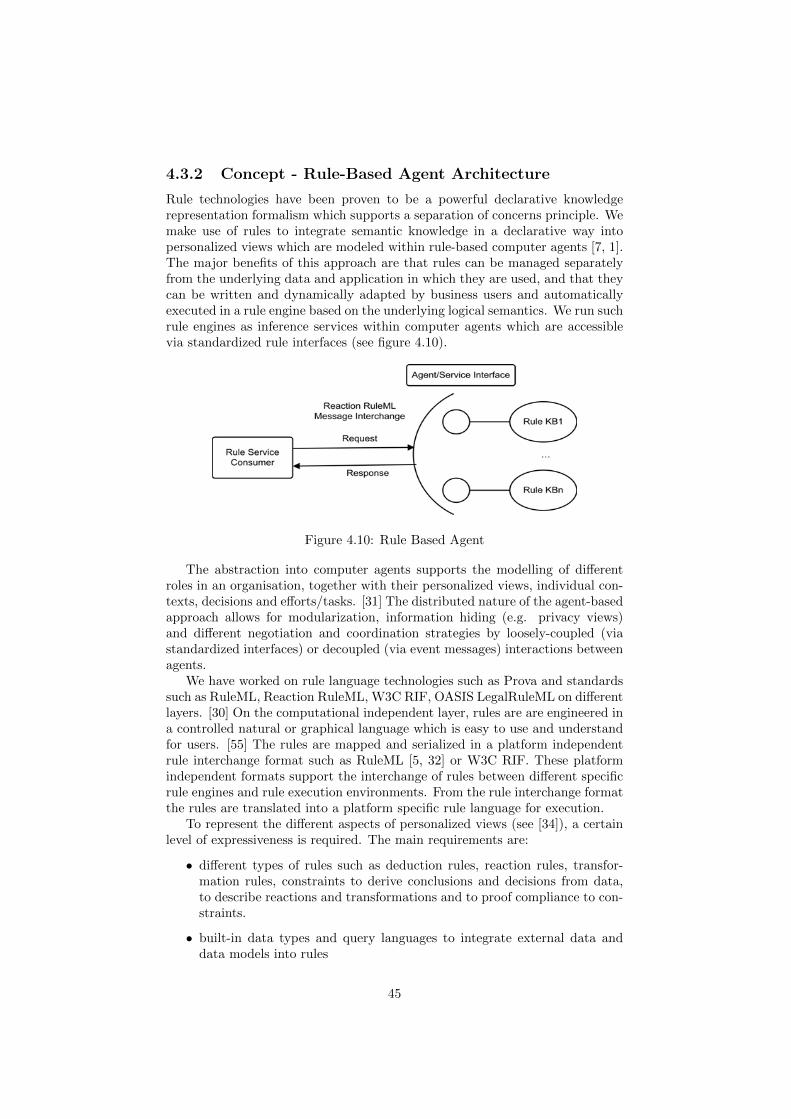
4.3.2 Concept - Rule-Based Agent Architecture
Rule technologies have been proven to be a powerful declarative knowledgerepresentation formalism which supports a separation of concerns principle. Wemake use of rules to integrate semantic knowledge in a declarative way intopersonalized views which are modeled within rule-based computer agents [7, 1].The major benefits of this approach are that rules can be managed separatelyfrom the underlying data and application in which they are used, and that theycan be written and dynamically adapted by business users and automaticallyexecuted in a rule engine based on the underlying logical semantics. We run suchrule engines as inference services within computer agents which are accessiblevia standardized rule interfaces (see figure 4.10).
Figure 4.10: Rule Based Agent
The abstraction into computer agents supports the modelling of differentroles in an organisation, together with their personalized views, individual con-texts, decisions and efforts/tasks. [31] The distributed nature of the agent-basedapproach allows for modularization, information hiding (e.g. privacy views)and different negotiation and coordination strategies by loosely-coupled (viastandardized interfaces) or decoupled (via event messages) interactions betweenagents.
We have worked on rule language technologies such as Prova and standardssuch as RuleML, Reaction RuleML, W3C RIF, OASIS LegalRuleML on differentlayers. [30] On the computational independent layer, rules are are engineered ina controlled natural or graphical language which is easy to use and understandfor users. [55] The rules are mapped and serialized in a platform independentrule interchange format such as RuleML [5, 32] or W3C RIF. These platformindependent formats support the interchange of rules between different specificrule engines and rule execution environments. From the rule interchange formatthe rules are translated into a platform specific rule language for execution.
To represent the different aspects of personalized views (see [34]), a certainlevel of expressiveness is required. The main requirements are:
• different types of rules such as deduction rules, reaction rules, transfor-mation rules, constraints to derive conclusions and decisions from data,to describe reactions and transformations and to proof compliance to con-straints.
• built-in data types and query languages to integrate external data anddata models into rules
45
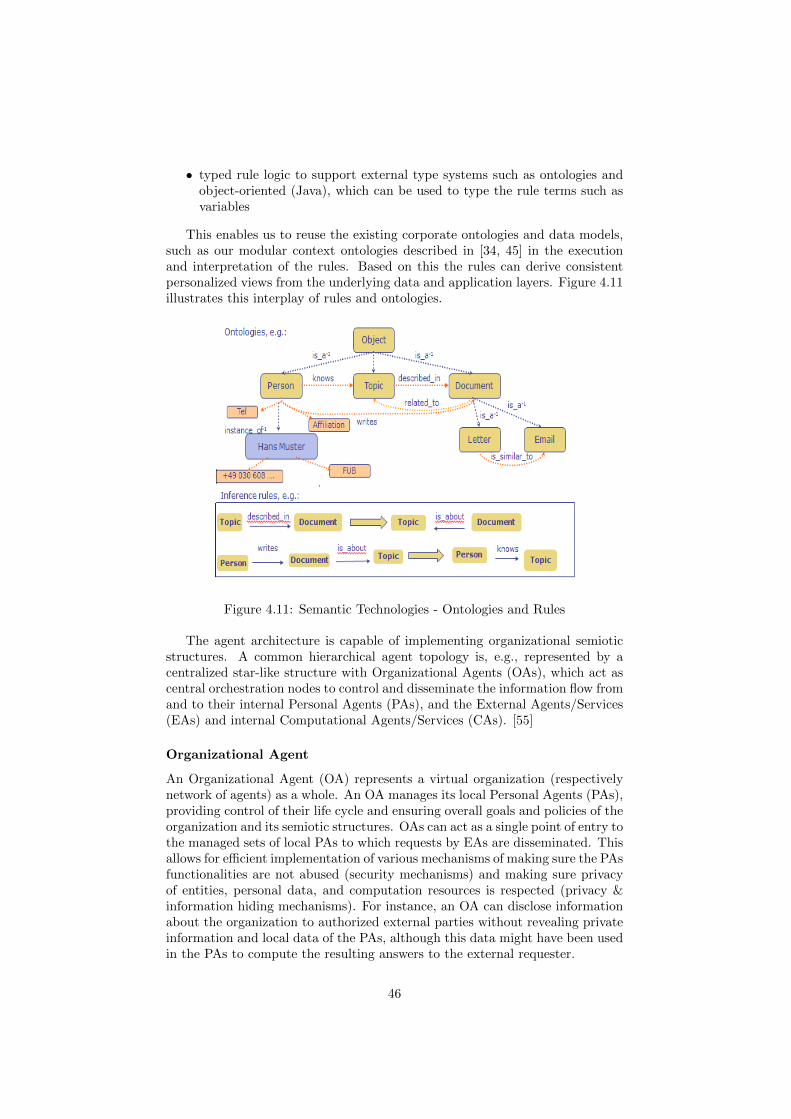
• typed rule logic to support external type systems such as ontologies andobject-oriented (Java), which can be used to type the rule terms such asvariables
This enables us to reuse the existing corporate ontologies and data models,such as our modular context ontologies described in [34, 45] in the executionand interpretation of the rules. Based on this the rules can derive consistentpersonalized views from the underlying data and application layers. Figure 4.11illustrates this interplay of rules and ontologies.
Figure 4.11: Semantic Technologies - Ontologies and Rules
The agent architecture is capable of implementing organizational semioticstructures. A common hierarchical agent topology is, e.g., represented by acentralized star-like structure with Organizational Agents (OAs), which act ascentral orchestration nodes to control and disseminate the information flow fromand to their internal Personal Agents (PAs), and the External Agents/Services(EAs) and internal Computational Agents/Services (CAs). [55]
Organizational Agent
An Organizational Agent (OA) represents a virtual organization (respectivelynetwork of agents) as a whole. An OA manages its local Personal Agents (PAs),providing control of their life cycle and ensuring overall goals and policies of theorganization and its semiotic structures. OAs can act as a single point of entry tothe managed sets of local PAs to which requests by EAs are disseminated. Thisallows for efficient implementation of various mechanisms of making sure the PAsfunctionalities are not abused (security mechanisms) and making sure privacyof entities, personal data, and computation resources is respected (privacy &information hiding mechanisms). For instance, an OA can disclose informationabout the organization to authorized external parties without revealing privateinformation and local data of the PAs, although this data might have been usedin the PAs to compute the resulting answers to the external requester.
46
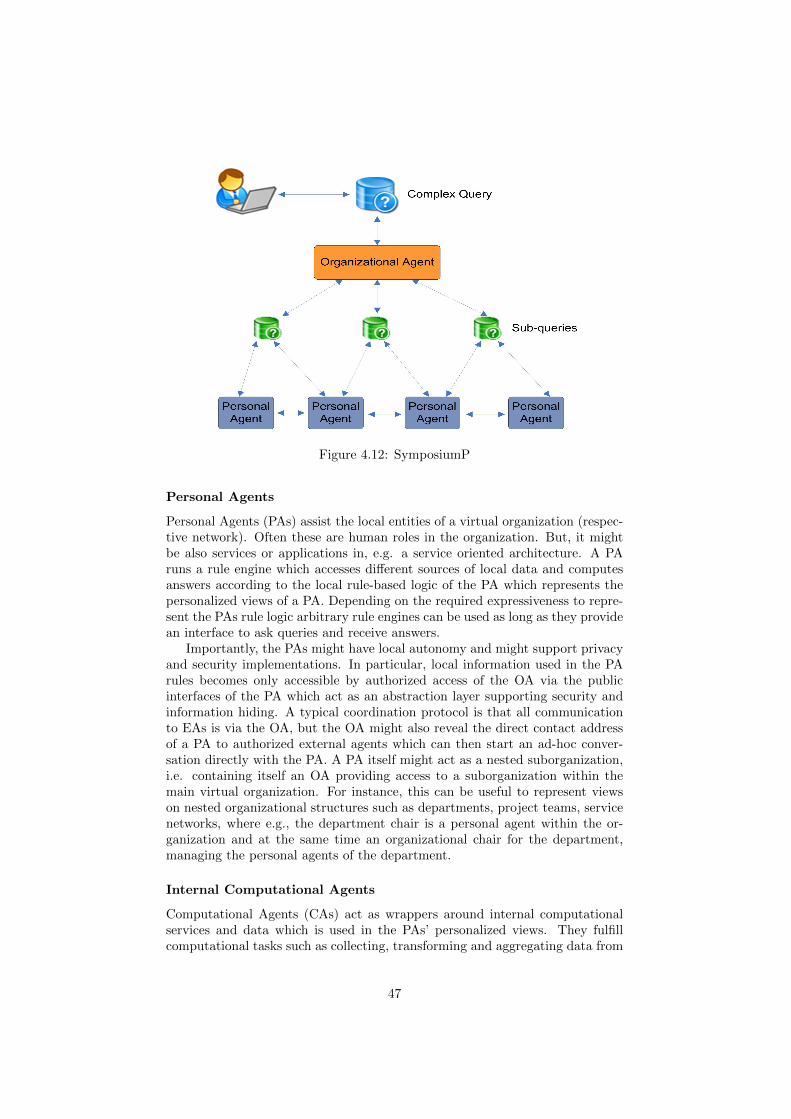
Figure 4.12: SymposiumP
Personal Agents
Personal Agents (PAs) assist the local entities of a virtual organization (respec-tive network). Often these are human roles in the organization. But, it mightbe also services or applications in, e.g. a service oriented architecture. A PAruns a rule engine which accesses different sources of local data and computesanswers according to the local rule-based logic of the PA which represents thepersonalized views of a PA. Depending on the required expressiveness to repre-sent the PAs rule logic arbitrary rule engines can be used as long as they providean interface to ask queries and receive answers.
Importantly, the PAs might have local autonomy and might support privacyand security implementations. In particular, local information used in the PArules becomes only accessible by authorized access of the OA via the publicinterfaces of the PA which act as an abstraction layer supporting security andinformation hiding. A typical coordination protocol is that all communicationto EAs is via the OA, but the OA might also reveal the direct contact addressof a PA to authorized external agents which can then start an ad-hoc conver-sation directly with the PA. A PA itself might act as a nested suborganization,i.e. containing itself an OA providing access to a suborganization within themain virtual organization. For instance, this can be useful to represent viewson nested organizational structures such as departments, project teams, servicenetworks, where e.g., the department chair is a personal agent within the or-ganization and at the same time an organizational chair for the department,managing the personal agents of the department.
Internal Computational Agents
Computational Agents (CAs) act as wrappers around internal computationalservices and data which is used in the PAs’ personalized views. They fulfillcomputational tasks such as collecting, transforming and aggregating data from
47

internal underlying data sources or computational functions. That is, they inte-grate external data into the internal knowledge base of the PAs which use theirrules to transform the data into knowledge and construct personalized viewsout of it. The PAs can communicate with the CAs decoupled via interchangingevent messages or loosely coupled via the built-ins and service interfaces of therule engines in the PAs.
External Agents
External Agents (EAs) constitute the points-of-contact that allow an externaluser or service to query the Organizational Agent (OA) of a virtual organization.The OA answers these queries based on the rule-based views of the personalizedPAs. An EA is based, e.g., on a Web (HTTP) interface that allows such anenquiry user to pose queries, employing a menu-based Web form. An externalagent can be e.g. an external human agent, a service/tool, or another externalorganization agent, i.e. leading to cross-organizational communications.
4.3.3 Proof of Concept Implementation
The implemented framework (see figure 4.13) consists of three interconnectedarchitectural layers, listed here from top to bottom:
• Computationally independent user interfaces such as template-based Webforms or controlled English rule interfaces. [55]
• Reaction RuleML [32] as the common platform-independent rule inter-change format to interchange rules, events, actions, queries, and data be-tween agents and other agents (e.g., Semantic Web services or humans viaWeb forms).
• A highly scalable and efficient enterprise service bus (ESB) as agent/service-broker and communication middleware on which platform-specific rule en-gines are deployed as distributed agent nodes (respective semantic infer-ence Web services). We use Prova [26] as expressive platform specific rulesengine to manage and execute the logic-based personalized views of thesemantic agents in terms of declarative rules which have access to semanticontologies.
In the following, the rule-based agent framework will be explained frombottom to top.
Prova [26] is an enterprise strength highly expressive distributed SemanticWeb logic programming (LP) rule engine. One of the key advantages of Prova isits elegant separation of logic, data access, and computation as well as its tightintegration of Java, Semantic Web technologies, and service-oriented computingand complex event processing technologies. Prova follows the spirit and designof the W3C Semantic Web initiative and combines declarative rules, ontologiesand inference with dynamic object-oriented programming.
Prova provides a rich library of built-ins including support for many querylanguages such as SQL, XQuery, SPARQL, File IO, so that external data sourcescan be dynamically accessed at runtime and the selected data can be used in therules to derive more complex personalized views. Prova supports external type
48
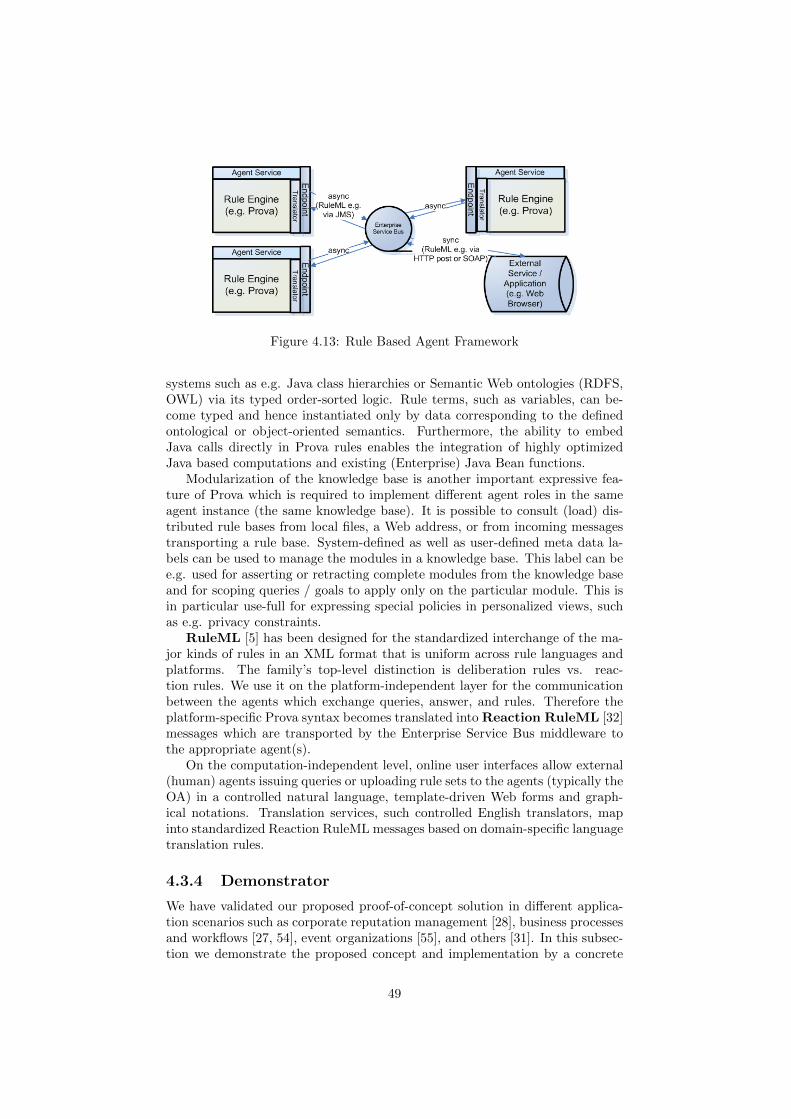
Figure 4.13: Rule Based Agent Framework
systems such as e.g. Java class hierarchies or Semantic Web ontologies (RDFS,OWL) via its typed order-sorted logic. Rule terms, such as variables, can be-come typed and hence instantiated only by data corresponding to the definedontological or object-oriented semantics. Furthermore, the ability to embedJava calls directly in Prova rules enables the integration of highly optimizedJava based computations and existing (Enterprise) Java Bean functions.
Modularization of the knowledge base is another important expressive fea-ture of Prova which is required to implement different agent roles in the sameagent instance (the same knowledge base). It is possible to consult (load) dis-tributed rule bases from local files, a Web address, or from incoming messagestransporting a rule base. System-defined as well as user-defined meta data la-bels can be used to manage the modules in a knowledge base. This label can bee.g. used for asserting or retracting complete modules from the knowledge baseand for scoping queries / goals to apply only on the particular module. This isin particular use-full for expressing special policies in personalized views, suchas e.g. privacy constraints.
RuleML [5] has been designed for the standardized interchange of the ma-jor kinds of rules in an XML format that is uniform across rule languages andplatforms. The family’s top-level distinction is deliberation rules vs. reac-tion rules. We use it on the platform-independent layer for the communicationbetween the agents which exchange queries, answer, and rules. Therefore theplatform-specific Prova syntax becomes translated into Reaction RuleML [32]messages which are transported by the Enterprise Service Bus middleware tothe appropriate agent(s).
On the computation-independent level, online user interfaces allow external(human) agents issuing queries or uploading rule sets to the agents (typically theOA) in a controlled natural language, template-driven Web forms and graph-ical notations. Translation services, such controlled English translators, mapinto standardized Reaction RuleML messages based on domain-specific languagetranslation rules.
4.3.4 Demonstrator
We have validated our proposed proof-of-concept solution in different applica-tion scenarios such as corporate reputation management [28], business processesand workflows [27, 54], event organizations [55], and others [31]. In this subsec-tion we demonstrate the proposed concept and implementation by a concrete
49
demonstrator use case.Simple views over data can be constructed by built-in data queries. The
following rule in Prova syntax uses a SPARQL query to select all manufacturersof luxury car manufacturers from DBPedia (RDF Linked Open Data databaseextracted from Wikipedia - see DBPedia Deutsch http://de.dbpedia.org formore information) .
luxuryCar(Manufacturer, Name, Car) :-Query="SELECT ?manufacturer ?name ?car % SPARQL RDF Query
WHERE {?car <http://purl.org/dc/terms/subject><http://dbpedia.org/resource/Category:Luxury_vehicles> .
?car foaf:name ?name .?car dbo:manufacturer ?man .?man foaf:name ?manufacturer. } ORDER by ?manufacturer ?namea,
sparql_select(Query,manufacturer(Manufacturer),name(Name),car(Car)).
More complex rule-based views can be implemented on top of such simpledata views. The following rule of a computational agent (CA) actively filtersfor car manufacturer stocks from a real-time ticker feed and enriches the stockticker event with the queried data from the DBPedia data view. It then sendsthe enriched knowledge to the personal agent ”epa1”.
rcvMult(SID,stream,"S&P500", inform, tick(StockSym,Price,Time)) :-% filter stock symbols which are of type car manufacturer
manufacturer(StockSym, Man^^car:Car_Manufacturer),% find and create a list of all luxury car manufacturers
findall([luxuryCar|Knowledge],luxuryCar(Man,Name,Car),Knowledge),% enrich the stock symbol with the knowledge about luxury car manufacturersEnrichedData = [StockSym,Knowledge],% send enriched knowledge to personal agent epa1sendMsg(SID2,esb,"epa1", inform, happens(tick(EnrichedData,Price),Time)).
The following rule of the personalized agent (PA) implements a personalizedview. The rule accepts queries from the organizational agent for monitoring lux-ury car manufacturers. It actively receives the knowledge-enriched stock tickerfeeds from the computational agent(s). If the monitored luxury car manufactureis a member of the received knowledge (about all luxury car manufactures listedin Wikipedia) the stock tick is part of the personalized view and will be send tothe requesting OA.
rcvMult(CID,esb, OA, query, monitor(LuxuryCarManufacturer, Ticker) :-rcvMult(SID2,esb, CA, inform, happens(tick([StockSymbol | Knowledge],P),T))member(LuxuryCarManufacturer, Knowledge),Ticker = tick(StockSymbol,P,T),sendMsg(CID,OA,answer,monitor(LuxuryCarManufacturer, Ticker)) .
An organizational agent (OA) typically manages several personal agents anddelegates queries of external agents to their personalized views. It might e.g.be used to implement privacy and security policies. For instance, the followingrule detects suspicious logins by assessing the IP numbers of the login eventsfrom the same user login.
rcvMsg(XID,Protocol,From,request,login(User,IP)) :-% if the next follow up event (@count(1)) that follows the%previous received login is send from another IP (IP2!=IP)@group(g1) @count(1)rcvMsg(XID,Protocol,From,request,login(User,IP2)) [IP2!=IP],println(["Suspicious login",User,IP,IP2]," ").
50
4.3.5 Conclusion
Our rule-based multi-agent approach for implementing personalized views ben-efits from the declarative properties of rule programming, the expressiveness ofthe used rule language, and the underlying formal logic semantics. A declara-tive rule-based method for integrating knowledge into adaptable and adaptivepersonalized views provides higher levels of flexibility to describe in a semanticway the multiple aspects and contextual dimensions which personalized viewsmight take. In particular, the agent’s personalized views might be enriched bythe pragmatic context in which they are used, such as communicative situations,purposes or individual goals and values, organizational norms, legal norms, etc.
51

Chapter 5
Conclusion and Outlook
In this report we described the validation and evaluation of our prototypes in theproject Corporate Semantic Web during the last milestone phase. We presentedseveral prototypical implementations as a proof of our conceptual Corporate Se-mantic Web architecture presented in the last report, covering the three pillarsCorporate Ontology Engineering, Corporate Semantic Collaboration, and Cor-porate Semantic Search. The prototypes were partially developed and evaluatedin tight co-operation with our industrial partners.
52
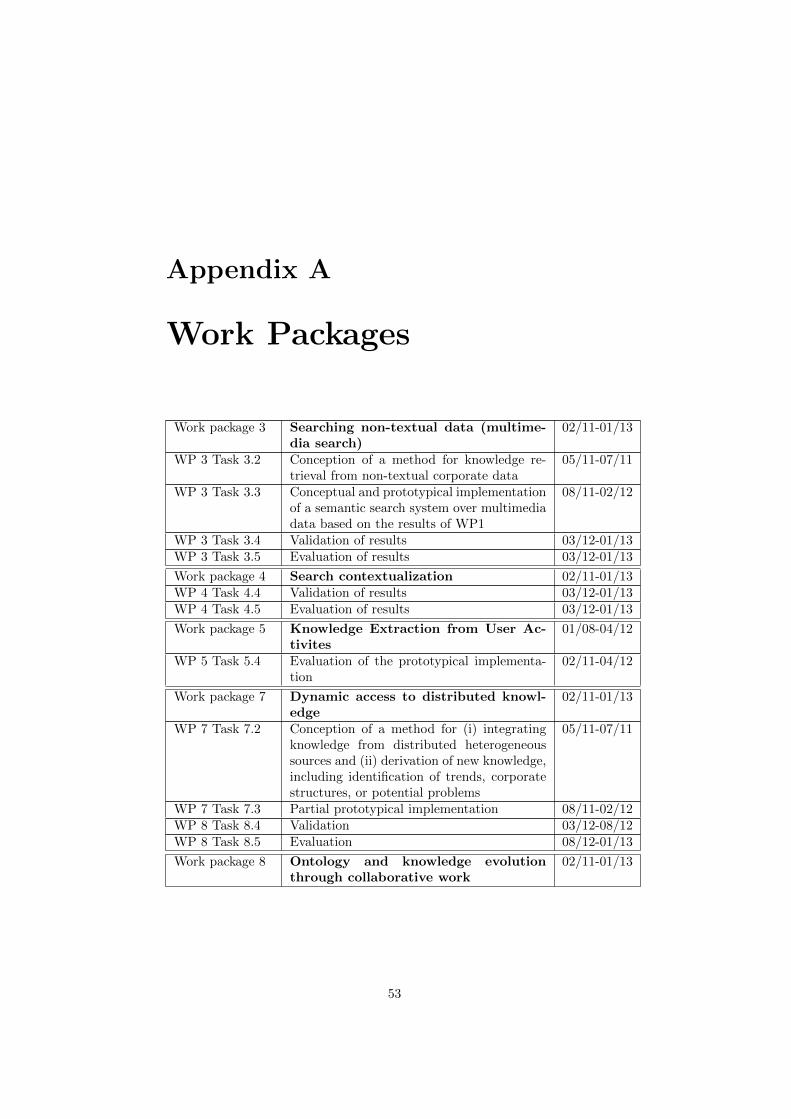
Appendix A
Work Packages
Work package 3 Searching non-textual data (multime-dia search)
02/11-01/13
WP 3 Task 3.2 Conception of a method for knowledge re-trieval from non-textual corporate data
05/11-07/11
WP 3 Task 3.3 Conceptual and prototypical implementationof a semantic search system over multimediadata based on the results of WP1
08/11-02/12
WP 3 Task 3.4 Validation of results 03/12-01/13WP 3 Task 3.5 Evaluation of results 03/12-01/13
Work package 4 Search contextualization 02/11-01/13WP 4 Task 4.4 Validation of results 03/12-01/13WP 4 Task 4.5 Evaluation of results 03/12-01/13
Work package 5 Knowledge Extraction from User Ac-tivites
01/08-04/12
WP 5 Task 5.4 Evaluation of the prototypical implementa-tion
02/11-04/12
Work package 7 Dynamic access to distributed knowl-edge
02/11-01/13
WP 7 Task 7.2 Conception of a method for (i) integratingknowledge from distributed heterogeneoussources and (ii) derivation of new knowledge,including identification of trends, corporatestructures, or potential problems
05/11-07/11
WP 7 Task 7.3 Partial prototypical implementation 08/11-02/12WP 8 Task 8.4 Validation 03/12-08/12WP 8 Task 8.5 Evaluation 08/12-01/13
Work package 8 Ontology and knowledge evolutionthrough collaborative work
02/11-01/13
53
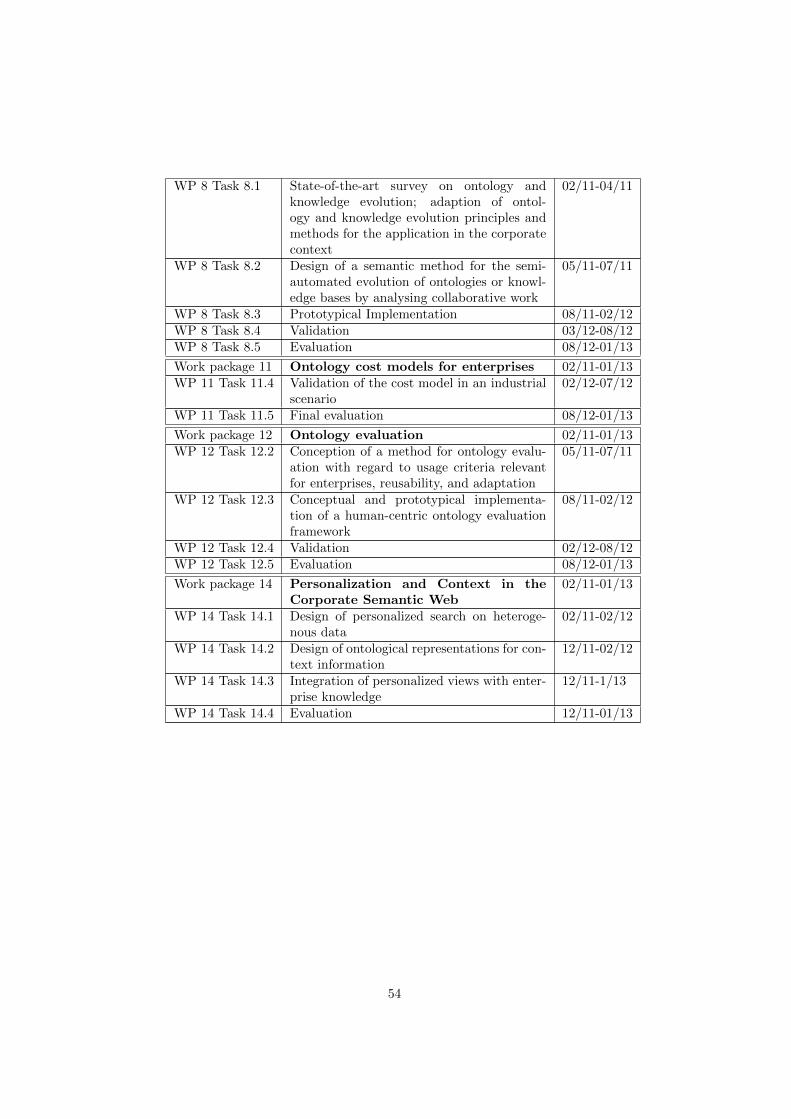
WP 8 Task 8.1 State-of-the-art survey on ontology andknowledge evolution; adaption of ontol-ogy and knowledge evolution principles andmethods for the application in the corporatecontext
02/11-04/11
WP 8 Task 8.2 Design of a semantic method for the semi-automated evolution of ontologies or knowl-edge bases by analysing collaborative work
05/11-07/11
WP 8 Task 8.3 Prototypical Implementation 08/11-02/12WP 8 Task 8.4 Validation 03/12-08/12WP 8 Task 8.5 Evaluation 08/12-01/13
Work package 11 Ontology cost models for enterprises 02/11-01/13WP 11 Task 11.4 Validation of the cost model in an industrial
scenario02/12-07/12
WP 11 Task 11.5 Final evaluation 08/12-01/13
Work package 12 Ontology evaluation 02/11-01/13WP 12 Task 12.2 Conception of a method for ontology evalu-
ation with regard to usage criteria relevantfor enterprises, reusability, and adaptation
05/11-07/11
WP 12 Task 12.3 Conceptual and prototypical implementa-tion of a human-centric ontology evaluationframework
08/11-02/12
WP 12 Task 12.4 Validation 02/12-08/12WP 12 Task 12.5 Evaluation 08/12-01/13
Work package 14 Personalization and Context in theCorporate Semantic Web
02/11-01/13
WP 14 Task 14.1 Design of personalized search on heteroge-nous data
02/11-02/12
WP 14 Task 14.2 Design of ontological representations for con-text information
12/11-02/12
WP 14 Task 14.3 Integration of personalized views with enter-prise knowledge
12/11-1/13
WP 14 Task 14.4 Evaluation 12/11-01/13
54
Appendix B
Acknowledgment
This work has been partially supported by the ”InnoProfile-Corporate Seman-tic Web” project funded by the German Federal Ministry of Education andResearch (BMBF).
55

Bibliography
[1] Costin Badica, Lars Braubach, and Adrian Paschke. Rule-based distributedand agent systems. In RuleML Europe, pages 3–28, 2011.
[2] Kent Beck, Mike Beedle, Arie van Bennekum, Alistair Cockburn, WardCunningham, Martin Fowler, James Grenning, Jim Highsmith, AndrewHunt, Ron Jeffries, Jon Kern, Brian Marick, Robert C. Martin, Steve Mel-lor, Ken Schwaber, Jeff Sutherland, and Dave Thomas. Manifesto for agilesoftware development, 2001.
[3] Barry Boehm. Software Engineering Economics. Prentice-Hall, EnglewoodCliffs, N.J, 1981.
[4] Barry W. Boehm, Bradford Clark, Ellis Horowitz, J. Christopher Westland,Raymond J. Madachy, and Richard W. Selby. Cost Models for Future Soft-ware Life Cycle Processes: COCOMO 2.0. Annals of Software Engineering,1:57–94, 1995.
[5] Harold Boley, Adrian Paschke, and Omair Shafiq. Ruleml 1.0: The overar-ching specification of web rules. In RuleML, pages 162–178, 2010.
[6] Booktate. Booktate website. http://booktate.com/, 2012.
[7] Lars Braubach, Alexander Pokahr, and Adrian Paschke. Using rule-based concepts as foundation for higher-level agent architectures. In Kul-dar Traveter Adrian Giurca, Dragan Gasevic, editor, Handbook of Researchon Emerging Rule-Based Languages and Technologies: Open Solutions andApproaches, pages 493–524. Information Science Publishing, 5 2009.
[8] John S. Breese, David Heckerman, and Carl Kadie. Empirical analysis ofpredictive algorithms for collaborative filtering. pages 43–52, 1998.
[9] Robin Burke. Knowledge-based recommender systems. In Encyclopedia ofLibrary and Information Systems, volume 69, 2000.
[10] Robin Burke. The adaptive web. chapter Hybrid web recommender sys-tems, pages 377–408. Springer-Verlag, Berlin, Heidelberg, 2007.
[11] S. Chakravarthy and D. Mishra. Snoop: an expressive event specificationlanguage for active databases. Data Knowl. Eng., 14:1–26, November 1994.
[12] H. Cunningham. Gate: general architecture for text engineering.http://gate.ac.uk.
56
[13] et al. Dietmar Jannach. Recommender Systems: An Introduction. Cam-bridge University Press, 2011.
[14] Diigo Inc. diigo website. http://diigo.com, 2012.
[15] faviki. faviki - tags that make sense. http://www.faviki.com.
[16] Peter Haase, Daniel Herzig, Mark Musen, and Thanh Tran. Semantic wikisearch. In The Semantic Web: Research and Applications, 6th EuropeanSemantic Web Conference, ESWC 2009, Heraklion, Crete, Greece, pages445–460, 2009.
[17] Jonathan L. Herlocker, Joseph A. Konstan, Loren G. Terveen, and John T.Riedl. Evaluating collaborative filtering recommender systems. ACMTrans. Inf. Syst., 22(1):5–53, January 2004.
[18] Annika Hinze, Ralf Heese, Markus Luczak-Rosch, and Adrian Paschke.Semantic enrichment by non-experts: Usability of manual annotation tools.In International Semantic Web Conference (1), pages 165–181, 2012.
[19] Jeff Howe. The rise of crowdsourcing. Wired, 14(6), 2006.
[20] Ping-Ju Hsieh. Administration service for the tourist information system.Master’s thesis, Computer Science Department, The University of Waikato,June 2008.
[21] Roza Lemdani, Geraldine Polaillon, Nacera Bennacer, and Yolaine Bourda.A semantic similarity measure for recommender systems. In Proceedingsof the 7th International Conference on Semantic Systems, I-Semantics ’11,pages 183–186, New York, NY, USA, 2011. ACM.
[22] Qi Lin. Semantic multimedia presentation tool, 2012.
[23] Olive Tree Bible Software, Inc. Bible+. available online athttp://itunes.apple.com/, 2012.
[24] A. Paschke. Eca-lp / eca-ruleml: A homogeneous event-condition-actionlogic programming language. In RuleML-2006, Athens, Georgia, USA,2006.
[25] Adrian Paschke. Eca-ruleml: An approach combining eca rules with tem-poral interval-based kr event/action logics and transactional update logics.CoRR, abs/cs/0610167, 2006.
[26] Adrian Paschke. Rules and logic programming for the web. In ReasoningWeb, pages 326–381, 2011.
[27] Adrian Paschke. A semantic rule and event driven approach for agiledecision-centric business process management - (invited paper). In Ser-viceWave, pages 254–267, 2011.
[28] Adrian Paschke and Rehab Alnemr. The Rule Responder DistributedReputation Management System for the Semantic Web . In Proceedings ofthe 4th International Rule Challenge. CEUR. Vol-649, 2010.
57
[29] Adrian Paschke and Martin Bichler. Knowledge representation conceptsfor automated sla management. Decis. Support Syst., 46(1):187–205, 2008.
[30] Adrian Paschke and Harold Boley. Rule markup languages and semanticweb rule languages. In Kuldar Traveter Adrian Giurca, Dragan Gasevic,editor, Handbook of Research on Emerging Rule-Based Languages and Tech-nologies: Open Solutions and Approaches, pages 1–24. Information SciencePublishing, 5 2009.
[31] Adrian Paschke and Harold Boley. Rule responder: Rule-based agents forthe semantic-pragmatic web. International Journal on Artificial Intelli-gence Tools, 20(6):1043–1081, 2011.
[32] Adrian Paschke, Harold Boley, Zhili Zhao, Kia Teymourian, and TaraAthan. Reaction ruleml 1.0: Standardized semantic reaction rules. InRuleML, pages 100–119, 2012.
[33] Adrian Paschke, Gokhan Coskun, Ralf Heese, Markus Luczak-Rosch, Ra-doslaw Oldakowski, Ralph Schafermeier, and Olga Streibel. Realizing thecorporate semantic web: Concept papers. Technical Report TR-B-08-09,Freie Universitat Berlin, April 2009.
[34] Adrian Paschke, Gokhan Coskun, Ralf Heese, Radoslaw Oldakowski, MarioRothe, Ralph Schafermeier, Olga Streibel, Kia Teymourian, and AlexandruTodor. Corporate semantic web report v: Prototypical implementationsand working packages in project phase ii. Technical Report TR-B-12-04,Freie Universitat Berlin, 2012.
[35] E. Paslaru Bontas Simperl, C. Tempich, and Y. Sure. ONTOCOM: A CostEstimation Model for Ontology Engineering. The Semantic Web-ISWC2006, pages 625–639, 2006.
[36] Michael J. Pazzani and Daniel Billsus. The adaptive web. chapter Content-based recommendation systems, pages 325–341. Springer-Verlag, Berlin,Heidelberg, 2007.
[37] E. Peis, J. M. Morales del Castillo, and J. A. Delgado-Lopez. Seman-tic recommender systems. analysis of the state of the topic. Hipertext.net,6:(online), 2008. Author: E. Peis; J. M. Morales-del-Castillo; J. A. Delgado-Lopez Location in hierarchy: Home -¿ Number 6, May 2008 -¿ Recom-mender URL of this page: http://www.hipertext.net/english/pag1031.htmCitation: E. Peis; J. M. Morales-del-Castillo; J. A. Delgado-Lopez. Se-mantic Recommender Systems. Analysis of the state of the topic [on line].”Hipertext.net”, num. 6, 2008. ¡http://www.hipertext.net¿. ISSN 1695-5498.
[38] J. Ben Schafer, Dan Frankowski, Jon Herlocker, and Shilad Sen. Collabo-rative filtering recommender systems. In Peter Brusilovsky, Alfred Kobsa,and Wolfgang Nejdl, editors, The adaptive web, pages 291–324. Springer-Verlag, Berlin, Heidelberg, 2007.
[39] Alexa Schlegel, Ralf Heese, and Annika Hinze. Visualisation of semanticenrichment. In Workshop on Interaktion und Visualisierung im Daten-Web,September 2012.
58
[40] Elena Simperl, Igor O. Popov, and Tobias Burger. ONTOCOM Revisited:Towards Accurate Cost Predictions for Ontology Development Projects.In Lora Aroyo, Paolo Traverso, Fabio Ciravegna, Philipp Cimiano, TomHeath, Eero Hyvonen, Riichiro Mizoguchi, Eyal Oren, Marta Sabou, andElena Simperl, editors, The Semantic Web: Research and Applications,volume 5554, pages 248–262. Springer, Berlin, Heidelberg, 2009.
[41] Katharina Siorpaes and Martin Hepp. Games with a purpose for the se-mantic web. IEEE Intelligent Systems, 23(3):50–60, 2008.
[42] A. Sorokin and D. Forsyth. Utility data annotation with amazon mechan-ical turk. In Computer Vision and Pattern Recognition Workshops, 2008.CVPRW’08. IEEE Computer Society Conference on, pages 1–8. IEEE,2008.
[43] Olga Streibel and Malgorzata Mochol. Trend ontology for knowledge-basedtrend mining on textual information. In IEEE Computer Society Proceed-ings of 7th International Conference on Information Technology : NewGenerations, ITNG2010, April 2010 Las Vegas,US, pages 00–00. IEEEComputer Society, 2010.
[44] Mari Carmen Suarez-Figueroa and Asuncion Gomez-Perez. Ontology Re-quirements Specification. In Mari Carmen Suarez-Figueroa, AsuncionGomez-Perez, Enrico Motta, and Aldo Gangemi, editors, Ontology En-gineering in a Networked World, chapter 5, pages 93–106. Springer BerlinHeidelberg, 2012 edition, March 2012.
[45] Kia Teymourian, Gokhan Coskun, and Adrian Paschke. Modular upper-level ontologies for semantic complex event processing. In WoMO, pages81–93, 2010.
[46] Kia Teymourian and Adrian Paschke. Semantic rule-based complex eventprocessing. In RuleML 2009: Proceedings of the International RuleMLSymposium on Rule Interchange and Applications, 2009.
[47] Kia Teymourian and Adrian Paschke. Towards semantic event processing.In DEBS ’09: Proceedings of the Third ACM International Conference onDistributed Event-Based Systems, pages 1–2, New York, NY, USA, 2009.ACM.
[48] Kia Teymourian, Malte Rohde, and Adrian Paschke. Fusion of backgroundknowledge and streams of events. In Proceedings of the 6th ACM Interna-tional Conference on Distributed Event-Based Systems, DEBS ’12, pages302–313, New York, NY, USA, 2012. ACM.
[49] Thomson Reuters Inc. Open Calais website. http://www.opencalais.com/.
[50] veeeb – Top 21 GmbH. veeeb website. http://www.veeeb.com, 2012.
[51] Luis von Ahn and Laura Dabbish. Designing games with a purpose. Com-mun. ACM, 51(8):58–67, 2008.
[52] Hans Weigand and Adrian Paschke. The pragmatic web: Putting rules incontext. In RuleML, pages 182–192, 2012.
59

[53] Zemanta Ltd. Zemanta website. http://www.zemanta.com/.
[54] Zhili Zhao and Adrian Paschke. Event-Driven Scientific Workflow Execu-tion. 6th International Workshop on Event Driven Business Process Man-agement (edBPM 2012), September 2012.
[55] Zhili Zhao, Adrian Paschke, Chaudhry Usman Ali, and Harold Boley. Prin-ciples of the symposiumplanner instantiations of rule responder. In RuleMLAmerica, pages 97–111, 2011.
60