Corporate Risk Management and Hedge Accounting*eprints.lancs.ac.uk/45766/1/CRMHA.pdf · 2 1....
37
1 Corporate Risk Management and Hedge Accounting* ARGYRO PANARETOU, Lancaster University Management School MARK B. SHACKLETON, Lancaster University Management School PAUL A. TAYLOR, Lancaster University Management School Abstract Motivated by the debate about the economic consequences of mandatory adoption of International Financial Reporting Standards (IFRS), this study investigates the effect of hedge accounting under IFRS on corporate risk management. Using a sample of large UK non-financial firms from 2003 to 2008, we show that the implementation of the new standards reduces the level of asymmetric information faced by derivative users. Specifically, for firms that hedge under IFRS we find that analysts’ forecast error and dispersion are significantly lower. The paper contributes to prior research on the effects of hedge accounting and on the adoption of IFRS. Keywords: derivatives, hedging, asymmetric information, hedge accounting JEL classification: C21; D82; G32 * The authors would like to thank Ken Peasnell, Steve Young, Peter Pope, Allan Hodgson, Krishna Paudyal and participants of the EAA 2009, EFMA 2009 and BAA 2010 conferences for helpful discussions, suggestions and comments. We are responsible for any errors.
-
Upload
phungthuan -
Category
Documents
-
view
213 -
download
0
Transcript of Corporate Risk Management and Hedge Accounting*eprints.lancs.ac.uk/45766/1/CRMHA.pdf · 2 1....
1
Corporate Risk Management and Hedge Accounting*
ARGYRO PANARETOU, Lancaster University Management School
MARK B. SHACKLETON, Lancaster University Management School
PAUL A. TAYLOR, Lancaster University Management School
Abstract
Motivated by the debate about the economic consequences of mandatory adoption of International Financial
Reporting Standards (IFRS), this study investigates the effect of hedge accounting under IFRS on corporate risk
management. Using a sample of large UK non-financial firms from 2003 to 2008, we show that the implementation
of the new standards reduces the level of asymmetric information faced by derivative users. Specifically, for firms
that hedge under IFRS we find that analysts’ forecast error and dispersion are significantly lower. The paper
contributes to prior research on the effects of hedge accounting and on the adoption of IFRS.
Keywords: derivatives, hedging, asymmetric information, hedge accounting
JEL classification: C21; D82; G32
* The authors would like to thank Ken Peasnell, Steve Young, Peter Pope, Allan Hodgson, Krishna Paudyal and
participants of the EAA 2009, EFMA 2009 and BAA 2010 conferences for helpful discussions, suggestions and
comments. We are responsible for any errors.
2
1. Introduction
The use of derivative instruments for corporate risk management has grown dramatically over the past decades and
so has the need to regulate the accounting treatment and reporting of these instruments. This paper evaluates the
impact of accounting for derivatives on the scope of corporate risk management, measured by the level of
asymmetric information regarding firm’s earnings. The results offer empirical evidence on the effect of hedge
accounting.
According to risk management theories, firms optimally hedge if some market imperfections make volatility costly.
Through hedging, firms are able to reduce the cost of financial distress and the amount of corporate tax paid
(Mayers and Smith 1982; Smith and Stulz 1985). Ross (1998) and Leland (1998) argue that through hedging, firms
can reduce the probability of financial distress and hence increase their debt capacity and associated tax advantages.
When external financing is more costly, hedging can also ensure that the firm has enough cash flow to internally
finance attractive investments (Froot, Scharfstein, and Stein 1993; Myers and Majluf 1984). Finally, financial
hedging improves the informativeness of corporate earnings as a signal of management ability (DeMarzo and Duffie
1995).
Accounting for derivatives as prescribed by International Financial Reporting Standards (IFRS) stirred important
debate regarding its effect on corporate risk management. On the one hand, increased information regarding
corporate risk management policies and the fair value measurement of financial instruments made the use of
derivatives more transparent. This provides a better picture of the firm's underlying risk exposure and improves the
informativeness of corporate earnings as a signal of management ability (DeMarzo and Duffie 1995). More
information on the risk exposures and hedging policies enables the market to better assess the hedging decisions of
the firm, encouraging the optimal use of derivatives. Melumad, Weyns, and Ziv (1999) show that under no-hedge
accounting, hedging decisions deviate from the optimal economic hedge the firm would undertake under symmetric
information.
On the other hand, concerns are expressed regarding the ability of the corporations to qualify for hedge accounting
treatment. If hedging instruments do not qualify for hedge accounting treatment, firms can either accept the impact
on their annual reports and follow what it is considered as an optimal economic hedge, or adjust their hedging
3
behavior to achieve more desirable accounting results. Adjustments in hedging behavior can imply changes in the
type of derivative instruments used, the hedging horizon and the extent of hedging. In the extreme, firms may
abandon their hedging program. Under any scenario hedging benefits decrease, as the use of derivatives is either
associated with higher earnings volatility or becomes suboptimal in terms of risk management.
The above discussion leads to an interesting research question. Which effect of accounting for derivatives under
IFRS dominates, the positive; increase in the transparency of derivative disclosure or the negative; increase in the
earnings volatility and/or deviation of hedging policy from the optimal? To investigate this question we focus on the
effect of hedge accounting under IFRS on asymmetric information, measured by the ability of analysts to forecast
earnings. Higher information quality about the use of derivative instruments and risk management decreases
information asymmetry. Not qualifying for hedge accounting, all else equal, increases the noise contained in
earnings, achieving the opposite result. The overall effect of changes in hedging behavior triggered by the IFRS
introduction, on asymmetric information is not clear a priori.
The UK provides a unique framework for this analysis for a number of reasons. Firstly, hedging activity is
widespread in the UK market, due to high hedging incentives and a well developed market for derivatives.
Therefore, the effects of hedge accounting are expected to be more pronounced, compared to markets with limited
hedging activity. Secondly, the quality of UK GAAP does not differ substantially from IFRS (Christensen, Lee, and
Walker 2007). Hence, we expect IFRS effects on information asymmetry to be largely driven by particular standards
that introduce substantial changes, including those concerning hedge accounting. Finally, according to UK GAAP,
listed firms were required to report derivatives usage from 1999. This enables us to identify hedgers before the
introduction of IFRS.
Using analysts' forecast error and dispersion as proxies for asymmetric information we find that the positive effects
of hedge accounting under IFRS dominate. Specifically, derivative usage under IFRS is negatively associated with
analysts' forecast error and dispersion. Moreover, we find weak evidence that forecast accuracy is lower for firms
that hold derivative positions that do not fully qualify for hedge accounting treatment under IFRS. When we control
for the endogeneity of the firm's decision to hedge, our findings suggest that the reduced asymmetric information for
hedgers after the introduction of IFRS is not a result of self-selection.
4
An important challenge of our analysis is that hedge accounting has a number of effects on the earnings. While we
find a positive effect overall, it is difficult to identify the relative importance of the different factors that influence
forecast accuracy. Although assessing changes in hedging behavior due to IFRS introduction using annual report
data is problematic, we find that forecast accuracy is higher for firms that voluntary disclose more detailed
information on derivatives under UK GAAP. This suggests that our increased predictability of earnings is driven, at
least partly, by a decrease in information asymmetry, rather than by changes in hedging behaviour. Our forecast
error proxies may exhibit measurement error, and in particular may be affected by the change in the accounting
measurement per se. In order to investigate this, we evaluate the effect of hedge accounting under IFRS using bid-
ask spread as a proxy for information asymmetry. Hedge accounting under IFRS reduces significantly the bid-ask
spread, providing further support that IFRS benefits include reduced information asymmetry.
Although the UK setting offers several advantages, there are caveats that should be considered when interpreting the
results. First, it is unclear whether our findings generalize to markets with more limited hedging activity. Second,
our study focuses on the effect of hedge accounting under IFRS on information asymmetry, and hence it is limited in
scope. We do not examine the effect of this new accounting regime on other hedging benefits, such as the reduction
of financial distress costs, taxes and underinvestment cost. With these caveats in mind, our study contributes to the
literature in three main ways. Firstly, our results provide empirical evidence on the effects of derivative disclosures
(Melumad et al. 1999). Capturing the incremental effect of particular standards that introduce substantial changes in
the financial reporting regime enhances our understanding of sources of potential IFRS informational benefits
(Ashbaugh and Pincus 2001; Peek 2005). Finally, as information asymmetry has been shown to influence the cost of
capital (Easley and O'Hara 2004), our study complements the literature that directly tests for the effects of IFRS
adoption on the cost of equity (Daske, Hail, Leuz, and Verdi 2008; Li 2010).
Section 2 presents a review of related academic research. Section 3 summarizes the accounting treatment and
disclosure of hedging activity in the UK and develops our hypotheses. The sample and data sources are presented in
Section 4. Section 5 presents the variables and models used. The main results of the study are presented in Section
6. Section 7 concludes.
5
2. Review of related academic research
Four streams of the literature are most relevant to this study. First, a number of authors have looked at the
informational effect of hedging. In a perfect market with full information, hedging at firm level is irrelevant since
shareholders can undertake hedging activity on their own, according to their risk preferences. However, under a
more realistic setting where managers have better information regarding the risk exposure of the firm, corporate
hedging can decrease asymmetric information, and potentially increase the value of the firm. DeMarzo and Duffie
(1995) argue that hedging increases the informativeness of earnings as a signal of management ability and project
quality by reducing the amount of noise in the firm profits. Myers and Majluf (1984) show that hedging reduces the
cost of externally raised funds, by alleviating the problem of asymmetric information. Empirical studies support this
theory, providing evidence that firms with more severe underinvestment problems are more likely to hedge (Geczy,
Minton, and Schrand 1997; Allayannis and Ofek 2001). Using analyst forecast accuracy as a proxy for asymmetric
information, DaDalt, Gay and Nam (2002) show that both the use of derivatives and the extent of derivatives usage
are associated with lower asymmetric information. Their study uses a sample of non-financial firms where
derivatives are reported under US GAAP during the entire sample period. In contrast to our study, the effect of a
change in hedge accounting regime on asymmetric information is not investigated.
A second stream of related research considers the effects of financial reporting on asymmetric information. This area
has been examined from several perspectives. Of particular relevance here are the studies that use forecast accuracy
to capture changes in the information environment driven by the financial reporting regime. Lang and Lundholm
(1996) find that firms with more informative disclosure policies have a larger analysts' following, more accurate
analysts' earnings forecast and lower forecast dispersion. Evaluating the impact of Regulation Fair Disclosure on the
quality and quantity of firm specific information released to the market, Irani and Karamanou (2003) document a
decrease in forecast dispersion following its passage. Such an inverse relationship between the quality of disclosure
and forecast error is also documented in a number of other studies (Chang, Khanna, and Palepu 2000; Acker,
Horton, and Tonks 2002; Vanstraelen, Zarzeski, and Robb 2003). Ashbaugh and Pincus (2001) show that forecast
accuracy improves after voluntary IAS adoption, but note that results based on such voluntary adoption may be
driven by firms' characteristics rather than by changes in the financial reporting system. Using data from the
6
Netherlands, Peek (2005) finds that earnings forecast accuracy decreases on first IFRS adoption if accounting
changes have not previously been disclosed.
IFRS introduction reduces the amount of discretion relative to local GAAP and makes it less costly for investors to
compare firms across markets (Ashbaugh and Pincus 2001; Armstrong, Barth, Jagolinzer, and Riedl 2010; Covrig,
Defond, and Hung 2007). A third stream of related literature examines directly the economic consequences of IFRS
adoption. While such research suggests that voluntary IFRS adoption reduces the cost of equity capital (Leuz and
Verrecchia 2000), studies on mandatory adoption give a less clear picture. Daske et al. (2008) find that IFRS
benefits include increased market liquidity. Comparing mandatory and voluntary adopters, the study reports that
liquidity effects are more pronounced for firms that voluntarily switched to IFRS. Li (2010) finds that cost of equity
for mandatory adopters decreases only in countries with strong legal enforcement. The research findings indicate
that the effects of IFRS adoption remain unclear. This paper provides additional evidence by examining the effect of
hedge accounting under IFRS on forecast accuracy. Capturing the incremental effect of particular standards that
introduce substantial changes in the financial reporting regime enhances our understanding of the sources of
potential IFRS benefits.
Hedging disclosures essentially turn private information into public information. The fourth stream of related
research addresses the role of public information in affecting hedging decisions. DeMarzo and Duffie (1995) show
that if hedge transactions are not disclosed, managers hedge more than they would under a full disclosure regime.
Therefore, when the information increase due to hedging outweighs the information provided by hedging activity
disclosure, it is optimal for the shareholders to request only aggregate accounting reports. Melumad et al. (1999)
show that under no-hedge accounting, hedging decisions deviate from the optimal economic hedge the firm would
undertake under symmetric information. Direct empirical investigation of this area is problematic due to data
availability. An indirect way of studying the effects of hedge accounting on hedging decisions is by evaluating its
impact on hedging benefits. Higher (lower) hedging benefits following a change in hedge accounting regime can be
associated with hedging decisions deviating less (more) from the optimal policy. Our study contributes to this area,
providing evidence of the effect of hedge accounting on the informational benefits of hedging.
7
3. Accounting treatment and disclosure of hedging activity
Until recently UK firms provided little information in their annual reports regarding derivatives usage. The
disclosure of information on the use of derivatives and risk management policy was non-mandatory before 1999.
With the introduction of FRS 13, publicly traded entities and all financial institutions except insurance companies
were required to provide narrative and numerical disclosures regarding the use of derivatives. According to Woods
and Marginson 2004, due to the generic nature of narrative disclosures and the lack of detail and comparability of
numerical disclosure, the information provided by firms on the use of derivatives under FRS 13 was of limited
value. A clear aim of adopting a more comprehensive IFRS regime in this area has been to enhance transparency in
the reporting of derivatives and their use for risk management purposes. For accounting periods beginning on or
after 1 January 2005 UK firms are required to measure and disclose derivatives as prescribed by IAS 32 Financial
Instruments: Disclosure and Presentation and IAS 39 Financial Instruments: Recognition and Measurement.1
IAS 39 prescribes the principles for the recognition and measurement of financial instruments, including derivatives.
Under IFRS, all derivatives, whether used for hedging or trading purposes are measured and reported at fair value
with any changes in the fair value recorded in the income statement or an equity account.2 This was not the case
with UK GAAP, under which firms could measure derivatives used as hedging instruments at historical cost.
Therefore, the reported amounts of these instruments did not have to be adjusted to fair values and derivatives with
zero or negligible historical cost could remain unrecorded in the balance sheet until maturity.
1IFRS 7, applicable for accounting periods beginning on or after 1 January 2007, incorporates the IAS 32
disclosures. The remaining parts of IAS 32 deal with presentation of financial instruments.
2IAS 39 recognizes three types of hedging relationship: a fair value hedge, a cash flow hedge and a hedge of a net
investment in a foreign operation. For fair value hedges the gain or loss on the hedging instrument is recognized
immediately in the income statement. Hedging effectiveness is achieved automatically as the hedged item is
adjusted for fair value changes and its gain or loss is recognized in the income statement. For cash flow hedges the
effective portion of the gain or loss on the hedging instrument is recognized directly in equity and recycled to the
income statement when the hedged cash transaction affects the income statement. Any ineffective portion is
recognized immediately in the income statement. For hedge of a net investment in a foreign entity the accounting
treatment of the hedging instrument is similar to when a cash flow hedge exists. Any gain or loss that has been
recognized in the equity is recycled in the income statement on disposal of the foreign operation. Finally, the
standard requires that gains or losses arising from the changes in the fair values of derivative instruments that are not
part of a hedging relationship or do not qualify for hedge accounting be immediately recognized in the income
statement.
8
In order for hedge accounting to be applied certain conditions must be met under IAS 39. At the inception of the
hedge, formal designation and documentation of the hedging relationship and of the firm's risk management
objective and strategy for the undertaken hedge is required. The hedge must be highly effective and it must be
possible to continuously measure the effectiveness of the hedge throughout all the financial reporting periods for
which the hedge had been designated.3 In contrast, FRS 13 had not imposed such strict requirements for hedge
designation and effectiveness testing of the hedge relationship, therefore, the use of derivatives as hedging
instruments could have been much more easily achieved.
IAS 32 defines the information that must be disclosed concerning financial instruments and prescribes requirements
for their presentation in annual reports. There are many detailed differences between the financial instrument
disclosure requirements in IAS 32 and those in FRS 13. For example, IAS 32 requires credit risk disclosures, whilst
FRS 13 does not. Furthermore, with the adoption of IFRS certain narrative disclosures became mandatory. Firms are
required to describe their financial risk management policies, including hedging, and to provide details on the nature
of risk(s) being hedged, the extent of hedging and the type and duration of each hedging transaction. Firms also have
to disclose separately information for fair value hedges, cash flow hedges and hedges of net investments in a foreign
entity, while there was no such a distinction under UK GAAP.4
The increased mandated disclosures and fair value measurement of financial instruments under IFRS increased the
quality and homogeneity of information regarding the use of derivative instruments and corporate risk management.
We therefore expect that hedge accounting under IFRS will decrease information asymmetry. We expect this to be
reflected in an improvement in the ability of analysts to predict earnings. IFRS require that gains or losses arising
from the changes in the fair values of derivative instruments that do not qualify for hedge accounting be
immediately recognized in the income statement. Because of tighter qualification criteria and rigorous initial hedge
designation rules, and the disallowance of hedges operating at a more macro level and poorly correlated hedges that
3 Hedge effectiveness refers to the degree to which changes in the fair value or cash flows of the hedged item that
are attributed to the hedged risk are offset by changes in the fair value or cash flows of the hedging instrument. This
requires that changes must be almost fully offset, and actual results must be within a range of 80 percent - 125
percent.
4To illustrate the effects of the changes, GlaxoSmithKline Plc’s financial instrument disclosures expanded to nearly
twice their former size and Centrica Plc’s to more than double. New disclosures for both companies included fair
values and categories for derivatives held, increased information about the risk profiles of financial assets and
liabilities, and much more detailed and standardized descriptions of risk exposures.
9
do not satisfy quantitative hedge monitoring rules, hedge accounting is now not allowed where it could have been
carried out previously. Consequently, gains or losses on derivatives under IFRS may well affect the income
statement in a different financial period than the changes in the fair value of the hedged item. Further, the
requirement for all derivatives to be fair valued implies that gains and losses on them can no longer be delayed until
a favourable realization date chosen by management. Whilst it is difficult to disentangle what are substantive
informational effects in these reductions in choice from mechanical accounting effects (management may use
discretion for signalling or opportunistic purposes), the overall effect of such decreases in choice would seem to
point to increased earnings volatility. This would lead to a decrease in earnings forecast accuracy, and more
generally, to lower hedging benefits associated with earnings smoothing.
Finally, the introduction of IFRS may also influence the hedging behavior of firms. The use of certain complex and
not easily justifiable derivatives is likely to be reduced, while firms with limited Treasury resources may abandon
their hedging activities. Using survey data from 39 countries Lins, Servaes, and Tamayo (2009) report that risk
management policies have been affected by the new standards for reporting derivatives (SFAS 133 and IAS 39) for
40 percent of companies. A large fraction of affected firms indicate that their ability to hedge from an economic
perspective has been compromised, while firms substantially reduced the use of non-linear instruments. On the other
hand, as more information on risk exposures and hedging policies enables the market to better assess the hedging
decisions of the firm, the new accounting standards may encourage the optimal use of derivatives (Melumad et al.
1999). Therefore, the overall effect of changes in hedging behavior on asymmetric information, measured by
analysts forecast accuracy, is not clear a priori.
4. The sample
For the implementation of the study we collect data from FTSE 350 firms, covering six fiscal years (2003 to 2008).
Since we study the impact of hedge accounting on corporate risk management, we restrict the sample to non-
financial firms. In addition we delete from the sample any firms that indicate the use of derivatives for speculation.5
5 We identify only a very small number of speculators. In order to classify a firm as a hedger or a speculator we rely
on information provided in the annual report. Firms included in our sample explicitly disclose that they use
derivatives for hedging and provide information on their price exposures. Allayannis and Ofek (2001) and Jin and
Jorion (2005) suggest that the use of derivatives by non-financial firms is associated with lower levels of risk. This
is consistent with firms using derivatives to hedge rather than to speculate.
10
Data for the calculation of the dependent variables are taken from Institutional Brokers Estimates System (IBES).
From IBES we also obtain the forecast date, the date of the actual earnings' announcement, the number of analysts
following and the earnings' stability measure. The Loss variable is calculated based on actual earnings provided by
IBES. Data on hedging activity and the application of hedge accounting are hand-collected from annual reports,
downloaded from Perfect Information database. We use the Thomson Worldscope database to obtain the other
control variables. After we exclude financial firms and the loss of 269 observations because of speculators and
missing forecast, control and explanatory variables data, the final sample comprises 1,011 firm years for tests of
forecast error and 987 firm years for tests of forecast dispersion.
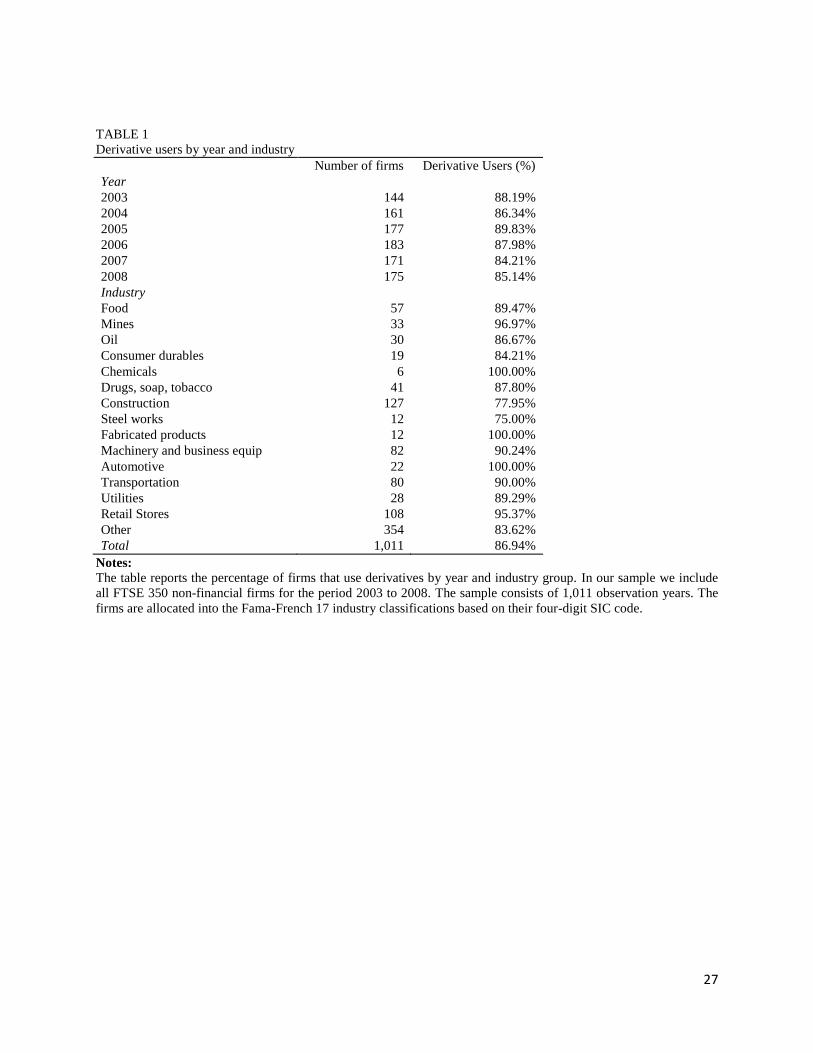
Table 1 provides detailed information on the percentage of firms using derivatives per year and industry group. We
partition our sample according to the Fama-French 17 industry classification, based on their four-digit SIC code. As
we exclude financial firms from the analysis and as no firm in the sample belongs to the Clothes industry, we are left
with 15 industry groups. Of the 1,011 firm year observations we identify derivative usage in 879 (86.94 percent).
This percentage is higher than the percentage of derivative users documented in US studies,6 supporting the
argument that large UK firms use derivatives more widely for risk management. A high percentage of derivative
users implies that firms in the UK market are significantly influenced by changes in accounting treatment and
reporting of financial instruments. This explains the extensive debate concerning the impact of hedge accounting
under IFRS.
(Insert Table 1 here.)
5. Variables and models
Dependent variables
As a proxy for information asymmetry we use analysts' earnings forecast error and dispersion. Following Lang and
Lundholm 1996, we define forecast error as the absolute difference between actual EPS and mean forecasted EPS
scaled by the stock price at the beginning of the financial year. The mean forecasted EPS is computed using all
available forecasts as of the last IBES reporting month prior to the announcement of actual earnings.
6 21.21 percent in Nelson, Moffitt, and Affleck-Graves 2005, 56.7 percent in Guay and Kothari 2003.
11
FErrort = (|ActualEPSt − ForEPSt|)/StockPricet-1 (1)
Forecast dispersion measures consensus among analysts. As in Chang et al. 2000, we calculate forecast dispersion as
the standard deviation of the analysts' forecasted EPS, scaled by the absolute mean analyst forecast.
FDispt = StDev(ForEPSt)/|ForEPSt| (2)
(Insert Table 2 here.)
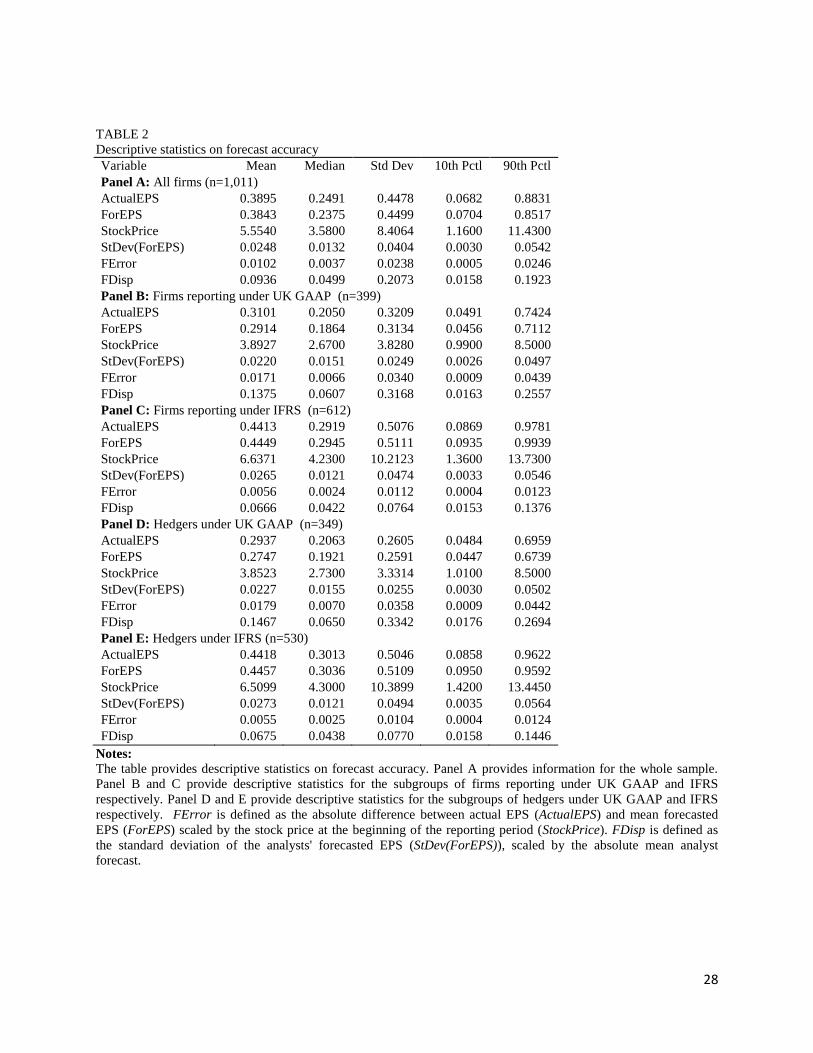
Table 2 provides summary statistics for the dependent variables. Panel A describes the distribution of forecast error
and dispersion for the whole sample. Panel B and C provide descriptive statistics for the subgroups of firms
reporting under UK GAAP and IFRS respectively. Panel D and E provide descriptive statistics for the subgroups of
hedgers under UK GAAP and IFRS respectively. From Table 2 we can see that hedgers under IFRS have lower
mean, median and standard deviation of forecast error and dispersion. The magnitude of the change in mean forecast
error after the introduction of IFRS for hedgers is similar to the one reported in Ashbaugh and Pincus 2001.
Independent and control variables
To test our hypotheses we use three indicator variables. The first indicates the application of IFRS. Hence, IFRS
takes the value 1 if the firm reports under IFRS in the current financial year and 0 otherwise. Hedge equals 1 if the
firm uses derivatives to hedge any type of financial risk and 0 otherwise. Finally, we include the interaction of IFRS
and Hedge (IFRSHedge).
For the multivariate analysis several control variables are used, based on the extensive literature on forecast
accuracy determinants.7 The literature suggests that forecast error and dispersion are influenced by:
1. Firm size: Atiase (1985) argues that larger firms are likely to have less asymmetric information due to
higher institutional ownership and greater analyst following. To control for firm size we use the natural log
of the market value of the firm (LnMarketValue). A negative coefficient is expected.
7 See for example Lang and Lundholm 1996, Hope 2003 and Irani and Karamanou 2003.
12
2. Earnings' variability: We measure the consistency of earnings per share growth using the natural log of the
earnings stability measure, provided by IBES (LnEarnStab). The lower the number, the more uniform
growth has been.8 Hence, we expect a positive coefficient.
3. Leverage: More levered firms have incentives to smooth earnings. However, highly levered firms are likely
to have more pronounced cyclical effects. To control for capital structure we use the book value of long
term debt divided by the market value of the firm (Leverage). The sign of the Leverage coefficient is not
clear a priori.
4. Market to book value: Firm with higher growth opportunities may have earnings that are less predictable.
To control for growth opportunities we include the ratio of market value to book value (MarkettoBook).
5. Analyst following: The number of analysts following (Numest), is a proxy for the intensity of competition
and thus for the incentives to forecast accurately.
6. Negative earnings: Previous research documents that is more difficult for analysts to forecast earnings for
firms that show losses. A binary variable equals 1 if the firm had negative EPS for the last reporting year
and 0 otherwise (Loss). A positive coefficient is expected.
7. Level of earnings: Studies find increasing forecast optimism (pessimism) as the level of firm earnings
declines below (increases above) the average earnings (Eames and Glover 2003). To control for the level of
earnings we use actual earnings per share divided by the stock price at the beginning of the reporting year
(Earnings).
8. Time and Industry effects: We use year-fixed effects, and industry-fixed effects based on the Fama and
French 17-industry classification.
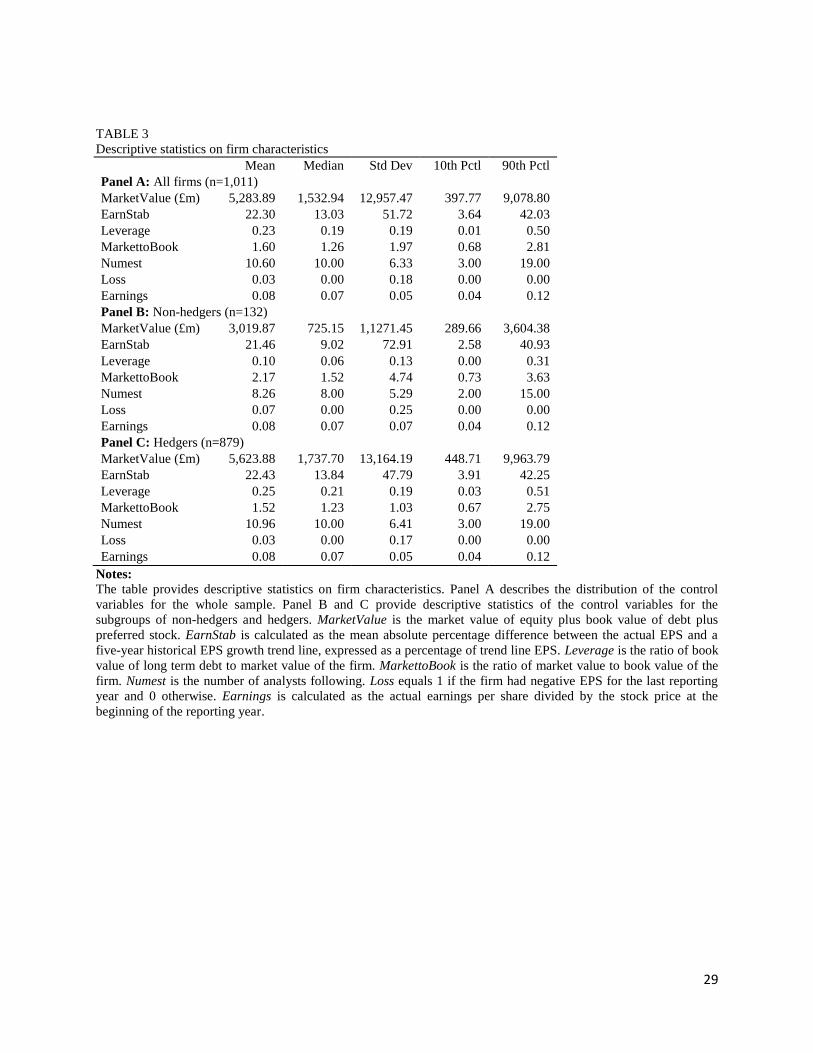
Table 3 provides summary statistics for the main control variables. Panel A describes the distribution of firm
characteristics for the whole sample. Panel B describes the subgroup without hedging activity and Panel C with
hedging activity. From Panel B and C we can see that non-hedgers have lower market value than hedgers,
supporting empirical evidence that larger firms hedge more. In line with studies that argue that firms hedge in order
to increase debt capacity, hedgers are more levered.
(Insert Table 3 here.)
8 EarnStab is calculated as the mean absolute percentage difference between the actual EPS and a five-year
historical EPS growth trend line, expressed as a percentage of trend line EPS.
13
In order to test our hypotheses we use Differences-in-Differences (DD) estimation which has the potential to
circumvent many of the endogeneity problems that arise when comparing heterogeneous firms (Bertrand, Duflo, and
Mullainathan 2004). In order to control for the panel data structure we estimate regressions adjusted to account for
correlation within firm clusters (Wooldridge 2003). The following model is estimated:
DepVari = a + β1IFRSi + β2Hedgei + β3IFRSHedgei + ∑jγj Controls ji + εi (3)
where DepVar stands for analysts’ earnings forecast error and dispersion and Controls denotes our set of control
variables. As our sample includes both hedgers and non-hedgers, the coefficient of IFRS captures the general
impact of IFRS on forecast accuracy. It is crucial to control for the general impact of IFRS introduction as a number
of other financial reporting changes were introduced at the same time as the new hedge accounting regime.
Similarly, the coefficient of Hedge captures the general impact of hedging on forecast accuracy. The incremental
effect of hedging under IFRS is captured by the coefficient of IFRSHedge. A negative IFRSHedge coefficient
indicates that hedge accounting under IFRS increases the predictability of earnings, whereas, a positive coefficient
indicates that hedge accounting under IFRS influences negatively the ability of analysts to forecast earnings.
6. Results
Univariate analysis indicates lower forecast error and dispersion for firm years that derivative usage is reported
according to IFRS. These differences may be due to a number of other characteristics that influence forecast
accuracy, including size, capital structure, stability and level of earnings. In order to isolate the effects of hedge
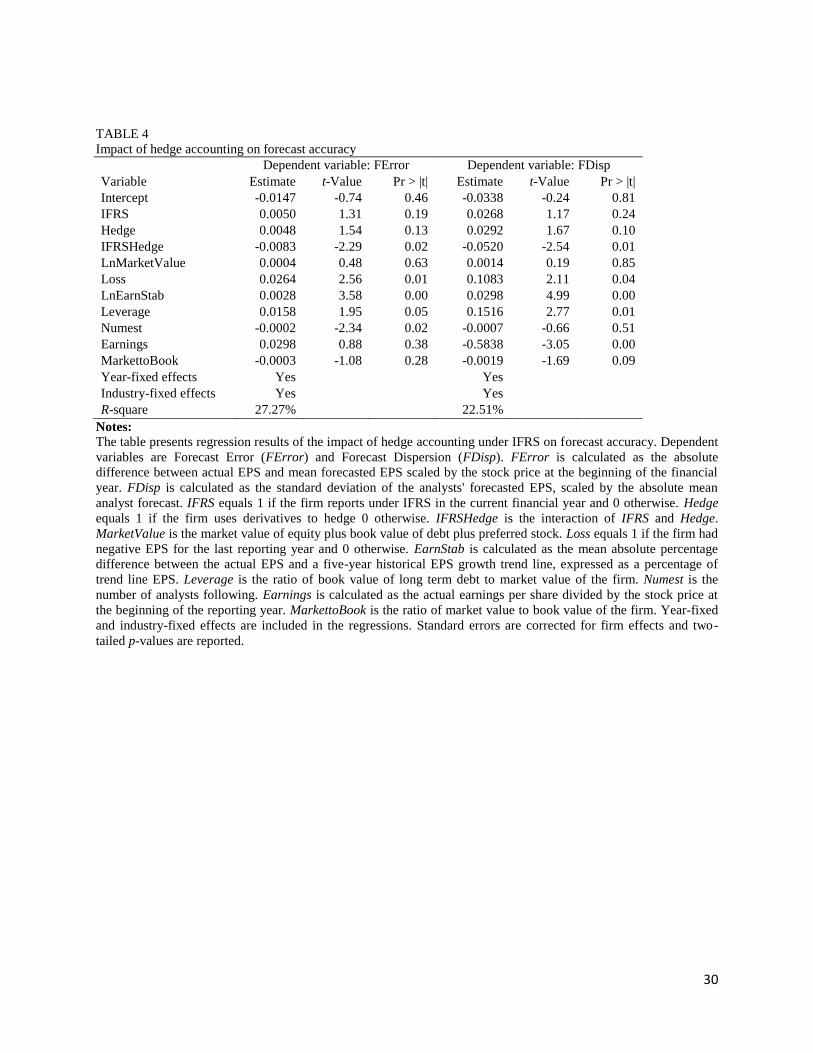
accounting we use multivariate analysis. Table 4 presents regression results. We winsorize the dependent variables
at the 99th
percentile, in order to mitigate the effect of outliers. Two-tailed p-values are reported.
(Insert Table 4 here.)
For both forecast error and forecast dispersion, the IFRSHedge coefficient is negative and significant. These findings
suggest that hedge accounting under IFRS increases the predictability of earnings. Hence, the positive effects of the
increase in the transparency of derivatives usage dominate any negative effects arising from the increase in earnings
volatility and/or deviation from optimal hedging policy. The R-square is 27.27 percent and 22.51 percent for FError
and FDisp respectively.
14
The coefficient of the variable IFRS, that captures the general impact of IFRS implementation on forecast accuracy,
is insignificant. This is not surprising, as overall the evidence on the effects of IFRS adoption is mixed (Ashbaugh
and Pincus 2001; Daske et al. 2008; Li 2010). Using a European sample of publicity traded companies Byard, Li,
and Yu (2008) show that the effect of mandated IFRS adoption on analysts' forecast error is influenced by the
difference between domestic GAAP and IFRS. Our results are in line with the above argument. In other words, we
do not expect to see an overall positive impact on forecast accuracy in countries, as for example the UK, where the
local GAAP do not differ substantially from IFRS. Any impact on forecast accuracy after IFRS introduction is
expected to be driven by these specific standards that introduce important changes in accounting treatment and/or
financial reporting.
Contrary to the findings of DaDalt et al. 2002, we do not find evidence that hedging increases forecast accuracy.
This suggests that before the introduction of IFRS hedging activity did not serve as a means to reduce information
asymmetry in the UK market. However, the high percentage of derivative users indicates that firms derived some
other benefits from hedging activity, such as reduction of financial distress costs, tax benefits and reduction of
underinvestment costs. As expected, the coefficients of the control variables Loss and LnEarnStab have a positive
sign, implying that forecast accuracy is lower for firms with losses in the previous year and higher earnings
volatility. The multivariate analysis indicates that forecast accuracy decreases with leverage. In line with earlier
studies, analyst following is negatively related to forecast error. The coefficients of LnMarketValue are insignificant.
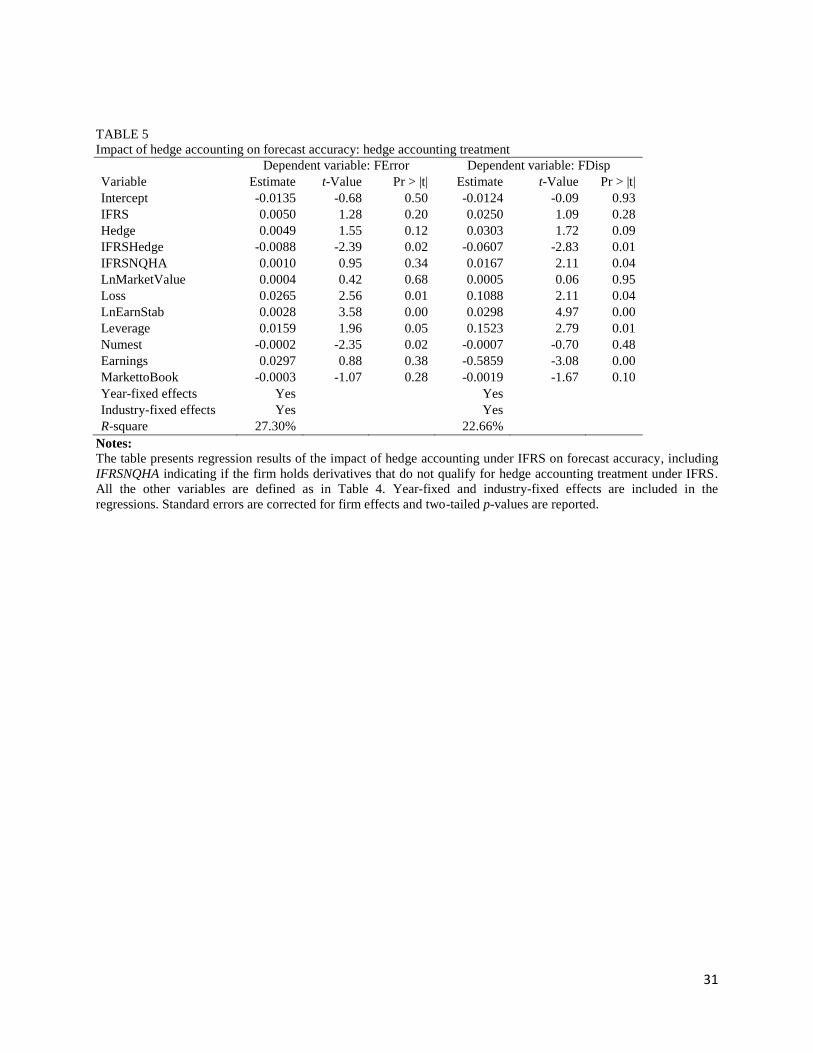
In the next stage of the analysis we include an additional variable indicating whether a firm's derivatives position
qualifies for hedge accounting treatment under IFRS. IFRSNQHA equals 1 if some or all derivatives do not qualify
for hedge accounting treatment under IFRS and 0 otherwise.9 Changes in the fair value of derivatives that do not
qualify for hedge accounting are immediately recognized in the income statement, increasing earnings' volatility.
Therefore we expect IFRSNQHA to be positively related to forecast error and dispersion.
9Such information on non-qualification may be directly given in annual reports. In some cases however, it is
deduced from the way financial instruments are categorized. For example a firm may state that it does not use
derivatives for trading but has the following categories of derivatives in the annual report: cash flow hedge, fair
value hedge, hedge of net investment, derivatives classified as held for trading. Under the last category, the firm
discloses the derivatives that are used for financial risk management but do not qualify for hedge accounting.
Furthermore, some firms state that they choose not to apply hedge accounting, mainly due to the workload and other
costs associated with the qualification process. Of hedgers that report under IFRS, 52.83 percent indicate that some
or all of their derivatives do not qualify for hedge accounting treatment.
15
(Insert Table 5 here.)
Consistent with our hypothesis, the coefficient of IFRSNQHA is positive, however, it is significant only for FDisp.
This could be largely due to the noise in our measure for hedge accounting qualification. The variable does not
capture the size of the derivatives position that does not qualify for hedge accounting treatment and therefore the
magnitude of the impact on firm's earnings. However, due to non-availability of data, we cannot use a more
precisely measured variable.
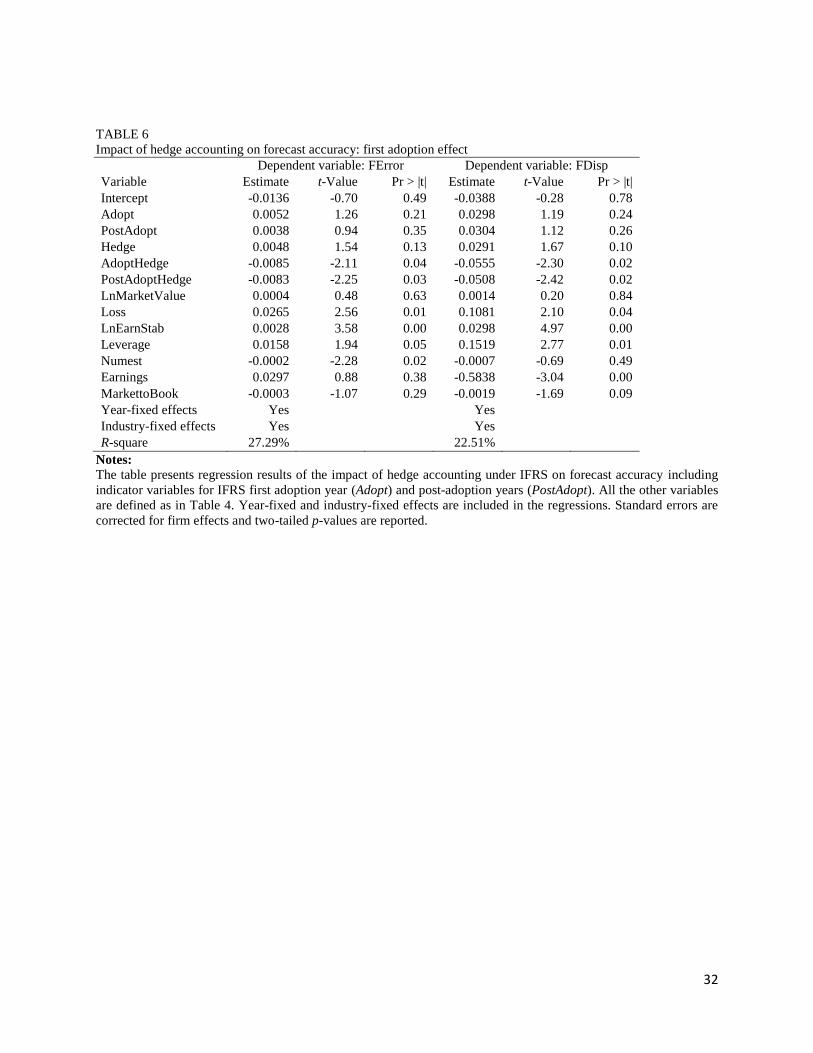
Next, we examine the effect of hedge accounting under IFRS separately for the year of the adoption and the
subsequent years. During the year of IFRS adoption firms release information mandated by IFRS through interim
reports and press releases. It is therefore possible that our results capture an early reaction to hedge accounting
standards that disappears when the market becomes more familiar with the new financial reporting regime. Adopt
equals 1 if the firm reports under IFRS for the first time and 0 otherwise. PostAdopt equals 1 if an observation is
from any year after the IFRS adoption year and 0 otherwise. AdoptHedge is the interaction of Hedge and Adopt and
PostAdoptHedge is the interaction of Hedge and PostAdopt. From Table 6 we can see that the AdoptHedge and
PostAdoptHedge coefficients are negative and significant at the 5 percent level. The size of the coefficients is
comparable, indicating that hedge accounting under IFRS influences the predictability of earnings similarly in the
year of the first adoption and in the following years.
(Insert Table 6 here.)
Controlling for endogeneity
If the firms that choose to hedge after the introduction of IFRS are not a random sample of firms, the estimate of the
coefficient of IFRSHedge will be biased. To control for the self-selection bias we use Heckman's 1979 correction.
Based on corporate risk management theories, we build the empirical model to explain the hedging decision.10
Mayers and Smith (1982) and Smith and Stulz (1985) argue that hedging reduces the probability that the firms
encounter financial distress, by reducing the variability of the firm value. Since the probability of encountering
financial distress is higher for firms with lower interest cover, less liquidity and smaller size, these firms have higher
10
For similar empirical models see Nance, Smith, and Smithson 1993 and Mian 1996.
16
incentives to hedge. To control for these we include the ratio EBIT to total interest expenses (EBITtoInterest), the
current ratio (CurrentRatio) and the natural log of total assets (LnAssets). LnAssets is also used to control for
informational and transactional economies of scale arguments (Booth, Smith, and Stolz 1984), so the sign of the
coefficient is not clear a priori. If the effective tax function is convex, risk management adds value by ensuring that
over a complete business cycle taxable income falls within the optimal tax rate band (Stulz 1996). The corporate tax
schedule can be convex because of a progressive tax regime as well as because of special tax preference items, like
foreign tax credits and investment tax credits. Therefore, we expect firms with tax credits to be more likely to
hedge.11
TaxCredits equals 1 if the firm has income tax credits and 0 otherwise. Hedging increases firm value by
ensuring greater availability of internal funds to take advantage of value-enhancing investment opportunities when
external capital is more costly than internally generated resources (Froot et al. 1993). Therefore, hedging incentives
are greater the higher the investment opportunities. We control for this using the ratio of capital expenditures to sales
(CapExptoSales). Finally, firms can also reduce the probability of default by investing in more liquid assets or by
imposing restrictions on dividend payout ratios. We control for hedging substitutes by including the current ratio
(CurrentRatio) and dividend yield (DividendYield). All the variables used to explain the hedging decision are
obtained from Thomson Worldscope database.
The results from estimating the probit model are presented in Table 7. The Pearson's test does not indicate that the
observed frequency distribution differs from the theoretical distribution, while the model shows no evidence of lack
of fit based on the Hosmer-Lemeshow test (Hosmer and Lemeshow 1989).
(Insert Table 7 here.)
In the second-stage equation, we include the self-selection parameter (λ) calculated from the probit regression. The
results are presented in Table 8. Due to the additional data requirements the number of observation years reduces to
988 for FError and 965 for FDisp. For both models the coefficient of the correction for self-selection (λ) is
insignificant, while the IFRSHedge coefficient continues to be negative and significant. These findings suggest that
the reduced asymmetric information for hedgers after the introduction of IFRS is not a result of self-selection.
(Insert Table 8 here.)
11
Since the majority of listed firms have pre-tax profits above the progressive region the effect of a progressive tax
regime on our sample is likely to be relatively small.
17
Further sensitivity analyses
To test the sensitivity of our results to dependent variables, we re-estimate regressions first using the median as a
consensus forecast instead of mean, and second excluding observations with the number of analysts following
smaller than three. The inference of our results does not change; hedge accounting under IFRS reduces the level of
asymmetric information. We also get very similar results in terms of sign and significance when we delete
observations for which dependent variables fall above the 99th
percentile of their respective distributions. The mean
stock price at the beginning of the financial year is higher in the post-IFRS period compared to the pre-IFRS period.
In order to ensure that our results are not driven by this we run our tests using alternative scalars. Scaling forecast
error by the mean forecast and EPS for the previous reporting year does not change the inference of our results
(Hope 2003).
Additionally, we evaluate whether our results hold when using forecasted earnings reported four months rather than
one month before the actual earnings announcement. The coefficients of the independent and control variables are
very similar to those of the main analysis in terms of sign and significance. We re-estimate regressions dividing the
sample into medium and large size firms. The results do not indicate any differences between the effects of hedge
accounting experienced by medium and large size firms. We also identify no differences in the effects of IFRS
introduction and hedging activity. Estimating the models using firm-fixed effects does not change the inference of
our results.12
Our results are also robust if we delete the firms that enter the sample post-IFRS adoption.
Studies in corporate risk management indicate that hedging is driven by economies of scale, and therefore,
derivative usage is more heavily concentrated in large firms (Nance et al. 1993). As our sample covers large firms,
we expect that on average hedging activity is important to the firms. However, we also investigate the effects of
hedge accounting under IFRS using the ratio of notional value of derivatives to market value of the firm as
continuous measure of the hedging activity (Nelson et al. 2005). In line with our presumption, the coefficients of
IFRS interaction with the continuous hedging variable are negative. However, the relationship is not statistically
12 The reason we do not use this as our main estimation method is that during our sample period only a small
number of firms initiate or stop hedging with derivatives. As this model relies on the time variation in right hand
side variables and the left hand side outcomes for a given firm, the statistical power is limited when the underlying
variables vary slowly over time (Li and Prabhala 2005).
18
significant. This is not surprising, given the imperfect nature of our measure of hedging intensity.13
Finally, as the
literature focused largely on interest rate and currency hedging, we re-estimate the models considering only interest
rate and currency hedgers. The results are in line with the results presented in Table 4.
Factors that influence forecast accuracy
An important challenge of our analysis is that hedge accounting has a number of effects on the predictability of
earnings. While we find that positive effects dominate, it is difficult to identify the relative importance of the
different factors that influence forecast accuracy. In this subsection we try to investigate the channels through which
the benefits of hedge accounting under IFRS arise.
Ideally, we would like to investigate whether the increased predictability of earnings in our sample post-IFRS is
influenced by changes in hedging behavior. However, evaluating directly changes in hedging behavior based on
annual report data is not feasible, given that under UK GAAP firms were providing little information regarding the
use of derivatives.14
In order to overcome such data availability constraints, we instead examine whether forecast
accuracy is higher for firms that voluntary disclosed more detailed information on derivatives under UK GAAP.15
Table 9 presents regression results including an additional variable (DerRepUKGAAP), indicating whether the firm
disclosed voluntary more detailed information on hedging under UK GAAP.
(Insert Table 9 here.)
13
As the disclosure of notional values is non-mandatory both under UK GAAP and IFRS, the number of
observations for which notional value is available is much smaller (326) than the total number of observations that
hedging activity is identified in our sample (879), and, some firms may report only part of the notional value of their
derivative position. In addition, notional positions are reported at fiscal year ends, and so can differ from the average
notional value of derivatives held during the fiscal year. 14
After the introduction of IFRS only one firm stopped hedging in our sample, and only a small number of firms
(nine) started reporting the use of financial instruments for hedging. We cannot be sure whether these firms initiated
their hedging program after IFRS introduction or just started reporting the use of derivatives. We also examined the
use of non-linear instruments, as those are harder to qualify for hedge accounting treatment under IFRS. We find
that two firms abandoned the use of such instruments, while three firms started reporting their use. Overall, the
changes are very small, and they cannot be attributed entirely to the introduction of IFRS, as they may be driven by
changes in the risk exposure of the firms. 15
We consider that firms report more detailed information on derivatives under UK GAAP if they disclose
information on at least two of the following areas: (1) notional values of the derivatives, (2) maturity structure of the
derivative instruments, and (3) the type of instruments used (i.e., forwards/futures, swaps, and options). This
approach of characterizing the extent of derivative reporting represents a practical method to deal with the lack of
comparability of derivative disclosures provided under UK GAAP, as the extent and quality of derivative
disclosures vary considerably among firms.
19
In line with our presumption, the coefficient of DerRepUKGAAP is negative, indicating that forecast error and
dispersion are lower under UK GAAP for firms that voluntary report more information on derivatives. These results
suggest that increased forecast accuracy is driven by a decrease in information asymmetry rather than by changes in
hedging behaviour post-IFRS. Since reduced information asymmetry is associated with important benefits for the
firm, one might wonder why all UK firms did not voluntarily disclose IFRS-type information under UK GAAP. A
possible explanation is that while hedge accounting under IFRS increases the predictability of earnings, it could also
adversely affect other hedging benefits. For example, increased volatility of earnings resulting from fair value
measurement decreases hedging benefits associated with financial distress costs and taxes. DeMarzo and Duffie
(1995) show that if hedge transactions are not disclosed, managers hedge more than they would under a full
disclosure regime. Therefore, the hedging disclosure decision may be also influenced by managerial risk aversion.
Second, we investigate the effect of hedge accounting under IFRS using an alternative proxy for information
asymmetry, the bid-ask spread. In using such a proxy, the tests are not restricted to comparisons of accounting
measures, in our case earnings, but capture differences in the financial reporting more broadly (Leuz 2003). This
enables us to shed some light on whether our results are driven by a reduction in information asymmetry after IFRS
introduction rather than earnings becoming more stable for derivative users and therefore easier to predict. Welker
(1995) and Daske et al. (2008) suggest that bid-ask spread is associated with firm's disclosure and accounting
policies. In our setting, increased IFRS disclosures regarding risk exposure and the use of derivatives are expected to
decrease the bid-ask spread.
Bid-ask spread is the daily quoted spread, measured at the end of each trading day as the difference between the bid
and ask price divided by the midpoint. We then compute the mean daily spread over the financial year.16
The
literature suggests that bid-ask spreads are negatively associated with trading volume and size, and positively
associated with return variability (Leuz and Verrecchia 2000; Daske et al. 2008). Similarly to our previous analysis
based on forecast accuracy, we control for size using the natural logarithm of market capitalization
(LnMarketValue). ShareTurnover, calculated as the annual trading UK£ volume divided by the market value of
outstanding equity is used to control for trading volume. ReturnVariability is the annual standard deviation of
16
We get similar results in terms of sign and significance when the measurement period starts in month -10 and ends
in month +2 relative to the firm's fiscal year-end. This measurement period matches the one used for forecast error
and dispersion.
20
monthly stock returns. We obtain financial data from Thomson Worldscope and price and trading volume data from
Datastream.
(Insert Table 10 here.)
Table 10 provides summary statistics for bid-ask spread and the additional control variables. Panel A describes the
distribution of firm characteristics for the whole sample. Panel B describes the subgroup without hedging activity
and Panel C with hedging activity. From Panel B and C we can see that non-hedgers have higher bid-ask spread and
lower trading volume and return variability than hedgers. The number of observations reduces to 972 due to missing
data. As in Daske et al. 2008, we lag the control variables by one year. In order to control for the panel data
structure, we estimate regressions results adjusted to account for correlation within firm clusters.
(Insert Table 11 here.)
Table 11 reports regression results. The coefficient of IFRSHedge is negative and significant, indicating that
derivative users reporting under IFRS experience a decrease in information asymmetry. The size of the coefficient is
similar to that reported in Daske et al. 2008 for voluntary adopters when they switch to IFRS ahead of mandatory
change or in the year of such change. In line with the literature, firm size and share turnover negatively influence
bid-ask spread and the coefficient of ReturnVariability is positive. In the last three columns we present regression
results after including the variable IFRSNQHA, indicating non-qualification for hedge accounting treatment. While
changes in the fair value of derivatives that do not qualify for hedge accounting can increase earnings’ volatility, and
therefore reduce the predictability of earnings, IFRSNQHA is not expected to directly influence the bid-ask spread.
However, firms that hold derivatives that do not qualify for hedge accounting treatment may choose to provide less
information in their annual report regarding risk management policy. The sign of IFRSNQHA is insignificant,
suggesting that hedgers under IFRS experience a decrease in the bid-ask spread, irrespective of the hedge accounting
treatment.
Overall, our results support the hypothesis that hedge accounting under IFRS decreases information asymmetry. The
effect of hedge accounting under IFRS on both forecast accuracy and bid-ask spread in our sample is relatively
strong. This is not surprising, as we evaluate the effect of hedge accounting under IFRS on large UK firms with
significant hedging activity. Because of this our results need to be interpreted with caution. Hedge accounting
21
effects are likely to be smaller in countries where hedging activity is less widespread, because of low hedging
incentives or less developed markets for derivatives, and also for smaller firms, as literature suggests that smaller
firms have limited hedging activities. In addition, the effect of hedge accounting on asymmetric information is
expected to be less pronounced in countries that firms were reporting IFRS-type information on derivatives under
their prior local GAAP. Finally, we appreciate that the overall economic effect of hedge accounting cannot be
assessed in isolation without also considering its effects on other hedging benefits. Future research should directly
examine the impact of this new hedge accounting regime on the cost of capital, liquidity and firm value.
7. Conclusions
Accounting for derivatives as prescribed by IFRS stirred important debate about its effect on corporate risk
management. On the one hand, it is argued that the increased mandated disclosure and fair value measurement of
derivatives increases the quality and homogeneity of information regarding their use and corporate risk
management. On the other hand, concerns are expressed regarding the ability of the corporations to qualify for
hedge accounting treatment. Therefore, hedging under IFRS can affect earnings volatility and/or lead to adjustment
in the hedging behavior of the firm in an attempt to achieve more desirable accounting results.
Investigating the periods surrounding IFRS adoption, we show that under the new hedge accounting regime,
earnings are more predictable. Specifically, for firms that measure and report derivatives under IFRS, we find that
analysts' forecast error and dispersion are significantly lower. Hedge accounting influences the predictability of
earnings similarly in the year of the first adoption and in the following years. We provide weak evidence that
forecast accuracy is lower for firms that hold derivative positions that do not fully qualify for hedge accounting
treatment under IFRS. The sensitivity analyses show that our results hold when we change the definition of
dependent variables, control for outliers, use forecast data for different periods prior to the earnings' announcement,
and control for self-selection. Our results contribute to prior research on the effects of accounting for derivatives and
on the adoption of IFRS.
Whether changes in hedge accounting have a positive effect on firm valuation is a question to be answered by future
research. As our sample only covers the period 2003-2008, the results may capture the early reaction to hedge
accounting standards. This may change as the market becomes more familiar with the new financial reporting

22
regime. Future research should focus on evaluating the longer term effect of hedge accounting under IFRS. It would
be also interesting to explore further firm-specific factors that may influence the magnitude of the effect as well as
the effects of hedge accounting under IFRS on other benefits associated with hedging.
23
References
Acker, D., J. Horton, and I. Tonks. 2002. Accounting standards and analysts’ forecast: The impact of IFRS3 on
analysts’ ability to forecast EPS. Journal of Accounting and Public Policy 21(3): 193-217.
Allayannis, G., and E. Ofek. 2001. Exchange rate exposure, hedging and the use of foreign currency derivatives.
Journal of International Money and Finance 20(2): 273-296.
Armstrong, C.S., M.E. Barth, A.D. Jagolinzer, and E.J. Riedl. 2009. Market reaction to the adoption of IFRS in
Europe. Accounting Review 85(1): 31-61.
Ashbaugh, H., and M. Pincus. 2001. Domestic accounting standards, international accounting standards, and the
predictability of earnings. Journal of Accounting Research 39(3): 417-434.
Atiase, R.K. 1985. Predisclosure information, firm capitalization, and security price behavior around earnings
announcements. Journal of Accounting Research 23(1): 21-36.
Bertrand, M., E. Duflo, and S. Mullainathan. 2004. How much should we trust differences-in-differences estimates?
Quarterly Journal of Economics 119(1): 249–275.
Booth, J.R., R.L. Smith, and R.W. Stolz. 1984. The use of interest futures by financial institutions. Journal of Bank
Research 15: 15-20.
Byard, D., Y. Li, and Y. Yu. 2010. The effect of mandatory IFRS adoption on analysts’ forecast error. Journal of
Accounting Research 49(1): 69-96.
Chang, J.J., T. Khanna, and K. Palepu. 2000. Analyst activity around the world. Working Paper, HBS Strategy Unit
No. 01-061.
Christensen, H.B., E. Lee, and M. Walker. 2007. Cross-sectional variation in the economic consequences of
international accounting harmonisation: The case of mandatory IFRS adoption in the UK. International Journal of
Accounting 42(4): 341-379.
Covrig, V.M, M.L. Defond, and M. Hung. 2007. Home bias, foreign mutual fund holdings, and the voluntary
adoption of International Accounting Standards. Journal of Accounting Research 45(1): 41-70.
DaDalt, P.J., G.D. Gay, and J. Nam. 2002. Asymmetric information and corporate derivative use. Journal of Futures
Markets 22(3): 241-267.
24
Daske, H., L. Hail, C. Leuz, and R. Verdi. 2008. Mandatory IFRS reporting around the world: Early evidence on the
economic consequences. Journal of Accounting Research 46(5): 1085-1142.
DeMarzo, P., and D. Duffie. 1995. Corporate incentives for hedging and hedge accounting. Review of Financial
Studies 8(3): 743-771.
Eames, M.J., and S.M. Glover. 2003. Earning predictability and the direction of analysts’ earnings forecast errors.
Accounting Review 78(3): 707-724.
Easley, D., and M. O’Hara. 2004. Information and the cost of capital. Journal of Finance 59(4): 1553-1583.
Francis, J.R., and C.S. Lennox. 2008. Selection models in accounting research. Working Paper, University of
Missouri-Columbia, and Hong Kong University of Science and Technology.
Froot, K.A., D.S. Scharfstein, and J.C. Stein. 1993. Risk management: Coordinating corporate investment and
financing policies. Journal of Finance 48(5): 1629-1658.
Geczy, C., B.A. Minton, and C. Schrand. 1997. Why firms use currency derivatives. Journal of Finance 52(4):
1323-1354.
Guay, W., and S.P. Kothari. 2003. How much do firms hedge with derivatives? Journal of Financial Economics
70(3): 423-461.
Heckman, J.J. 1979. Sample selection bias as a specification error. Econometrica 47(1): 153-161.
Hosmer, D.W., and S. Lemeshow. 1989. Applied Logistic Regression. Wiley.
Hope, O.K. 2003. Accounting policy disclosures and analysts’ forecast. Contemporary Accounting Research 20(2):
295-321.
Irani, A.J., and I. Karamanou. 2003. Regulation fair disclosure analyst following, and analyst forecast dispersion.
Accounting Horizons 17(1): 15-29.
Jin, Y., and P. Jorion. 2006. Firm value and hedging: Evidence from US oil and gas producers. Journal of Finance
61(2): 893-919.
Lang, M.H., and R.J. Lundholm. 1996. Corporate disclosure policy and analyst behavior. Accounting Review 71(4):
467-492.
Leland, H.E. 1998. Agency cost, risk management and capital structure. Journal of Finance 53(4): 1213-1243.
Leuz, C. 2003. IAS Versus U.S. GAAP: Information asymmetry-based evidence from Germany's New Market.
Journal of Accounting Research 41 (3): 445-472.
25
Leuz, C., and R.E. Verrecchia. 2002. The economic consequences of increased disclosure. Journal of Accounting
Research 38(3): 91-124.
Li, K., and N.R. Prabhala. 2005. Self-selection models in corporate finance. Working Paper, University of
Maryland, Maryland, United States.
Li, S. 2010. Does mandatory adoption of International Financial Reporting Standards in the European Union reduce
the cost of equity capital? Accounting Review 85(2): 607-636.
Lins, K.V., H. Servaes, and A. Tamayo. 2009. Does fair value reporting affect risk management? International
survey evidence. Financial Management Forthcoming.
Mayers, D., and C.W. Smith. 1982. On the corporate demand for insurance. Journal of Business 55(2): 281-29.
Melumad, N.D., G. Weyns, and A. Ziv. 1999. Comparing alternative hedge accounting standards: Shareholders
perspective. Review of Accounting Studies 5(4): 265-292.
Mian, S.L. 1996. Evidence on corporate hedging policy. Journal of Financial and Quantitative Analysis 31(3): 419-
439.
Myers, S.C., and N.S. Majluf. 1984. Corporate financing and investment decisions when firms have information that
investors do not have. Journal of Financial Economics 13(2): 187-221.
Nance, D.R., C.W. Smith, and C.W. Smithson. 1993. On the determinants of corporate hedging. Journal of Finance
48(1): 267-284.
Nelson, J.M., J.S. Moffitt, and J. Affleck-Graves. 2005. The impact of hedging on the market value of equity.
Journal of Corporate Finance 11(5): 851-881.
Peek, E. 2005. The influence of accounting changes on financial analysts’ forecast accuracy and forecasting
superiority: Evidence from the Netherlands. European Accounting Review 14(2): 261-295.
Ross, M.P. 1998. Corporate hedging: What, why and how?. Working paper, University of California.
Smith, C.W., and R.M. Stulz. 1985. The determinant of firms’ hedging policies. Journal of Financial and
Quantitative Analysis 20(4): 391-402.
Stulz, R.M. 1996. Rethinking risk management. Journal of Applied Corporate Finance 9(3): 8-24.
26
Vanstraelen, A., M.T. Zarzeski, and S.W.G. Robb. 2003. Corporate non-financial disclosure practices and financial
analyst forecast ability across three European countries. Journal of International Financial Management and
Accounting 14(3): 249-278.
Welker, M. 1995. Disclosure policy, information asymmetry, and liquidity in equity markets. Contemporary
Accounting Research 11(2): 801-827.
Wooldridge, J.M. 2003. Cluster-sample methods in applied econometrics. American Economic Review 93(2): 133-
138.
Woods, M., and D.E.W. Marginson. 2004. Accounting for derivatives: An evaluation of reporting practice by UK
banks. European Accounting Review 13(2): 373-391.
27
TABLE 1
Derivative users by year and industry
Number of firms Derivative Users (%)
Year
2003 144 88.19%
2004 161 86.34%
2005 177 89.83%
2006 183 87.98%
2007 171 84.21%
2008 175 85.14%
Industry
Food 57 89.47%
Mines 33 96.97%
Oil 30 86.67%
Consumer durables 19 84.21%
Chemicals 6 100.00%
Drugs, soap, tobacco 41 87.80%
Construction 127 77.95%
Steel works 12 75.00%
Fabricated products 12 100.00%
Machinery and business equip 82 90.24%
Automotive 22 100.00%
Transportation 80 90.00%
Utilities 28 89.29%
Retail Stores 108 95.37%
Other 354 83.62%
Total 1,011 86.94%
Notes:
The table reports the percentage of firms that use derivatives by year and industry group. In our sample we include
all FTSE 350 non-financial firms for the period 2003 to 2008. The sample consists of 1,011 observation years. The
firms are allocated into the Fama-French 17 industry classifications based on their four-digit SIC code.
28
TABLE 2
Descriptive statistics on forecast accuracy
Variable Mean Median Std Dev 10th Pctl 90th Pctl
Panel A: All firms (n=1,011)
ActualEPS 0.3895 0.2491 0.4478 0.0682 0.8831
ForEPS 0.3843 0.2375 0.4499 0.0704 0.8517
StockPrice 5.5540 3.5800 8.4064 1.1600 11.4300
StDev(ForEPS) 0.0248 0.0132 0.0404 0.0030 0.0542
FError 0.0102 0.0037 0.0238 0.0005 0.0246
FDisp 0.0936 0.0499 0.2073 0.0158 0.1923
Panel B: Firms reporting under UK GAAP (n=399)
ActualEPS 0.3101 0.2050 0.3209 0.0491 0.7424
ForEPS 0.2914 0.1864 0.3134 0.0456 0.7112
StockPrice 3.8927 2.6700 3.8280 0.9900 8.5000
StDev(ForEPS) 0.0220 0.0151 0.0249 0.0026 0.0497
FError 0.0171 0.0066 0.0340 0.0009 0.0439
FDisp 0.1375 0.0607 0.3168 0.0163 0.2557
Panel C: Firms reporting under IFRS (n=612)
ActualEPS 0.4413 0.2919 0.5076 0.0869 0.9781
ForEPS 0.4449 0.2945 0.5111 0.0935 0.9939
StockPrice 6.6371 4.2300 10.2123 1.3600 13.7300
StDev(ForEPS) 0.0265 0.0121 0.0474 0.0033 0.0546
FError 0.0056 0.0024 0.0112 0.0004 0.0123
FDisp 0.0666 0.0422 0.0764 0.0153 0.1376
Panel D: Hedgers under UK GAAP (n=349)
ActualEPS 0.2937 0.2063 0.2605 0.0484 0.6959
ForEPS 0.2747 0.1921 0.2591 0.0447 0.6739
StockPrice 3.8523 2.7300 3.3314 1.0100 8.5000
StDev(ForEPS) 0.0227 0.0155 0.0255 0.0030 0.0502
FError 0.0179 0.0070 0.0358 0.0009 0.0442
FDisp 0.1467 0.0650 0.3342 0.0176 0.2694
Panel E: Hedgers under IFRS (n=530)
ActualEPS 0.4418 0.3013 0.5046 0.0858 0.9622
ForEPS 0.4457 0.3036 0.5109 0.0950 0.9592
StockPrice 6.5099 4.3000 10.3899 1.4200 13.4450
StDev(ForEPS) 0.0273 0.0121 0.0494 0.0035 0.0564
FError 0.0055 0.0025 0.0104 0.0004 0.0124
FDisp 0.0675 0.0438 0.0770 0.0158 0.1446
Notes:
The table provides descriptive statistics on forecast accuracy. Panel A provides information for the whole sample.
Panel B and C provide descriptive statistics for the subgroups of firms reporting under UK GAAP and IFRS
respectively. Panel D and E provide descriptive statistics for the subgroups of hedgers under UK GAAP and IFRS
respectively. FError is defined as the absolute difference between actual EPS (ActualEPS) and mean forecasted
EPS (ForEPS) scaled by the stock price at the beginning of the reporting period (StockPrice). FDisp is defined as
the standard deviation of the analysts' forecasted EPS (StDev(ForEPS)), scaled by the absolute mean analyst
forecast.
29
TABLE 3
Descriptive statistics on firm characteristics
Mean Median Std Dev 10th Pctl 90th Pctl
Panel A: All firms (n=1,011)
MarketValue (£m) 5,283.89 1,532.94 12,957.47 397.77 9,078.80
EarnStab 22.30 13.03 51.72 3.64 42.03
Leverage 0.23 0.19 0.19 0.01 0.50
MarkettoBook 1.60 1.26 1.97 0.68 2.81
Numest 10.60 10.00 6.33 3.00 19.00
Loss 0.03 0.00 0.18 0.00 0.00
Earnings 0.08 0.07 0.05 0.04 0.12
Panel B: Non-hedgers (n=132)
MarketValue (£m) 3,019.87 725.15 1,1271.45 289.66 3,604.38
EarnStab 21.46 9.02 72.91 2.58 40.93
Leverage 0.10 0.06 0.13 0.00 0.31
MarkettoBook 2.17 1.52 4.74 0.73 3.63
Numest 8.26 8.00 5.29 2.00 15.00
Loss 0.07 0.00 0.25 0.00 0.00
Earnings 0.08 0.07 0.07 0.04 0.12
Panel C: Hedgers (n=879)
MarketValue (£m) 5,623.88 1,737.70 13,164.19 448.71 9,963.79
EarnStab 22.43 13.84 47.79 3.91 42.25
Leverage 0.25 0.21 0.19 0.03 0.51
MarkettoBook 1.52 1.23 1.03 0.67 2.75
Numest 10.96 10.00 6.41 3.00 19.00
Loss 0.03 0.00 0.17 0.00 0.00
Earnings 0.08 0.07 0.05 0.04 0.12
Notes:
The table provides descriptive statistics on firm characteristics. Panel A describes the distribution of the control
variables for the whole sample. Panel B and C provide descriptive statistics of the control variables for the
subgroups of non-hedgers and hedgers. MarketValue is the market value of equity plus book value of debt plus
preferred stock. EarnStab is calculated as the mean absolute percentage difference between the actual EPS and a
five-year historical EPS growth trend line, expressed as a percentage of trend line EPS. Leverage is the ratio of book
value of long term debt to market value of the firm. MarkettoBook is the ratio of market value to book value of the
firm. Numest is the number of analysts following. Loss equals 1 if the firm had negative EPS for the last reporting
year and 0 otherwise. Earnings is calculated as the actual earnings per share divided by the stock price at the
beginning of the reporting year.
30
TABLE 4
Impact of hedge accounting on forecast accuracy
Dependent variable: FError Dependent variable: FDisp
Variable Estimate t-Value Pr > |t| Estimate t-Value Pr > |t|
Intercept -0.0147 -0.74 0.46 -0.0338 -0.24 0.81
IFRS 0.0050 1.31 0.19 0.0268 1.17 0.24
Hedge 0.0048 1.54 0.13 0.0292 1.67 0.10
IFRSHedge -0.0083 -2.29 0.02 -0.0520 -2.54 0.01
LnMarketValue 0.0004 0.48 0.63 0.0014 0.19 0.85
Loss 0.0264 2.56 0.01 0.1083 2.11 0.04
LnEarnStab 0.0028 3.58 0.00 0.0298 4.99 0.00
Leverage 0.0158 1.95 0.05 0.1516 2.77 0.01
Numest -0.0002 -2.34 0.02 -0.0007 -0.66 0.51
Earnings 0.0298 0.88 0.38 -0.5838 -3.05 0.00
MarkettoBook -0.0003 -1.08 0.28 -0.0019 -1.69 0.09
Year-fixed effects Yes Yes
Industry-fixed effects Yes Yes
R-square 27.27% 22.51%
Notes:
The table presents regression results of the impact of hedge accounting under IFRS on forecast accuracy. Dependent
variables are Forecast Error (FError) and Forecast Dispersion (FDisp). FError is calculated as the absolute
difference between actual EPS and mean forecasted EPS scaled by the stock price at the beginning of the financial
year. FDisp is calculated as the standard deviation of the analysts' forecasted EPS, scaled by the absolute mean
analyst forecast. IFRS equals 1 if the firm reports under IFRS in the current financial year and 0 otherwise. Hedge
equals 1 if the firm uses derivatives to hedge 0 otherwise. IFRSHedge is the interaction of IFRS and Hedge.
MarketValue is the market value of equity plus book value of debt plus preferred stock. Loss equals 1 if the firm had
negative EPS for the last reporting year and 0 otherwise. EarnStab is calculated as the mean absolute percentage
difference between the actual EPS and a five-year historical EPS growth trend line, expressed as a percentage of
trend line EPS. Leverage is the ratio of book value of long term debt to market value of the firm. Numest is the
number of analysts following. Earnings is calculated as the actual earnings per share divided by the stock price at
the beginning of the reporting year. MarkettoBook is the ratio of market value to book value of the firm. Year-fixed
and industry-fixed effects are included in the regressions. Standard errors are corrected for firm effects and two-
tailed p-values are reported.
31
TABLE 5
Impact of hedge accounting on forecast accuracy: hedge accounting treatment
Dependent variable: FError Dependent variable: FDisp
Variable Estimate t-Value Pr > |t| Estimate t-Value Pr > |t|
Intercept -0.0135 -0.68 0.50 -0.0124 -0.09 0.93
IFRS 0.0050 1.28 0.20 0.0250 1.09 0.28
Hedge 0.0049 1.55 0.12 0.0303 1.72 0.09
IFRSHedge -0.0088 -2.39 0.02 -0.0607 -2.83 0.01
IFRSNQHA 0.0010 0.95 0.34 0.0167 2.11 0.04
LnMarketValue 0.0004 0.42 0.68 0.0005 0.06 0.95
Loss 0.0265 2.56 0.01 0.1088 2.11 0.04
LnEarnStab 0.0028 3.58 0.00 0.0298 4.97 0.00
Leverage 0.0159 1.96 0.05 0.1523 2.79 0.01
Numest -0.0002 -2.35 0.02 -0.0007 -0.70 0.48
Earnings 0.0297 0.88 0.38 -0.5859 -3.08 0.00
MarkettoBook -0.0003 -1.07 0.28 -0.0019 -1.67 0.10
Year-fixed effects Yes Yes
Industry-fixed effects Yes Yes
R-square 27.30% 22.66%
Notes:
The table presents regression results of the impact of hedge accounting under IFRS on forecast accuracy, including
IFRSNQHA indicating if the firm holds derivatives that do not qualify for hedge accounting treatment under IFRS.
All the other variables are defined as in Table 4. Year-fixed and industry-fixed effects are included in the
regressions. Standard errors are corrected for firm effects and two-tailed p-values are reported.
32
TABLE 6
Impact of hedge accounting on forecast accuracy: first adoption effect
Dependent variable: FError Dependent variable: FDisp
Variable Estimate t-Value Pr > |t| Estimate t-Value Pr > |t|
Intercept -0.0136 -0.70 0.49 -0.0388 -0.28 0.78
Adopt 0.0052 1.26 0.21 0.0298 1.19 0.24
PostAdopt 0.0038 0.94 0.35 0.0304 1.12 0.26
Hedge 0.0048 1.54 0.13 0.0291 1.67 0.10
AdoptHedge -0.0085 -2.11 0.04 -0.0555 -2.30 0.02
PostAdoptHedge -0.0083 -2.25 0.03 -0.0508 -2.42 0.02
LnMarketValue 0.0004 0.48 0.63 0.0014 0.20 0.84
Loss 0.0265 2.56 0.01 0.1081 2.10 0.04
LnEarnStab 0.0028 3.58 0.00 0.0298 4.97 0.00
Leverage 0.0158 1.94 0.05 0.1519 2.77 0.01
Numest -0.0002 -2.28 0.02 -0.0007 -0.69 0.49
Earnings 0.0297 0.88 0.38 -0.5838 -3.04 0.00
MarkettoBook -0.0003 -1.07 0.29 -0.0019 -1.69 0.09
Year-fixed effects Yes Yes
Industry-fixed effects Yes Yes
R-square 27.29% 22.51%
Notes:
The table presents regression results of the impact of hedge accounting under IFRS on forecast accuracy including
indicator variables for IFRS first adoption year (Adopt) and post-adoption years (PostAdopt). All the other variables
are defined as in Table 4. Year-fixed and industry-fixed effects are included in the regressions. Standard errors are
corrected for firm effects and two-tailed p-values are reported.
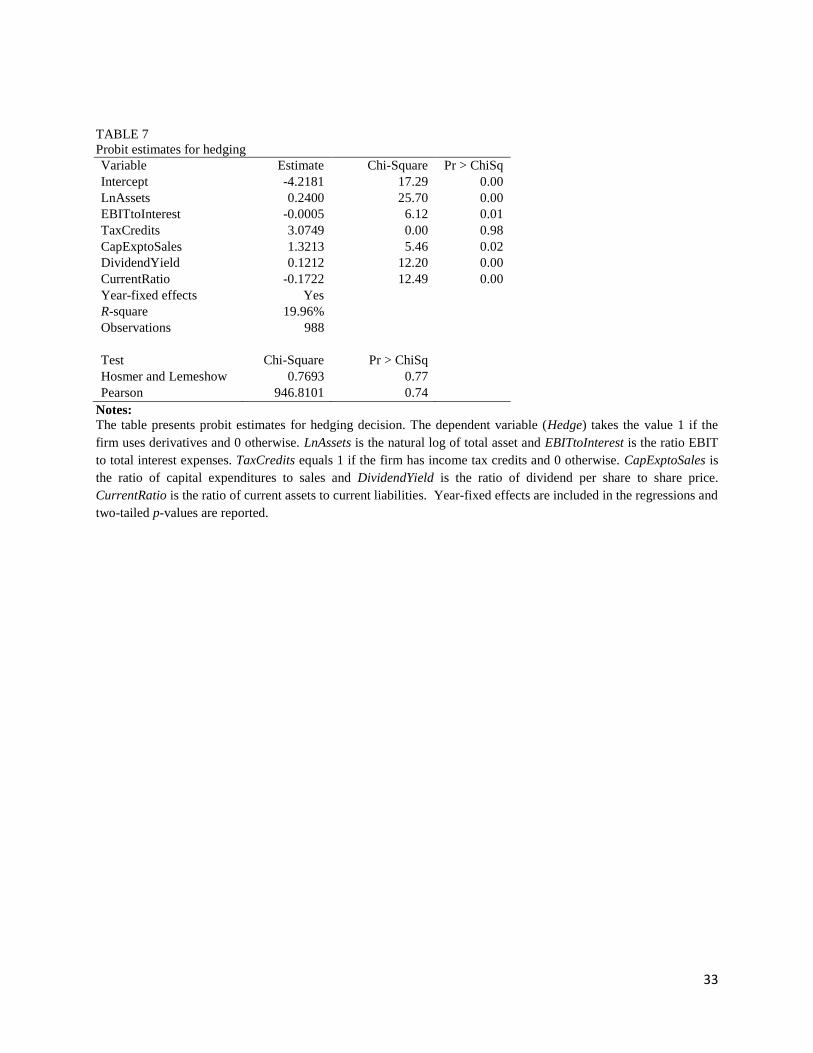
33
TABLE 7
Probit estimates for hedging
Variable Estimate Chi-Square Pr > ChiSq
Intercept -4.2181 17.29 0.00
LnAssets 0.2400 25.70 0.00
EBITtoInterest -0.0005 6.12 0.01
TaxCredits 3.0749 0.00 0.98
CapExptoSales 1.3213 5.46 0.02
DividendYield 0.1212 12.20 0.00
CurrentRatio -0.1722 12.49 0.00
Year-fixed effects Yes
R-square 19.96%
Observations 988
Test Chi-Square Pr > ChiSq
Hosmer and Lemeshow 0.7693 0.77
Pearson 946.8101 0.74
Notes:
The table presents probit estimates for hedging decision. The dependent variable (Hedge) takes the value 1 if the
firm uses derivatives and 0 otherwise. LnAssets is the natural log of total asset and EBITtoInterest is the ratio EBIT
to total interest expenses. TaxCredits equals 1 if the firm has income tax credits and 0 otherwise. CapExptoSales is
the ratio of capital expenditures to sales and DividendYield is the ratio of dividend per share to share price.
CurrentRatio is the ratio of current assets to current liabilities. Year-fixed effects are included in the regressions and
two-tailed p-values are reported.
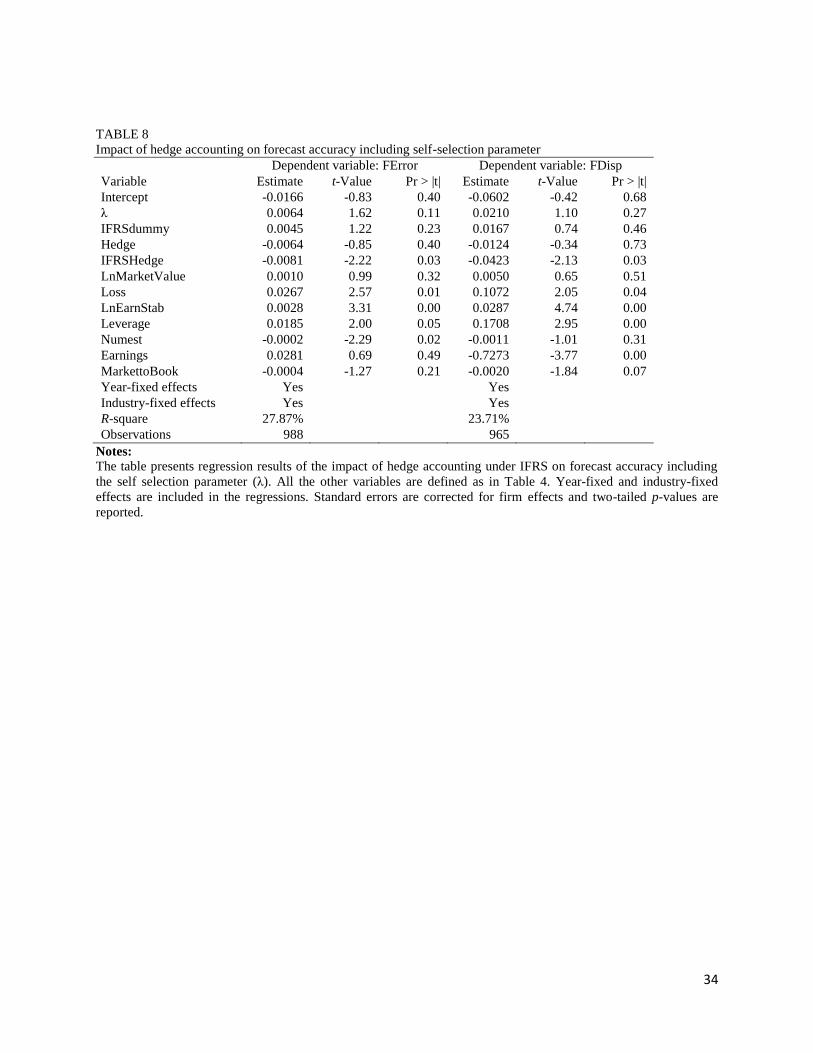
34
TABLE 8
Impact of hedge accounting on forecast accuracy including self-selection parameter
Dependent variable: FError Dependent variable: FDisp
Variable Estimate t-Value Pr > |t| Estimate t-Value Pr > |t|
Intercept -0.0166 -0.83 0.40 -0.0602 -0.42 0.68
λ 0.0064 1.62 0.11 0.0210 1.10 0.27
IFRSdummy 0.0045 1.22 0.23 0.0167 0.74 0.46
Hedge -0.0064 -0.85 0.40 -0.0124 -0.34 0.73
IFRSHedge -0.0081 -2.22 0.03 -0.0423 -2.13 0.03
LnMarketValue 0.0010 0.99 0.32 0.0050 0.65 0.51
Loss 0.0267 2.57 0.01 0.1072 2.05 0.04
LnEarnStab 0.0028 3.31 0.00 0.0287 4.74 0.00
Leverage 0.0185 2.00 0.05 0.1708 2.95 0.00
Numest -0.0002 -2.29 0.02 -0.0011 -1.01 0.31
Earnings 0.0281 0.69 0.49 -0.7273 -3.77 0.00
MarkettoBook -0.0004 -1.27 0.21 -0.0020 -1.84 0.07
Year-fixed effects Yes Yes
Industry-fixed effects Yes Yes
R-square 27.87% 23.71%
Observations 988 965
Notes:
The table presents regression results of the impact of hedge accounting under IFRS on forecast accuracy including
the self selection parameter (λ). All the other variables are defined as in Table 4. Year-fixed and industry-fixed
effects are included in the regressions. Standard errors are corrected for firm effects and two-tailed p-values are
reported.
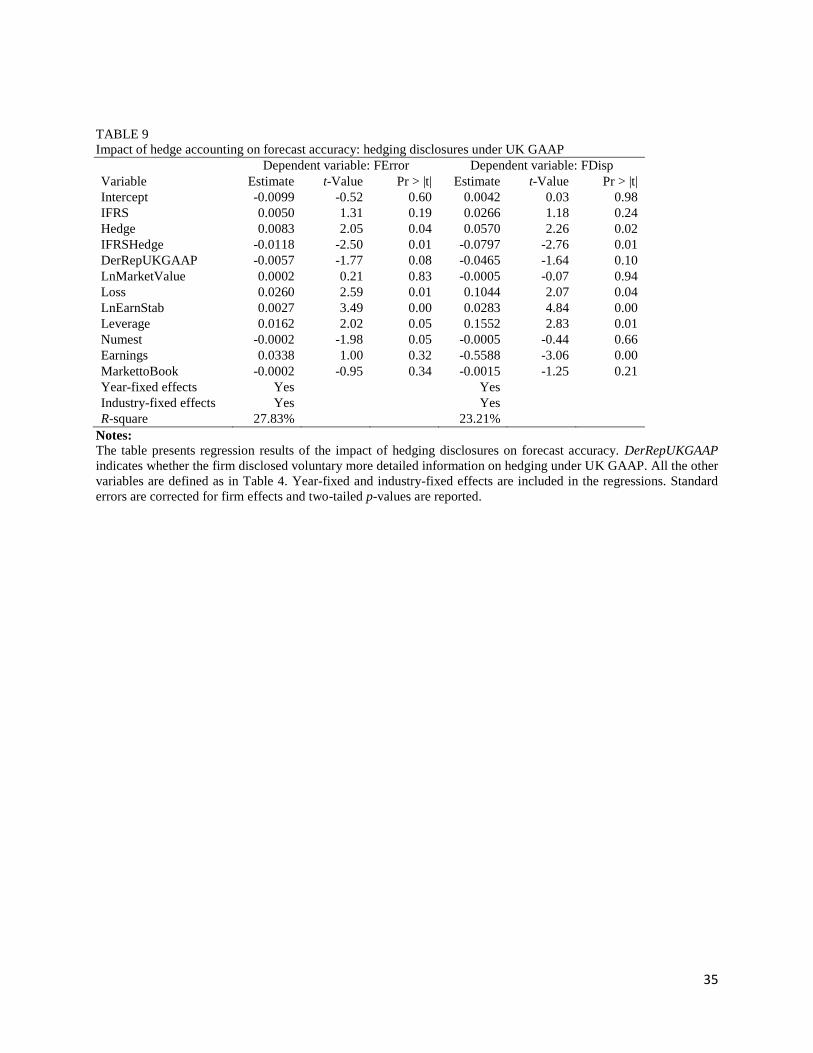
35
TABLE 9
Impact of hedge accounting on forecast accuracy: hedging disclosures under UK GAAP
Dependent variable: FError Dependent variable: FDisp
Variable Estimate t-Value Pr > |t| Estimate t-Value Pr > |t|
Intercept -0.0099 -0.52 0.60 0.0042 0.03 0.98
IFRS 0.0050 1.31 0.19 0.0266 1.18 0.24
Hedge 0.0083 2.05 0.04 0.0570 2.26 0.02
IFRSHedge -0.0118 -2.50 0.01 -0.0797 -2.76 0.01
DerRepUKGAAP -0.0057 -1.77 0.08 -0.0465 -1.64 0.10
LnMarketValue 0.0002 0.21 0.83 -0.0005 -0.07 0.94
Loss 0.0260 2.59 0.01 0.1044 2.07 0.04
LnEarnStab 0.0027 3.49 0.00 0.0283 4.84 0.00
Leverage 0.0162 2.02 0.05 0.1552 2.83 0.01
Numest -0.0002 -1.98 0.05 -0.0005 -0.44 0.66
Earnings 0.0338 1.00 0.32 -0.5588 -3.06 0.00
MarkettoBook -0.0002 -0.95 0.34 -0.0015 -1.25 0.21
Year-fixed effects Yes Yes
Industry-fixed effects Yes Yes
R-square 27.83% 23.21%
Notes:
The table presents regression results of the impact of hedging disclosures on forecast accuracy. DerRepUKGAAP
indicates whether the firm disclosed voluntary more detailed information on hedging under UK GAAP. All the other
variables are defined as in Table 4. Year-fixed and industry-fixed effects are included in the regressions. Standard
errors are corrected for firm effects and two-tailed p-values are reported.
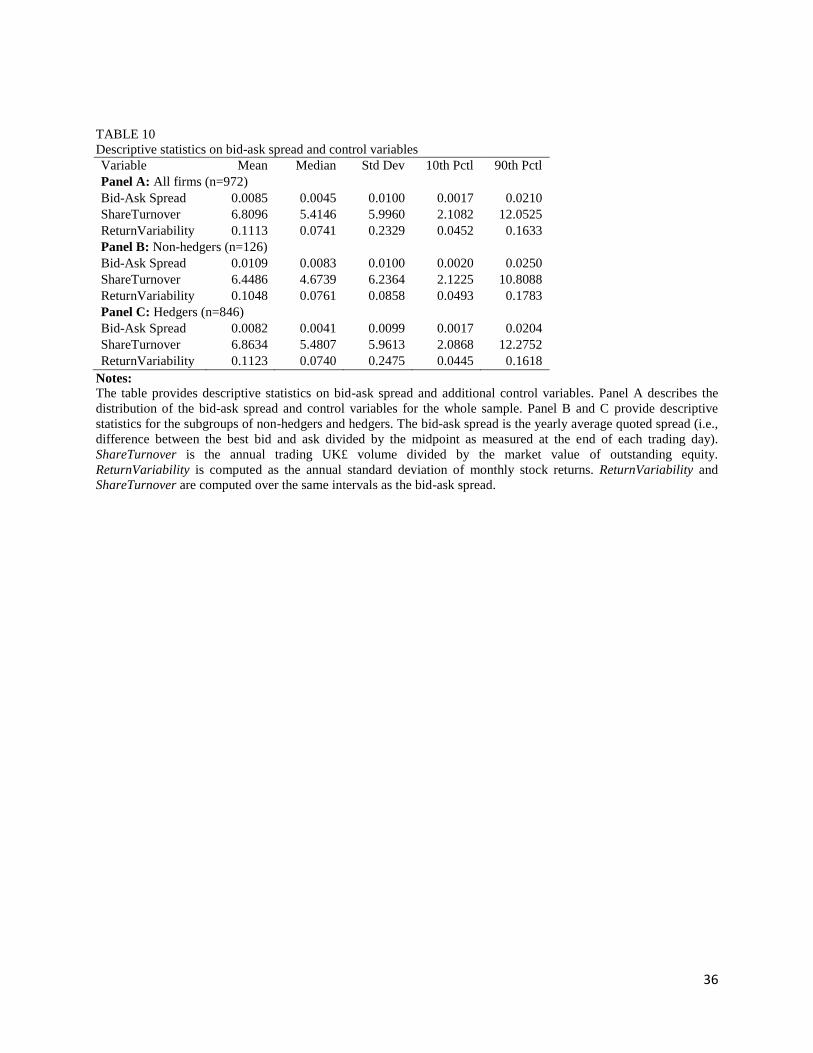
36
TABLE 10
Descriptive statistics on bid-ask spread and control variables
Variable Mean Median Std Dev 10th Pctl 90th Pctl
Panel A: All firms (n=972)
Bid-Ask Spread 0.0085 0.0045 0.0100 0.0017 0.0210
ShareTurnover 6.8096 5.4146 5.9960 2.1082 12.0525
ReturnVariability 0.1113 0.0741 0.2329 0.0452 0.1633
Panel B: Non-hedgers (n=126)
Bid-Ask Spread 0.0109 0.0083 0.0100 0.0020 0.0250
ShareTurnover 6.4486 4.6739 6.2364 2.1225 10.8088
ReturnVariability 0.1048 0.0761 0.0858 0.0493 0.1783
Panel C: Hedgers (n=846)
Bid-Ask Spread 0.0082 0.0041 0.0099 0.0017 0.0204
ShareTurnover 6.8634 5.4807 5.9613 2.0868 12.2752
ReturnVariability 0.1123 0.0740 0.2475 0.0445 0.1618
Notes:
The table provides descriptive statistics on bid-ask spread and additional control variables. Panel A describes the
distribution of the bid-ask spread and control variables for the whole sample. Panel B and C provide descriptive
statistics for the subgroups of non-hedgers and hedgers. The bid-ask spread is the yearly average quoted spread (i.e.,
difference between the best bid and ask divided by the midpoint as measured at the end of each trading day).
ShareTurnover is the annual trading UK£ volume divided by the market value of outstanding equity.
ReturnVariability is computed as the annual standard deviation of monthly stock returns. ReturnVariability and
ShareTurnover are computed over the same intervals as the bid-ask spread.
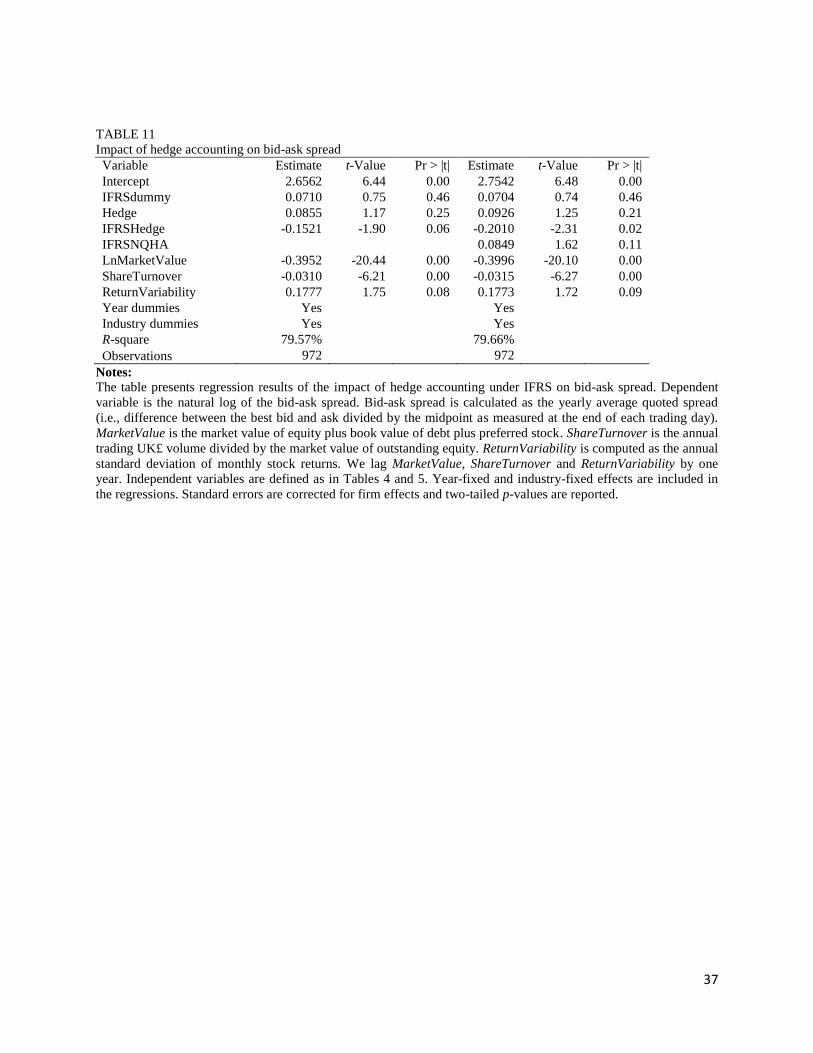
37
TABLE 11
Impact of hedge accounting on bid-ask spread
Variable Estimate t-Value Pr > |t| Estimate t-Value Pr > |t|
Intercept 2.6562 6.44 0.00 2.7542 6.48 0.00
IFRSdummy 0.0710 0.75 0.46 0.0704 0.74 0.46
Hedge 0.0855 1.17 0.25 0.0926 1.25 0.21
IFRSHedge -0.1521 -1.90 0.06 -0.2010 -2.31 0.02
IFRSNQHA 0.0849 1.62 0.11
LnMarketValue -0.3952 -20.44 0.00 -0.3996 -20.10 0.00
ShareTurnover -0.0310 -6.21 0.00 -0.0315 -6.27 0.00
ReturnVariability 0.1777 1.75 0.08 0.1773 1.72 0.09
Year dummies Yes
Yes
Industry dummies Yes
Yes
R-square 79.57%
79.66%
Observations 972
972
Notes:
The table presents regression results of the impact of hedge accounting under IFRS on bid-ask spread. Dependent
variable is the natural log of the bid-ask spread. Bid-ask spread is calculated as the yearly average quoted spread
(i.e., difference between the best bid and ask divided by the midpoint as measured at the end of each trading day).
MarketValue is the market value of equity plus book value of debt plus preferred stock. ShareTurnover is the annual
trading UK£ volume divided by the market value of outstanding equity. ReturnVariability is computed as the annual
standard deviation of monthly stock returns. We lag MarketValue, ShareTurnover and ReturnVariability by one
year. Independent variables are defined as in Tables 4 and 5. Year-fixed and industry-fixed effects are included in
the regressions. Standard errors are corrected for firm effects and two-tailed p-values are reported.