CORPORATE PRESENTATION - Triveni Group
40
CORPORATE PRESENTATION 1 FEBRUARY 2019
Transcript of CORPORATE PRESENTATION - Triveni Group

CORPORATE
PRESENTATION
1FEBRUARY 2019

Triveni Group Organisation Structure
2
Triveni
Group
Triveni
Engineering &
Industries Ltd.
(TEIL)
Triveni Turbine
Ltd. (TTL)
Sugar
BusinessesSugar
BusinessCo-generation
Business
Distillery
Business
GE Triveni Ltd.
(GETL)
Engineering
Businesses
Gears
Business
Water
Business
Triveni
Turbines
Europe Pvt.
Ltd.
(TTEPL)
Triveni
Turbines
DMCC
(TTD)
TEIL holds 21.8% of the equity in TTL
50% plus
one share
Triveni
Turbines
DMCC
(TTD)
Triveni
Turbines
Africa Pty Ltd

Triveni Group Fact Sheet
3
Two Independent Listed Companies
with total FY 18 gross revenue of INR
41.55 billion (USD 560 million)
– Triveni Engineering & Industries Ltd.
and Triveni Turbine Ltd.
Listed in both National Stock
Exchange & Bombay Stock
Exchange
Promoter driven, professionally
managed companies with eminent
and independent Board of
DirectorsTriveni Engineering is one of the
largest integrated sugar
manufacturers in India and market
leader in its engineering
businesses comprising high speed
gears, gearboxes, and water &
waste water treatment solutions
Triveni Turbine Ltd. is one of the
world’s largest manufacturers of
steam turbines up to 30 MW
range for providing industrial &
renewable power solutions

4
Financial Performance – TEIL (Consolidated)
In ` million
Change in Accounting treatment: Off-season expenses not deferred but expensed as & when incurred/accrued;
9M FY 19 profitability is lower by ` 754 million than the previous corresponding period
Q3 FY 19 Q3 FY 18Change (%)
9M FY 19 9M FY 18Change
(%)
Gross Revenue 9031.1 7725.5 17 22974.7 26775.9 (14)
EBITDA (before exceptional items) 1053.1 967.5 9 2510.8 3990.0 (37)
EBIDTA Margin 120 130 110 150
Share of income from Associates 40.4 33.3 21 125.6 106.3 18
Profit / (Loss) Before Tax 886.6 790.7 12 1785.5 3035.4 (41)
Profit / (Loss) After Tax (PAT)
Consolidated670.7 600.7 12 1365.5 2212.3 (38)
Other Comprehensive Income (Net of
Tax)16.2 9.4 72 6 7.2 (17)
Total Comprehensive Income 686.9 610.1 13 1371.5 2219.5 (38)
EPS (not annualized) (`/share) 2.60 2.33 5.29 8.58

Engineering Businesses
A leading player in the high
technology water & wastewater
management business
5
Market leader in High speed gears &
gear boxes upto 70 MW capacity and
speed of 70,000 rpm
Triveni Gears
Triveni Water

Engineering Businesses – Revenue Growth
0
500
1000
1500
2000
2500
3000
3500
4000
FY 12-14* FY 15 FY 16 FY 17 FY 18
3951
3009
25242734
2874
256 25570 153 175
`in
mil
lio
ns
Revenue PBIT
Note:
For FY 16, FY 17, & FY 18 revenue figures are including excise duty
FY 12-14* - 18 months period from Oct 12 – Mar 14 6

Triveni Gears
7

Triveni technology for high speed gear
boxes upto 7.5 MW and for hydel
gearbox range upto 6 MW
Range above 7.5 MW-62 MW is
manufactured using technology licensed
from GE (Lufkin), USA
Design, manufacture and marketing of customised gears
and gearboxes (both high speed and niche low speed
gears)
State-of-the-art design and manufacturing facility at
Mysore conforming to international standards
Gears Business - Overview
8

9
Gears Business - Overview
A
More than 31,500 MW
and 7800 gearboxes in
operation
Strong presence
in Replacement
market
Leading Turbo Gears
company in India and
SE Asia, market share
of >80% in High
Speed Segment
Preferred partner
to Domestic and
Multinational OEMs
Benchmarked to
global quality
practices and 5S
Fully integrated
plant with all
critical operations
in-house with
state-of-the-art
infrastructure
D
B C
E
F

The turnover and profitability for the nine-month
period grew by 31% and 55% respectively.
The growth in OEM sales has been 44% while the
sales of spares, services, retrofitting including
exports have been 17% in 9M FY 19
Overall the market looks stable with positive signs
from some sectors.
The business has strong enquiries from defence and
is hopeful of concluding some more of them in the
coming quarters.
Gears Business – Financial Performance
1421
1033
1199
922
1118
397292 292
180
314
0
200
400
600
800
1000
1200
1400
1600
FY 12-14* FY 15 FY 16# FY 17# FY 18#
`in
mill
ions
Net Sales PBIT
Outstanding Order Book as on 31st Dec 2018 – ` 1.83 billion
(including ` 740 million long term orders)
10
#revenue figures are including excise duty
FY 12-14* - 18 months period from Oct 12 – Mar 14

Triveni Water
11
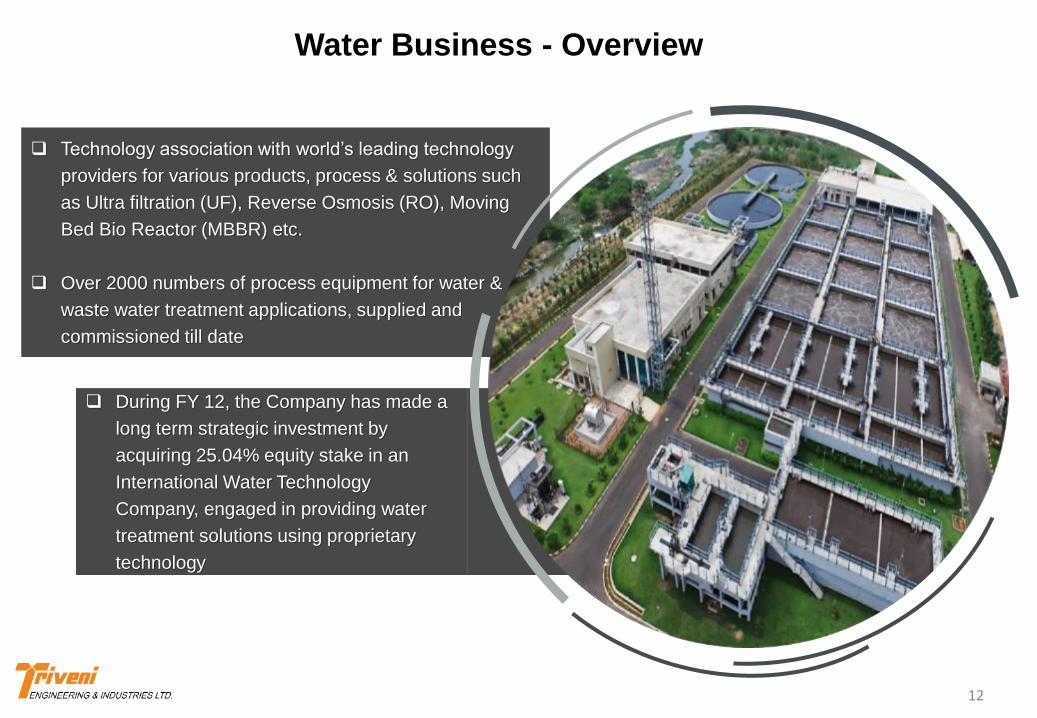
Water Business - Overview
During FY 12, the Company has made a
long term strategic investment by
acquiring 25.04% equity stake in an
International Water Technology
Company, engaged in providing water
treatment solutions using proprietary
technology
Technology association with world’s leading technology
providers for various products, process & solutions such
as Ultra filtration (UF), Reverse Osmosis (RO), Moving
Bed Bio Reactor (MBBR) etc.
Over 2000 numbers of process equipment for water &
waste water treatment applications, supplied and
commissioned till date
12

13
Water Business - Overview
A
Over 100 successfully operating
installations across various
segments – infrastructure,
industrial and municipal
Technology associations with the
world’s leading technology
providers for various products,
processes and solutions
Won many Water
Awards for Innovative
project designs
Approx. 8000 MLD of water
is treated through our
projects & equipment
D
B C

Water Business – Financial Performance
2530
1976
1326
1812 1757
-141-37
-221
-28
-139
-500
0
500
1000
1500
2000
2500
3000
FY 12-14 (*) FY 15 FY 16# FY 17# FY 18#
`in
mill
ions
Net Sales PBIT
The turnover and profitability of the water business has
shown significant growth both in the quarter and nine-
month period under review. This is due to the significant
order inflow in the first six-month period of the current
financial year.
The order inflow in the nine-month period has been `
9.54 billion including O&M
Outstanding Order Book as on 31st Dec 2018 – ` 13.28 billion
(including ` 5.12 billion towards O&M)
14
#revenue figures are including excise duty
FY 12-14* - 18 months period from Oct 12 – Mar 14

Triveni Sugar
15

Sugar Business
One of the largest sugar
producers in India with seven
sugar manufacturing facilities
Three grid connected
co-generation plants and three
incidental co-generation
plants located across five
sugar units.
One of the largest single
stream molasses based
distillery in the country
located at Muzaffarnagar
Sugar
Co-generation
Distillery
16

Sugar Business – Industry Overview As per initial industry estimates sugar production was
expected to be around 35 – 35.5 million tonnes of sugar in
SS 2018-19. However, as per the latest industry estimates,
the sugar production estimates have been revised
downwards by 5 million tonnes. This is primarily due to
Maharashtra, U.P. and Karnataka sugar production which
has been impacted by pest as well as lower than expected
rain fall in certain areas.
With an opening Sugar carry forward stock of around 10.5
million tonnes as on Oct 1, 2018 and estimated domestic
consumption to be around 26 million tonnes in SS 2018-19,
0.5 million tonnes of diversion towards ethanol production
and considering an export of 4-5 million tonnes of sugar
during the sugar year 2018-19, the estimated closing sugar
balance on 30th Sept 2019 is expected to around 10.8-11.8
million tonnes.
The Central Government has announced Fair and
Remunerative Price (FRP) of sugarcane for SS 2018-19 at `275 per quintal for a basic recovery rate of 10%; providing a
premium of ` 2.75/qtl for each 0.1% increase in recovery
over and above 10%.
The Government of Uttar Pradesh maintained the State
Advised Price (SAP) for the Sugar season 2018-19 at the
same level as last year at ` 315 per quintal for general
variety and ` 325 per quintal for the early variety cane.
The Central Government has announced to provide
assistance to sugar mills by defraying expenditure towards
internal transport, freight, handling and other charges to
facilitate export during the sugar season 2018-19 @ `1000/MT for the mills based on distance or actual
expenditure, whichever is lower. The total expenditure on
this account would be about ` 1375 crore which will be borne
by Government.
The Government has decided to provide financial assistance
@ of ` 13.88 per quintal of cane crushed in sugar season
2018-19 to offset the cost of cane to only those mills which
fulfil the conditions as stipulated by DFPD, including fulfilling
mandatory export obligations. The total expenditure on this
account would be about ` 4163 crore which will be borne by
Government
OMCs have floated fresh tender for supply of 329 crore litres
of ethanol in SS 2018-19, which includes 66 crore litres for
ethanol manufactured from B-heavy molasses/sugarcane
juice/damaged food grains and 263 crore litres from C-heavy
molasses. Against the total tender value, only 260 crore
litres of LOI were issued and 230 crore litres of PO have
been issued.
The Central Government has approved an extension of soft
loan of ` 6139 crore in order to augment ethanol production
capacity and thereby also allowing diversion of sugar for
production of ethanol. The Government will bear interest
subvention of ` 1332 crore for this purpose which should
benefit around 114 sugar mills and ethanol production
capacity of sugar mills in the country is likely to be enhanced
by about 200 crore litres per annum in the coming 3 years.
17

Sugar Business – Industry Overview
International Sugar Market
As per revised industry estimates, the world
sugar market is estimated to have a surplus
of 2.64 million tonnes and 2019/20 is
projected to be a deficit year by 1.36 million
tonnes.
In Centre-South Brazil, sugar production till
Jan 16, 2019 is lower by 26% as compared to
corresponding period of last year while
ethanol production has increased by around
20%. The share of sugar to ethanol has been
at 35.46 : 64.54 as compared to 46.93 :
53.07 during the corresponding period of last
year.
In Thailand, sugar production is estimated to
increase to over 14 million tonnes, an
increase of 3% from MY 2017/18 due to
increased sugarcane acreage, particularly in
the northeastern region.
18

Sugar Business – Industry Overview
(Figures in million tonnes)
• Source: Industry data; SS 18-19 - Company Estimates; (#) Exports under MIEQ considered
• Closing stock taken as a percent of off-take is one of the indicators of sugar price movement
• *Production includes B-heavy
2012-13 2013-14 2014-15 2015-16 2016-172017-18
(P)
2018-19
(E)
Opening Stock as on 1st Oct. 6.6 9.3 7.5 9.1 7.75 3.9 10.3
Production during the Season 25.1 24.4 28.3 25.1 20.3 32.4 31.2*
Imports 0.7 0.1 0.0 0.0 0.5 0 1.4
Total Availability 32.4 33.8 35.8 34.2 28.55 36.3 42.9
Off-take
I) Internal Consumption 22.7 24.2 25.6 24.9 24.6 25.5 25.5
ii) Exports 0.3 2.1 1.1 1.6 0.05 0.5(#) 4.7
Total off-take 23.1 26.3 26.7 26.5 24.65 26.0 30.2
Closing Stock as on 30th Sept. 9.2 7.5 9.1 7.7* 3.9 10.3 12.7
Stock as % of Off-take 39.8% 28.5% 34.0% 28.1% 15.8% 39.6% 42.1%
19

Sugar Business - Overview
Closer to country’s major sugar
consuming markets - better realizations &
lower transportation cost. Long term
relationship with ~ 250,000 farmers
Extensive sugar cane development
programme – to develop new areas
under cane cultivation in our new
locations; improving yields of cane
across the units.
Major facilities located in cane rich areas of Western Uttar
Pradesh with more than 80% cane intensity – fertile and
irrigated land
Sugar cane catchment area for all sugar units under canal
irrigation – both in Western & Central Uttar Pradesh -
Lower dependency on monsoon
20

Sugar Business – Financial Performance
In view of change in accounting treatment of off-season
expenses, the profitability for the quarter is higher by `
178.0 million and that of nine months ended 31.12.2018 is
lower by ` 693.3 million.
The sugar inventory as on Dec 31, 2018 was 39.63 lakh
quintals, which is valued at ` 30.7/Kg.
The sugar stocks have been written down to net realizable
value as at the end of the third quarter and the total
inventory write down of ` 239.7 million has been
considered.
Income from Incidental co-generation units at
Chandanpur, Milak Narayanpur and Sabitgarh resulted
in a revenue of ` 740 million for the quarter ended Dec
2018.
State Government and Central Government subsidies of
` 516.1 million have been accounted for (` 376.9 million
already received) in the current quarter on account of
assistance towards payment of cane price for SS 2017-
18. Subsidies of ` 420.6 million, pertaining to FY 18 has
been depicted as other income and balance amount of `
95.5 million pertaining to FY 19 has been deducted from
the cost of material consumed.
465513
452
640
837
4349
4971
95
40
50
60
70
80
90
100
0.0
100.0
200.0
300.0
400.0
500.0
600.0
700.0
800.0
2013-14 2014-15 2015-16 2016-17 2017-18
Cane Crush (Lakh Qtl.) Production (Lakh Qtl.)
24930
16284 16405
26108
29996
-1919 -1659 -282
36491156
-5000
0
5000
10000
15000
20000
25000
30000
35000
FY 12-14 (*) FY 15 FY 16# FY 17# FY 18
Net Sales PBIT
#revenue figures are including excise duty
FY 12-14* - 18 months period from Oct 12 – Mar 14
(` in millions)
21

Co-generation Business - Overview
Deoband and Khatauli co-generation
plants of the Company are registered as
Clean Development Mechanism (CDM)
projects with United Nations Framework
Convention on Climate Change
(UNFCCC) and have been registered
with National Load Dispatch Centre
(NLDC) as REC projects
Triveni presently operates grid connected three co-
generation plants and three incidental co-generation
plants located across five sugar units which facilitate
export of surplus power to Uttar Pradesh Power
Corporation Limited (UPPCL).
22

Co-generation Business – Financial Performance
As a result of change in accounting treatment of off-
season expenses which was carried in Q2 FY 19, the
profitability (PBT) for the current quarter is higher by `
13.3 million and the profitability of nine-month period is
lower by ` 60.7 million than the previous corresponding
periods. However, lower operational days in the current
quarter arising from late start of the crushing season
reduced the overall profitability
2657
15681706
1826
2152
994
658780 694
989
0
500
1000
1500
2000
2500
3000
FY 12-14 (*) FY 15 FY 16# FY 17# FY 18#
`in
mill
ions
Net Sales PBIT#revenue figures are including excise duty
FY 12-14* - 18 months period from Oct 12 – Mar 14
23

Distillery Business - Overview
The distillery has a flexible manufacturing
process allowing it to produce Extra
Neutral Alcohol (ENA), Rectified Spirit
(RS), Special Denatured Spirit (SDS) &
Ethanol which are renowned for their
high quality.
One of the largest single stream molasses based
distillery in the country located at Muzaffarnagar.
Strategically located in close proximity to two of its
largest sugar units - Khatauli and Deoband, the distillery
procures consistent supply of captive raw material.
24

2261
1525
18051679
1159
737
287
437 466
267
0
500
1000
1500
2000
2500
FY 12-14 (*) FY 15 FY 16# FY 17# FY 18 #
`in
mill
ions
Net Sales PBIT
Distillery Business – Financial Performance
The distillery remained non-operational for over a month
during the last financial year, which had impacted the
production in 9M FY 18.
PBIT in 9M FY 19 is significantly higher than corresponding
period of previous year, mainly due to lower raw material
cost, and higher sales volume at higher realization and
higher capacity utilisation.
The Company received ~6 crore litre of contract for ethanol
supply from OMCs during 2018-19 (Dec 18- Nov 19).
The Government of India announced the revised prices
for the ethanol supplies during 2018-19 as under:
Using C Molasses – ` 43.70 per litre
Using B-heavy molasses/ partial sugar cane juice – `
52.43 per litre
Using 100% sugar cane juice – ` 59.13 per litre.
The share of Ethanol sales in 9M FY 19 is 98% of the total
sales volume, as against 92% in 9M FY 18.
Project relating to setting up of new Ethanol plant at
Sabitgarh sugar unit and incineration boiler at existing
distillery are proceeding well and are likely to be
operational in the Q1 FY 20.
#revenue figures are including excise duty
FY 12-14* - 18 months period from Oct 12 – Mar 14
25

26

Triveni Turbines Factsheet
The world’s largest manufacturer of
steam turbines up to 30 MW range for
providing industrial & renewable power
solutions
Market leadership position in India, with
around 60% market share for a decade
Joint Venture with BHGE (a GE
company), GE Triveni Ltd, with
majority stake for the range above 30
MW to 100 MW
Over 3000 steam turbines installed
globally
Presence in over 70 countriesOver 12 GW power generation
capacity
27
The world’s largest manufacturer of steam turbines (5 to 30 MW) globally
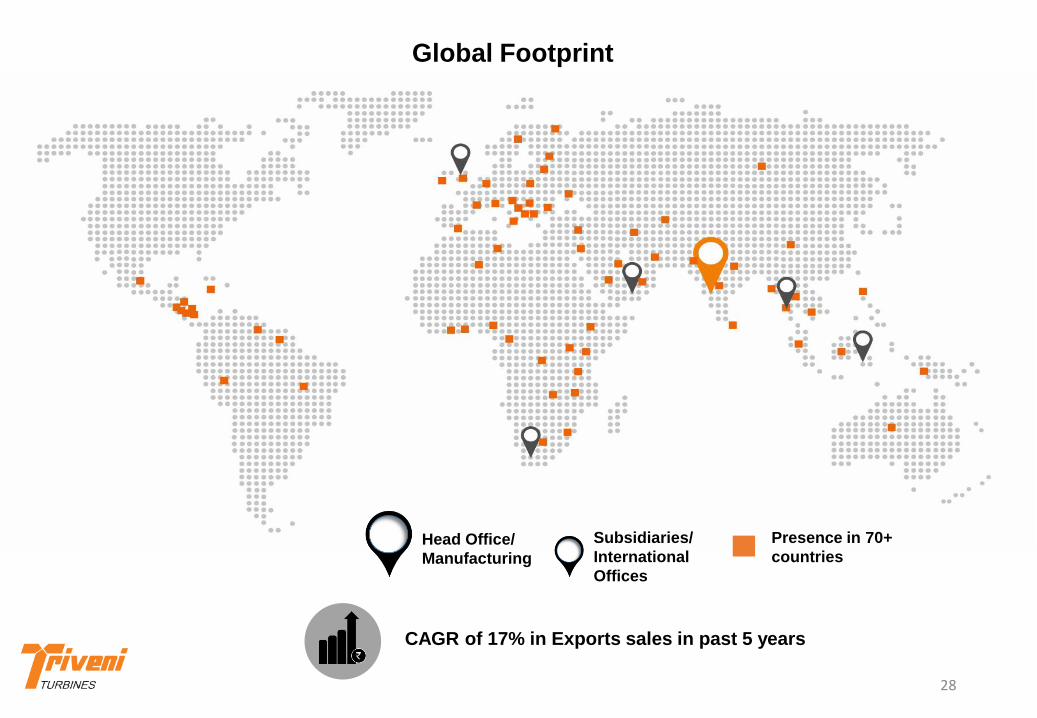
Global Footprint
CAGR of 17% in Exports sales in past 5 years
28
Subsidiaries/
International
Offices
Head Office/
Manufacturing
Presence in 70+
countries

Reliable & Robust Steam Turbines
Robust back-pressure and condensing steam turbines up to 100 MW that work across a wide range of
pressure and flow applications with choice of Impulse and Reaction technology
Back Pressure Steam
Turbines
Straight Back Pressure Type
Extraction Back Pressure Type
Bleed Back Pressure Type
Upto 30 MW
Condensing Steam Turbines
Straight Condensing Type
Extraction Condensing Type
Bleed Condensing Type
Injection Condensing Type
Reheat Turbines
Double Extraction Condensing
Above 30 MW to 100 MW
Condensing Steam
Turbines
Uncontrolled Extraction
Controlled Extraction
Reheat Turbines
Injection condensing
Turbines
Back Pressure Steam
Turbines
Uncontrolled Extraction
Controlled Extraction
29

360 ̊ Customised Service Portfolio
30
For every turbine served throughout its lifecycle
Customised
Service
Solutions
Total
Customer
Satisfaction
High
Repeat
Customers
Orders
AMCs for Steam
Turbines
Health Survey &
Condition
Assessment
Efficiency
restoration
Reverse
Engineering
Overhauling
Re-engineering OEM Expertise
Latest Equipment
Highly Skilled Team
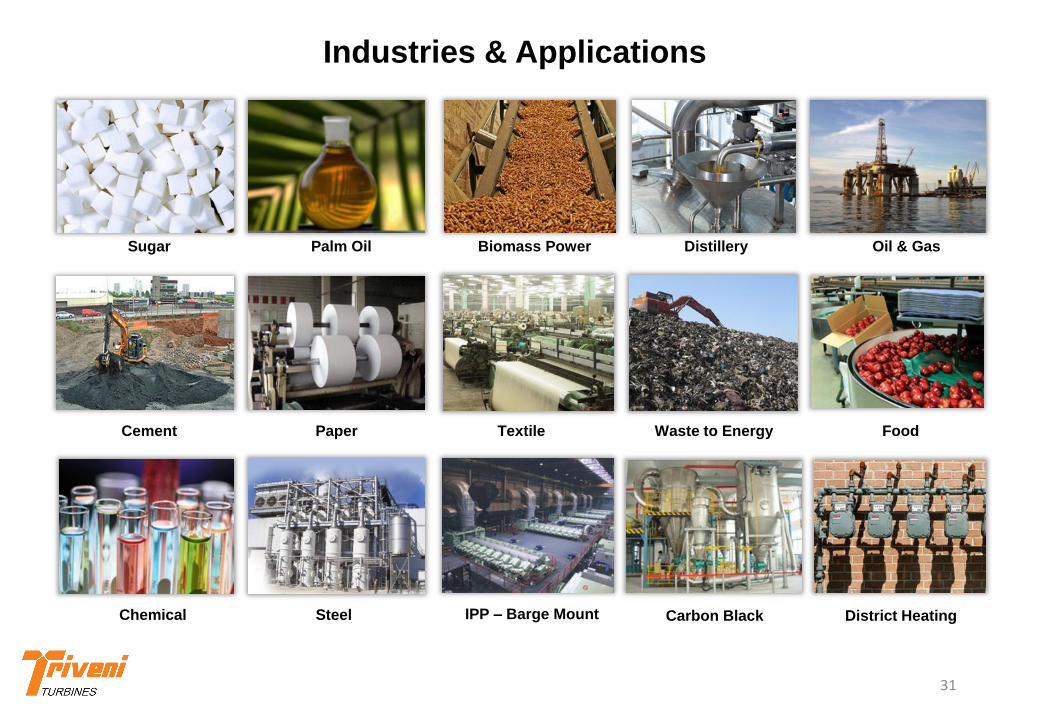
Industries & Applications
Waste to Energy
Biomass Power Oil & Gas
Food
Palm OilSugar Distillery
Carbon BlackChemical
Paper
Steel
TextileCement
IPP – Barge Mount District Heating
31
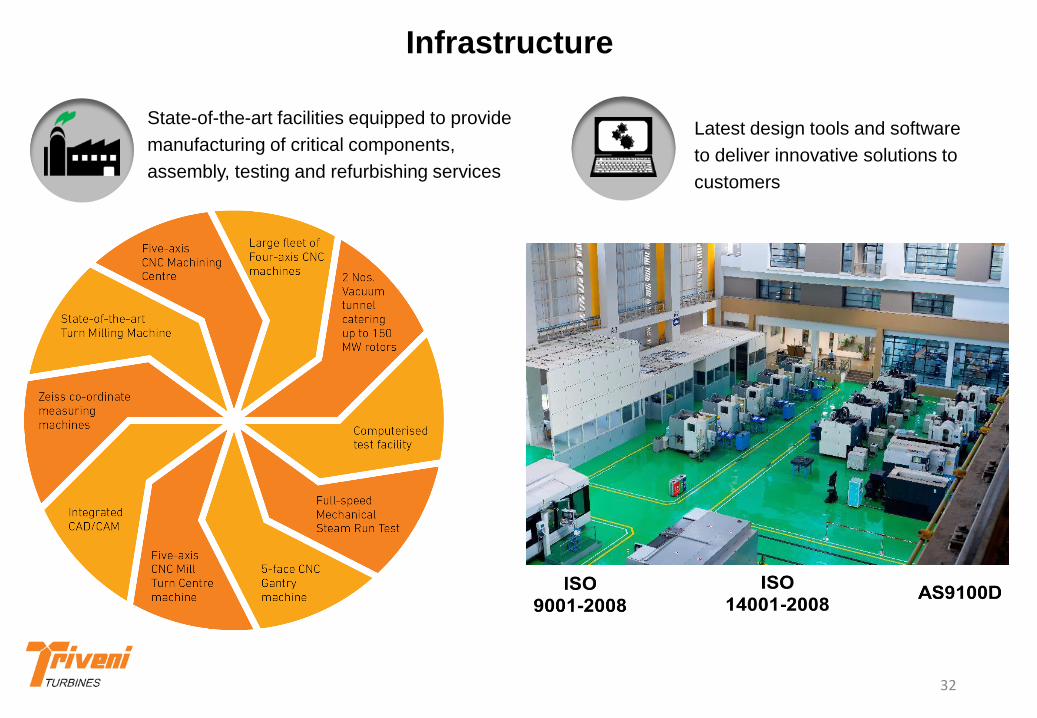
Infrastructure
State-of-the-art facilities equipped to provide
manufacturing of critical components,
assembly, testing and refurbishing services
Latest design tools and software
to deliver innovative solutions to
customers
32

Experienced design team with structural,
Aero domain experts
Customer Capex and Opex optimisation
with extensive operability benefits
Proven modular building blocks
extensively tested for product life cycle
performance
Cutting edge products with minimum lifetime ownership cost; Customer focused R&D;
Extensive in-house tests and field validation programs
Design & Development
Association with world-renowned design
houses and academia - IISc., Cambridge,
Polimi, Impact Tech. (Lockheed Martin),
Concepts NREC, USA
Innovative product development
concepts such as design to cost, QFD,
FMEA techniques, DOE
Advanced CFD, FEA, Neural network based
algorithms employed for aero performance
and product reliability maximisation
The advanced R&D product program has
over 60 field proven models/ variants
Customised Plant Engineering solutions
with PLM, SAP, advanced CAD/CAE
33

Design & Development
34
• Customised product based on
modular building blocks
• Maximising efficiency and
reliability by advanced aero
blade-path
• Customer focused CAPEX/OPEX
optimised product/plant designs
• Service solutions focused on
turbine uptime maximisation
• Cost-out programs with
competent product engineering
• R&D on futuristic energy
technologies such as Super
critical CO2 power blocks.

IT Enabled Operations
35
IT Enabled Operations and Reporting capturing OEE and operator efficiency
Technical software
• CFX
• ANSYS
• Concepts Aero Suite
• Dyrobes, ARMD
• PLM-Teamcentre
• Pro-E, Unigraphics
• Ax-turbo
• MISES
• Thermoflow, Gatecycle
• Matlab
Business Software
• SAP – HANA
• Salesforce.com
• Primavera
• IOT – Fleet RMD
• IOT- CNC shop
• ITO- Cost tools
• OTR- Primavera
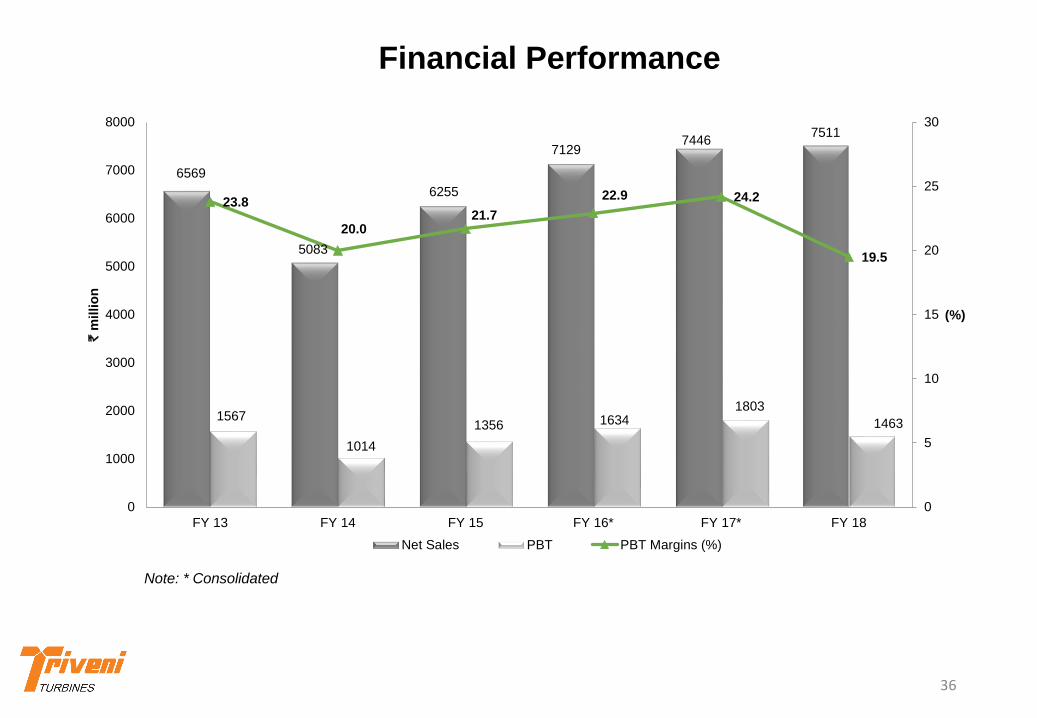
Financial Performance
Note: * Consolidated
6569
5083
6255
71297446
7511
1567
1014
1356 16341803
1463
23.8
20.021.7
22.9 24.2
19.5
0
5
10
15
20
25
30
0
1000
2000
3000
4000
5000
6000
7000
8000
FY 13 FY 14 FY 15 FY 16* FY 17* FY 18
(%)
` m
illio
n
Net Sales PBT PBT Margins (%)
36

9M FY 19 Financial Performance
(Consolidated)
Net Income from Operations ` 6 billion, a growth of
18%
PAT ` 720 million, a growth of 19%
13% growth in order intake in 9M FY 19
The mix of exports in total sales has increased from
44% in 9M FY 18 to 51% in 9M FY 19 while the mix of
domestic sales has decreased from 56% in 9M FY 18
to 49% in 9M FY 19
The share of aftermarket sales to total sales in 9M FY
19 is 27% as against 28% during 9M FY 18, even
though the aftermarket sales has increased by 14% at
` 1.59 billion from ` 1.39 billion
Out of the total aftermarket order booking, 42% is
from international markets in 9M FY 19. Further, the
aftermarket order booking has also shown good
traction on refurbishment in the international
markets
The nine-month period under review recorded an
increase in order inflow by 26% from the domestic
market. The mix of domestic order booking has
gone up to 51% as compared to 46% during the
corresponding period of last year
The overall consolidated closing order book at over
` 7.53 billion during 9M FY 19 is higher by 8% as
compared to 9M FY 18 and 6% from the closing
order book as on 31st March 2018
37

` in million
38
Q3/9M FY 19 Financial Performance
(Consolidated)
Q3 FY 19 Q3 FY 18 % variation 9M FY 19 9 M FY 18 % variation
Net Income from
Operations2113 1656 28% 6003 5070 18%
EBITDA 377 352 7% 1219 1030 18%
EBITDA Margin 17.8% 21.3% 20.3% 20.3%
Depreciation &
Amortisation53 47 13% 149 138 8%
PBIT 324 305 6% 1070 892 20%
PBIT Margin 15.3% 18.4% 17.8% 17.6%
Finance Cost 3 3 4 5
PBT 321 302 6% 1066 887 20%
PBT Margin 15.2% 18.2% 17.8% 17.5%
Share of Profit of JV 12 -23 9 8
Consolidated PAT 228 194 18% 720 606 19%
Consolidated PAT Margin 10.8% 11.7% 12.0% 11.9%
EPS (`/share) 0.69 0.59 2.18 1.84

GE Triveni Ltd.
• Triveni Turbine Ltd. formed a 50:50 Joint Venture
with a GE affiliate on 15th April 2010. GE Triveni Ltd.
(GETL) headquartered in Bengaluru, a subsidiary of
TTL, designs, supply, sell and service advanced
technology steam turbines in India in the range
above 30-100 MW for power generation
applications in India and globally
• GETL gets technology and on-going R&D support
from GE and TTL and use TTL’s Bengaluru facility
for turbine manufacturing
• JV registered a total revenue of ` 358 million with a
profit of ` 22 million. Similarly, on the order booking
front also, JV’s pipeline of enquiries which are in
the advanced stages of finalization with a total
order finalization of ` 440 million during the nine-
month period.
• The execution and commissioning of large sized
turbines in the export market is underway and
GETL expects these references to help it to
achieve enhanced order inflows in the future.
39

Contact for Investor Relations
CN Narayanan
Triveni Engineering & Industries Ltd.
Tel. +91 120 430 8000 Fax : +91 120 431 1010
Gavin Desa/ Rishab Brar
Citigate Dewe Rogerson
Tel: +91 22 66451237/1235
[email protected] / [email protected]
-----------------------------------------------------------------------------------------------------------------
DISCLAIMER :Some of the statements in this presentation that are not historical facts are forward looking statements. These forward-looking
statements include our financial and growth projections as well as statements concerning our plans, strategies, intentions and
beliefs concerning our business and the markets in which we operate.
These statements are based on information currently available to us, and we assume no obligation to update these statements as
circumstances change. There are risks and uncertainties that could cause actual events to differ materially from these forward-
looking statements. These risks include, but are not limited to, the level of market demand for our services, the highly-competitive
market for the types of services that we offer, market conditions that could cause our customers to reduce their spending for our
services, our ability to create, acquire and build new businesses and to grow our existing businesses, our ability to attract and
retain qualified personnel, currency fluctuations and market conditions in India and elsewhere around the world, and other risks
not specifically mentioned herein but those that are common to industry.
Further, this presentation may make references to reports and publications available in the public domain. Triveni Engineering &
Industries Ltd. makes no representation as to their accuracy or that the company subscribes to those views / findings.
40