Corporate Presentation Templatelibrary.corporate-ir.net/library/12/121/121171/items/307058/... ·...
60
Conor Murphy Vice President Investor Relations September 10, 2008 TOKYO INVESTOR CONFERENCE 2 0 0 8
Transcript of Corporate Presentation Templatelibrary.corporate-ir.net/library/12/121/121171/items/307058/... ·...

Conor MurphyVice President Investor Relations
September 10, 2008
TOKYO INVESTOR CONFERENCE 2 0 0 8

2
©UFS
Safe Harbor Statement
These materials contain statements which constitute forward-looking statements within the meaning of the Private Securities Litigation Reform Act of 1995, including statements relating to trends in the operations and financial results and the business and the products of MetLife, Inc. and its subsidiaries (collectively, the “Company”), as well as other statements including words such as "anticipate," "believe," "plan," "estimate," "expect," "intend" and other similar expressions. Forward-looking statements are made based upon management's current expectations and beliefs concerning future developments and their potential effects on the Company. Such forward-looking statements are not guarantees of future performance.
Actual results may differ materially from those included in the forward-looking statements as a result of risks and uncertainties including, but not limited to, the following: (i) changes in general economic conditions, including the performance of financial markets and interest rates, which may affect the Company’s ability to raise capital; (ii) heightened competition, including with respect to pricing, entry of new competitors, the development of new products by new and existing competitors and for personnel; (iii) investment losses and defaults, and changes to investment valuations; (iv) unanticipated changes in industry trends; (v) catastrophe losses; (vi) ineffectiveness of risk management policies and procedures; (vii) changes in accounting standards, practices and/or policies; (viii) changes in assumptions related to deferred policy acquisition costs, value of business acquired or goodwill; (ix) discrepancies between actual claims experience and assumptions used in setting prices for the Company’s products and establishing the liabilities for the Company’s obligations for future policy benefits and claims; (x) discrepancies between actual experience and assumptions used in establishing liabilities related to other contingencies or obligations; (xi) adverse results or other consequences from litigation, arbitration or regulatory investigations; (xii) downgrades in the Company’s and its affiliates’ claims paying ability, financial strength or credit ratings; (xiii) regulatory, legislative or tax changes that may affect the cost of, or demand for, the Company’s products or services; (xiv) MetLife, Inc.’s primary reliance, as a holding company, on dividends from its subsidiaries to meet debt payment obligations and the applicable regulatory restrictions on the ability of the subsidiaries to pay such dividends; (xv) deterioration in the experience of the “closed block” established in connection with the reorganization of Metropolitan Life Insurance Company; (xvi) economic, political, currency and other risks relating to the Company’s international operations; (xvii) the effects of business disruption or economic contraction due to terrorism or other hostilities; (xviii) the Company’s ability to identify and consummate on successful terms any future acquisitions, and to successfully integrate acquired businesses with minimal disruption; and (xix) other risks and uncertainties described from time to time in MetLife, Inc.’s filings with the U.S. Securities and Exchange Commission.
The Company specifically disclaims any obligation to update or revise any forward-looking statement, whether as a result of new information, future developments or otherwise.
This material has been prepared solely for informational purposes, and is not an offer to buy or sell or a solicitation of an offer to buy or sell any security, product, service or investment. The opinions expressed in this material do not constitute investment advice and independent advice should be sought where appropriate. All information and opinions expressed herein are current as of publication and are subject to change without notice.

3
©UFS
Explanatory Note on Non-GAAP Financial Information
The historical and forward-looking financial information presented at this conference and contained in these presentations include performance measures which are based on methodologies other than Generally Accepted Accounting Principles (“GAAP”). MetLife analyzes its performance using so-called non-GAAP measures, including operating earnings, operating earnings available to common shareholders, operating earnings available to common shareholders per diluted common share and operating return on common equity. MetLife believes these measures enhance the understanding and comparability of its performance by excluding net investment gains and losses, net of income tax, and adjustments related to net investment gains and losses, net of income tax, both of which can fluctuate significantly from period to period, the impact of the cumulative effect of a change in accounting, net of income tax, and discontinued operations other than discontinued real estate, net of income tax, thereby highlighting the results from operations and the underlying profitability drivers of the business.
Operating earnings is defined as GAAP net income, excluding net investment gains and losses, net of income tax, adjustments related to net investment gains and losses, net of income tax, the impact of the cumulative effect of a change in accounting, net of income tax, and discontinued operations other than discontinued real estate, net of income tax. Scheduled settlement payments on derivative instruments not qualifying for hedge accounting treatment are included in operating earnings.
Operating earnings available to common shareholders is defined as operating earnings less preferred stock dividends, which are recorded in Corporate & Other. All references in these slides and in the presentations made at this conference to “operating earnings” for the years indicated in these slides and future years should be read as references to “operating earnings available to common shareholders.”
Operating earnings available to common shareholders per diluted common share is calculated by dividing operating earnings available to common shareholders (as defined above) by the number of weighted average diluted common shares outstanding for the period indicated. All references in these slides and in the presentations made at this conference to “operating earnings per share” for the years indicated in these slides and future years should be read as references to “operating earnings available to common shareholders per diluted common share.”

4
©UFS
Explanatory Note on Non-GAAP Financial Information(Continued)
Operating return on common equity is calculated by dividing operating earnings available to common shareholders (as defined above) by average common equity for the period indicated, excluding accumulated other comprehensive income.
For the historical periods presented, reconciliations of non-GAAP measures used in the presentations made at this conference to the most directly comparable GAAP measures are included in the Appendix to the presentation materials and are available on the Investor Relations portion of the Company’s website (www.metlife.com). Additional information about MetLife’s historical financial results is available in the Company’s Quarterly Financial Supplements which may be accessed through the Investor Relations portion of the Company’s website. The non-GAAP measures used in the presentations made at this conference should not be viewed as substitutes for the most directly comparable GAAP measures.
In the presentations made at this conference, MetLife provides guidance on its future earnings, earnings per share and return oncommon equity on an operating, non-GAAP basis. A reconciliation of these measures to the most directly comparable GAAP measures is not accessible on a forward-looking basis because MetLife believes it is not possible to provide a reliable forecast of net investment gains and losses, which can fluctuate significantly from period to period and may have a significant impact on GAAP net income.

5
©UFS
Agenda
• Overview of MetLife International & MetLife Asia PacificEugene Marks Executive Vice President & Head of Regional
Operations• MetLife Korea
Stuart Solomon Chief Executive Officer, MetLife KoreaJong Kim Chief Operating Officer, MetLife Korea
• Break• MSI-MetLife
Toshihiro Hirose Chief Operating Officer, MSI-MetLife• Wrap Up
Eugene Marks• Q & A

Overview of MetLife International & MetLife AsiaEugene MarksExecutive Vice President
International
TOKYO INVESTOR CONFERENCE 2 0 0 8

7
©UFS
MetLife International – Increasingly Global
• Operations in 16 countries • Mix of established companies, growing businesses and
start-ups• Transferable expertise in retirement and savings products• Multi-channel distribution capabilities• Sales, revenues and earnings growth engine

8
©UFS
EIMEA Region1:- Belgium- India- Ireland- Poland- UK
EIMEA Region1:- Belgium- India- Ireland- Poland- UK
LatAm Region: - Argentina- Brazil- Chile - Mexico- Uruguay
LatAm Region: - Argentina- Brazil- Chile - Mexico- Uruguay
Asia Pac Region:- Australia- China - Hong Kong - Japan- South Korea- Taiwan
Asia Pac Region:- Australia- China - Hong Kong - Japan- South Korea- Taiwan
1 Europe, India, Middle East and AfricaSource: Swiss Re: World Insurance Report 2007
MetLife International –Access to 90%+ of the World’s Market

9
©UFS
1 Hoken Mainichi, June 6, 2008 edition 2 Korea Life Insurance Association 3 Estadistics AMIS4 Chile: Superintendencia de Valores y Seguros (SVS), June 20085 Brazil: Brazilian Pension Association as of 1Q08
MetLife International – A Local Market Leader
• Japan 2nd in Variable Annuity Assets1
• Korea 1st in New Sales Growth from (FY06 - FY07)2
• Mexico 1st Group and Individual Life Insurer in 20073
• Chile 1st in Life & Annuity Market4
• Brazil 2nd in Institutional Pension Business5

10
©UFS
1 Premiums, Fees & Other RevenuesSource: MetLife International Controller
MetLife International – Generating Top-line Growth…
$2.4
$4.1$3.6
$2.8
$2.1
2004 2005 2006 2007 2008 1H
CAGR 26%
MetLife International – Revenue1
($ Billions)

11
©UFS
Source: MetLife International ControllerSee Appendix for non-GAAP financial information definitions and/or reconciliations.
…While Growing Earnings Faster than Revenue
$270
$417
$288
$216
$139
2004 2005 2006 2007 2008 1H
CAGR 44%
MetLife International – Normalized Earnings($ Millions)

12
©UFS
Operating Earnings1
Full Year of 2004
Operating Earnings1
First Half of 2008MetLife International 14%
MetLife International 6%
1Operating earnings available to common shareholders
…and Increasing our Contribution to the Growing Enterprise

13
©UFS
MetLife Asia Pacific – A Closer Look
• 5 profitable operations, plus 2 start-ups• Expanding bank distribution and growing agent sales
force• Product innovator in Retirement & Savings products• Korea and Japan largest earnings contributors

14
©UFS
1Premiums, Fees & Other RevenuesAsia Pacific: Australia, China, Hong Kong, Japan, South Korea and TaiwanSource: Company data
Growth Engine – Generating Top-line Growth…
$0.9
$1.6
$1.3$1.1
$0.8
2004 2005 2006 2007 2008 1H
CAGR 29%
MetLife International’s Asia Pacific Region – Revenue1
($ Billions)

15
©UFS
…While Growing Earnings Faster than Revenue
Source: MetLife International Controller
$135
$233
$181
$110
$42
2004 2005 2006 2007 2008 1H
CAGR 77%
MetLife International’s Asia Pacific Region – Normalized Earnings($ Millions)

16
©UFS

MetLife KoreaStuart SolomonChief Executive OfficerMetLife Korea
Jong Kim Chief Operating Officer MetLife Korea
TOKYO INVESTOR CONFERENCE 2 0 0 8

18
©UFS
Agenda
• MetLife Korea – Performance & Opportunity• Where We Stand in the Market• South Korea - Very Attractive Market
- Growing Retirement Space- Untapped Retirement Asset Pool
• Approach to the Retirement Market• Operating Revenues and Earnings• Leading Innovator in Korea• Expanding Agency while Maintaining Quality• Expanding Bank Distribution Growth Plan

19
©UFS
MetLife Korea – Performance and Opportunity
• Growth through innovation – MetLife Korea sales1 growth - 47% CAGR since 2002– Market sales1 growth2 - 11% CAGR since 2002
• Strong professional agency – Focused on variable products – A growth engine - then, now and in the future
• Expanding in the retirement market – Professional agency – Bancassurance
1 Sales include annualized full year premiums and fees from risk and protection products such as life insurance, AD&D, etc. New sales include all deposits paid into new and existing contracts from retirement & savings products such as annuities.
2 Korea Statutory basisSource: Korea Life Insurance Association

20
©UFS
• Very efficient 3rd in ROA (FY07)• Very profitable 3rd in net income growth (FY03 - FY06)• Growing fast 2nd in premium income growth (FY03 - FY07)
1st in new sales growth (FY06 - FY07)2
• Still room to grow 9th in premium income (FY07), 3% Market Share
• Variable focused Product Mix - Variable 86%, Whole Life 11%• Agency focused Distribution Mix - Agency 88%, Bank 11% • We are an innovator in the market
Among 22 life insurers, we stand1:
1Korea Statutory basis 2KLIA started to produce new sales data in 2006Source: Korea Life Insurance Association
MetLife Korea – Where We Stand in the Market

21
©UFS
Market Changes Potential Impact
April 2007Life insurers allowed to be listed on the Korean Stock Exchange
Greater transparency, enhanced focus on profitability
April 2009Existing European-style solvency margin system replaced by a Risk Based Capital (RBC) system
• Competitors may seek external capital sources
• Potential industry consolidation• Competitors may need a more conservative
asset portfolio that may make them less competitive
South Korea – Still an Attractive Market

22
©UFS
42 43 34 26 21 19 16 13 11 9
55 54
5465727372726962
3 3 4 5 7 9 11 16 2437
0%
20%
40%
60%
80%
100%
1960 1970 1980 1990 2000 2005 2010 2020 2030 2050
0-14 15-64 65+
-407
607439
-98
-500
-400
-300
-200
-100
0
100
2010 2020 2030 2040 2050
($ Billions)
Profit/Loss
Demographics – Growing Older National Pension Services – Funding Gap
Source: Korea National Statistical Office Source: Korea National Statistical Office
(% of population by age group)
South Korea – A Growing Retirement Market
• Aging Population – highest % of population over age 65 in 30 years • National Pension Services – projected deficit in 30 years

23
©UFS
Source: Korea National Statistical Office Source: Ministry of Strategy and Finance
49.7%
3.3%8.3%
14.3%
17.5%6.8%
Financial Assets Composition2Individual Assets1
South Korea – Untapped Retirement Asset Pool
• Over 85% of individuals’ assets are in real estate or bank deposits
20.4%
2.8%
76.8%
Real Estate AssetsFinancial AssetsOthers
Bank
Bank Trust
Investment Trust
Insurance
Retail Finance
Other
1as of year end 20062as of year end 2005

24
©UFS
Attract potential assets with market leading
retirement products that exhibit principal
guarantee benefits and greater expected return
rates than from real estate / bank
investments over long-run
Attract potential assets with market leading
retirement products that exhibit principal
guarantee benefits and greater expected return
rates than from real estate / bank
investments over long-run
• A leading provider of variable products
• Continue to innovate
• Agency: Positioned as highest quality retirement planning specialists
• Bancassurance: Focused distribution of variable products through banks
• Emerging opportunity to be provider of corporate pension products
• Known as one of best variable product providers• Positioned as ‘the' professional retirement
planning company1
MetLife Korea – Our Approach to the Retirement Market
ProductProduct
BrandBrand
ChannelChannel
1 CSIS research, sole partner with Seoul National University for retirement training program

25
©UFS
MetLife Korea –Strong Growth in Operating Revenues
$1,000$918
$800
$625$510
2003 2004 2005 2006 2007
CAGR 18%
MetLife Korea – Revenue1
($ Millions)
1Premiums, Fees & Other RevenuesUS GAAP, US$ converted at FX rate $1 = KRW 1000

26
©UFS
US GAAP, US$ converted at FX $1= KRW 1000
MetLife Korea – Expanding Profitability
$130
$106
$71
$38$24
2003 2004 2005 2006 2007
CAGR 54%
MetLife Korea – Normalized Operating Earnings($ Millions)

27
©UFS
MetLife Korea – A Leading Innovator
• First company to introduce VUL (Variable Universal Life)– Awards from 3 major economic publications in 2004
• First company to introduce single payment variable annuity product with withdrawal feature (GMWB)
– Awards from 2 major economic publications for most innovative product in 2006
• First company to introduce single payment variable annuity product with principal reset feature
– Award from major economic publication in 2007
• First company to introduce monthly payment variable annuity product with principal step-up feature
– Award from major economic publication in 2008

28
©UFS
101 95 100 102 108 111
389439
504564
654
332
4,8104,103
3,245
3,1543,064
2,054
-
100
200
300
400
500
600
700
800
900
1,000
2003 2004 2005 2006 2007 Jun-08-
500
1,000
1,500
2,000
2,500
3,000
3,500
4,000
4,500
Agency Manager Field Manager FSR
MetLife Korea – An Expanding Agency Force
• Agency force: Growing fast– # of Financial Services Representatives: 50% growth in 18 months

29
©UFS
Source: MetLife research
Monthly Initial Premium per Agent*
MetLife Korea –Maintaining Industry Leading Quality
• Agency: – 2007 Highest % of MDRT
qualifiers = 37% (2007 qualifiers)
• Other foreign insurers between 10~20%, Local firms at about 10%
– Highest productivity (monthly initial premium)
$961
$953
$1,461
$834
$1,091
$1,276
$1,331
$1,475
$1,276 $1,195
$794
$995
0 500 1000 1500 2000
MetLife
Company C
Company B
Company A
Jan.-May 2008
CY2007
CY2006
* US $

30
©UFS
SC First Bank
Korea Exchange BankKookmin Bank
Citibank
HSBC Bank Shinhan Bank
MetLife Korea –Expanding Bank Distribution Network
• Expanding bank partners by focusing on nation-wide banks– Currently partnered with 6 of 9 national banks

31
©UFS
Growth Plan
• Future growth will be driven by opportunities in the retirement market with quality distribution
• Plan is to be a top 5 sales company in the Korea Life Insurance Market by 2012
• Plan for 2007 - 2012: Operating earnings to grow at 14 -18% CAGR from $130 MM to $250 - 300 MM

32
©UFS

Break
TOKYO INVESTOR CONFERENCE 2 0 0 8

Mitsui Sumitomo-MetLife Toshihiro HiroseChief Operating OfficerMSI-MetLife
TOKYO INVESTOR CONFERENCE 2 0 0 8

35
©UFS
MSI-MetLife – A Leading Annuity Company
• Variable annuity AUM, $20 Billion1
• Annuity sales2, $4.8 Billion in 2007 • Strong bank and broker-dealer relationships
– 85 distribution partners
1 as of March 31, 20082 Annuity sales include all deposits paid into new and existing contracts.

36
©UFS
MSI-MetLife – Value Added by Both Partners
• Mitsui Sumitomo Insurance – Strong distribution relationships– Broad brand recognition– Domestic market knowledge
• MetLife– Experience in the global annuity market– Broad & deep product development resources– Expertise in wholesaler model– Global risk hedging
37
©UFS
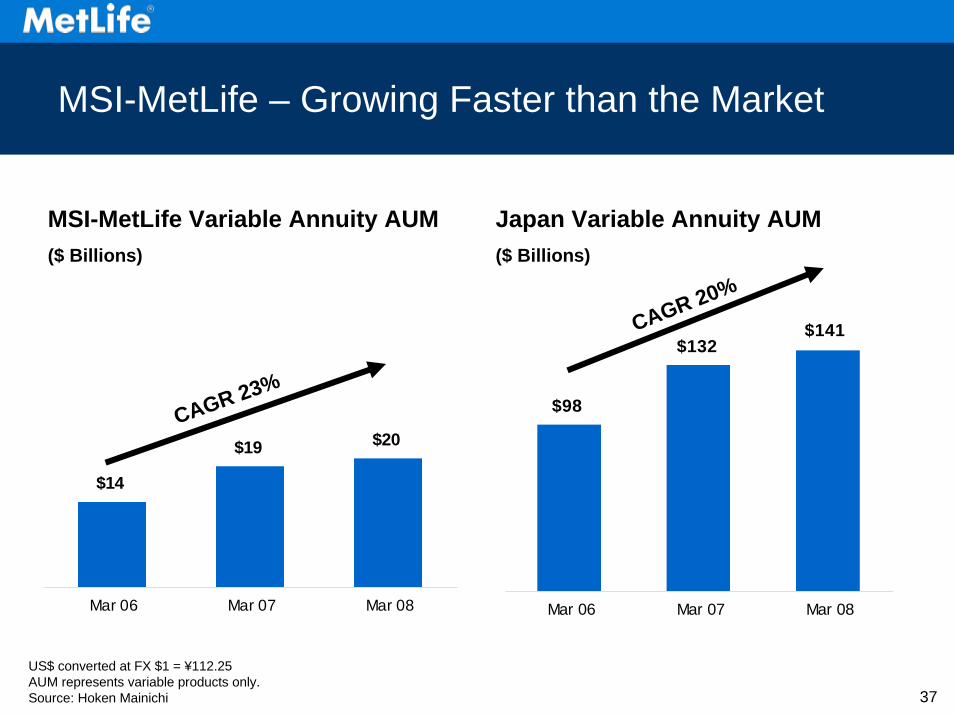
$14
$19 $20
Mar 06 Mar 07 Mar 08
US$ converted at FX $1 = ¥112.25 AUM represents variable products only.Source: Hoken Mainichi
$141$132
$98
Mar 06 Mar 07 Mar 08
CAGR 20%
Japan Variable Annuity AUM($ Billions)
CAGR 23%
MSI-MetLife Variable Annuity AUM($ Billions)
MSI-MetLife – Growing Faster than the Market

38
©UFS
$4,793$5,353
$4,237
$3,295$3,552
FY 2003 FY 2004 FY 2005 FY 2006 FY 2007
VA FA
CAGR 8%
MSI-MetLife Annuity Sales1 (Fiscal Year2) ($ Millions)
1 Annuity sales include all deposits paid into new and existing contracts.2 Fiscal Year April- March.
MSI-MetLife – Annuity Sales

39
©UFS
MSI-MetLife – Gaining Share in Challenging Year
FY 2006
38%
48%
14%
Foreign Colleagues Domest ic Colleagues MSI-Met Lif e
1 Annuity sales include all deposits paid into new and existing contracts.US$ converted at FX $1 = ¥112.25 Source : Nikkei Veritas July 13, 2008 edition
2007 Annuity Sales1 – Top 10 Companies($ Billions)
FY 2007
53%
32%
15%
Foreign Colleagues Domest ic Colleagues MSI-Met Lif e
$37.1 $31.7

40
©UFS
23%
13%
12%12%7%
4%4%
4%
6%
MSI- MetLife 14%
Variable Annuity Market AUM(March 31, 2008)
Source : Hoken Mainichi
MSI-MetLife – 14% of the Market

41
©UFS
MSI-MetLife – A Look Ahead
• Aging population, with assets in low yielding bank deposits
• Japan Post• Sales training, a core competency

42
©UFS
Annuity Market Potential – $15.5 Trillion
US $45.3 Japan $15.5 Deposit in Japan Post: 22% of Bank deposit or 12% of all Individual financial assets
12%2%
31%
1%
54%
Bank Deposit Equities & BondsMutual Funds Others Annuities
11%
44%13%
29%
3%
Individual Financial Assets1
($ Trillions)
1 as of September 30, 2008Source: Bank of Japan Flow of Funds - household financial assets, JP Morgan, March 19, 2008

43
©UFS
MSI-MetLife – The Japan Post Opportunity
• We are one of four selected annuity producers
MSI-MetLifeSingle premium GMWB for LifeAnnuity payment in “Odd months”
Sumitomo Life Single premium GMABNo step up
ING Single premium GMAB Step up with 10%20%30%
Alico Installment premium GMAB
Japan Post Holdings
Primary Business: Full service banking,investments, consumer loans
YuchoBank
Primary Business:Auto, home, life & health insurance
Post OfficeCompany
Postal ServicesCompany

44
©UFS
234 branches1,000 salariedsales staff$1.8 trillion in depositsAll individualaccounts
24,000 branches60,000 salariedsales staff
US$ converted at FX $1 = ¥112.25Source: Japan Post Web
161
Japan Post Holdings
YuchoBank
Post OfficeCompany
Number of branches to sell annuities
May 2008
~320Oct 2008
1,500+*
*No. of Branches where investment trusts are sold
~390Jan 2009
Japan Post – A Growing Sales Organization

45
©UFS
Dec-05
Feb-06
Apr-06
Jun-0
6Aug
-06Oct-
06Dec
-06Feb-0
7Apr-
07Ju
n-07
Aug-07
Oct-07
Dec-07
Feb-08
Apr-08
Jun-0
8
Source: Japan Post Web
End of June 2008$ 11,251 million
Japan Post Cumulative Investment Trusts Sales($ Millions)
Japan Post – Sales Potential
• Japan Post sold over $11 Billion of Investment Trusts in 33 months
• Similar potential for variable annuity products

46
©UFS
• Most popular product– GMWB for Life
• Well accepted strategy – “Sell annuities as annuities”
• Highly regarded distributor training program
MSI-MetLife – Competitive Advantages

47
©UFS
• Trained nearly 6,000 agents from distributors in FY 2007
(Training center in Kansai Branch)• Initiatives for FY 2008
– Develop improved curriculum– Target 10,000 participants– Kansai training center
MSI-MetLife – Training as Competitive Advantage
Training seminars held 227
Participants 5,911
Distributors groups 53
Japan Post sessions (2008) 320
Japan Post participants 3,000

48
©UFS
MSI-MetLife – Important Takeaways
• VAs in Japan, still an emerging market– Expected shift from bank deposits
• The Japan Post, a significant opportunity • Distributor training, a key differentiator

49
©UFS

Wrap Up
TOKYO INVESTOR CONFERENCE 2 0 0 8

51
©UFS
MetLife Asia Pacific: Strategies for Growth
• Objective: Grow sales & earnings at CAGR of 20 - 25%• Import expertise and best practices• Focus on products and solutions for our customers’
retirement needs • Expand bank distribution relationships• Grow agent distribution in select markets• Expand footprint within existing markets• Strategic acquisitions, joint ventures and investments• Operational excellence

52
©UFS
$17$46
$499
$236
$4$0
$100
$200
$300
$400
$500
2004 2005 2006 2007 20081H
($ Millions)
Sales1
Source: MetLife International Controllers Business Metrics Report
MetLife in China has been a leader in Unit-Linked products to serve the rising middle class
• Expanding bank distribution in wealth concentrated cities and highly populated provinces
• Providing traditional protection products with unique riders for the underinsured population
1 Sales include annualized full year premiums and fees from risk and protection products such as life insurance, credit insurance, AD&D, etc. New sales include all deposits paid into new and existing contracts from retirement & savings products such as annuities.

53
©UFS
Source: MetLife International Controllers Business Metrics Report
MetLife India has been consistently ranked as one of Top 5 fastest growing insurance companies
• Innovative retirement & saving products
• Significant growth in agent sales force
• Bank distribution with Axis Bank, JK Bank & others $10
$27
$53
$153 $153
$0
$100
$200
2004 2005 2006 2007 20081H
($ Millions)Sales1
1 Sales include annualized full year premiums and fees from risk and protection products such as life insurance, credit insurance, AD&D, etc. New sales include all deposits paid into new and existing contracts from retirement & savings products such as annuities.

Questions & Answers
TOKYO INVESTOR CONFERENCE 2 0 0 8

55
©UFS

Appendix
TOKYO INVESTOR CONFERENCE 2 0 0 8

57
©UFS
Explanatory Note on Non-GAAP Financial Information
The historical and forward-looking financial information presented at this conference and contained in these presentations include performance measures which are based on methodologies other than Generally Accepted Accounting Principles (“GAAP”). MetLife analyzes its performance using so-called non-GAAP measures, including operating earnings, operating earnings available to common shareholders, operating earnings available to common shareholders per diluted common share and operating return on common equity. MetLife believes these measures enhance the understanding and comparability of its performance by excluding net investment gains and losses, net of income tax, and adjustments related to net investment gains and losses, net of income tax, both of which can fluctuate significantly from period to period, the impact of the cumulative effect of a change in accounting, net of income tax, and discontinued operations other than discontinued real estate, net of income tax, thereby highlighting the results from operations and the underlying profitability drivers of the business.
Operating earnings is defined as GAAP net income, excluding net investment gains and losses, net of income tax, adjustments related to net investment gains and losses, net of income tax, the impact of the cumulative effect of a change in accounting, net of income tax, and discontinued operations other than discontinued real estate, net of income tax. Scheduled settlement payments on derivative instruments not qualifying for hedge accounting treatment are included in operating earnings.
Operating earnings available to common shareholders is defined as operating earnings less preferred stock dividends, which are recorded in Corporate & Other. All references in these slides and in the presentations made at this conference to “operating earnings” for the years indicated in these slides and future years should be read as references to “operating earnings available to common shareholders.”
Operating earnings available to common shareholders per diluted common share is calculated by dividing operating earnings available to common shareholders (as defined above) by the number of weighted average diluted common shares outstanding for the period indicated. All references in these slides and in the presentations made at this conference to “operating earnings per share” for the years indicated in these slides and future years should be read as references to “operating earnings available to common shareholders per diluted common share.”

58
©UFS
Explanatory Note on Non-GAAP Financial Information(Continued)
Operating return on common equity is calculated by dividing operating earnings available to common shareholders (as defined above) by average common equity for the period indicated, excluding accumulated other comprehensive income.
For the historical periods presented, reconciliations of non-GAAP measures used in the presentations made at this conference to the most directly comparable GAAP measures are included in the Appendix to the presentation materials and are available on the Investor Relations portion of the Company’s website (www.metlife.com). Additional information about MetLife’s historical financial results is available in the Company’s Quarterly Financial Supplements which may be accessed through the Investor Relations portion of the Company’s website. The non-GAAP measures used in the presentations made at this conference should not be viewed as substitutes for the most directly comparable GAAP measures.
In the presentations made at this conference, MetLife provides guidance on its future earnings, earnings per share and return oncommon equity on an operating, non-GAAP basis. A reconciliation of these measures to the most directly comparable GAAP measures is not accessible on a forward-looking basis because MetLife believes it is not possible to provide a reliable forecast of net investment gains and losses, which can fluctuate significantly from period to period and may have a significant impact on GAAP net income.

59
©UFS
Reconciliation of Net Income Available to Common Shareholders to Operating Earnings Available to Common Shareholders & Normalized Operating Earnings
* Adjustments related to net investment gains (losses), net of income tax, includes amortization of unearned revenue and deferred policy acquisition costs, adjustments to the policyholder obligation and amounts allocable to certain participating contracts.
** Adjustments related to normalized items include, but are not limited to, tax adjustments, reserve adjustments, premium recoverables and other liability write-offs.
($ Millions) 2004 2005 2006 2007 20081HTotal International Net income available to common shareholders 163$ 193$ 200$ 635$ 359$
Investment (gains) losses and related adjustments * (37) 41 56 (76) (75) Discontinued operations 9 (6) (28) 9 -
Operating earnings available to common shareholders 165 228 228 568 284 Normalized items ** (26) (12) 60 (151) (14)
Normalized operating earnings 139$ 216$ 288$ 417$ 270$

60
©UFS