CORPORATE PRESENTATION - ALFA · CORPORATE PRESENTATION ... • Extensive consumer research ......
36
CORPORATE PRESENTATION This presentation contains forward-looking information based on numerous variables and assumptions that are inherently uncertain. They involve judgments with respect to, among other things, future economic, competitive and financial market conditions and future business decisions, all of which are difficult or impossible to predict accurately. Accordingly, results are likely to vary from those set forth in this presentation. Copyright © 2017 ALFA, S.A.B. de C.V. All rights reserved. Reproduction and distribution is forbidden without the prior written consent of ALFA, S.A.B. de C.V. CORPORATE PRESENTATION SEPTEMBER, 2017
-
Upload
hoangtuyen -
Category
Documents
-
view
220 -
download
2
Transcript of CORPORATE PRESENTATION - ALFA · CORPORATE PRESENTATION ... • Extensive consumer research ......
CORPORATE PRESENTATION
This presentation contains forward-looking information based on numerous variables and assumptions that are
inherently uncertain. They involve judgments with respect to, among other things, future economic, competitive and
financial market conditions and future business decisions, all of which are difficult or impossible to predict accurately.
Accordingly, results are likely to vary from those set forth in this presentation. Copyright © 2017 ALFA, S.A.B. de
C.V. All rights reserved. Reproduction and distribution is forbidden without the prior written consent of ALFA, S.A.B.
de C.V.
CORPORATE PRESENTATIONS E P T E M B E R , 2 0 1 7

CORPORATE PRESENTATION
ALFA participates in Key areas of the economy
2016 Results Guidance 2017
Revenues (U.S. $ Billions) $15.8 $16.2
EBITDA (U.S. $ Billions) $2.3 $2.2
Capex (U.S. $ Millions) $1,491* $1,063
Net Debt/EBITDA 2.5 times 2.7 times
Interest Coverage 6.6 times 5.4 times
* Including acquisitions
SIGMA
Refrigerated Foods
ALPEK
Petrochemicals
NEMAK
Aluminum Auto Parts
AXTEL
IT + Telecom
NEWPEK
Hydrocarbons
2 ALFA
CORPORATE PRESENTATION
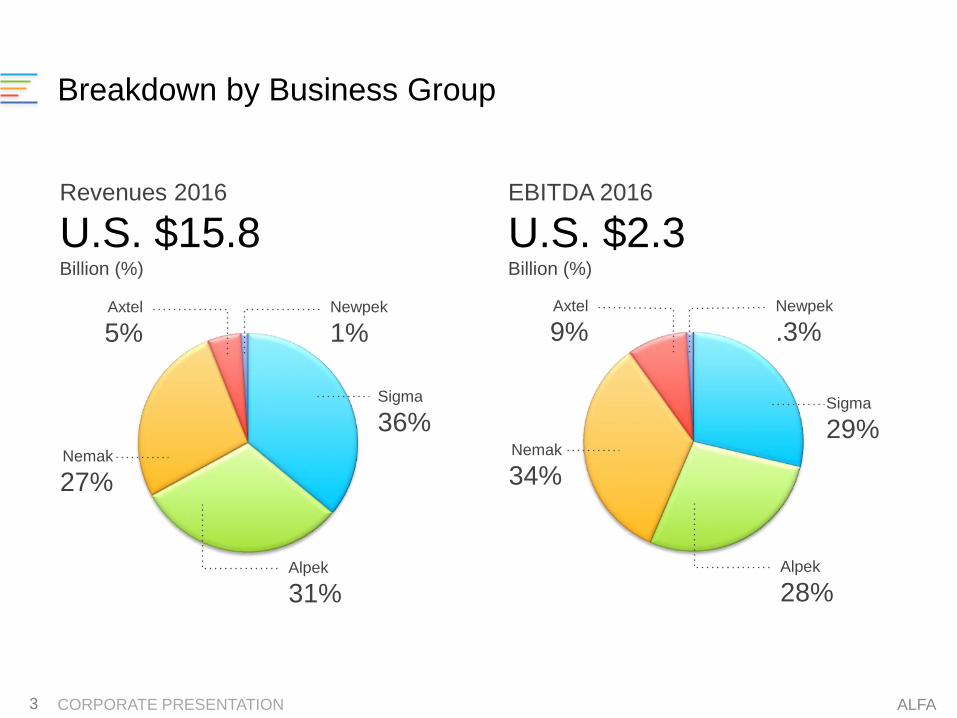
Breakdown by Business Group
Revenues 2016
U.S. $15.8Billion (%)
EBITDA 2016
U.S. $2.3Billion (%)
3 ALFA
Sigma
29%
Newpek
.3%Axtel
9%
Nemak
34%
Alpek
28%
Sigma
36%
Newpek
1%Axtel
5%
Nemak
27%
Alpek
31%

CORPORATE PRESENTATION
Ownership
100%
82%
75%
53%
100%
4
Public company since 2012.
Public company since 2015.
Ford Motor Co. owns 5.4%.
Public company since 2005.
ALFA

CORPORATE PRESENTATION
Global footprint
5
Production
Facilities in
28 countries
~65% of
sales outside
Mexico
More than
81,000
employees

CORPORATE PRESENTATION
Focused on long-term value creation
6
Revenues(U.S. $ Billion)
EBITDA(U.S. $ Billion)
ALFA

CORPORATE PRESENTATION
Refrigerated Foods
7

CORPORATE PRESENTATION
Multinational food company dedicated to bringing local
favorite foods to communities everywhere
2016
Revenues
U.S. $5.7billion
EBITDA
U.S. $663million in 2016
8 SIGMA

CORPORATE PRESENTATION
Region % Sales
Highly recognized branded foods in Mexico, U.S., Central &
South America and Europe
• Broad geographic footprint 69 production plants in 18 countries
• Offers quality food at a wide range of price points and across diverse
categories
9
U.S.
16%
Mexico
41%Europe
36%
LATAM
7%
SIGMA
Meats
58%Dairy
17%
Dry Meats
18%
Other Categories
7%
Mexico
United States
Dominican Rep.
El Salvador
Guatemala
Ecuador
Peru
Honduras
Nicaragua
Costa Rica
Portugal
Italy
Belgium
Germany
Netherlands
Spain
France
Romania

CORPORATE PRESENTATION
Diversified and strong brand portfolio in each market
PACKAGED MEATS DAIRY OTHER THIRD PARTY
MÉ
XIC
OE
UR
OP
AE
E.U
U.
LA
TA
M
10 SIGMA
CORPORATE PRESENTATION
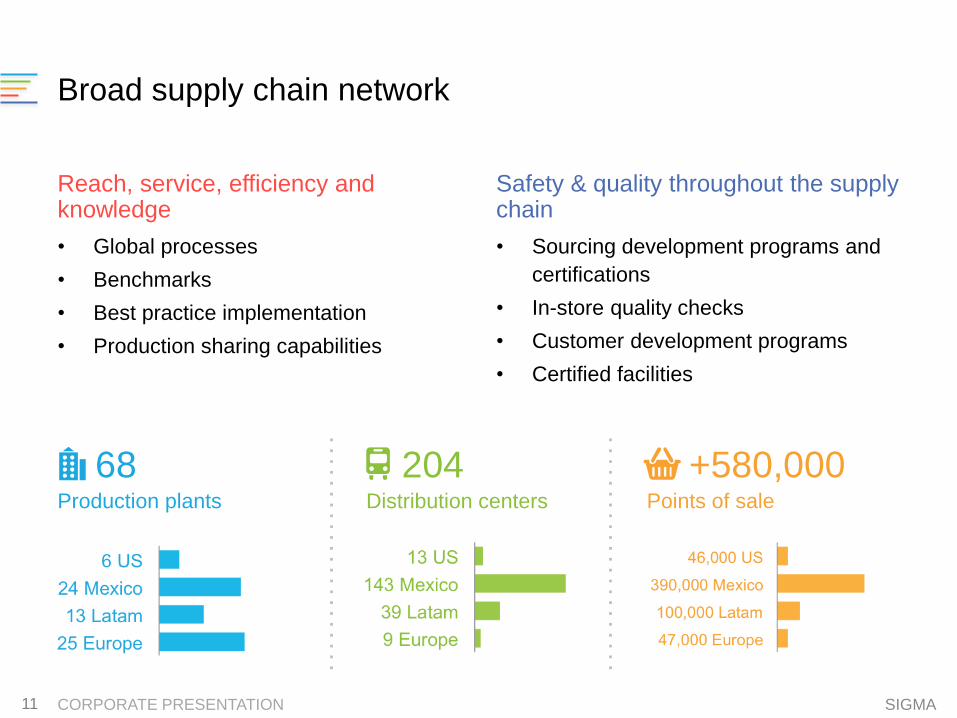
Broad supply chain network
Reach, service, efficiency and knowledge
• Global processes
• Benchmarks
• Best practice implementation
• Production sharing capabilities
Safety & quality throughout the supply chain
• Sourcing development programs and
certifications
• In-store quality checks
• Customer development programs
• Certified facilities
11
68Production plants
204Distribution centers
+580,000Points of sale
SIGMA

CORPORATE PRESENTATION
Product & Process Innovation
Consumer-driven innovation
• Extensive consumer research
• Proprietary mathematical models
• Sigma Innovation System
State-of-the-Art Research & Development
center
• With +160 specialists
• Leadership in food process technology
R&D Alliances
• Research agreements with educational
and governmental institutions
• Open technology
12 SIGMA
CORPORATE PRESENTATION
Petrochemicals
13
CORPORATE PRESENTATION
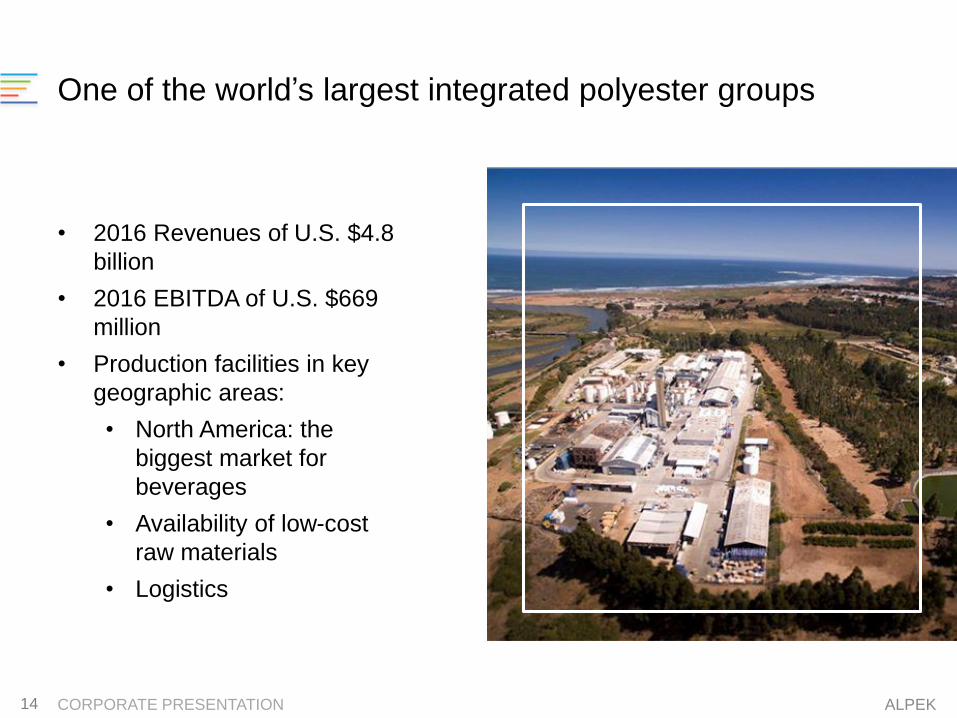
One of the world’s largest integrated polyester groups
• 2016 Revenues of U.S. $4.8
billion
• 2016 EBITDA of U.S. $669
million
• Production facilities in key
geographic areas:
• North America: the
biggest market for
beverages
• Availability of low-cost
raw materials
• Logistics
14 ALPEK

CORPORATE PRESENTATION
Business Segments
Polyester chain
2016
Revenues U.S. $3.4 billion (71%)
EBITDA U.S. $349 million (52%)
Products
PTA
PET
Polyester fibers
Plastics & chemicals
2016
Revenues U.S. $1.4 billion (29%)
EBITDA U.S. $322 million (48%)
Products
PP
EPS
CPL
Fertilizers and other chemicals
15 ALPEK

CORPORATE PRESENTATION
Alpek´s products are widely used for food packaging and
consumer end-markets
Beverage Food Personal care Textiles
Sample end users by industry
Construction
3%Textiles
7%
Consumer
Goods
32%
Food and
Beverages
58%
Volume 2016
By end market(3,939 KTA)
Asia & others
1%Europe
3%Latam
14%
Mexico
37%
USA &
Canada
45%
Sales 2016
Geography
16 ALPEK

CORPORATE PRESENTATION
Alpek’s installed capacity amounts to 5.8 million tons
Installed Capacity Breakdown (Kta)
SITE PTA PET rPET FIBERS PP EPS CPL OTHER
Mexico
(2,950
Kta)
A Monterrey 160
B Altamira 1,000 640 165
C Salamanca 85
D Ocotlán 10
E Cosoleacaque 610 185
F Lerma 100
USA
(2,270
Kta)
G Cedar Creek 170 73
H Cooper River 170 150
I Columbia 640 725
J Pearl River 430
Canadá K Selenis 144
Argentina
(225
Kta)
L Zárate 190
M Pacheco 16
N General Lagos 19
Brasil O Guaratingueta 46
Chile
(27
Kta)
P Santiago 5
Q Puerto Montt 2
R Concon 20
Capacidad Total: 5,755 Kta 2,250 2,014 89 310 640 250 85 117
Mexico
United Sates
Argentina
Chile
Brazil
More than
5,200employees
23 Production
facilities
Corpus Christi
(2017)
PTA: 420 kta
PET: 500 kta
Source: Alpek estimates Kta: Thousand tons per year
(1) Includes industrial and specialty chemicals and recycled PET capacities
17 ALPEK

CORPORATE PRESENTATION
Alpek is investing in attractive organic projects to boost
profitability
Strategic Guidelines
• Capture natural gas,
ethane and propane
advantage in North
America
• Maximize operating
efficiency
• Selective capacity
expansion
• Lever IntegRex®
technology
Project Overview estimated figures and dates
Project
Capex
(US $M)
EBITDA
(US$M) Start-up
1. Cosoleacaque Cogeneration (85 MW) 140 30 4Q14
2. MEG Tolling Agreement 65 20 2Q16
3. Propylene Spheres 23 10 2Q17
4. PTA/PET Site (Corpus Christi) 400+ 100 2017
5. EPS Expansion Altamira 30 10 2017
6. Altamira Cogeneration (350 MW) 350 90 2018
Total ~ $1 B ~$260
U.S. $900 million invested up to Jun-17
Source: Alpek estimates
18 ALPEK

CORPORATE PRESENTATION
Aluminum auto parts
19
CORPORATE PRESENTATION
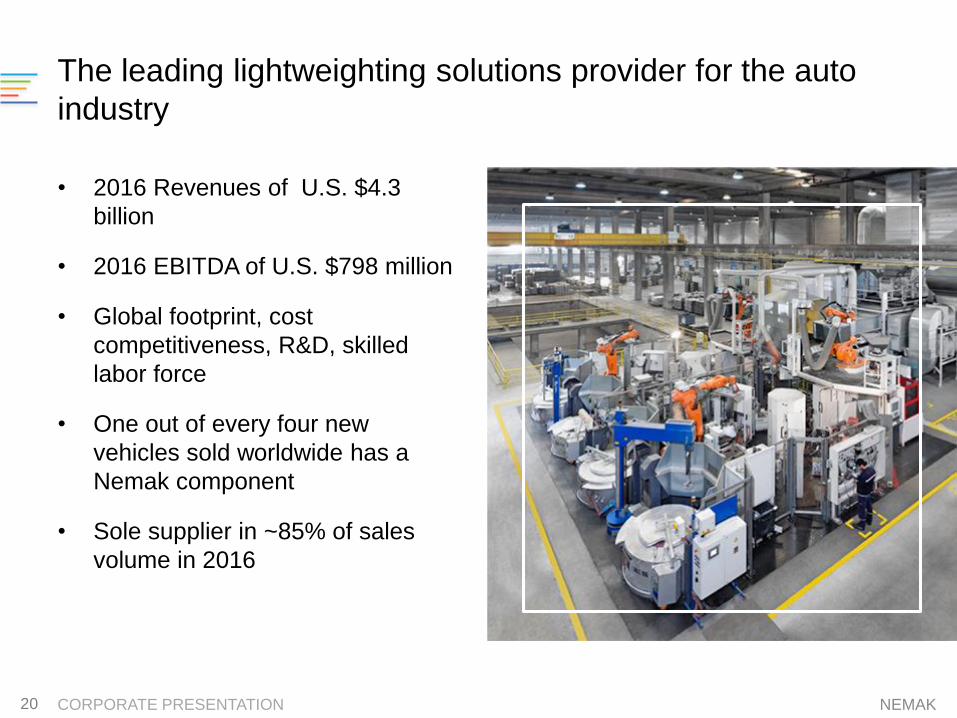
The leading lightweighting solutions provider for the auto
industry
• 2016 Revenues of U.S. $4.3
billion
• 2016 EBITDA of U.S. $798 million
• Global footprint, cost
competitiveness, R&D, skilled
labor force
• One out of every four new
vehicles sold worldwide has a
Nemak component
• Sole supplier in ~85% of sales
volume in 2016
20 NEMAK

CORPORATE PRESENTATION
Focused on complex aluminum components for the
automotive industry
Powertrain
• Heads
• Blocks
• Transmission
EV Components
• E-Drive housings
• Battery housings
Structural Components
• Longitudinal menbers
• Shock tower
• Cross menbers
21 NEMAK
CORPORATE PRESENTATION
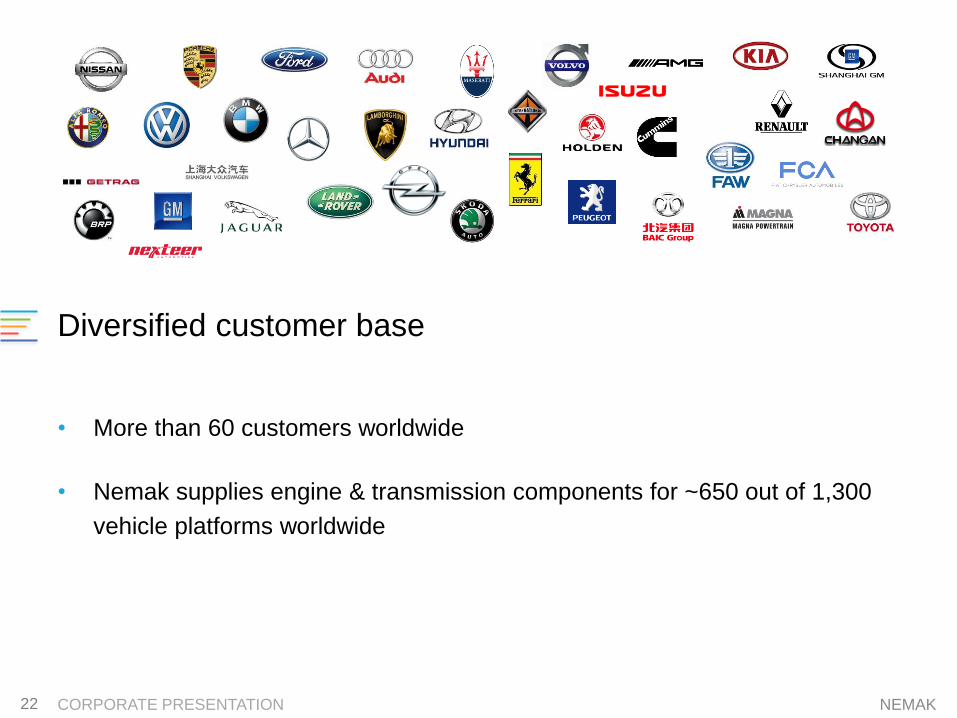
Diversified customer base
• More than 60 customers worldwide
• Nemak supplies engine & transmission components for ~650 out of 1,300
vehicle platforms worldwide
22 NEMAK
CORPORATE PRESENTATION
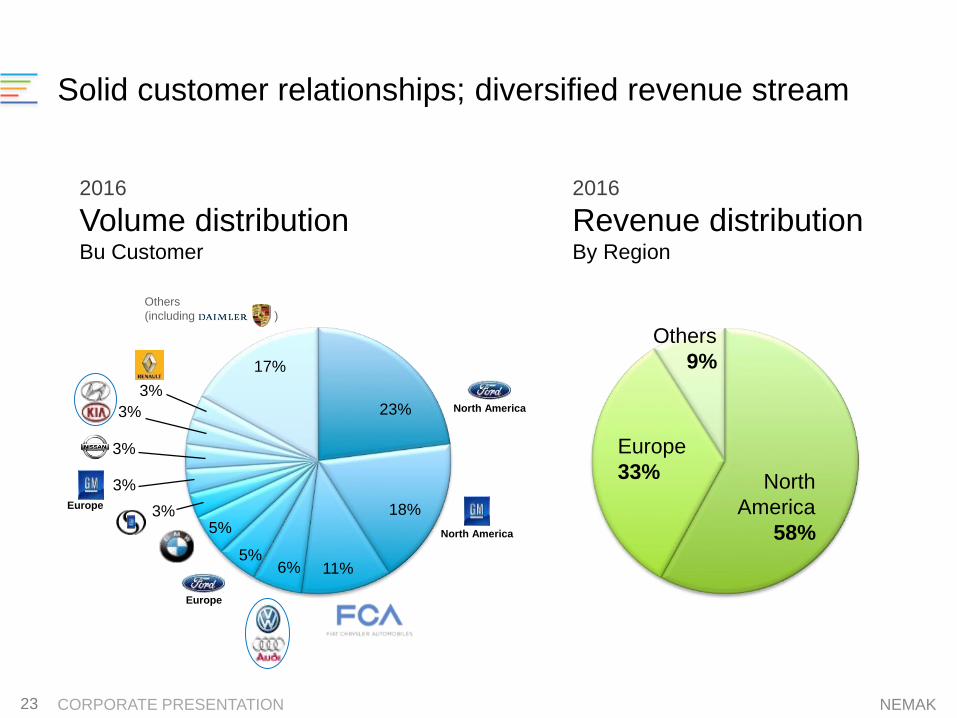
Solid customer relationships; diversified revenue stream
North
America
58%
Europe
33%
Others
9%
North America
North America
Europe
Europe
Others
(including )
23%
18%
11%6%5%
5%3%
3%
3%
3%
17%
3%
2016
Volume distributionBu Customer
2016
Revenue distributionBy Region
23 NEMAK

CORPORATE PRESENTATION
Modern facilities with a global footprint near key customers
• Global footprint serving all major markets
• 36 manufacturing facilities strategically located close to customer sites
• North America (18), Europe (12), South America (3), Asia (3)
24
Canada
United States
Mexico
Brazil
Argentina
Spain
Germany
Hungary
Russia
Slovakia
Poland
Austria
Czech Republic
India
China
Turkey
NEMAK

CORPORATE PRESENTATION
Aluminum components expected to grow due to stricter
environmental standards
NA and EU LV Aluminum Content(Pounds per vehicle)
2012
324
2015e
350
301
2009
24
2018e
426
2021e
475
2025e
380
Structural
Components
Others
Heat Transfers
Wheels & Brakes
Transmissions
Engine Blocks
Cylinder Heads
Source: Ducker, Nemak
109
25 NEMAK

CORPORATE PRESENTATION
IT + Telecomm
26

CORPORATE PRESENTATION
IT and Communication services for the enterprise,
government and mass markets
Main Services
• Data centers
• Information security
• Managed networks
• Consultancy services
• Systems integration
• Cloud services
• Internet
• Pay-TV
27 AXTEL

CORPORATE PRESENTATION
Diversified revenue stream; focused on the enterprise
market
2016Revenues
U.S. $736million
EBITDA
U.S. $225Million in 2016
28 AXTEL
7%Wireless
13%FTTH
14%IT
66%Telecomm
Sales
Breakdown(By type of service)
14%Government
20%
Mass
market
66%Enterprise
By
Market Segment

CORPORATE PRESENTATION
Strategic evolution
• Start up local mass market «Fixed Wireless»
• Avantel acquisition (´06)
• Broad band mass market
• Vertical markets
• Cloud services
• App management
• Data center
• Enterprise strategy
• Value added services – Data IP
• Start up LD services
ALESTRA CONVERGENCE
• Unified communications
• Managed networks
• Security
• Large Scale Solutions
• Systems integration
• Data center
• IPTV (´13)
• Cloud services & managed IT
1997
1999
2000
2008
2011
2008
2011
• Value added services mass market– Wimax
• Enterprise integration Telco / IT
• FTH
2015 2015
TELECOMM MARKET OPENED
IP PROTOCOL, INTERNET BUBBLE
VOICE AND DATA NET CONVERGENCE LAN/WAN
TELECOM / IT CONVERGENCE
DATA CENTER CONVERGENCE
MEGER 2016
29 AXTEL

CORPORATE PRESENTATION
Infrastructure provides access to +90% of Mexican market
• 40,400 km of long-haul
fiber optics
• 23,100 km of long
distance
• 11,300 km of metro
rings
• 6,000 km of FTTH
network
• Six data centers
• 7,000 m2
• FTTH in major cities
30 AXTEL
- 53 cities with data services
- 39 cities with local services
- 10 cities with FTTH
CORPORATE PRESENTATION
Hydrocarbons
31
CORPORATE PRESENTATION
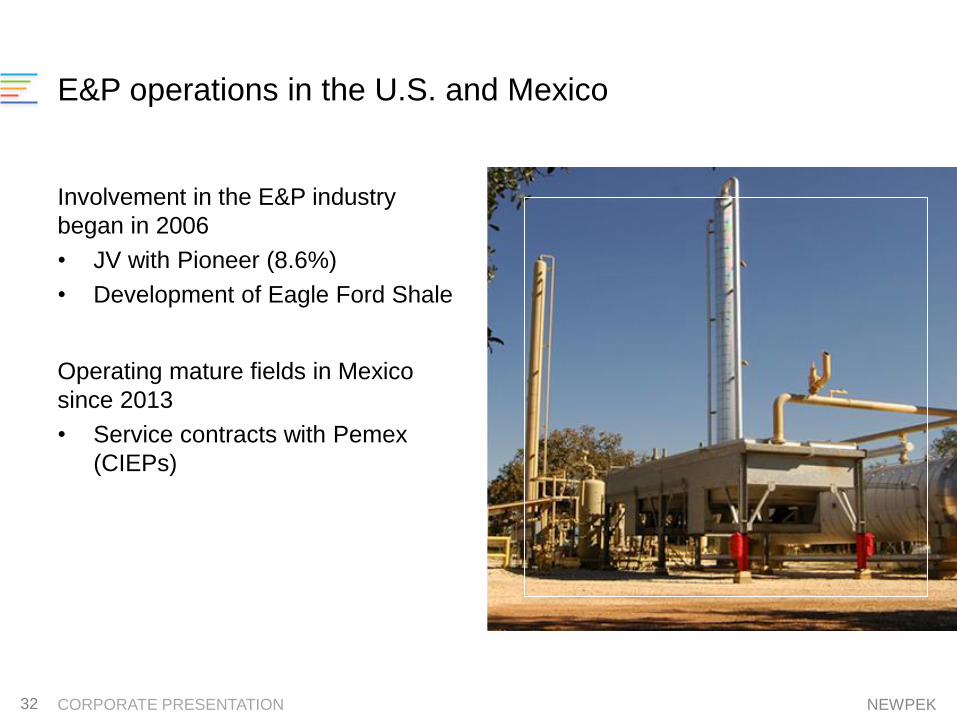
E&P operations in the U.S. and Mexico
Involvement in the E&P industry
began in 2006
• JV with Pioneer (8.6%)
• Development of Eagle Ford Shale
Operating mature fields in Mexico
since 2013
• Service contracts with Pemex
(CIEPs)
32 NEWPEK

CORPORATE PRESENTATION
Newpek fields
KS
TX
OK
CO
Eagle Ford
Current U.S. Operations
Talent
• Team of experience
people in the US.
• World-class partners (e.g.
Pioneer Natural
Resources)
Technology
•Fracking for horizontal drilling
in Eagle Ford – 632 wells in
operation
•Mature fields optimization
•World-class sub-surface
analysis capabilities
33
Successful transition to
operations
• Experienced transition to
operations
• Mineral rights on leases
over 220,000 acres
Net production
(mboed)EBITDA
(U.S. $ million)
NEWPEK

CORPORATE PRESENTATION
Activities in Mexico
• Service contracts in San Andrés and
Tierra Blanca fields
• Producing over 3.5 mboed on 128 wells
• Optimization of existing wells
• Development of new wells in
conventional formations
• Migrating existing CIEPs to new
Exploration and Production Contracts
(CEEs)
34 NEWPEK
CORPORATE PRESENTATION
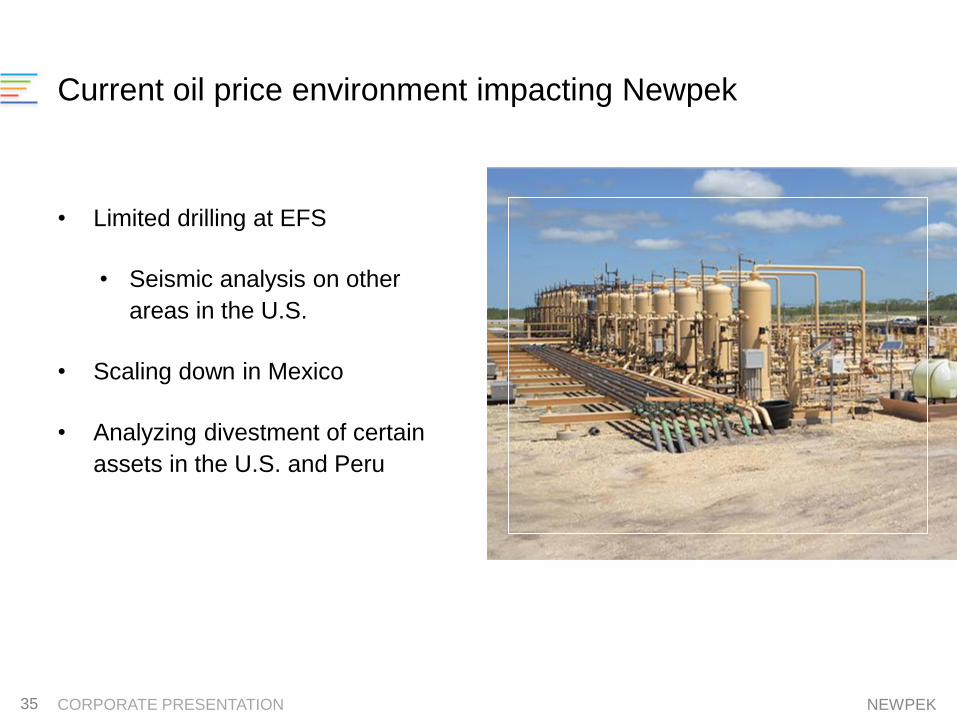
Current oil price environment impacting Newpek
• Limited drilling at EFS
• Seismic analysis on other
areas in the U.S.
• Scaling down in Mexico
• Analyzing divestment of certain
assets in the U.S. and Peru
35 NEWPEK
CORPORATE PRESENTATION
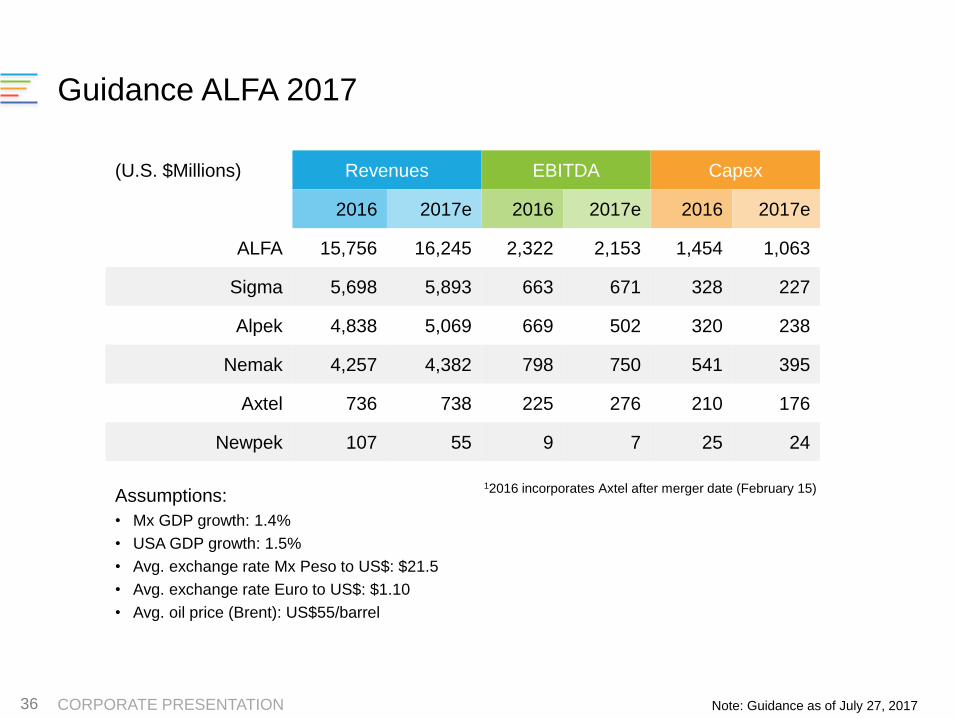
Guidance ALFA 2017
(U.S. $Millions) Revenues EBITDA Capex
2016 2017e 2016 2017e 2016 2017e
ALFA 15,756 16,245 2,322 2,153 1,454 1,063
Sigma 5,698 5,893 663 671 328 227
Alpek 4,838 5,069 669 502 320 238
Nemak 4,257 4,382 798 750 541 395
Axtel 736 738 225 276 210 176
Newpek 107 55 9 7 25 24
Assumptions:
• Mx GDP growth: 1.4%
• USA GDP growth: 1.5%
• Avg. exchange rate Mx Peso to US$: $21.5
• Avg. exchange rate Euro to US$: $1.10
• Avg. oil price (Brent): US$55/barrel
12016 incorporates Axtel after merger date (February 15)
36 Note: Guidance as of July 27, 2017