Corporate Presentation June 2015
40
CORPORATE PRESENTATION JUNE 2015 westernareas com au | ASX: WSA www westernareas com au | ASX: WSA ASX:WSA ASX:WSA westernareas.com.au | ASX: WSA www . westernareas.com.au | ASX: WSA
-
Upload
western-areas-ltd -
Category
Presentations & Public Speaking
-
view
24.394 -
download
4
Transcript of Corporate Presentation June 2015

CORPORATE PRESENTATION
JUNE 2015
westernareas com au | ASX: WSAwwwwesternareas com au | ASX: WSA
ASX:WSAASX:WSA
westernareas.com.au | ASX: WSAwww.westernareas.com.au | ASX: WSA

DISCLAIMER AND FORWARD LOOKING STATEMENTS
This presentation is being furnished to you solely for your information and for your use and may not be copied, reproduced or redistributed to any other person inany manner. You agree to keep the contents of this presentation and these materials confidential. The information contained in this presentation does notconstitute or form any part of any offer or invitation to purchase any securities and neither the issue of the information nor anything contained herein shall formthe basis of or be relied upon in connection with any contract or commitment on the part of any person to proceed with any transactionthe basis of, or be relied upon in connection with, any contract or commitment on the part of any person to proceed with any transaction.
The distribution of this presentation in jurisdictions outside Australia may be restricted by law, and persons into whose possession this presentation comes shouldinform themselves about, and observe, any such restrictions. This is not for distribution or dissemination in the U.S.
The information contained in this presentation has been prepared by Western Areas Ltd. No representation or warranty, express or implied, is or will be made in orin relation to and no responsibility or liability is or will be accepted by Western Areas Ltd employees or representatives as to the accuracy or completeness of thisin relation to, and no responsibility or liability is or will be accepted by Western Areas Ltd, employees or representatives as to the accuracy or completeness of thisinformation or any other written or oral information made available to any interested party or its advisers and any liability therefore is hereby expressly disclaimed.No party has any obligation to notify opinion changes or if it becomes aware of any inaccuracy in or omission from this presentation. All opinions and projectionsexpressed in this presentation are given as of this date and are subject to change without notice.
This document contains forward‐looking statements including nickel production targets and cost estimates. These statements are based on assumptions andi i h bj h i h i d i i k d i i h ld h f hi fcontingencies that are subject to change without notice, and certain risks and uncertainties that could cause the performance or achievements of Western Areas
Ltd to differ materially from the information set forth herein. Often, but not always, forward looking statements can generally be identified by the use of forwardlooking words such as “may”, “will”, “expect”, “intend”, “plan”, “estimate”, “anticipate”, “continue”, and “guidance”, or other similar words and may include,without limitation, statements regarding plans, strategies and objectives of management, anticipated production and expected costs. Western Areas Ltdundertakes no obligation to revise these forward‐looking statements to reflect subsequent events or circumstances. Individuals should not place undue reliance onforward‐looking statements and are advised to make their own independent analysis and determination with respect to the forecasted periods, which reflectg p y p p ,Western Areas Ltd’s view only as of the date hereof.
The information within this PowerPoint presentation was compiled by Western Areas management, but the information as it relates to mineral resources andreserves was prepared by Mr. Dan Lougher and Mr. Andre Wulfse. Mr. Lougher and Mr. Wulfse are full time employees of Western Areas Ltd. Mr. Lougher and Mr.Wulfse are members of Australian Institute of Mining and Metallurgy (AusIMM) and have sufficient experience which is relevant to the style of mineralisation andtype of deposit under consideration and to the activity which they are undertaking to qualify as Competent Persons as defined in the 2012 Edition of thetype of deposit under consideration and to the activity which they are undertaking to qualify as Competent Persons as defined in the 2012 Edition of the‘Australasian Code for Reporting of Exploration Results, Mineral Resources and Ore Reserves’(2012 JORC Code). Mr. Lougher and Mr. Wulfse consent to theinclusion in this presentation of the matters based on the information in the form and context in which it appears. The information contained in this presentationin relation to the New Morning Deposit was prepared and first disclosed under the 2004 Edition of the JORC Code. It has not been updated since to comply withthe 2012 JORC Code on the basis that the information has not materially changed since it was last reported.
For the Purposes of Clause 3 4(e) in Canadian instrument 43 101 the Company warrants that Mineral Resources which are not Mineral Reserves do not have
ASX:WSAASX:WSAASX:WSA 2
For the Purposes of Clause 3.4(e) in Canadian instrument 43‐101, the Company warrants that Mineral Resources which are not Mineral Reserves do not havedemonstrated economic viability.
AGENDA
Explore Mine
Corporate
Operations
Produce SalesExploration and Growth Outlook
Nickel Market
Appendix
ASX:WSAASX:WSAASX:WSA 3

CORPORATE
ASX:WSAASX:WSAASX:WSAASX:WSA 4

CORPORATE OVERVIEW
Key Information as at 8 June 2015Board & Senior Management
Share price 3.62
52 week high/low (A$) 5.30 / 3.03
Shares outstanding (m) 232 6
Name Position
Ian Macliver Independent Non‐Executive Chairman
Dan Lougher Managing Director & CEOShares outstanding (m) 232.6
Market Capitalisation (A$m) 842
Cash (A$m)1 193.0
David Southam Executive Director
Joseph Belladonna Chief Financial Officer & Company Secretary
Julian Hanna Non‐Executive Director
Ri h d Y I d d N E i Di Debt (A$m)1 125.0
Undrawn ANZ Facility 125.0
Richard Yeates Independent, Non‐Executive Director
Craig Readhead Independent, Non‐Executive Director
Tim Netscher Independent, Non‐Executive Director
ASX:WSAASX:WSAASX:WSA 51. Cash as at 31 March 2015 and face value of the convertible bond debt

MARCH 2015 QUARTERLY REPORTYTD
Tonnes Mined Jun Qtr Sep Qtr Dec Qtr Mar Qtr TotalFlying FoxOre Tonnes Mined Tns 67,966 65,097 64,122 72,144 201,363
2013/2014 2014/2015 Some Facts
Unit cash costs YTD tracking b l id t A$2 36/lbGrade Ni % 5.1% 5.2% 4.9% 4.6% 4.9%
Ni Tonnes Mined Tns 3,479 3,384 3,114 3,330 9,828 Spotted Quoll ‐ UndergroundOre Tonnes Mined Tns 58,497 68,446 68,324 70,590 207,360 Grade Ni % 4.8% 4.8% 5.1% 4.8% 4.9%Ni T Mi d T 2 801 3 276 3 483 3 372 10 131
below guidance at A$2.36/lb
Grades and waste dilution management lead to strong reserve reconciliation –Ni Tonnes Mined Tns 2,801 3,276 3,483 3,372 10,131
Total ‐ Ore Tonnes Mined Tns 126,463 133,543 132,446 142,734 408,723 Grade Ni % 5.0% 5.0% 5.0% 4.7% 4.9%Total Ni Tonnes Mined Tns 6,280 6,660 6,597 6,702 19,959
YTD2013/2014 2014/2015
reserve reconciliation particularly at Flying Fox
Remarkable consistency of production and other physicals
Tonnes Milled and Sold Jun Qtr Sep Qtr Dec Qtr Mar Qtr TotalOre Processed Tns 151,232 153,474 152,407 145,933 451,814 Grade % 4.7% 4.7% 4.7% 4.7% 4.7%Ave. Recovery % 89% 90% 90% 90% 90%Ni Tonnes in Concentrate Tns 6,336 6,511 6,434 6,180 19,125
Mill continues to beat nameplate by 10%
March quarter had a plannedNi Tonnes in Concentrate Sold Tns 6,374 6,648 6,246 6,452 19,346
Total Nickel Sold Tns 6,374 6,648 6,246 6,452 19,346
MARFinancial Statistics Jun Qtr Sep Qtr Dec Qtr Mar Qtr YTDGroup Production Cost/lb
2013/2014 2014/2015
March quarter had a planned mill shutdown
Group Production Cost/lbMining Cost (*) A$/lb 1.99 1.82 1.55 1.64 1.67 Haulage A$/lb 0.05 0.06 0.06 0.06 0.06 Milling A$/lb 0.43 0.44 0.43 0.46 0.45 Admin A$/lb 0.16 0.20 0.21 0.18 0.20 By Product Credits A$/lb (0.02) (0.02) (0.02) (0.02) (0.02)
ASX:WSAASX:WSAASX:WSA 6
Cash Cost Ni in Con A$/lb 2.61 2.50 2.23 2.32 2.36
Cash Cost Ni in Con/lb US$/lb 2.43 2.31 1.91 1.82 2.02
Exchange Rate US$ / A$ 0.93 0.93 0.86 0.79 0.86

UPDATED FY15 GUIDANCE
Target Original Guidance Recommended Guidance
Mine Production (Nickel in Ore) 25,000 to 27,000 tonnes Mid‐range of guidance
Nickel in Concentrate Production 24,500 to 25,500 tonnes Upper end of guidance
Unit Cash Cost of Production (Nickel in Concentrate) A$2.70/lb to A$2.80/lb A$2.40/lb to A$2.50/lb
Capital Expenditure &Mine Development A$50m to A$60m No changeCapital Expenditure & Mine Development A$50m to A$60m No change
Exploration A$20m No change
Comments Nickel in concentrate production tracking to upper end of guidance Unit costs guidance improved by A$0.30/lb (approx A$18m):
R d ti i ll j ti t t Reductions in all major operating contracts Productivity improvements Positive reconciliation to reserve, particularly at Flying Fox
Unit costs likely to be at lower end of range
ASX:WSAASX:WSAASX:WSA 7
y g

OPERATIONS
ASX:WSAASX:WSAASX:WSAASX:WSA 8

LOCATION, LOCATION, LOCATION……Some Facts
FIFO & DIDO mine site – no near town infrastructure like Kalgoorlie, Kambalda and Port Hedland
55 minute flight to Forrestania
Once you arrive at site: 5 minutes from camp 5 minutes from mill 20 minutes from mines
Use of local and WA based contractors
500 bed camp with excellent recreation facilities and IT infrastructure
Extremely low headcount turnover due to culture, quality of mines, quality of camp and flat management structure
Half‐way between sale points at
ASX:WSAASX:WSAASX:WSA 9
y pKambalda and the Esperance Port

WESTERN AREAS ARE SAFE AREAS
Continuous Safety Improvement
LTIFR zero (at 3/5/15) 2.0
2.5
FNO 12 Month LTIFR Moving Average
LTIFR zero (at 3/5/15)
Flying Fox > 690 days LTI free
Spotted Quoll > 1,506 days LTI free 1.0
1.5
p y
Exploration > 2,526 days LTI free
Cosmic Boy Concentrator > 707 days LTI free0.0
0.5
Contractors and employees fully integrated into a site wide commitment
Environment & Social
LTIMAVG
Environment & Social
No environmental breaches
Strong local commitments to schools and associations around Forrestania, Perth Zoo (Western Quoll) and Starlight Children’s Foundation WA
ASX:WSAASX:WSAASX:WSA 10
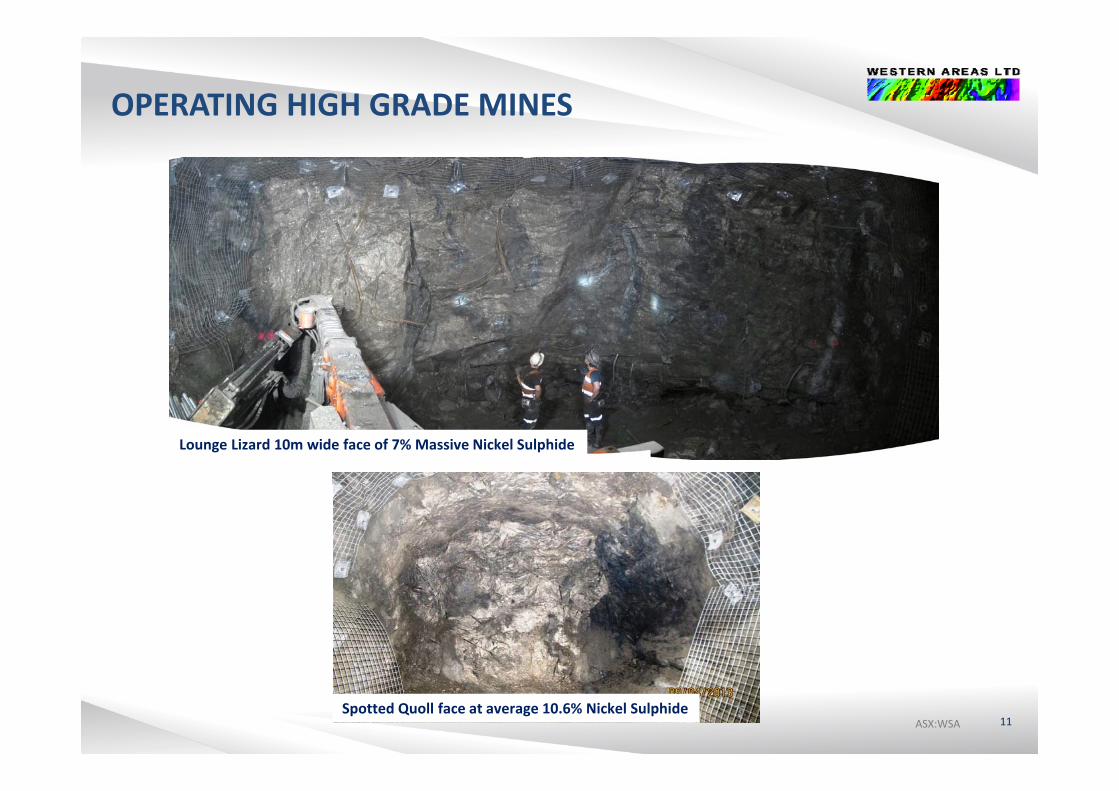
OPERATING HIGH GRADE MINES
Lounge Lizard 10m wide face of 7% Massive Nickel Sulphide
ASX:WSAASX:WSAASX:WSA 11Spotted Quoll face at average 10.6% Nickel Sulphide

FLYING FOX MINE
Mineral Resource and Ore Reserve
Resource Upgrade 31/3/15:Resource Upgrade 31/3/15:
Added 11,394t nickel mainly in T5
High Grade (excluding disseminated sulphide )Mi l R 1 81M @ 5 3%resource) Mineral Resource: 1.81Mt @ 5.3%
Ni containing 96,797 Ni Tonnes
Ore Reserve: 1.44Mt @ 4.0% Ni containing 55,036 Ni Tonnes
Underground drilling program to extend Mineral Resource remains a focus
1HFY15 – 129,219t @ 5.0% Ni for 6,498t Ni
Recent exploration highlights include:
T5 – 3.3m @ 9.5% nickel
T6 – 3.5m @ 5.6% nickel
Old Flying Fox – 3 7m@ 7 3% nickel
ASX:WSAASX:WSAASX:WSA 12
Old Flying Fox – 3.7m @ 7.3% nickel

SPOTTED QUOLL MINE
Mineral Resource and Ore Reserve
Mineral Resource: 2.70Mt @ 5.7% Ni containing 152,686 Ni tonnes
Ore Reserve: 2.80Mt @ 4.0% Ni containingOre Reserve: 2.80Mt @ 4.0% Ni containing113,170 Ni tonnes
Remains open at depth and to the North
Already around a 10 year mine life on Reserve
Production
1HFY15 – 136,770t @ 4.9% Ni for 6,759t Ni
Top‐down mining using paste fill
ASX:WSAASX:WSAASX:WSA 13

FORRESTANIA NICKEL CONCENTRATOR
Concentrator Summary
C t l t it f 550 000t f b t i Current nameplate capacity of 550,000tpa of ore but is achieving throughput 9% above capacity
Nickel concentrate output circa 25,000tpa Ni
Concentrate grades of around 14.0% Ni
Premium blending product (Fe/Mg ratio >15:1) Desirable to smelters Desirable to smelters
14,000t of concentrate storage capacity
Export Infrastructure and Logistics
Access to >1400 sealed shipping containers
l No environmental issues
Using 25 trucks for concentrate transportation
Shipping contract in place FOB Esperance Port
ASX:WSAASX:WSAASX:WSA 14
Shipping contract in place, FOB Esperance Port

MILL RECOVERY ENHANCEMENT PROJECT
Feasibility study complete
Increase average nickel recoveries from 89% up to 93%
Approximately 9 month construction time
Fi l b i l t d Final capex being completed now
Quick payback and planned to be operational in FY16
The treatment of the Flash Cleaner Stream utilises the The treatment of the Flash Cleaner Stream utilises the BioHeap® cultures on a continuous basis produced from a Bacterial farm
Very short residence time of 5 7 days Very short residence time of 5‐7 days
Operation at elevated pH eliminates the need for iron and arsenic precipitation circuits. Hence reduced CAPEX
Sulphide precipitation circuit produces a high grade nickel sulphide product (~50% nickel)
ASX:WSAASX:WSAASX:WSA 15

MILL RECOVERY ENHANCEMENT PROJECT
ASX:WSAASX:WSAASX:WSA 16

INDEPENDENT PRODUCER – OFFTAKE CONTRACTS
Offtake Contracts
O FOB Terms
Very competitive payable percentage of LME
Off k T d A d JINCHUANOfftake Tender Announced
Recently awarded Jinchuan a two year contract (26,000t of contained nickel)
BHP~12ktpaMid 2017
JINCHUAN~13ktpaDec 2016
Tightness in smelter supply being experienced
Global nickel sulphide grades in decline
ASX:WSAASX:WSAASX:WSA 17

EXPLORATION AND GROWTH OUTLOOK
ASX:WSAASX:WSAASX:WSAASX:WSA 18

FORRESTANIA TENEMENTS
Regional Geology
120km strike length (900 sq km) of g ( q )prospective Forrestania Nickel Project, within 400km long nickel province
Total endowment of 29 97Mt at 2 28% Ni Total endowment of 29.97Mt at 2.28% Ni for 684k Ni tonnes
Nickel sulphide deposits and most occurrences in two belts (Eastern and Western)
Western Ultramafic Belt hosts the highWestern Ultramafic Belt hosts the high grade Flying Fox, Spotted Quoll and New Morning deposits
ASX:WSAASX:WSAASX:WSA 19

SHORT TERM – NEAR MINE EXPLORATION
Exploration spend in FY15 likely >$20m
Drilling priority within 8km long zone (below) New discovery would access existing mine Drilling priority within 8km long zone (below). New discovery would access existing mine infrastructure. Systematic approach.
ASX:WSAASX:WSAASX:WSA 20

NEW MORNING
2.5km from Flying Fox and 2.8km from Spotted Quoll
All material approvals in place, potential major capex savings & accessible from either mine
Open Pit and shallow underground studies commenced
Massive sulphide Indicated Resource of Massive sulphide Indicated Resource of 321.8kt @ 3.7% nickel
Significant intersections: 4.4m @ 7.4% nickel including 3.6m @
8.7% nickel 3.0m @ 6.3% nickel including 2.4m @
7.6% nickel 1.5m @ 5.6% nickel including 0.7m @
10.2% nickel
Recent shallow hit of 54m @ 1.7% nickel from 38m (including 2 5m@ 5 0% nickel)
ASX:WSAASX:WSAASX:WSA 21
from 38m (including 2.5m @ 5.0% nickel)

WESTERN GAWLER JOINT VENTURES
Two separate Farm‐In Agreements with Gunson Resources Ltd and Monax Mining Ltd:esou ces td a d o a g td:
A$0.8m on each to earn 75% over 2 years Further A$0.4m on each for 90% over
additional 18 months Close to existing infrastructure Total area 2,746km2
First mover advantages targeting massive high grade poly metallic mineralisationgrade poly‐metallic mineralisation
Potential to host mafic‐ultramafic intrusive related deposits
High resolution airborne geophysics completed (57,477km were flown)
Numerous features likely to represent large y p gmafic‐ultramafic intrusions.
Drilling to commence June quarter 2015
A l fi li d
ASX:WSAASX:WSAASX:WSA 22
Access approvals finalised

FINLAND – FINNAUST MINING PLC PROJECTS
Listing on AIM completed in December 2013 and60% WSA d t li ti60% WSA owned post listing
Current market cap circa A$10m
300km long base metal province in Finlandg p
Numerous nickel/copper/zinc mines & occurrences
Recent drilling at the Hammaslahti Project:
5.6m at 3.2% Cu, 2.7% Zn, 0.7% Pb, 71gpt Ag and 0.76 gpt Au from 196.80m downhole.
Includes 8.65m at 2.2% Cu, 2.0% Zn, 0.5% Pb, 47gpt Ag and 0.50 gpt Au.
Drilling commenced for potential extensions and repetitions to known copper deposits
Geophysics proving very effective in defining targets ‐ZTEM survey completed
ASX:WSAASX:WSAASX:WSA 23

NICKEL MARKET
ASX:WSAASX:WSAASX:WSAASX:WSA 24

NICKEL PRICE DRIVERS
There are a number of factors that influence the nickel price including:
1 L l f l b l i k l l1. Level of global nickel supply
2. Cost and capacity of Chinese nickel pig iron (“NPI”) production
3. Indonesian nickel laterite export ban / Philippine response p / pp p
4. Global stainless steel demand
5. Shorter term political factors
What we believe is occurring:
Chinese Indonesian laterite ore stocks may run out mid‐year with ore stocks on the decline
Monsoon season has reduced Philippine exports
NPI producer stockpiles greater than anticipated and ore blending has extended life
LME t k h ti d t i d t Chi hidd t k i t k t LME stocks have continued to rise due to Chinese hidden stocks coming to market
Stainless steel demand on balance remains strong in China
ASX:WSAASX:WSAASX:WSA 25
The fundamental market conditions and forecasts point to a nickel price rally in Q3, CY15

CHINESE ORE STOCKPILES
24 April 2015:Philippines ‐ 13.2MtIndonesia – 4.3Mt
ASX:WSAASX:WSAASX:WSA 26Source: Royal Nickel

LME STOCKPILESQingdao collaterised loan issues commence – hidden
LME grade nickel heads to LME
425000
450000
21,000
22,000
Asian warehouses
375000
400000
425000
18 000
19,000
20,000
,
cks:
tonn
es
sh p
rice:
$/t
300000
325000
350000
16,000
17,000
18,000
LME
sto
LME
cas
250000
275000
300000
13,000
14,000
15,000
4 4 4 4 4 4 4 4 4 4 4 4 5 5
Jan-
1
Feb-
1
Mar
-1
Apr
-1
May
-1
Jun-
1
Jul-1
Aug
-1
Sep-
1
Oct
-1
Nov
-1
Dec
-1
Jan-
1
Feb-
1
LME price LME stocks
ASX:WSAASX:WSAASX:WSA 27
Source: LME, Macquarie Research, February 2015

STAINLESS DOMINATES NICKEL USE AND GROWTH
Big Q4 ‘14 falls in SS production in Europe Korea Taiwan and Japan
Stainless share in primary nickel use2013 world nickel use by application
Europe, Korea, Taiwan and Japan.
65%
70%
75%
Plating7%
Alloy steel5%
Castings3%
Others5%
use by application
55%
60%
65%
of to
tal p
rimar
y
Non-ferrous10%
7%
40%
45%
50%
%
Stainless70%
40%
1980
1982
1984
1986
1988
1990
1992
1994
1996
1998
2000
2002
2004
2006
2008
2010
2012
2014
F
ASX:WSAASX:WSAASX:WSASource: INSG, Macquarie Research, February 2015

LATERITE ORE EXPORTS TO CHINA
Estimated exports of mid and high grade ore from Philippines and Indonesia to China
80000
90000
100000
el
Estimated exports of mid and high grade ore from Philippines and Indonesia to China
50000
60000
70000
poverable nicke
10000
20000
30000
40000
'000t recp
0
10000
Jan‐13
Feb‐13
Mar‐13
Apr‐13
May‐13
Jun‐13
Jul‐1
3
Aug‐13
Sep‐13
Oct‐13
Nov
‐13
Dec‐13
Jan‐14
Feb‐14
Mar‐14
Apr‐14
May‐14
Jun‐14
Jul‐1
4
Aug‐14
Sep‐14
Oct‐14
Nov
‐14
Dec‐14
High‐grade ‐ Philippines Mid‐grade ‐ Philippines High‐grade ‐ Indonesia
ASX:WSAASX:WSAASX:WSA 29
Source: Macquarie Research, February 2015

NICKEL MARKET DYNAMICS
Indonesia in a unique position in respect of high Ni grade, low Fe product W ld S lit R (Mt Ni t i d)of high Ni grade, low Fe product
Very strong message from the Indonesian government that the ban is
t
World Saprolite Resources (Mt Ni contained)
permanent
Reduction in Chinese NPI and Ferronickel from Japan of approximately 300ktpa contained nickel
Approvals for Indonesian based NPI take a minimum of 18 months plusa minimum of 18 months, plus construction, power supply and skilled labour issues mean that any meaningful production is at least 5 years away
Source: Glencore
production is at least 5 years away
Nickel market deficits set to start in CY15, assuming 4% nickel demand
th d th I d i b h ldi
ASX:WSAASX:WSAASX:WSA 30
growth and the Indonesian ban holding

WESTERN AREAS VALUE EQUATION
• High Grade = Margin
• Returns to shareholders
• Guidance continuallyMargin
• Survival in low prices
shareholders in Dividends
continually met or exceededp
Highest Grade Nickel Globally
Cashflow Positive
Strong Track Record of Delivery
• Looming • New mine • Net Cash and gshortage of nickel post Indo ban
successfully brought on in 24 months
debt free from July 2015Indo ban
Nickel Price Primed for Upside
24 monthsHistory of Discovery and Development
2015Strong Balance Sheet
ASX:WSAASX:WSAASX:WSA 31
Upside Development

THE END
ASX:WSAASX:WSAASX:WSAASX:WSA 32

APPENDIX
ASX:WSAASX:WSAASX:WSAASX:WSA 33

KEY TAKEAWAYS – HALF YEAR LTIFR of 1.00 – one of the lowest in the mining industry
13,257t nickel in ore production averaging 5.0% nickel grade
Nickel in concentrate production of 12,945t
A$2.37/lb (US$2.11/lb) cash cost in concentrate (guidance was A$2.70/lb to A$2.80/lb): R i b t i l i A t li Remains best in class in Australia Significant reduction over the previous half year of A$2.56/lb
Capital, Mine Development and Exploration Expenditure incurred A$34.7m: Well ithin f ll ear g idance range of A$70m to A$80m Well within full year guidance range of A$70m to A$80m
Pre‐Financing Cashflow of A$52.9m 20% increase of A$8.5m versus 2HFY14, despite A$1.08/lb decrease in the nickel price 175% increase of A$33 6m versus 1HFY14 with A$1 14/lb increase in the nickel price 175% increase of A$33.6m versus 1HFY14, with A$1.14/lb increase in the nickel price
Reported NPAT of A$23.6m: Realised nickel price reduction leading to negative QP of A$17.0m before tax (+A$22.2m in 2H15) QP was adjusted for the January’s nickel price movement, therefore go forward benchmark forQP was adjusted for the January s nickel price movement, therefore go forward benchmark for
QP is favorable based on forecasts
Net cash increased A$43.4m to A$53.7m from 6 months ago
Fully franked interim dividend of 3c (threefold increase on 1HFY14)
ASX:WSAASX:WSAASX:WSA 34
Fully franked interim dividend of 3c (threefold increase on 1HFY14)

FINANCIAL SNAPSHOT
1st Half Highlights ($'000)1H FY 2014 (Jul ‐Dec 13)
2H FY 2014 (Jan ‐Jun 14)
1H FY 2015 (Jul ‐Dec 14)
Sales tonnages extremely consistent
Mine Production (tonnes Ni) 15,697 14,872 13,257Mill Production (tonnes Ni) 13,020 12,596 12,945Recovery 89% 89% 90%
Unit costs continue to reduce
Realised nickel price decreased A$1.08/lb from 2HFY14
Recovery 89% 89% 90%Sales Volume (tonnes Ni) 12,963 12,793 12,894Cash Costs (A$/lb) 2.41 2.56 2.37Realised Nickel Price (A$/lb) 6 98 9 20 8 12
EBITDA impacted by lower nickel price and negative QP of A$17.0m
Realised Nickel Price (A$/lb) 6.98 9.20 8.12 Nickel Revenue 143,374 176,704 164,938EBITDA 65,411 92,804 74,862
Pre‐financing cashflow increases with lower operational costs and interest expense and
k l
EBIT 20,723 48,596 42,168NPAT 2,671 22,789 23,553Pre‐Financing Cashflow 19,252 44,402 52,885
working capital timing
Improved cashflow allowed increased interim dividend
Net Cash (135,300) 10,337 53,745Dividend (cents) 1.0 4.0 3.0
ASX:WSAASX:WSAASX:WSA 35

INCOME STATEMENT
Commentary (1H15 v 1H14)
Nickel price up A$1.12/lb in 1H15 on weakerEarnings Data ($'000) 1H FY 2014 2H FY 2014 1H FY 2015AUD and stronger US nickel price
D&A down due to less ore tonnes extracted athigher than reserve grade
Interest expense down due to debt repayment
Realised Nickel Price (A$/lb) 6.98 9.20 8.12Nickel Revenue 143,374 176,704 164,938 EBITDA 65,411 92,804 74,862
p p yon 2 July 2014
Reported NPAT up 782% due to improvednickel price and lower costs, partially offset byincreased taxation
Depreciation & Amortisation (44,688) (41,092) (32,535)Impairment ‐ (3,116) (159)EBIT 20,723 48,596 42,168 Interest Expense (13 431) (13 161) (7 863)
Commentary (1H15 v 2H14)
Ni price down A$1.08/lb which flowed throughwith negative QP of A$17.0m vs positive QP ofA$22.2m in 2H14
Interest Expense (13,431) (13,161) (7,863)Tax (3,025) (9,284) (10,039)Underlying NPAT 4,267 26,151 24,266 FinnAust expenditure (1 596) (3 362) (713) A$22.2m in 2H14
D&A down due to less ore tonnes extracted athigher than reserve grade
Interest expense reduced through debtrepayment of A$95 2m
FinnAust expenditure (1,596) (3,362) (713)NPAT 2,671 22,789 23,553 Dividend (cents) 1.0 4.0 3.0Earnings per share (cents) 1.6 10.6 10.1 repayment of A$95.2m
Carbon credit income down A$5m, howevernew power contract under negotiation
Royalty payments increased ($3.0m) at Flying
g p ( )
ASX:WSAASX:WSAASX:WSA 36
Fox with increased tonnes from Lounge Lizard

INCOME STATEMENT WATERFALLS
5 12.6 1.7 0.6 ‐3.6
‐7.030
40 WSA NPAT ‐ 1H FY 2014 vs 1H FY 2015
$23.6
15.8
5.65.1
10
20
30
$m
$2.7
‐10
0
10
1H FY
2014
Revenu
e (Price)
Finance
costs
Revenu
e (FX) Other
Other
Income
Revenu
e (Vol)
Cost of
Sales Tax
1H FY
2015
R R R
21.93 0 2.4 2.6 ‐0.850 WSA NPAT ‐ 2H FY 2014 vs 1H FY 2015
$22.8 $23.6
5.35.3
4.83.0
20
30
40
$m
20
‐10
0
10
H FY 201
4
nue (Vol)
nce costs
enue
(FX)
airm
ents
Other
Finn
Aust
Tax
ue (P
rice)
H FY 201
5
$
ASX:WSAASX:WSAASX:WSA 37
‐20
2H
Reven
Finan
Reve
Imp
Revenu 1H

CASHFLOW STATEMENT
Commentary (1H15 v 1H14)
Operating cashflow A$38.4m higher dueto the realised nickel price up A$1 07/lb
Cashflow Statement ($'000) 1H FY 2014 2H FY 2014 1H FY 2015to the realised nickel price up A$1.07/lband improvement in working capital
Higher mine development with SpottedQuoll North brought into production
C tibl b d id 2 J l 14 f
Operating Cashflow 49,201 67,829 87,583 Less:Exploration (9,976) (7,059) (8,529)Fi A t I t t (2 370) Convertible bond repaid on 2 July 14 for
A$95.2m which has lead top a reductionin interest costs
Final 4c fully franked dividend paid
FinnAust Investment (2,370) ‐ ‐ Mine Development (15,629) (13,809) (22,431)Capital Expenditure (1,974) (2,559) (3,738)Pre Financing Cashflow 19 252 44 402 52 885 Commentary (1H15 v 2H14)
Operating cashflow higher despite alower nickel price with improvedworking capital movement (lowerdebtors) and lower payments to
Pre‐Financing Cashflow 19,252 44,402 52,885 Investment activities ‐ (406) (50)Proceeds from Share Issues ‐ 106,342 ‐ Proceeds/(Costs) from Financing (71) (2,378) (126) debtors) and lower payments to
suppliers
Higher dividend in 1H15 and debtrepayments were offset by an equityraise in Feb 14
Proceeds/(Costs) from Financing (71) (2,378) (126)Dividends Paid ‐ (2,323) (9,303)Repayment of convertible bond ‐ (15,000) (95,198)Net Cashflow 19,181 130,637 (51,792) raise in Feb 14( )Cash at Bank 99,900 230,537 178,745
ASX:WSAASX:WSAASX:WSA 38
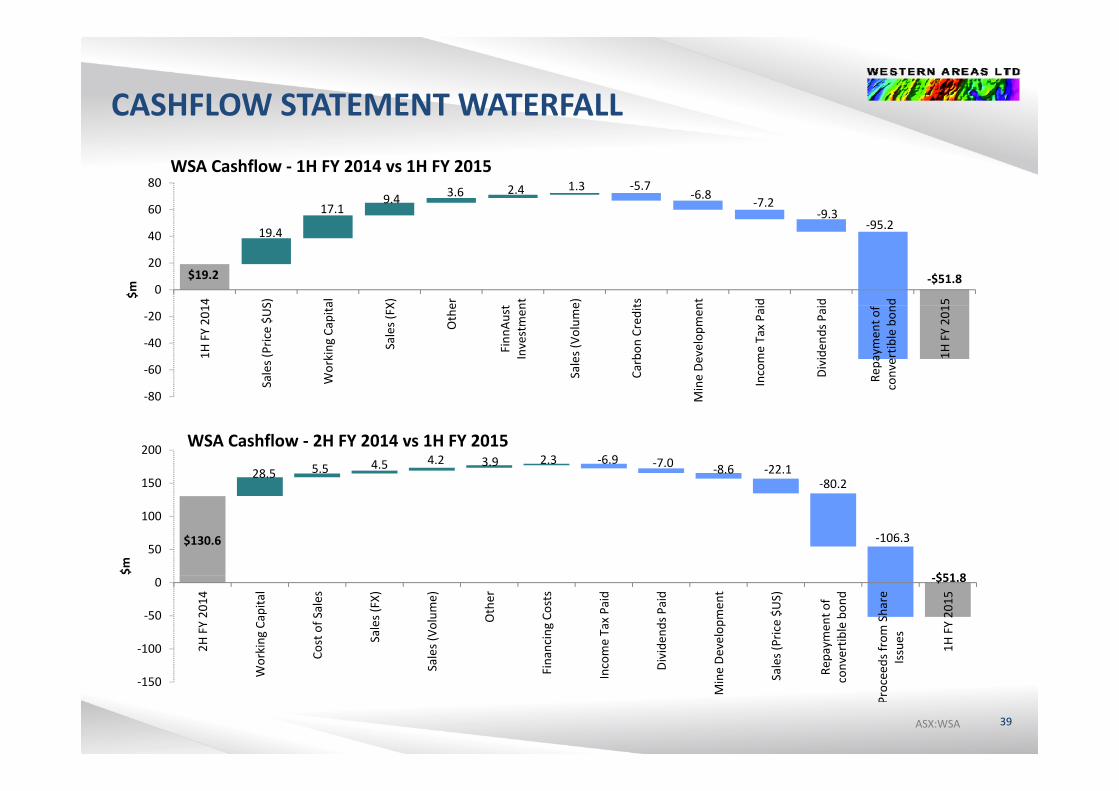
CASHFLOW STATEMENT WATERFALL
17.19.4 3.6 2.4 1.3 ‐5.7
‐6.8 ‐7.2‐9 360
80WSA Cashflow ‐ 1H FY 2014 vs 1H FY 2015
$19.2 ‐$51.8
‐95.219.49.3
0
20
40
14 S) al X) er t nt e) ts nt d d d 15
$m
80
‐60
‐40
‐20
1H FY 20
1
Sales (Price $U
S
Working
Capita
Sales (FX
Othe
Finn
Aust
Investmen
Sales (Vo
lume
Carbon
Credit
Mine De
velopm
en
Income Tax Pai
Divide
nds P
ai
Repaym
ent o
f convertib
le bon
1H FY 20
1
28.5 5.5 4.5 4.2 3.9 2.3 ‐6.9 ‐7.0 ‐8.6 ‐22.1‐80 2150
200 WSA Cashflow ‐ 2H FY 2014 vs 1H FY 2015
‐80 M
$130.6
$51 8
80.2
‐106.350
100
150
$m ‐$51.8
‐100
‐50
0
2H FY 20
14
orking
Capita
l
Cost of Sales
Sales (FX)
ales (V
olum
e)
Other
nancing Co
sts
come Tax Paid
Divide
nds P
aid
Developm
ent
es (P
rice $U
S)
epaymen
t of
nvertib
le bon
d
ds from
Share
Issues
1H FY 20
15
ASX:WSAASX:WSAASX:WSA 39
‐150
W S Fi Inc D
Mine Sal R e con
Proceed

BALANCE SHEET
Commentary
Net Cash of A$53.7m at 1H15versus net debt ofA$135 3 t 1H14 h ll i f th f ll f
Balance Sheet 1H FY 2014 2H FY 2014 1H FY 2015Cash at Bank 99 900 230 537 178 745 A$135.3m at 1H14, when allowing for the full face
value of convertible bonds (CB) (A$125.0m)
Capital Management strategy has worked: A$15.0m and A$95.2m CB repaid in CY14
A$125 0 CB b id 2 J l 15 f h
Cash at Bank 99,900 230,537 178,745Receivables 19,240 31,261 14,813Stockpiles & Inventory 40,376 39,207 29,916PP&E 106,314 102,290 98,298
A$125.0m CB to be repaid on 2 July 15 from cash A$125.0m finance facility from ANZ fully undrawn CB interest and cost savings around A$12m in
FY15 and combined A$24m from July 15
bl l d f
Exploration & Evaluation 43,259 47,008 54,238Mine Development 225,559 206,434 205,202Other 2,211 1,798 1,424TOTAL ASSETS 536 859 658 535 582 636 Receivables at 1H15 lower due to timing of payments
Flexible balance sheet able to fund growth
TOTAL ASSETS 536,859 658,535 582,636Trade & Other Payables 33,526 31,318 28,794Short Term Borrowings 112,380 107,886 134,003Long Term Borrowings 138,267 141,575 26,093g g , , ,TOTAL LIABILITES 284,173 280,779 188,890SHAREHOLDERS EQUITY 252,686 377,756 393,746
ASX:WSAASX:WSAASX:WSA 40