Corporate Presentation July 2013. Light Holdings 2.
39
Corporate Presentation July 2013
-
Upload
candace-cox -
Category
Documents
-
view
215 -
download
1
Transcript of Corporate Presentation July 2013. Light Holdings 2.

Corporate Presentation
July 2013

Light Holdings
Light S.A. (Holding)
100% 51% 20%100% 100% 100%100% 100%51% 25.5%100%
Light Serviços de Eletricidade
S.A.
LightgerS.A.
ItaocaraEnergia
Ltda.
Amazônia Energia S.A.
Light EscoPrestação de Serviços S.A.
LightcomComercializadora
de Energia S.A.
Light Soluções em Eletricidade
Ltda.
Instituto Light
AxxiomSoluções
Tecnológicas S.A.
CR ZongshenE-Power
Fabricadora de Veículos S.A.
GuanhãesEnergia
S.A.
21.99%
Renova Energia
S.A.
Central Eólica Fontainha
Ltda.
100%
Central Eólica São Judas
Tadeu Ltda.
100% 9.77%
Norte Energia
S.A.
33%EBL Cia de Eficiência Energética
S.A.
Light Energia S.A.
Distribution Generation Commercialization and Services Institutional Systems ElectricVehicles
51%
2
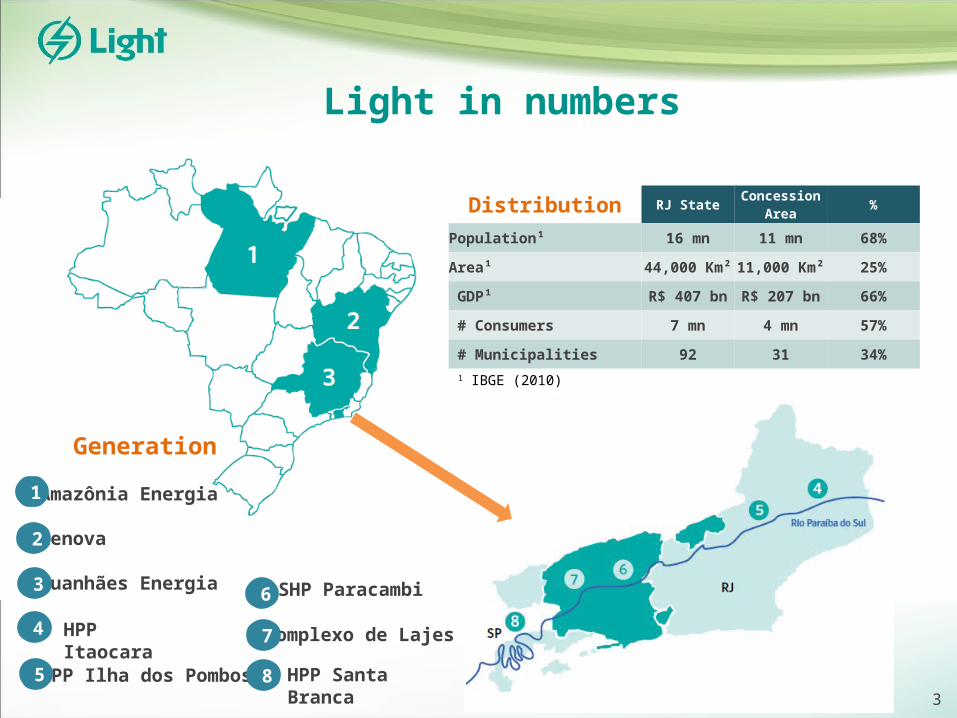
Light in numbers
Amazônia Energia
Renova
Guanhães Energia
Generation
HPP Itaocara Complexo de Lajes
Distribution RJ StateConcession
Area%
Population¹ 16 mn 11 mn 68%
Area¹ 44,000 Km² 11,000 Km² 25%
GDP¹ R$ 407 bn R$ 207 bn 66%
# Consumers 7 mn 4 mn 57%
# Municipalities 92 31 34%
6
HPP Ilha dos Pombos
SHP Paracambi
HPP Santa Branca
1
2
3
1 IBGE (2010)
4
5
7
83

Tractebel AES Tiete Duke CPFL EDP Light
Cemig CPFL Neoenergia Copel Light EDP Eletropaulo Cemig Copel CPFL Paulista
Light Celesc
RankingsAmong the largest players in Brazil
INTEGRATED²Net Revenues 2012 – R$ Billion
GENERATION PRIVATE-OWNED COMPANIES²Installed Hydro-generation Capacity (MW) – 2012
37,626
24,71422,737
21,467 20,05415,018
18.5
15.0
11.8
8.56.9
6.6
5,560
2,658 2,241 2,2192,012
877
DISTRIBUTION¹Energy Consumption in Concession Area (GWh) - 2012
1 – Source: Captive market 2 – Source: Companies reports* Considers the 9 MW of Renova’s SHPs
*4

Shareholders Structure
11 Board members: 8 from the controlling
group, 2 independents e 1 employees
nominated
A qualifying quorum of 7 members to
approve relevant proposals such as: M&A
and dividend policy
5
CEMIG RME LEPSA BNDESPAR MARKET
PARATI
CEMIGFIP REDENTOR
REDENTORENERGIA
26.06% 13.03% 13.03% 13.46% 34.41%
75% 25%
13.03%100%
96.81% 100%
6.41%19.23%
BTGPACTUAL
SANTANDER
VOTORANTIM
BANCO DO BRASIL
28.57%
5.50%
28.57%
5.50%
28.57%5.50%
14.29%
2.74%
MINORITY
3.19% 0.42%
Free Float 47,9%
25.64%*
FOREIGN NATIONAL
55.93% 44.07%
Stake in blue: indirect interest in LightLight S.A.
(Holding)
Controller Group 52,1%
*12.61% (RME) + 13.03%(LEPSA)

Corporate Governance
General AssemblyGeneral Assembly
Fiscal CouncilFiscal Council
Board of DirectorsBoard of Directors
AuditorsCommitteeAuditors
Committee
Governance and Sustainability
Committee
Governance and Sustainability
Committee
Human Resources Committee
Human Resources Committee
Finances CommitteeFinances
CommitteeManagement Committee
Management Committee
Chief Executive Officer
Chief Executive Officer
Chief HR OfficerChief HR Officer
Chief Business Officer
Chief Business Officer
Corporate Management
Officer
Corporate Management
OfficerChief Legal OfficerChief Legal Officer
Chief Financial and Investor
Relations Officer
Chief Financial and Investor
Relations Officer
Chief Distribution Officer
Chief Distribution Officer
Chief Energy Officer
Chief Energy Officer
João B. Zolini Carneiro
Ricardo Cesar C. Rocha
Evandro L. Vasconcelos
Andreia Ribeiro Junqueira
Fernando Antônio F.Reis
Paulo Carvalho Filho
Evandro L. Vasconcelos*
Paulo Roberto R. Pinto
Chief Communications
Officer
Chief Communications
Officer
Luiz Otavio Ziza Valadares
LGSXYADR-OTC
Interim*
6

Residencial35%
Comercial28%
Livre19%
Outros Cativos13%Industrial5%
1T10 1T11 1T12 1T13
+3.7%
6,1806,291
26.9ºC
27.0ºC
1Q121Q11
6,0876,407
1Q10
27.8ºC28.3º
C
+1.8%
1Q13
1Note: To preserve comparability in the market approved by Aneel in the tariff adjustment process, the billed energy of the free customers Valesul, CSN and CSA were excluded in view of these customers’ planned migration to the Basic Network.
TOTAL MARKET (GWh) ¹
Energy Consumption Distribution – Quarter
With the consumption no longer billed by the change in criteria, the total energy consumption increase in the concession area would be 5.3% over 1Q12.
7
1T10 1T11 1T12 1T13
Industrial5%
Free19%
Others13%
Commercial28%
Residential35%

Total Market
FREECAPTIVE
ELECTRICITY CONSUMPTION (GWh)
TOTAL MARKET – QUARTER
8
RESIDENTIAL INDUSTRIALCOMMERCIAL OTHERS TOTAL
1Q12 1Q13 1Q12 1Q13 1Q12 1Q13 1Q12 1Q13 1Q12 1Q131T12 1T13 1T12 1T13 1T12 1T13 1T12 1T13
+3.7%
1T12 1T13
5,3795,572
6,180
801835
6,407
+3.7%
882 913
932
49 53
966
+7.8%
1.7481.877
1,939
191214
2,091
401 359
962
561 568
927
+3.2%
2,348 2,423
-3.7%
1,748 1,877

Prospects for State of RioInvestments of R$ 211.5 billion in the State of Rio de Janeiro¹
OilR$ 107.7 bn
50.9%
TourismR$ 1.8 bn
0.9%
OthersR$ 1.9 bn
0.9%
Olimpic FacilitiesR$ 8.6 bn
4.1%
InfrastructureR$ 51.0 bn
24.1%
Transformation IndustryR$ 40.5 bn19.1%
Period 2012-2014
¹Source: Firjan (Industry Federation of Rio de Janeiro)
Events Schedule
Confederations Cup
World Youth Day
World Cup
Olympics
Paralympics
Jun, 15 to 30/2013
Jul, 23 to 28/2013
Jun, 12 to Jul, 13/2014
Aug, 5 to 21/2016
Sep, 7 to 18/2016
9
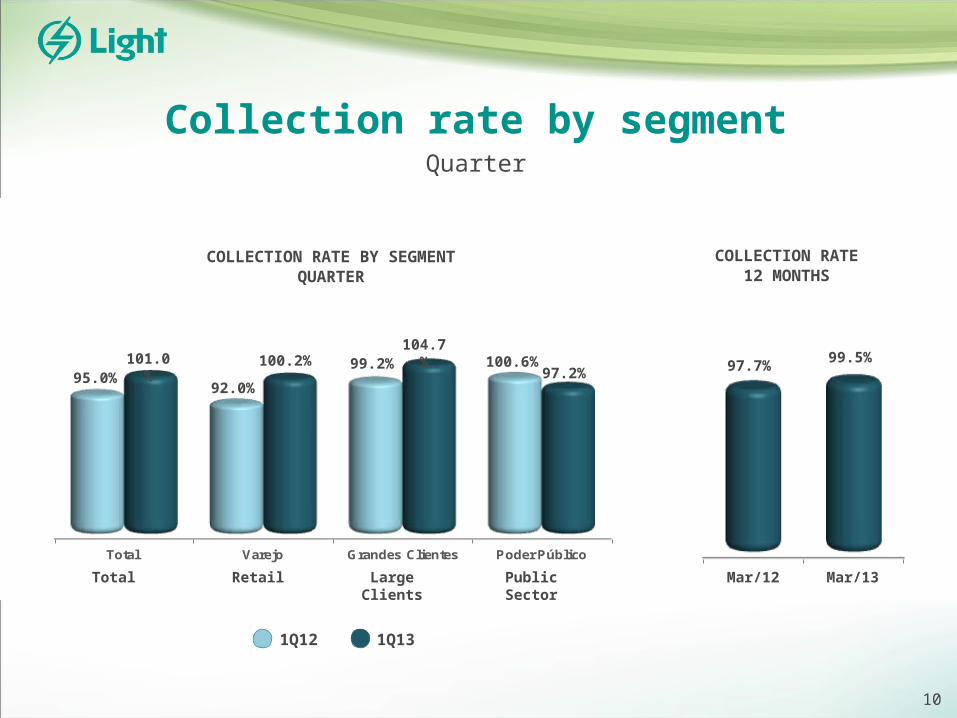
Collection rate by segmentQuarter
10
mar-12 mar-13
Total Varejo Grandes Clientes Poder Público
1T12 1T13
97.2%
COLLECTION RATE12 MONTHS
COLLECTION RATE BY SEGMENTQUARTER
95.0%101.0
%100.2%
92.0%
99.2%104.7
% 100.6%
1Q12
1Q13
97.7% 99.5%
Mar/12 Mar/13Total Retail Large Clients
Public Sector

Losses12 months
32.9%
Technical losses GWh
% Non-technical losses/ LV Market
% Non-technical losses / LV Market - Regulatory
Non-technical losses GWh
Reflects exclusion of long term delinquent customers from the billing system, according to Resolution 414 by Aneel.
Sep/11 Dec/11 Jun/12Mar/12 Sep/12Sep/10 Dec/10 Jun/11Mar/11 Mar/13Dec/12
42.2%40.7
%
41.2%40.4
%
43.1%
45.4%
44.9%
42.1%
41.8%
41.6%
41.3%
5,316
2,328 2,349
5,229
7,5827,627 7,665
2,335
5,247 5,615
2,432
8,047
5,457
2,381
7,838
5,330
2,5772,214
6,007
2,618
6,0295,312
2,231
5,278
2,215
5,326
2,293
8,6478,5847,544 7,5437,493 7,619
37% Risky Area
63% Non-Risky Area
11

PARAÍBAVALLEY
LITORÂNEA
WEST EAST
As March / 2013
BAIXADA
Non Technical LossesConcession Area Losses Map
Grupo Light Valley Litorânea East West Baixada
# Clients 4,029,805 418,489 814,157 857,437 934,709 1,005,013
Low Voltage Market (GWh) 13,411 1,129 4,934 2,558 2,507 2,283
Non Technical Losses (GWh) 6,029 43 267 1,787 1,924 2,008
Non Technical Losses/LV Mkt (%) 44.95% 3.78% 5.40% 69.87% 76.74% 87.98% 12
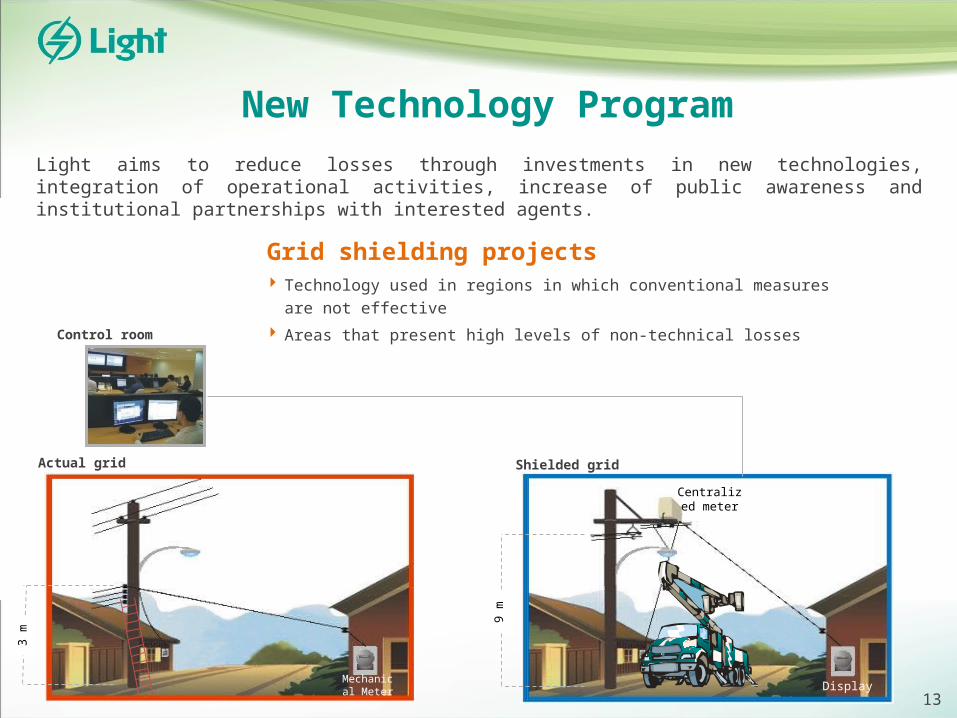
New Technology Program
Technology used in regions in which conventional measures are not effective
Areas that present high levels of non-technical losses
Light aims to reduce losses through investments in new technologies, integration of operational activities, increase of public awareness and institutional partnerships with interested agents.
Grid shielding projects
Actual grid Shielded grid
Control room
3 m
9 m
Mechanical Meter Display
Centralized meter
13

New Technology Program
Monitoring, reading, cutting and reconnection of customers telemetry– MCC (Measuring Center Centralized)
Prioritization in areas of high losses and aggressiveness to the network
Technology hindering inappropriate interference in networks
Meters Installed (Thousands)
OUT OF FAVELASFAVELAS
14
2009 2010 2011 2012 2013
294
79
373
30
69
May/132011 2012
227
341
197272
20102009
7
122
1152
80
78

Pacified Favelas (UPPs)
33 UPPs established
130,000 households
40 UPPs until 2014
Present in 15 UPPs, 9 already concluded
60,000 consumers
200,000 people achieved
30 UPPs until 2014
State Government Light
Safety, citizenship, and social inclusionPARTNERSHIP
15

Focused in areas with 10,000 to 20,000 clients with high level of losses and
delinquency;
Fully-dedicated teams of technicians and commercial agents;
Small areas to cover, enabling higher productivity;
Constant and accurate results monitoring by Light;
Result-linked remuneration for services provided;
Fixed remuneration above market and aggressive
variable remuneration;
Police Force support, when necessary.
Zero Losses AreaProject: “Light Legal” (APZ – Zero Losses Area)
16

Losses Control InitiativesResults until March/13
Favelas
Zero Losses Area (APZ)
Before Current Before CurrentSanta Marta 2009 95.00% 8.22% 0.20% 99.13%
Cidade de Deus 1 2010 52.10% 14.45% 23.10% 78.30%Chapéu Mangueira 16.20% 101.46%
Babilônia 5.40% 99.51%Cabritos 1.40% 96.25%
Tabajaras 9.50% 96.99%Formiga 2011 73.30% 9.37% 31.40% 84.62%
Batan 2012 61.80% 10.66% 1.20% 93.88%Borel 2013 60.50% 31.06% 9.40% 79.10%
2011 62.30% 12.47%
Areas Conclusion Year
Losses Collection
2010 62.70% 14.75%
NeighborhoodClient
NumbersNon-Technical Losses / Low Voltage Market *
Collection Rate
Curicica 13,034 12.1% 99.7%Realengo 10,141 16.9% 99.5%Cosmos 34,933 22.8% 107.7%Sepetiba 18,793 33.5% 96.5%Caxias 1 e 2 13,907 19.5% 93.3%Belford Roxo 1 e 2 19,582 32.4% 94.2%Vigário Geral 16,122 16.1% 98.3%Caxias 3 17,239 25.2% 98.7%Nova Iguaçu 1 31,899 31.9% 98.6%Nova Iguaçu 2 20,213 25.0% 95.2%Nilópolis 9,861 28.8% 89.8%Ricardo de Albuquerque 24,433 19.5% 96.4%Mesquita 8,419 38.4% 96.7%Cabritos/Tabajaras/Chapéu Mangueira/Babilônia
5,208 11.9% 97.7%
Total 243,784 24.3% 98.4%* Reflects the results accumulated until mar/13 since the begining of the implementation of each APZ.
17
Average losses reduction: 23.0 p.p.Average Collection increase: 14,5 p.p.
Average losses reduction : 49.5 p.p.Average Collection increase : 80.4 p.p.

Losses Reduction - Business CaseAn example
300 kWh
100 kWh
REAL CONSUMPTION
BILLED CONSUMPTION
NEW METER INSTALLATIO
N
200 kWhLOST ENERGY
ENERGY SAVED
100 kWh
BILLED CONSUMPTION INCREASE
100 kWh
OTHER EFFECTS (BY-PRODUCTS):
CAPEX GOES TO THE RAB
BAD DEBT PROVISION REDUCTION
OPERATIONAL COSTS
REDUCTION
18

GENERATION BUSINESS

Installed Capacity868 MW
HPP Santa Branca
56 MW
HPP Ilha dos Pombos 187 MW
HPP Fontes Nova
132 MWHPP Underground
Nilo Peçanha - 380 MWHPP Pereira Passos
100 MW
SP
RJ
HPP Santa Branca
Paraiba do Sul River
HPP Ilha dos Pombos100%
100%
100%100%100%
Lajes Complex
51%
SHP Paracambi
13 MW
20
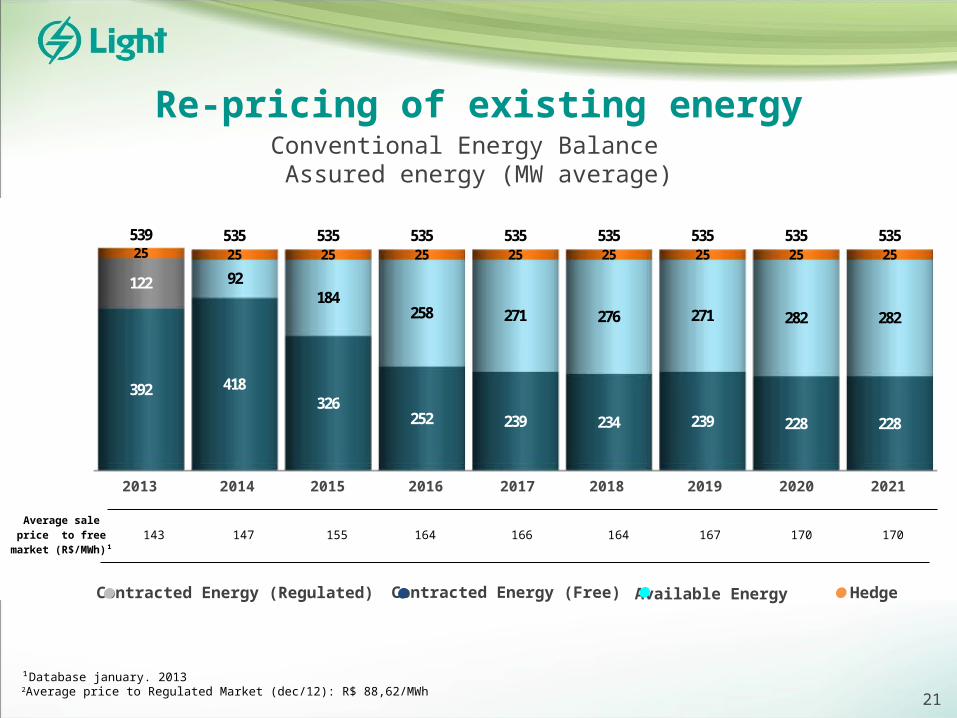
Re-pricing of existing energy
Contracted Energy (Regulated) Contracted Energy (Free) HedgeAvailable Energy
Average sale price to free market
(R$/MWh)¹143 147 155 164 166 164 167 170 170
Conventional Energy Balance Assured energy (MW average)
¹Database january. 20132Average price to Regulated Market (dec/12): R$ 88,62/MWh
21
2013 2014 2015 2016 2017 2018 2019 2020 2021
392 418326
252 239 234 239 228 228
122 92184
258 271 276 271 282 282
25 25 25 25 25 25 25 25 25539 535 535 535 535 535 535 535 535
Balanço de Energia Convencional do Grupo LightEnergia Assegurada (MW médios)
Vendas no ACL 2004-EE-2006-08 Recursos disponíveis para comercialização Hedge Total
2013 2014 2015 2016 2017 2018 2019 2020 2021

Generation Projects
ProjectInstalled Capacity
(MW)Assured Energy(MWaverage)
Operational Start
Stake
Renova335 (in operation)
797.2 (contracted)
173.1 (in operation)
395 (contracted)
2008/2012
2013-201721.99%
Belo Monte 11,223 4,571 2015 2.49%
Itaocara 151 83 2015 51%
Guanhães 44 25.03 2014 51%
Lajes 17 16 2015 51%
22

Capacidade Light
Energia
(+) PCH Paracambi
(+) Renova Capacidade Atual
(+) Lajes (+) Itaocara (+) Renova (+) Belo Monte
(+) Guanhães
Capacidade após
expansão
Expansão da Geração (MW)
Generation Projects
Installed Capacity (MW)
Installed Capacity
Capacity After Expansion
Investments in Renova, Belo Monte and Guanhães in line with our strategy of growing in the generation business
¹ Considering 51% stake
² Considering 21.99% stake
³ Considering 2.49% stake
+ 59.8%
(+) Belo Monte³
(+) SHPParacambi¹
(+) SHPLajes¹
(+) HPPItaocara¹ (+) Guanhães¹ (+) Renova²
1,505
1374* 9 77
175
280
855
(+) Renova²Current
Capacity
* 9 MW SHP + 65 MW Wind Farm (since jul/12)
942
22
23

RESULTS

Net Revenue
Industrial 5.5%
NET REVENUE (R$MN)
Generation 7.1% Distribution
84.0%**
NET REVENUE BY SEGMENT (1Q13)*
Commercialization 8.6%
* Eliminations not considered
** Construction revenue not considered
NET REVENUE FROM DISTRIBUTION (1Q13)
Commercial 29.7%
Others (Captive) 11.7%
Network Use (TUSD)(Free +
Concessionaires)
8.0% Residential 45.1%
Construction RevenueRevenue w/out construction revenue
1T12 1T13
+7.5
1,898.7
2,040.0
1Q131Q12
157,3
1,761.3
1,883.1
137,4
+6,9%
25

Operating Costs and Expenses
Manageable (distribution): R$ 317.1(17.8%)
Generation and Commercialization: R$
203.5(11.4%)
Non manageable (distribution): R$ 1,261.2(70.8%)
* Eliminations not considered
** Construction revenue not considered
DISTRIBUTION MANAGEABLE COSTS (R$MN)COSTS (R$MN)*1Q13
1T12 1T13
333.1 317.1
-4.8%
1Q131Q12
R$ MN 1Q12 1Q13 Var.
PMSO 167.6 184.0 9.7%
Provisions 86.5 45.2 -47.7%
PCLD 61.6 29.0 210.2%
Contingencies 24.9 16.2 554.9%
Depreciation 75.7 80.6 6.5%
Other operational/revenues expenses
3.2 7.3 127.3%
Total 333.1 317.1 -4.8%
Não gerenciáveis;
70,8%
Gerenciáveis; 17,8%
Geração e Comercialização
; 11,4%
26

EBITDA
27
CONSOLIDATED EBITDA (R$MN) EBITDA BY SEGMENT*1Q13
Generation 33.4% (EBITDA Margin: 82.1%)
Commercialization 2.8%
(EBITDA Margin: 5.6%)
Distribution 63.8%(EBITDA Margin: 13.5%)
*Eliminations not considered
1T12 1T13
355.1433.4
-18.1%
1Q12 1Q13
Distribuição ;
63,8%; 63,84%
Geração; 33,4%;
33,40%
Comercialização;
2,8%; 2,77%

EBITDA
28
EBITDA Ajustado -
2T11
Ativos e Passivos
Regulatórios
EBITDA -2T11
Receita Líquida
Custos Não Gerenciáveis
Custos Gerenciáveis
(PMSO)
Provisões EBITDA -2T12
Ativos e Passivos
Regulatórios
EBITDA Ajustado -
2T12EBITDA1Q12
EBITDA1Q13
Net Revenu
e
Non-Manageabl
e Costs
Manageable Costs (PMSO)
Provisions
Regulatory Assets and Liabilities
Regulatory Assets and Liabilities
Adjusted EBITDA
1Q12
Adjusted EBITDA
1Q13
EBITDA – 1Q12 / 1Q13(R$ MN)
Other operational/
revenues
(2)
433
122
(175) (19) (7) (1)
101 456
+ 5.8%
- 18.1%
42355
431
Equity Pick-up

Net Income
EBITDA Ajustado -
2T11
Ativos e Passivos
Regulatórios
EBITDA -2T11
Receita Líquida
Custos Não Gerenciáveis
Custos Gerenciáveis
(PMSO)
Provisões EBITDA -2T12
Ativos e Passivos
Regulatórios
EBITDA Ajustado -
2T121Q12 1Q13EBITD
AFinancial
ResultTaxes Others
ADJUESTED NET INCOME 1Q12 / 1Q13 (R$ MN)
Regulatory Assets and Liabilities
Regulatory Assets and Liabilities
Adjusted Net Income
1Q12
Adjusted Net Income
1Q13
LL Ajustado 4T11
Ativos e passivos
Regulatórios
1T12 EBITDA Resultado Financeiro
Impostos Outros 1T13 Ativos e passivos
Regulatórios
LL Ajustado 4T12
Lucro Líquido e Lucro Líquido Ajustado 1T12/1T13 - R$ Milhões
139
(1)
140
(78)(9)
30
(4)
79
67 145
- 43.8%
+ 4.8%
29

Dividends
2007 2008 2009 2010 2011 2012
100% 100%
76.3% 81.0%
100.0%
86.5%
50%
Minimum Dividend PolicyPayout
1S08 2S08 1S09 2S09 1S10 2S10 1S11 2S11 1S12 2S12 1S13
203
351408
187
432363 351
118182 170
92
8787
4.2%
8.2%9.9%
1.7%
8.1% 8.1%6.1%
3.4% 3.3%5.4%
2.4%
Dividend Yeld*Dividends
*Based on the closing price the day before the announcement.
Interest on Equity
257
182205
351363
432
187
408351
203
92
*Based on Net Income of the year. before IFRS adjustments
*
30

Indebtedness
*ConsideringHedge
US$/Euro 0.4%
CDI/Selic 73.3%
TJLP 24.3%
Others
2.0%
31
2013 2014 2015 2016 2017 2018 2019 2020 2021 2022 After
2022
Average Term: 4.7 years
AMORTIZATION SCHEDULE* (R$ MN)
Nominal Cost Real Cost
NET DEBTWithout Pension Fund
* Principal only
COST OF DEBT
2012201120102007 2008 2009 set/10
Custo Real Custo Nominal
Mar/13
Net Debt / EBITDA for covenants
2009 2010 2011 2012
Custo Nominal Custo Real
2009 2010 2011 2012
Custo Nominal Custo Real
2009 2010 2011 2012
Custo Nominal Custo Real
3T09 3T10 9M09 9M10Mar/13Dec/12
Custo Nominal Custo Real
2.24%
8.21%
4.87%
11.08%
4.25%
11.03%
7.73%
1.07%
357
792 759982
616394
17642 42 42
194
2009 2010
Custo Real
Custo Real
3,991.9 1
4,031.4
2.83 2.73
1 Reclassified to reflect the deconsolidation results of jointly controlled companies.

Investments
CAPEX (R$ MN)CAPEX BREAKDOWN
(R$ MN)1Q13
Generation Projects
26.9 Quality Improveme
nt13.4
Generation Maintenanc
e3.1 Others
17.2
Develop. of Distribution System
51.6
Losses Combat
44.7
Investments in Electric Assets (Distribution)
Commerc./Energy
Eficiency26.1
2008 2009 2010 2011 2012 2008 2009 2010 2011 9M11 9M1220102009
563.8
928.6
700.6
2011 2012
796.8
694.1
102.7
446.9
116.9
518.8
181.8774.8
153.8
2008 2009 2010 2011 9M11 9M121Q131Q12
131.2 127.0
11.7 35.8142.9 162.7
+13.9%
32

Why invest in Light?
Major upcoming events Integration of favelas Pro-business environment New plants investments Expansion of the existing ones Market growth
Economic Transformation in the Concession
Area
Progress in the Technology Program
New network and meters in the pacified favelas
Smart metering development“Zero Losses Area” Program
Energy Losses Reduction
Investment in Renova, Belo Monte and Guanhães (total of 477 MW)
SHP Lajes under construction.HPP Itaocara
Growth in the Generation Business
New PPAs starting in 2013 and 2014
Revenues increase with no aditional costs.
Very active trading subsidiary
Repricing of Existing Energy
Listed in “Novo Mercado” of Bovespa;
Board Committees very active Included in the Sustainability
Index (ISE) of Bovespa for the sixth year.
Best-in-Class Corporate
Governance
Sound Dividend Policy: minimum 50% of net income;
Average payout since 2007: 91%
Dividend track Record
33

Regulatory Framework
The Provisional Measure 579 was enacted on September 11, 2012 and thereafter converted into Law
12,783 providing for electric power concessions, reduction of sector charges and reasonable tariffs which
although these have not directly affected Light, as its concessions will expire only in 2026, resulted in the
following developments:
on January 24, 2013, Resolution issued by Aneel approved an average reduction of 19.63% in Light
SESA’s tariffs. For residential consumers (low voltage), the reduction was 18.10%. The measure will
have no impact on the company’s result or cash flow since it reflects an equal reduction in costs.
on the same date, the distribution of power plants energy quotas was ratified, which had their
concession renewed:
(i) but lower to the distribution companies’ contracting needs, thus, causing an involuntary
exposure, and only for Light it accounted for average 156 MW; and
(ii) made distribution companies to start sharing the hydrological risks, which before was only
supported by generation companies
As of October 2012, an adverse hydrological situation was characterized in Brazil’s electricity sector, the
basis of which is mainly hydric, enforcing the System National Operator to dispatch all the thermal power
plants available in the system, thus significantly rising the costs of distribution companies by increasing
fuel expenditures in availability agreements, increasing System Service Charges due to energy security and
acquisitions on the spot market in order to answer that involuntary exposure.
34

On March 8, 2013, the federal government issued the Decree 7,945 preventing the coverage of part of the non-
manageable costs not covered by the 2013 tariff, through the resources transferred from the Energetic Development
Accout (CDE) for the following costs:
System Service Charge (ESS) – The monthly transfer will be determined by the amounts settled in the
CCEE.
Involuntary Exposure associated with the quotas – The monthly CDE transfer will cover the difference
between the difference settlement price (PLD) and the tariff of the repositioning amount recognized in Light’s
last tariff adjustment.
Hydrological Risk - The net monthly amount settled in the CCEE will be transferred directly via the CDE.
It is worth mentioning that the amounts approved for Light reflect the methodology approved by Aneel on May 6th, 2013.
Regulatory Framework
1T13 sem decreto
CDE 1T13 1T12CDEtransfer
1Q13without Decree
1Q13 1Q12
362.2
144.9
267.1
371.0
225.7
291.970.4
144.9
267.1
371.0
225.7
27.2122.8235.4
362.1
70.7
1,370.9
1,079.9
818.2
ENERGY PURCHASE (R$ MN)
Availability Contracts
Other Auctions
Norte Fluminense
ItaipuSpot
1T13 sem decreto
CDE 1T13 1T12CDEtransfer
1Q13Without Decree
1Q13 1Q12
ESS Transport Other Charges
215.3
52.8
46.1
79.0
52.8
46.1
23.5
130.9
49.5
136.3
314.2
177.9203.9
CHARGES AND TRANSPORT (R$ MN)
+ 31.9%
-12.8%
35

R$ 2.7 billion (nominal terms) invested during the current cycle (2008-2013)
Capitalization improvement driven by simulations
Physical-accounting assets concilliation
Constant interactions with Aneel staff, including site visits
Intensive training of teams for correct accounting records
Accounting system blocked against input errors
Aiming the flexibility of the regulatory target, based on Aneel’s excepcionality criteria:
large gap between actual and regulatory level of losses;
social and economic conditions hindered the achievement of the target; and
there are no comparable peer companies with lower level of losses.
Non-Technical LossesRemuneration Asset Base
36
2013 Tariff Review Critical Issues

2013 Tariff Review Schedule
Date Event
July 16 Aneel forwards first proposal (without remuneration and depreciation) to the concessionary and to the consumers representatives
August 01 Internet presentation of the Tariff Review Proposal prepared by Aneel
From Aug/5 to Aug/16 Regulatory Asset Base fiscalization
September 05 Public Hearing
October 03 Aneel forwards new proposal consolidated to the concessionary and to the consumers representatives
October 24 Aneel Board Meeting
November 07 Periodic Tariff Review Date
37

Important Notice
This presentation may include declarations that represent forward-looking statements according to Brazilian regulations and international movable values. These declarations are based on certain assumptions and analyses made by the Company in accordance with its experience, the economic environment, market conditions and future events expected, many of which are out of the Company’s control. Important factors that can lead to significant differences between the real results and the future declarations of expectations on events or business-oriented results include the Company’s strategy, the Brazilian and international economic conditions, technology, financial strategy, developments of the public service industry, hydrological conditions, conditions of the financial market, uncertainty regarding the results of its future operations, plain, goals, expectations and intentions, among others. Because of these factors, the Company’s actual results may significantly differ from those indicated or implicit in the declarations of expectations on events or future results.
The information and opinions herein do not have to be understood as recommendation to potential investors, and no investment decision must be based on the veracity, the updated or completeness of this information or opinions. None of the Company’s assessors or parts related to them or its representatives will have any responsibility for any losses that can elapse from the use or the contents of this presentation.
This material includes declarations on future events submitted to risks and uncertainties, which are based on current expectations and projections on future events and trends that can affect the Company’s businesses. These declarations include projections of economic growth and demand and supply of energy, in addition to information on competitive position, regulatory environment, potential growth opportunities and other subjects. Various factors can adversely affect the estimates and assumptions on which these declarations are based on.
38
Contacts
João Batista Zolini CarneiroCFO and IRO
Luiz Felipe Negreiros de SáSuperintendent of Finance and Investor Relations
+55 21 2211 2814 [email protected]
Gustavo WerneckIR Manager
+ 55 21 2211 [email protected]
www.light.com.br/ri
39