
Corporate Presentation 3Q 2014 - Bci Personas€¦ · CorporateCorporate Presentation Presentation...
25
Corporate Presentation 2013 Corporate Presentation 2014 Clic para editar título Corporate Presentation 2014 Banco Crédito e Inversiones Corporate Presentation 3Q 2014 December 2014
Transcript of Corporate Presentation 3Q 2014 - Bci Personas€¦ · CorporateCorporate Presentation Presentation...
Corporate Presentation 2013 Corporate Presentation 2014
Clic para editar título
Corporate Presentation 2014
Banco Crédito e Inversiones
Corporate Presentation 3Q 2014
December 2014
Corporate Presentation 2013 Corporate Presentation 2014
Content: 1. Main macroeconomic indicators
2. Chilean Financial System
3. Bci Financial Results
2
Corporate Presentation 2013 Corporate Presentation 2014
Chilean main
macroeconomic indicators
Corporate Presentation 2013 Corporate Presentation 2014
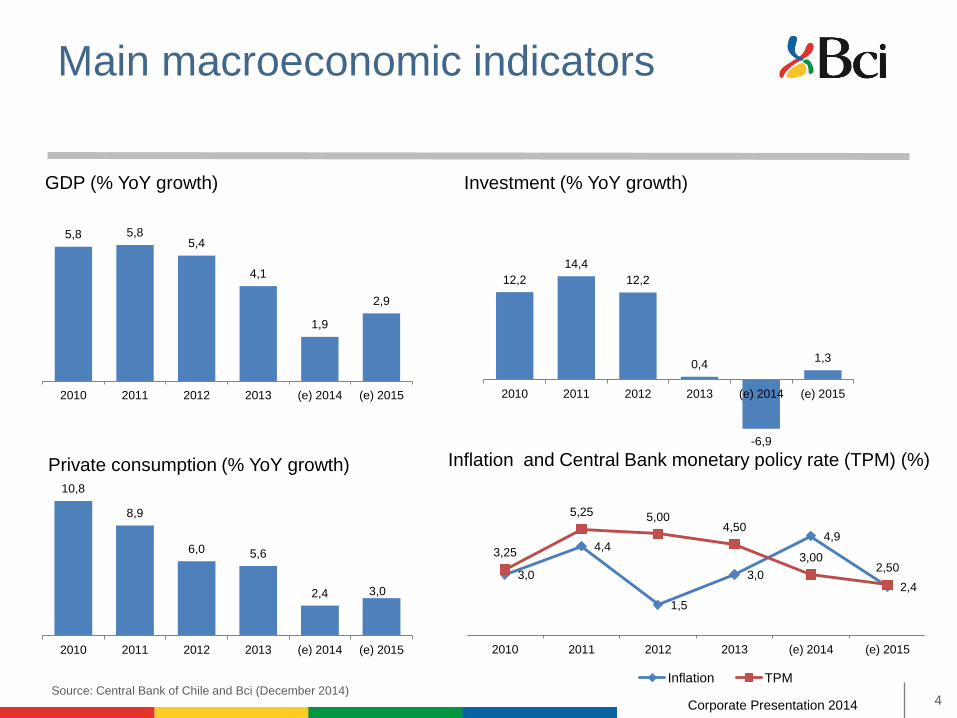
5,8 5,8 5,4
4,1
1,9
2,9
2010 2011 2012 2013 (e) 2014 (e) 2015
Main macroeconomic indicators
10,8
8,9
6,0 5,6
2,4 3,0
2010 2011 2012 2013 (e) 2014 (e) 2015
Private consumption (% YoY growth)
GDP (% YoY growth)
12,2
14,4
12,2
0,4
-6,9
1,3
2010 2011 2012 2013 (e) 2014 (e) 2015
Investment (% YoY growth)
Source: Central Bank of Chile and Bci (December 2014) 4
3,0
4,4
1,5
3,0
4,9
2,4
3,25
5,25 5,00 4,50
3,00 2,50
2010 2011 2012 2013 (e) 2014 (e) 2015
Inflation TPM
Inflation and Central Bank monetary policy rate (TPM) (%)
Chilean Financial System
19.171
21.438
24.492 22.812
25.808
2011 2012 2013 3Q 2013 3Q 2014
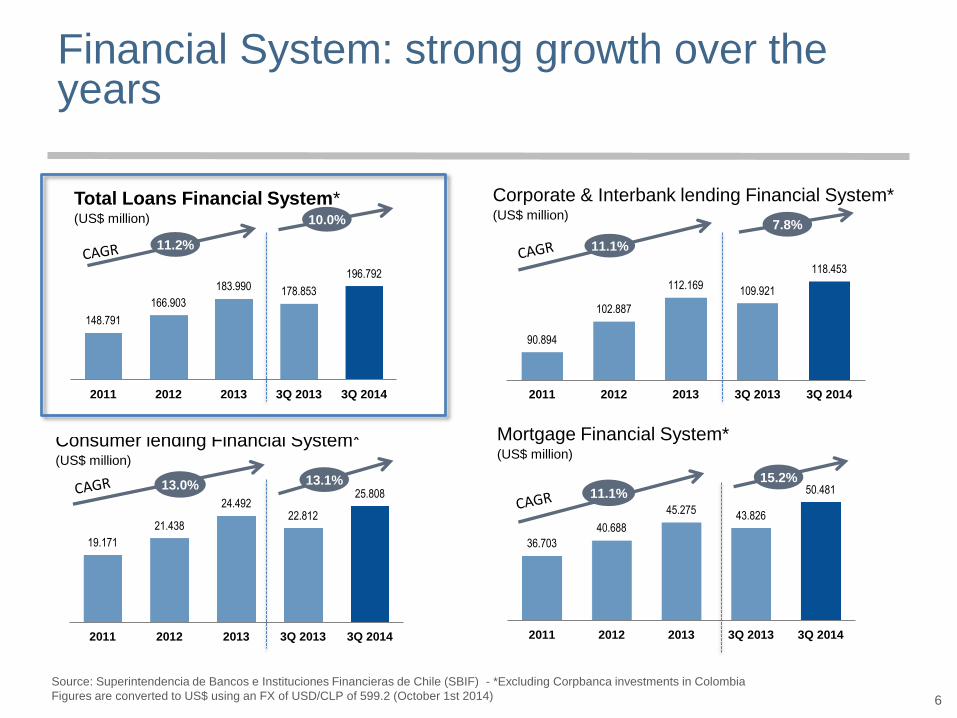
Consumer lending Financial System* (US$ million)
90.894
102.887
112.169 109.921
118.453
2011 2012 2013 3Q 2013 3Q 2014
148.791
166.903
183.990 178.853
196.792
2011 2012 2013 3Q 2013 3Q 2014
36.703
40.688
45.275 43.826
50.481
2011 2012 2013 3Q 2013 3Q 2014
Financial System: strong growth over the years
11.2%
Total Loans Financial System* (US$ million)
6
11.1%
13.0% 11.1%
Corporate & Interbank lending Financial System* (US$ million)
Mortgage Financial System* (US$ million)
Source: Superintendencia de Bancos e Instituciones Financieras de Chile (SBIF) - *Excluding Corpbanca investments in Colombia
Figures are converted to US$ using an FX of USD/CLP of 599.2 (October 1st 2014)
13.1%
7.8% 10.0%
15.2%
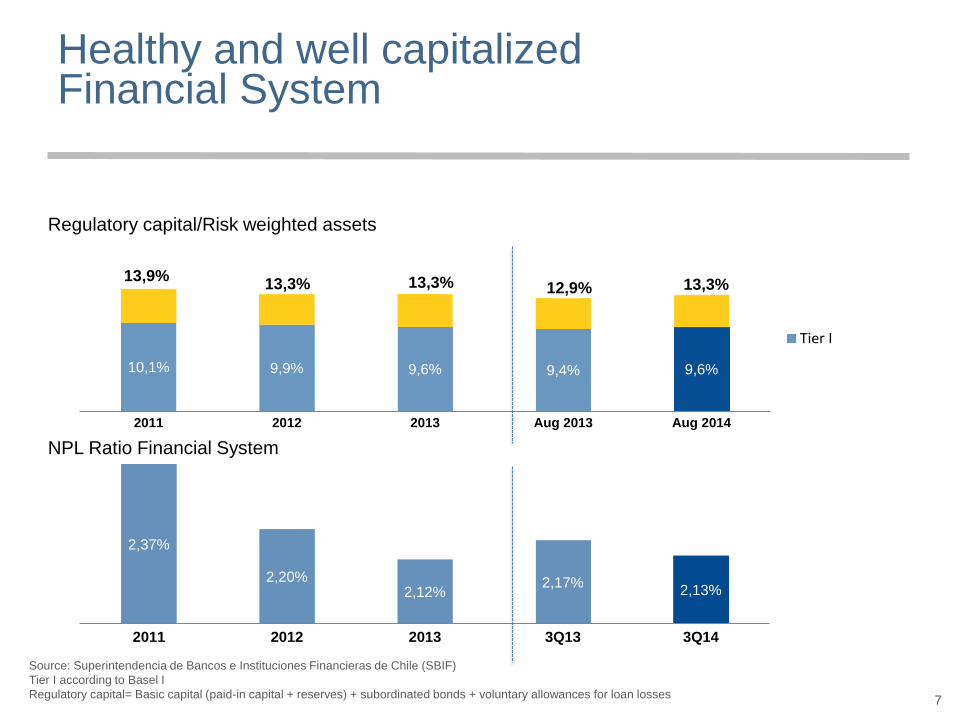
Healthy and well capitalized Financial System
Source: Superintendencia de Bancos e Instituciones Financieras de Chile (SBIF)
Tier I according to Basel I
Regulatory capital= Basic capital (paid-in capital + reserves) + subordinated bonds + voluntary allowances for loan losses
2,37%
2,20% 2,12%
2,17% 2,13%
2011 2012 2013 3Q13 3Q14
10,1% 9,9% 9,6% 9,4% 9,6%
13,9% 13,3% 13,3% 12,9% 13,3%
2011 2012 2013 Aug 2013 Aug 2014
Tier I
Regulatory capital/Risk weighted assets
NPL Ratio Financial System
7
Banco Crédito e Inversiones
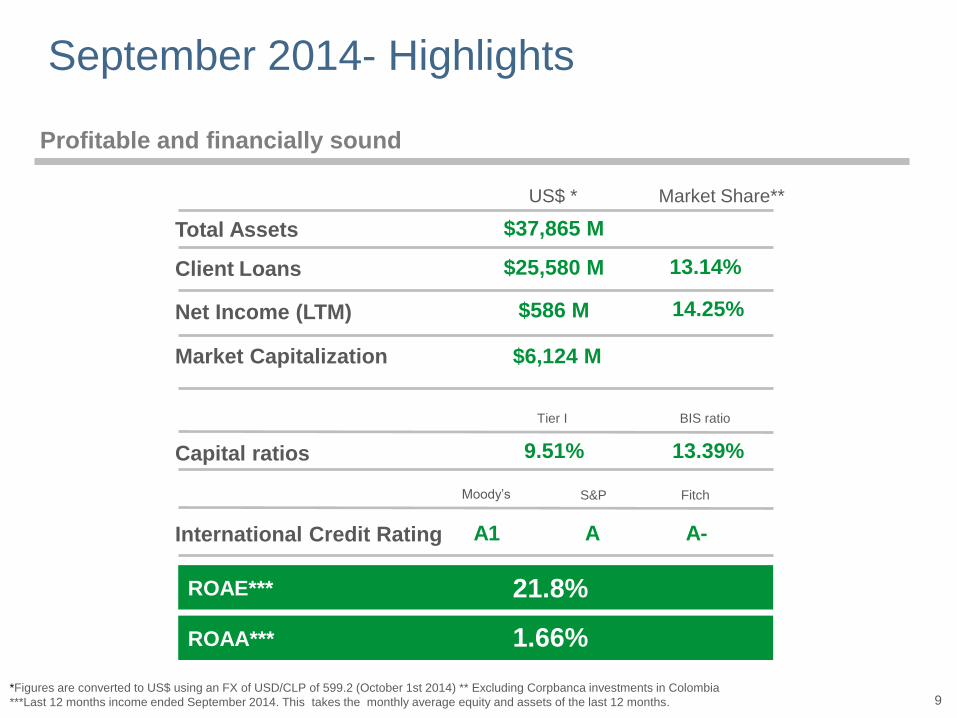
September 2014- Highlights
*Figures are converted to US$ using an FX of USD/CLP of 599.2 (October 1st 2014) ** Excluding Corpbanca investments in Colombia
***Last 12 months income ended September 2014. This takes the monthly average equity and assets of the last 12 months.
US$ * Market Share**
$586 M Net Income (LTM) 14.25%
Client Loans $25,580 M 13.14%
Total Assets $37,865 M
Market Capitalization $6,124 M
9.51%
Tier I BIS ratio
Capital ratios 13.39%
International Credit Rating
Moody’s S&P Fitch
ROAE*** 21.8%
A1 A A-
Profitable and financially sound
9
ROAA*** 1.66%
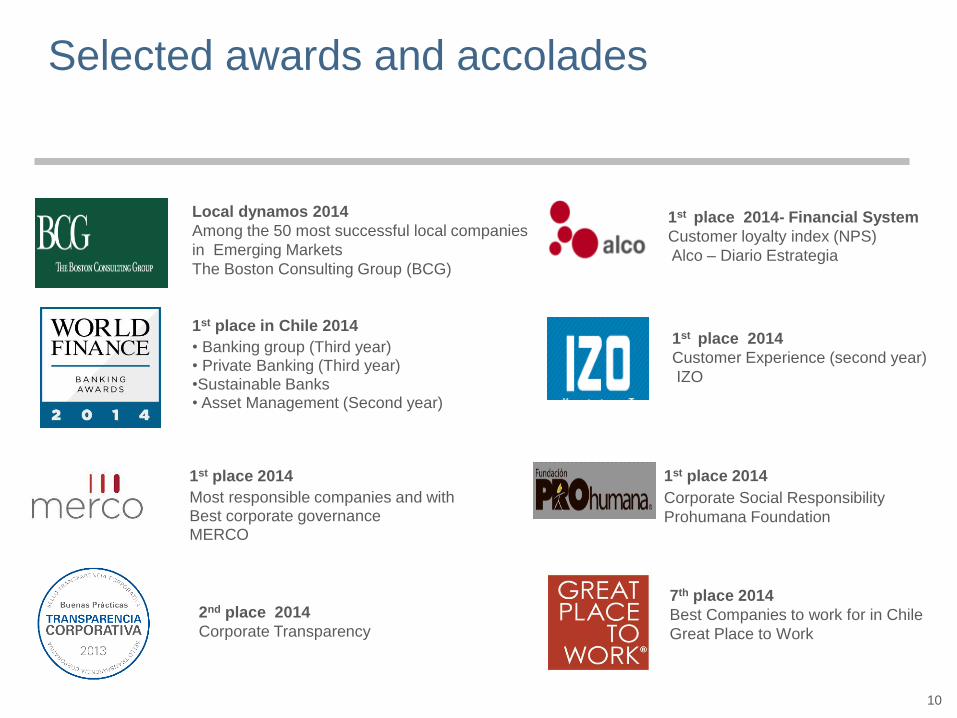
Selected awards and accolades
1st place 2014
Customer Experience (second year)
IZO
10
7th place 2014
Best Companies to work for in Chile
Great Place to Work
1st place in Chile 2014
• Banking group (Third year) • Private Banking (Third year) •Sustainable Banks • Asset Management (Second year)
2nd place 2014
Corporate Transparency
Local dynamos 2014
Among the 50 most successful local companies
in Emerging Markets
The Boston Consulting Group (BCG)
1st place 2014- Financial System
Customer loyalty index (NPS)
Alco – Diario Estrategia
1st place 2014
Corporate Social Responsibility
Prohumana Foundation
1st place 2014
Most responsible companies and with Best corporate governance MERCO
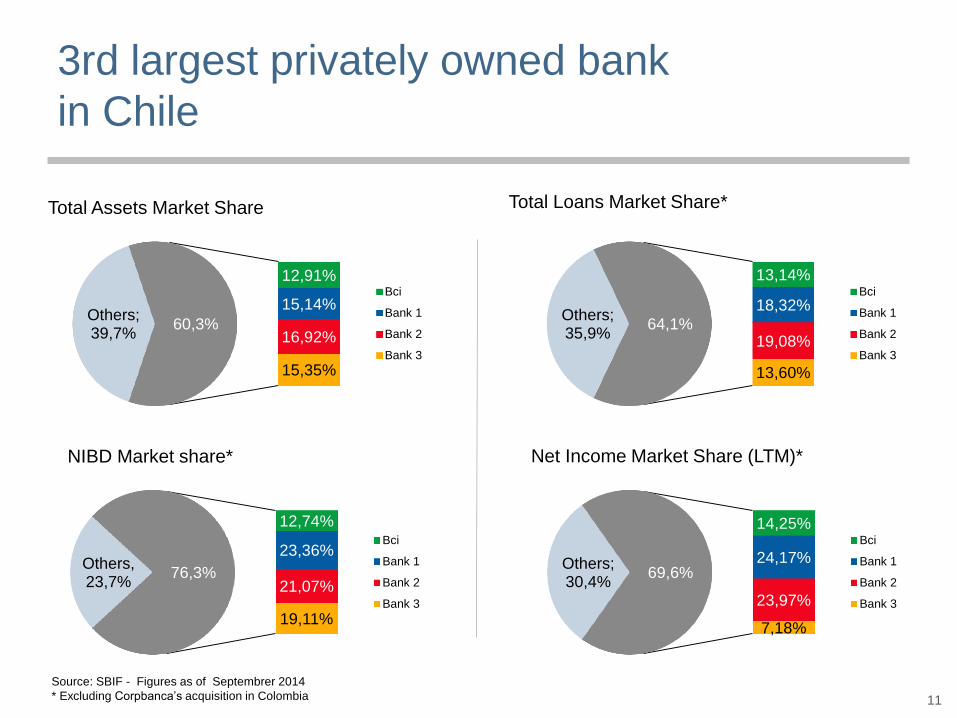
Others; 39,7%
12,91%
15,14%
16,92%
15,35%
60,3%
Bci
Bank 1
Bank 2
Bank 3
3rd largest privately owned bank
in Chile
Source: SBIF - Figures as of Septembrer 2014
* Excluding Corpbanca’s acquisition in Colombia
Total Assets Market Share
NIBD Market share*
Others, 23,7%
12,74%
23,36%
21,07%
19,11%
76,3%
Bci
Bank 1
Bank 2
Bank 3
11
Others; 35,9%
13,14%
18,32%
19,08%
13,60%
64,1%
Bci
Bank 1
Bank 2
Bank 3
Total Loans Market Share*
Net Income Market Share (LTM)*
Others; 30,4%
14,25%
24,17%
23,97%
7,18%
69,6%
Bci
Bank 1
Bank 2
Bank 3
Corporate Presentation 2013 Corporate Presentation 2014 Corporate Presentation 2014
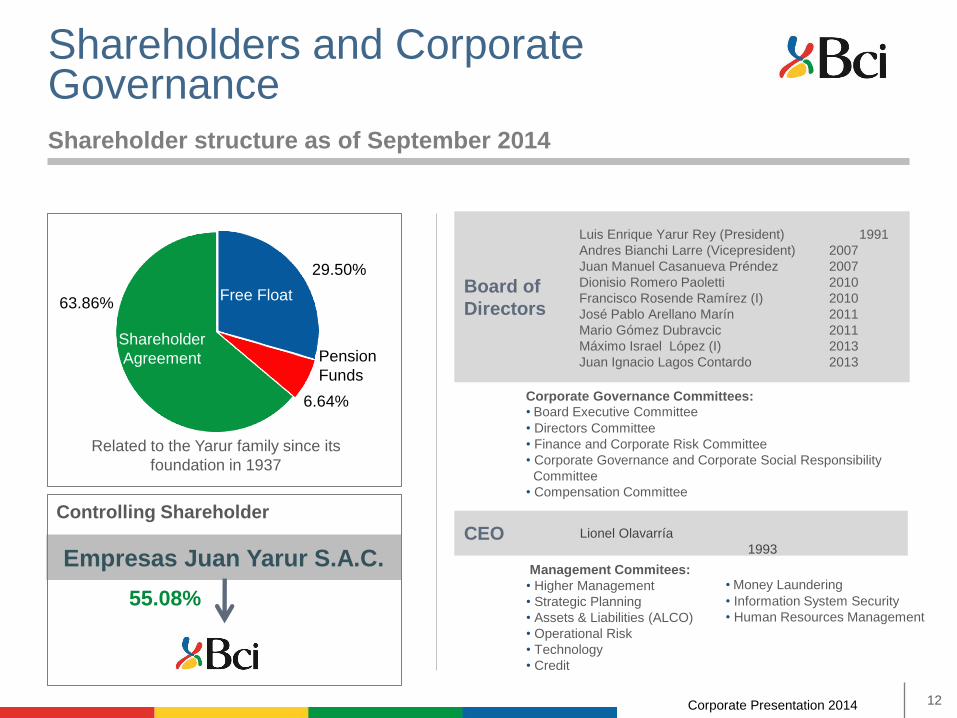
Shareholders and Corporate Governance
Empresas Juan Yarur S.A.C.
Shareholder structure as of September 2014
29.50%
6.64%
63.86%
Shareholder
Agreement Pension
Funds
Related to the Yarur family since its
foundation in 1937
55.08%
Controlling Shareholder
Management Commitees:
• Higher Management
• Strategic Planning
• Assets & Liabilities (ALCO)
• Operational Risk
• Technology
• Credit
Board of
Directors
CEO
Luis Enrique Yarur Rey (President) 1991
Andres Bianchi Larre (Vicepresident) 2007
Juan Manuel Casanueva Préndez 2007
Dionisio Romero Paoletti 2010
Francisco Rosende Ramírez (I) 2010
José Pablo Arellano Marín 2011
Mario Gómez Dubravcic 2011
Máximo Israel López (I) 2013
Juan Ignacio Lagos Contardo 2013
Lionel Olavarría
1993
Corporate Governance Committees:
• Board Executive Committee
• Directors Committee
• Finance and Corporate Risk Committee
• Corporate Governance and Corporate Social Responsibility
Committee
• Compensation Committee
12
• Money Laundering
• Information System Security
• Human Resources Management
Free Float
Corporate Presentation 2013 Corporate Presentation 2014 Corporate Presentation 2014
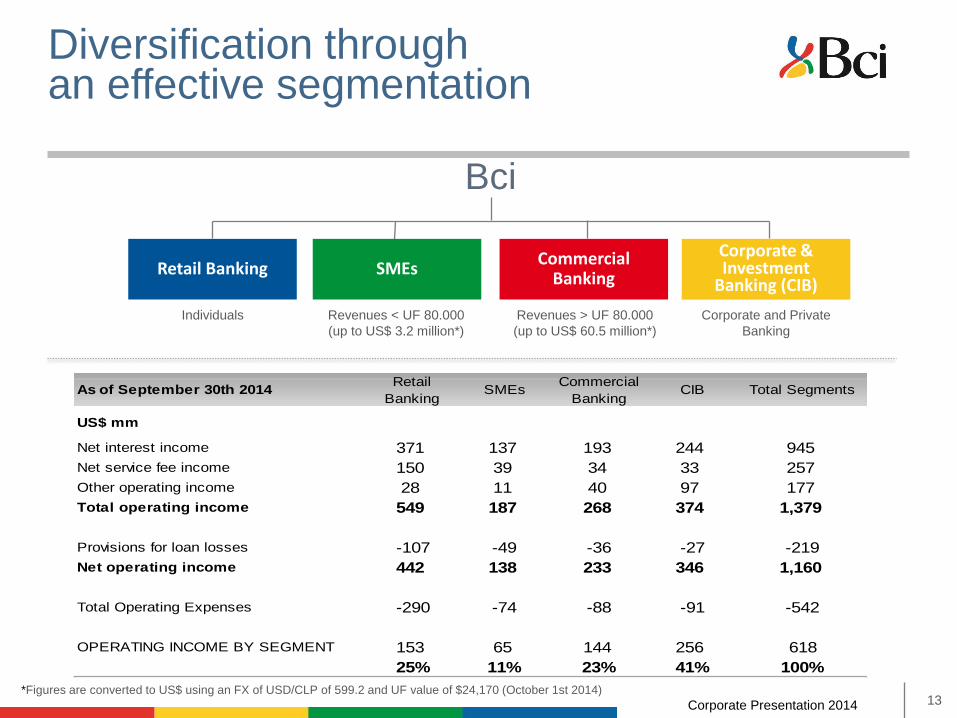
Diversification through an effective segmentation
SMEs Commercial
Banking
Corporate & Investment
Banking (CIB) Retail Banking
Revenues > UF 80.000
(up to US$ 60.5 million*)
Individuals Revenues < UF 80.000
(up to US$ 3.2 million*)
Corporate and Private
Banking
Bci
13 *Figures are converted to US$ using an FX of USD/CLP of 599.2 and UF value of $24,170 (October 1st 2014)
As of September 30th 2014Retail
BankingSMEs
Commercial
BankingCIB Total Segments
US$ mm
Net interest income 371 137 193 244 945
Net service fee income 150 39 34 33 257
Other operating income 28 11 40 97 177
Total operating income 549 187 268 374 1,379
Provisions for loan losses -107 -49 -36 -27 -219
Net operating income 442 138 233 346 1,160
Total Operating Expenses -290 -74 -88 -91 -542
OPERATING INCOME BY SEGMENT 153 65 144 256 618
25% 11% 23% 41% 100%
Corporate Presentation 2013 Corporate Presentation 2014 Corporate Presentation 2014
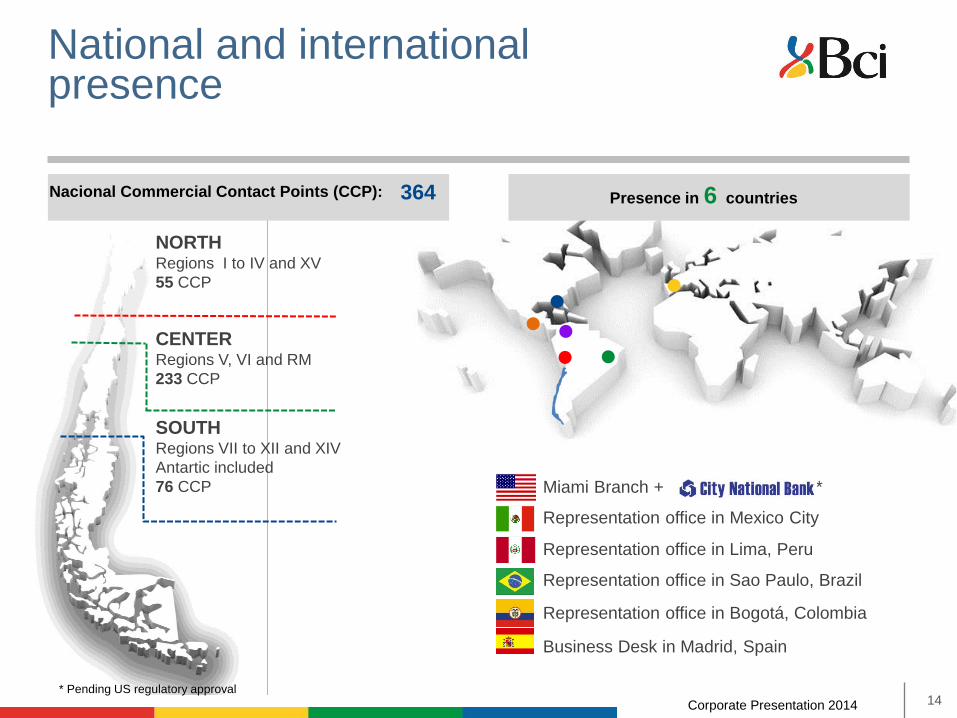
Miami Branch + (**
National and international presence
Representation office in Mexico City
Representation office in Lima, Peru
Representation office in Sao Paulo, Brazil
Representation office in Bogotá, Colombia
Business Desk in Madrid, Spain
SOUTH Regions VII to XII and XIV
Antartic included
76 CCP
NORTH Regions I to IV and XV
55 CCP
CENTER Regions V, VI and RM
233 CCP
Presence in 6 countries 364
14
Nacional Commercial Contact Points (CCP):
* Pending US regulatory approval
Corporate Presentation 2013 Corporate Presentation 2014 Corporate Presentation 2014
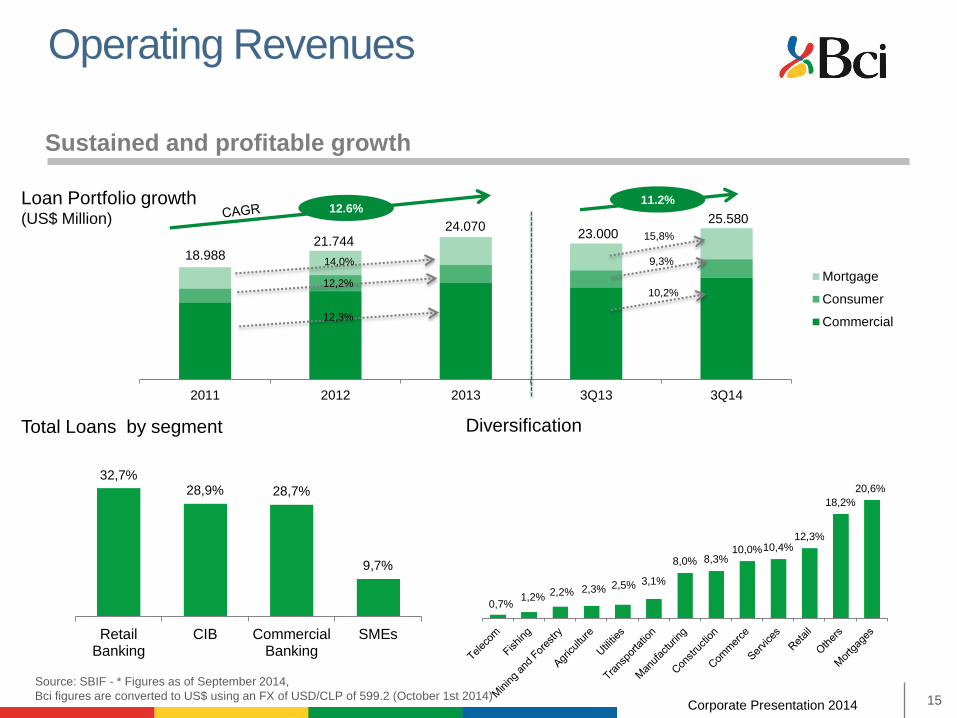
32,7% 28,9% 28,7%
9,7%
RetailBanking
CIB CommercialBanking
SMEs
2011 2012 2013 3Q13 3Q14
Mortgage
Consumer
Commercial
Operating Revenues
15
Loan Portfolio growth (US$ Million)
Source: SBIF - * Figures as of September 2014,
Bci figures are converted to US$ using an FX of USD/CLP of 599.2 (October 1st 2014)
Diversification
8,0% 8,3% 10,0% 10,4%
12,3%
18,2%
20,6%
12.6% 11.2%
18.988 21.744
24.070 23.000
25.580
14,0%
12,2%
12,3%
15,8%
9,3%
10,2%
Total Loans by segment
Sustained and profitable growth
0,7% 1,2% 2,2% 2,3% 2,5% 3,1%
Corporate Presentation 2013 Corporate Presentation 2014 Corporate Presentation 2014
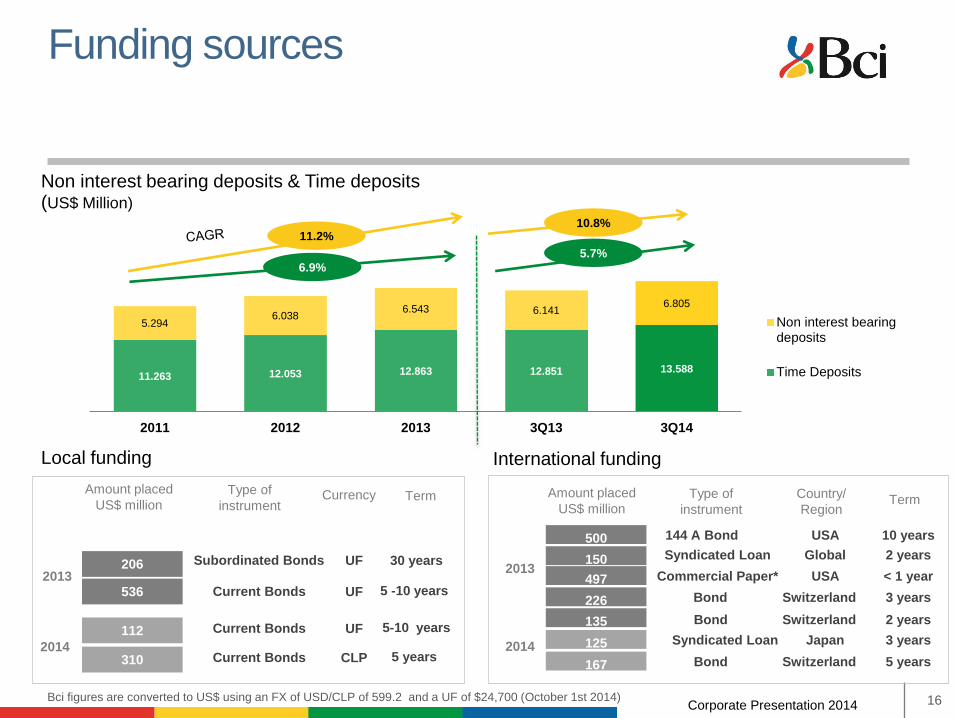
Funding sources
16
Non interest bearing deposits & Time deposits (US$ Million)
11.263 12.053 12.863 12.851 13.588
5.294 6.038
6.543 6.141 6.805
2011 2012 2013 3Q13 3Q14
Non interest bearingdeposits
Time Deposits
11.2%
6.9%
Bci figures are converted to US$ using an FX of USD/CLP of 599.2 and a UF of $24,700 (October 1st 2014)
5.7%
10.8%
Amount placed
US$ million Country/
Region Term
2013
2014
500
226
135
150
497
125
167
Type of
instrument
144 A Bond
Bond
Bond
Syndicated Loan
Commercial Paper*
Syndicated Loan
Bond
USA
Switzerland
Switzerland
Global
USA
Japan
Switzerland
10 years
3 years
2 years
2 years
< 1 year
3 years
5 years
Local funding
Amount placed
US$ million Term
2013
112
206
Type of
instrument
Current Bonds
Subordinated Bonds
5-10 years
30 years
Currency
UF
UF
International funding
2014
536 Current Bonds 5 -10 years UF
310 Current Bonds 5 years CLP
Corporate Presentation 2013 Corporate Presentation 2014 Corporate Presentation 2014
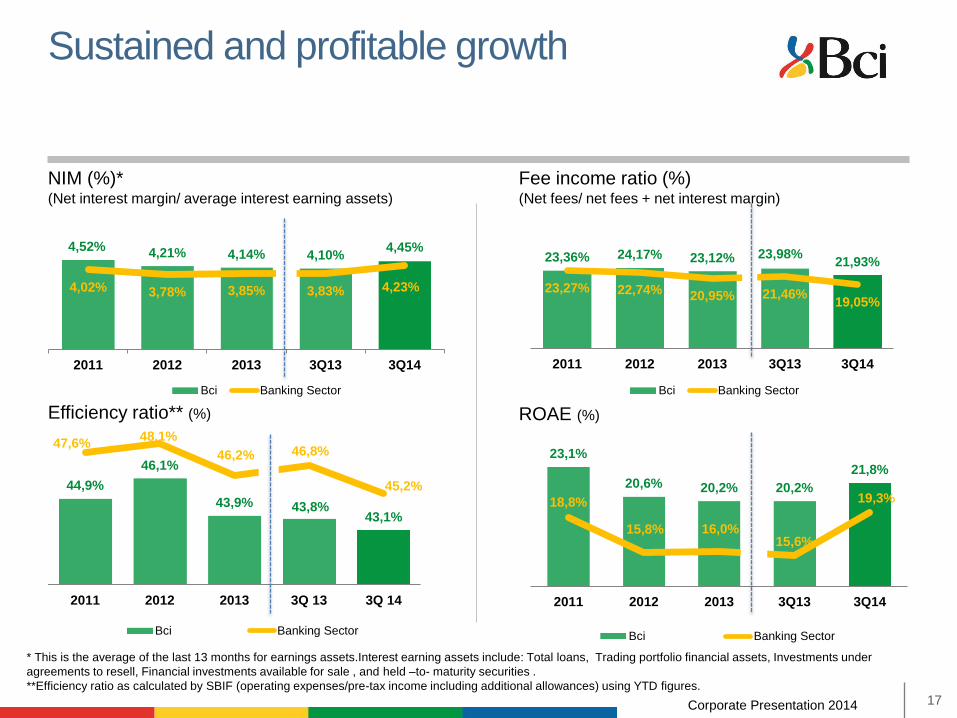
23,36% 24,17% 23,12% 23,98% 21,93%
23,27% 22,74% 20,95% 21,46% 19,05%
0,0 0%
5,0 0%
10, 00%
15, 00%
20, 00%
25, 00%
30, 00%
2011 2012 2013 3Q13 3Q14
Bci Banking Sector
4,52% 4,21% 4,14% 4,10%
4,45%
4,02% 3,78% 3,85% 3,83% 4,23%
2011 2012 2013 3Q13 3Q14
Bci Banking Sector
44,9%
46,1%
43,9% 43,8% 43,1%
47,6% 48,1%
46,2% 46,8%
45,2%
2011 2012 2013 3Q 13 3Q 14
Bci Banking Sector
23,1%
20,6% 20,2% 20,2%
21,8%
18,8%
15,8% 16,0% 15,6%
19,3%
2011 2012 2013 3Q13 3Q14
Bci Banking Sector
Sustained and profitable growth
ROAE (%)
NIM (%)* (Net interest margin/ average interest earning assets)
Fee income ratio (%) (Net fees/ net fees + net interest margin)
Efficiency ratio** (%)
* This is the average of the last 13 months for earnings assets.Interest earning assets include: Total loans, Trading portfolio financial assets, Investments under
agreements to resell, Financial investments available for sale , and held –to- maturity securities .
**Efficiency ratio as calculated by SBIF (operating expenses/pre-tax income including additional allowances) using YTD figures.
17
Corporate Presentation 2013 Corporate Presentation 2014 Corporate Presentation 2014
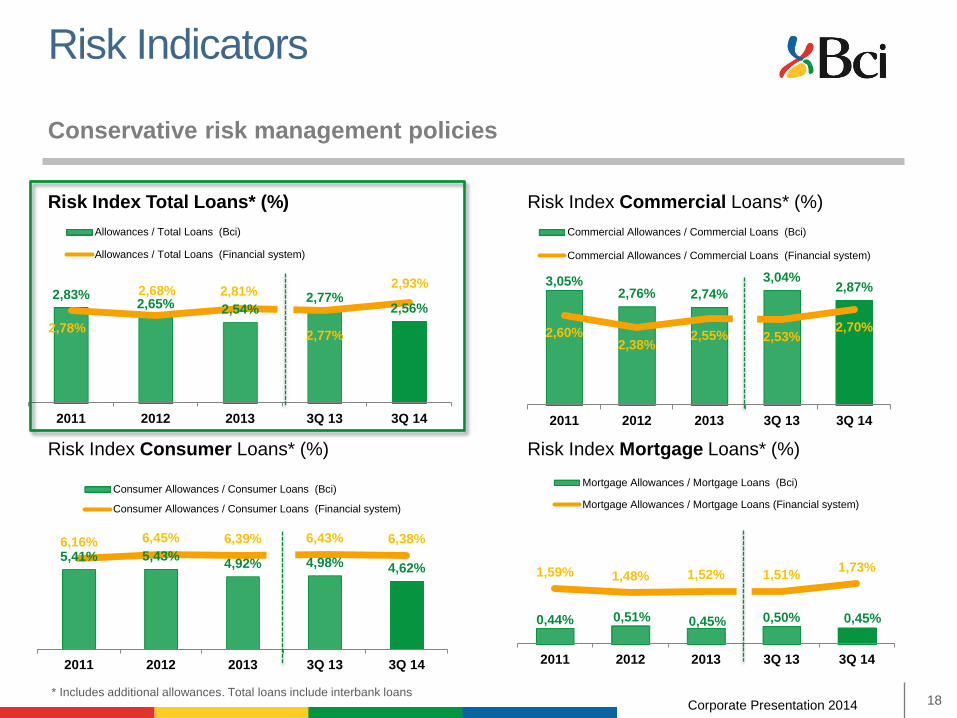
3,05% 2,76% 2,74%
3,04% 2,87%
2,60% 2,38%
2,55% 2,53% 2,70%
2011 2012 2013 3Q 13 3Q 14
Commercial Allowances / Commercial Loans (Bci)
Commercial Allowances / Commercial Loans (Financial system)
0,44% 0,51% 0,45% 0,50% 0,45%
1,59% 1,48% 1,52% 1,51% 1,73%
2011 2012 2013 3Q 13 3Q 14
Mortgage Allowances / Mortgage Loans (Bci)
Mortgage Allowances / Mortgage Loans (Financial system)
Risk Indicators Conservative risk management policies
18
Risk Index Mortgage Loans* (%)
Risk Index Commercial Loans* (%) Risk Index Total Loans* (%)
2,83% 2,65% 2,54%
2,77% 2,56%
2,78%
2,68% 2,81%
2,77%
2,93%
2011 2012 2013 3Q 13 3Q 14
Allowances / Total Loans (Bci)
Allowances / Total Loans (Financial system)
5,41% 5,43% 4,92% 4,98% 4,62%
6,16% 6,45% 6,39% 6,43% 6,38%
2011 2012 2013 3Q 13 3Q 14
Consumer Allowances / Consumer Loans (Bci)
Consumer Allowances / Consumer Loans (Financial system)
Risk Index Consumer Loans* (%)
* Includes additional allowances. Total loans include interbank loans
Corporate Presentation 2013 Corporate Presentation 2014 Corporate Presentation 2014
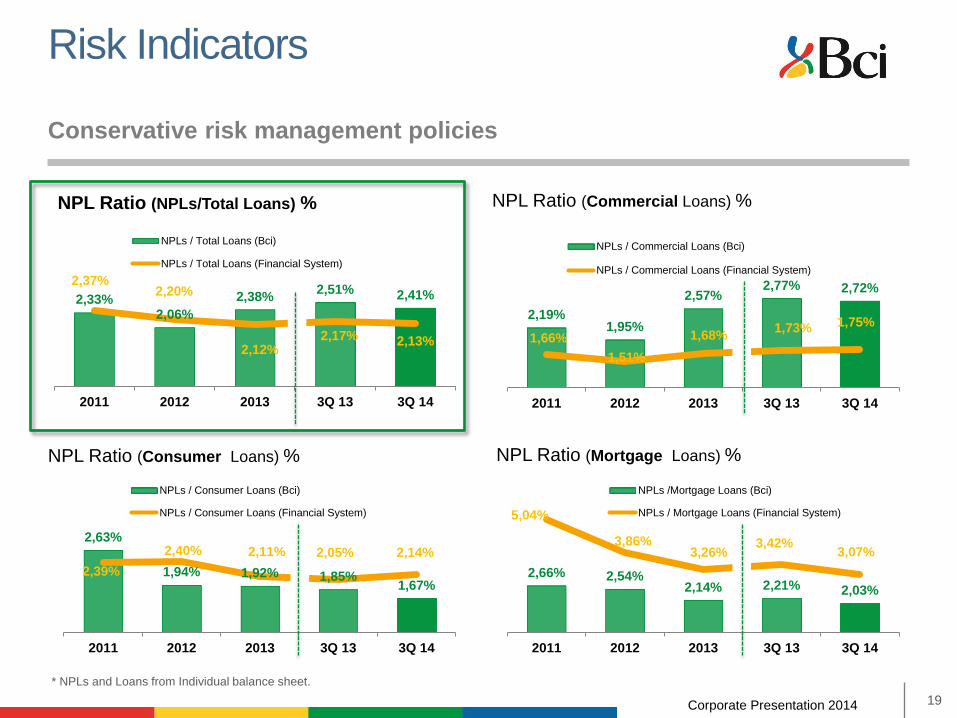
2,66% 2,54% 2,14% 2,21% 2,03%
5,04%
3,86% 3,26%
3,42% 3,07%
2011 2012 2013 3Q 13 3Q 14
NPLs /Mortgage Loans (Bci)
NPLs / Mortgage Loans (Financial System)
Risk Indicators Conservative risk management policies
NPL Ratio (NPLs/Total Loans) %
19
2,33% 2,06%
2,38% 2,51% 2,41%
2,37% 2,20%
2,12% 2,17% 2,13%
2011 2012 2013 3Q 13 3Q 14
NPLs / Total Loans (Bci)
NPLs / Total Loans (Financial System)
* NPLs and Loans from Individual balance sheet.
2,19% 1,95%
2,57% 2,77% 2,72%
1,66%
1,51%
1,68% 1,73% 1,75%
2011 2012 2013 3Q 13 3Q 14
NPLs / Commercial Loans (Bci)
NPLs / Commercial Loans (Financial System)
2,63%
1,94% 1,92% 1,85% 1,67%
2,39%
2,40% 2,11% 2,05% 2,14%
2011 2012 2013 3Q 13 3Q 14
NPLs / Consumer Loans (Bci)
NPLs / Consumer Loans (Financial System)
NPL Ratio (Commercial Loans) %
NPL Ratio (Consumer Loans) % NPL Ratio (Mortgage Loans) %
Corporate Presentation 2013 Corporate Presentation 2014 Corporate Presentation 2014
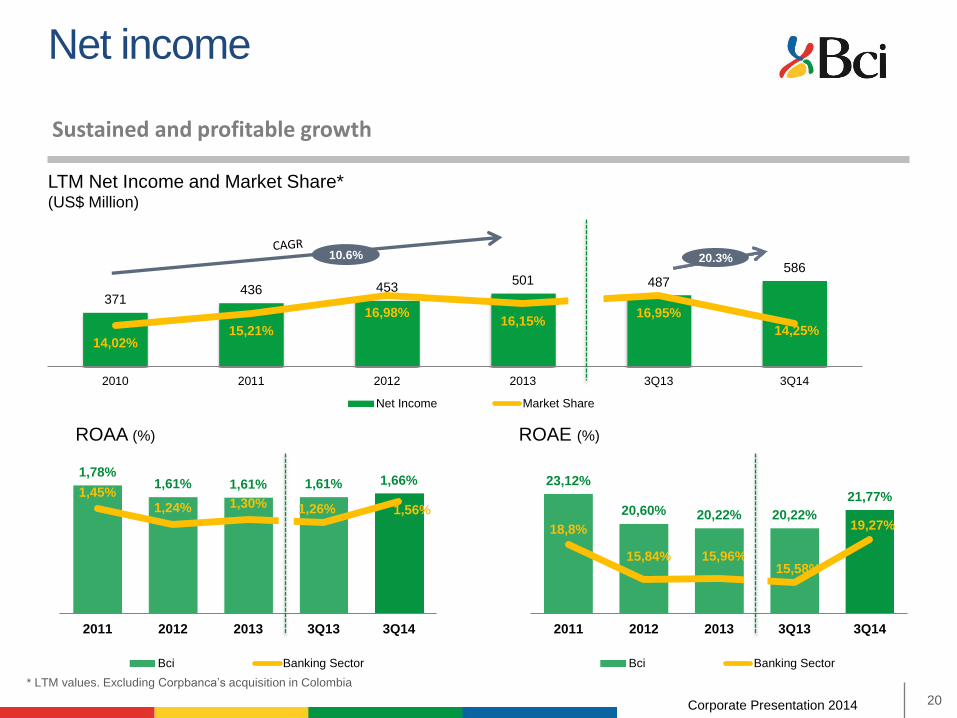
1,78% 1,61% 1,61% 1,61% 1,66%
1,45% 1,24% 1,30% 1,26% 1,56%
2011 2012 2013 3Q13 3Q14
Bci Banking Sector
371 436 453
501 487 586
14,02% 15,21%
16,98% 16,15%
16,95%
14,25%
10,0%
12,0%
14,0%
16,0%
18,0%
20,0%
0
100
200
300
400
500
600
700
2010 2011 2012 2013 3Q13 3Q14
Net Income Market Share
10.6%
23,12%
20,60% 20,22% 20,22%
21,77%
18,8%
15,84% 15,96% 15,58%
19,27%
2011 2012 2013 3Q13 3Q14
Bci Banking Sector
Net income
ROAE (%)
* LTM values. Excluding Corpbanca’s acquisition in Colombia
20
ROAA (%)
LTM Net Income and Market Share* (US$ Million)
20.3%
Sustained and profitable growth
Corporate Presentation 2013 Corporate Presentation 2014 Corporate Presentation 2014
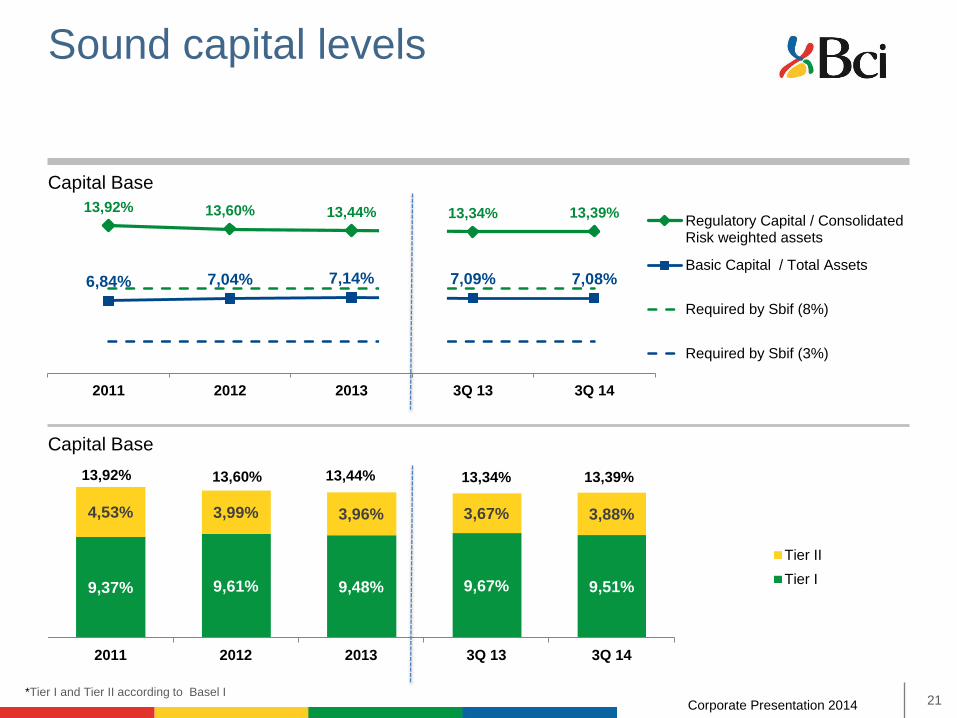
Sound capital levels
21
13,92% 13,60% 13,44% 13,34% 13,39%
6,84% 7,04% 7,14% 7,09% 7,08%
2011 2012 2013 3Q 13 3Q 14
Regulatory Capital / ConsolidatedRisk weighted assets
Basic Capital / Total Assets
Required by Sbif (8%)
Required by Sbif (3%)
Capital Base
9,37% 9,61% 9,48% 9,67% 9,51%
4,53% 3,99% 3,96% 3,67% 3,88%
13,92% 13,60% 13,44% 13,34% 13,39%
2011 2012 2013 3Q 13 3Q 14
Tier II
Tier I
Capital Base
*Tier I and Tier II according to Basel I
Corporate Presentation 2013 Corporate Presentation 2014 Corporate Presentation 2014
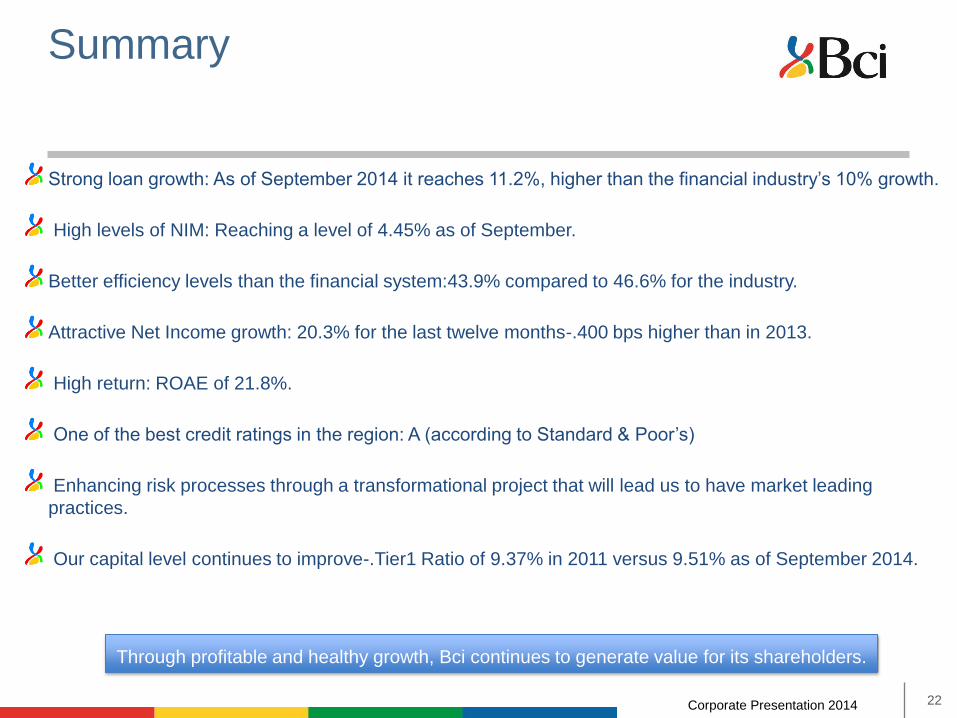
Summary
22
Strong loan growth: As of September 2014 it reaches 11.2%, higher than the financial industry’s 10% growth.
High levels of NIM: Reaching a level of 4.45% as of September.
Better efficiency levels than the financial system:43.9% compared to 46.6% for the industry.
Attractive Net Income growth: 20.3% for the last twelve months-.400 bps higher than in 2013.
High return: ROAE of 21.8%.
One of the best credit ratings in the region: A (according to Standard & Poor’s)
Enhancing risk processes through a transformational project that will lead us to have market leading
practices.
Our capital level continues to improve-.Tier1 Ratio of 9.37% in 2011 versus 9.51% as of September 2014.
Through profitable and healthy growth, Bci continues to generate value for its shareholders.
Corporate Presentation 2013 Corporate Presentation 2014
Clic para editar título
Corporate Presentation 2014
“This presentation contains forward-looking statements in various places throughout therein, related to, without limitation, our future business development. Forward-looking information is often, but not always, identified by the use of words such as “anticipate”, “believe”, “expect”, “plan”, “intend”, “forecast”, “project”, “may”, “will”, “should”, “could”, “estimate”, “predict” or similar words suggesting future outcomes or language suggesting an outlook. While
these forward looking statements represent our judgment and future expectations concerning the development of our business, a number of risks, uncertainties and other important factors could cause actual developments and results to differ materially from our plans, objectives, expectations, anticipations, estimates and intentions expressed
in such forward-looking statements. The risk factors and other key factors that we have indicated in our past and future filings and reports, including those with local or foreign authorities, could adversely affect our business and financial performance. The information contained herein is subject to, and must be read in conjunction with, all other publicly available information, including relevant document published by Banco de Crédito e Inversiones (“BCI”) or any of its related
companies.
The forward-looking statements represent our views as of the date of this presentation and should not be relied upon as representing our views as of any date subsequent to the date of this presentation. We undertake no obligation to update any of these statements.
Recipients of this presentation are not to construe the contents therein as legal, tax or investment advice and such recipients should consult their own advisors in this regard. Likewise, this presentation does not constitute or form any part of any offer, invitation or inducement to sell or issue, or any solicitation of any offer to purchase or subscribe for, any shares or other securities issued or related to BCI.
Furthermore, any liability for losses arising from the use of material contained in this presentation, which is confidential and submitted to prior selected recipients only, is accepted by BCI or its executives, directors or
related companies. This presentation may not be reproduced (in whole or in part) to any other person, without our prior written consent”.
Thank you
“
Corporate Presentation 2013 Corporate Presentation 2014
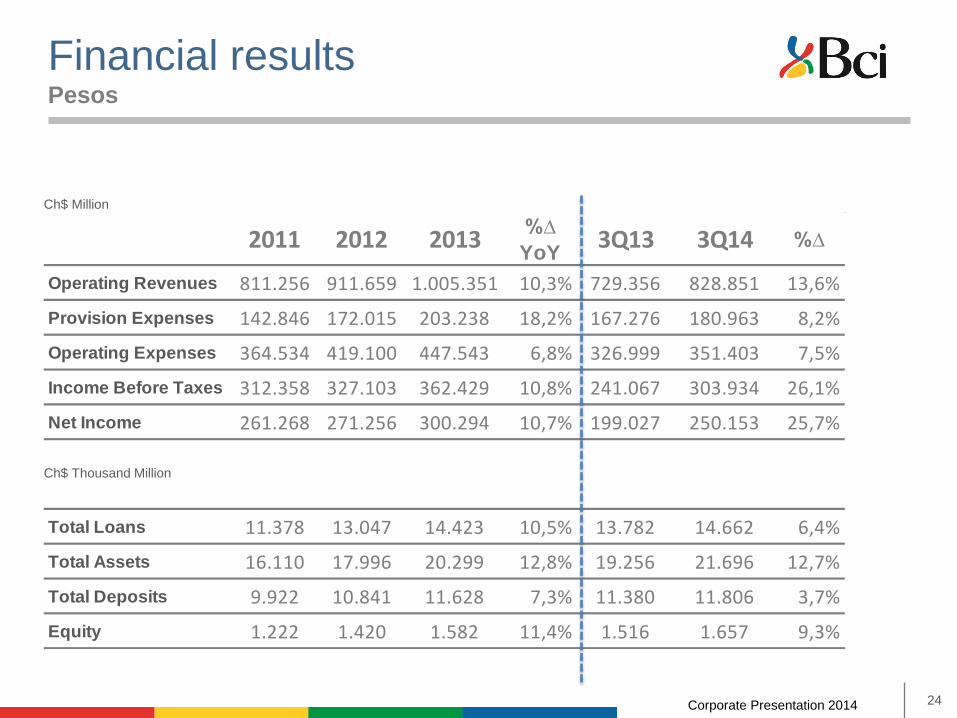
%∆
YoY
Operating Revenues 811.256 911.659 1.005.351 10,3% 729.356 828.851 13,6%
Provision Expenses 142.846 172.015 203.238 18,2% 167.276 180.963 8,2%
Operating Expenses 364.534 419.100 447.543 6,8% 326.999 351.403 7,5%
Income Before Taxes 312.358 327.103 362.429 10,8% 241.067 303.934 26,1%
Net Income 261.268 271.256 300.294 10,7% 199.027 250.153 25,7%
Total Loans 11.378 13.047 14.423 10,5% 13.782 14.662 6,4%
Total Assets 16.110 17.996 20.299 12,8% 19.256 21.696 12,7%
Total Deposits 9.922 10.841 11.628 7,3% 11.380 11.806 3,7%
Equity 1.222 1.420 1.582 11,4% 1.516 1.657 9,3%
%∆2011 2012 2013 3Q13 3Q14
Financial results
Ch$ Thousand Million
24
Ch$ Million
Pesos
Corporate Presentation 2013 Corporate Presentation 2014
%∆
YoY
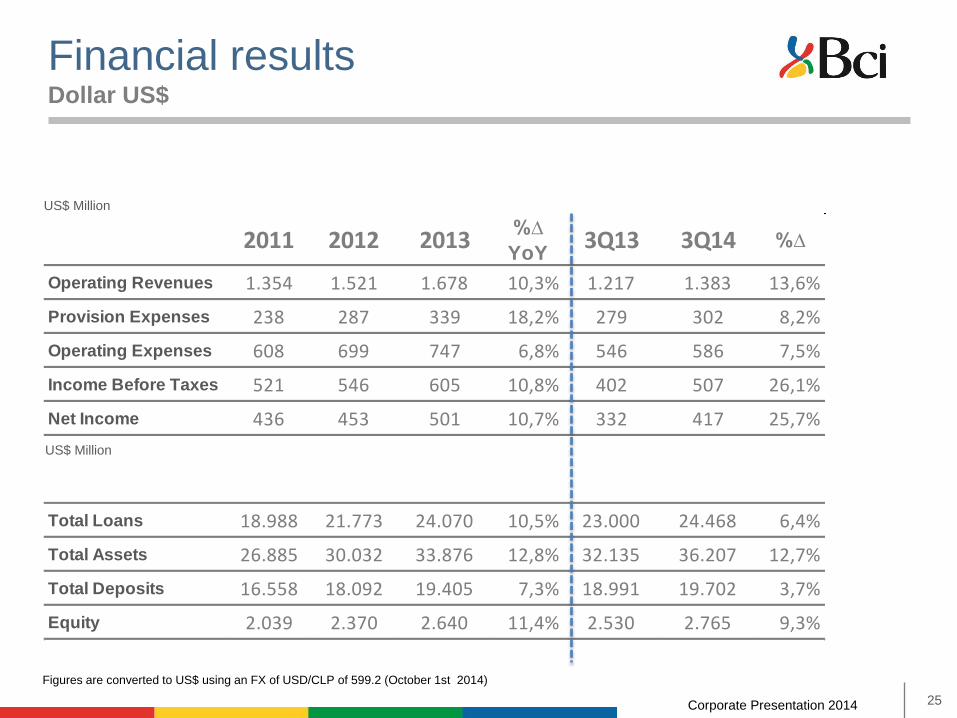
Operating Revenues 1.354 1.521 1.678 10,3% 1.217 1.383 13,6%
Provision Expenses 238 287 339 18,2% 279 302 8,2%
Operating Expenses 608 699 747 6,8% 546 586 7,5%
Income Before Taxes 521 546 605 10,8% 402 507 26,1%
Net Income 436 453 501 10,7% 332 417 25,7%
Total Loans 18.988 21.773 24.070 10,5% 23.000 24.468 6,4%
Total Assets 26.885 30.032 33.876 12,8% 32.135 36.207 12,7%
Total Deposits 16.558 18.092 19.405 7,3% 18.991 19.702 3,7%
Equity 2.039 2.370 2.640 11,4% 2.530 2.765 9,3%
2011 2012 2013 3Q13 3Q14 %∆
Financial results
US$ Million
25
US$ Million
Dollar US$
Figures are converted to US$ using an FX of USD/CLP of 599.2 (October 1st 2014)