CORPORATE INFORMATION€¦ · 19961996 1997 19971997 1998 19981998 1999 19991999 2000 20002000 2001...
27
CORPORATE INFORMATION For the fiscal year ended March 31, 2003 - - - - - - May 2003 May 2003 May 2003 May 2003 May 2003 May 2003 May 2003 May 2003 - - - - - - Meitec Corporation Meitec Corporation Meitec Corporation Meitec Corporation Meitec Corporation Meitec Corporation Meitec Corporation Meitec Corporation 8 8 8 8 8 8 - - - - - - 5 5 5 5 5 5 - - - - - - 26 26 26 26 26 26 26 26 Akasaka Akasaka Akasaka Akasaka Akasaka Akasaka Akasaka Akasaka , , , , , , , , Akasaka Akasaka Akasaka Akasaka Akasaka Akasaka Akasaka Akasaka DS Building DS Building DS Building DS Building DS Building DS Building DS Building DS Building Minato Minato Minato Minato Minato Minato Minato Minato - - - - - - ku ku ku ku ku ku ku ku , Tokyo 107 , Tokyo 107 , Tokyo 107 , Tokyo 107 , Tokyo 107 , Tokyo 107 , Tokyo 107 , Tokyo 107 - - - - - - 0052 0052 0052 0052 0052 0052 0052 0052 TEL 03 TEL 03 TEL 03 TEL 03 TEL 03 TEL 03 TEL 03 TEL 03 - - - - - - 5413 5413 5413 5413 5413 5413 5413 5413 - - - - - - 2600 2600 2600 2600 2600 2600 2600 2600 FAX 03 FAX 03 FAX 03 FAX 03 FAX 03 FAX 03 FAX 03 FAX 03 - - - - - - 5413 5413 5413 5413 5413 5413 5413 5413 - - - - - - 2620 2620 2620 2620 2620 2620 2620 2620 URL : http://www. URL : http://www. URL : http://www. URL : http://www. URL : http://www. URL : http://www. URL : http://www. URL : http://www. meitec meitec meitec meitec meitec meitec meitec meitec .co. .co. .co. .co. .co. .co. .co. .co. jp jp jp jp jp jp jp jp
Transcript of CORPORATE INFORMATION€¦ · 19961996 1997 19971997 1998 19981998 1999 19991999 2000 20002000 2001...

CORPORATE INFORMATIONFor the fiscal year ended
March 31, 2003
--------May 2003May 2003May 2003May 2003May 2003May 2003May 2003May 2003--------
Meitec CorporationMeitec CorporationMeitec CorporationMeitec CorporationMeitec CorporationMeitec CorporationMeitec CorporationMeitec Corporation88888888--------55555555--------26 26 26 26 26 26 26 26 AkasakaAkasakaAkasakaAkasakaAkasakaAkasakaAkasakaAkasaka, , , , , , , , AkasakaAkasakaAkasakaAkasakaAkasakaAkasakaAkasakaAkasaka DS Building DS Building DS Building DS Building DS Building DS Building DS Building DS Building MinatoMinatoMinatoMinatoMinatoMinatoMinatoMinato--------kukukukukukukuku, Tokyo 107, Tokyo 107, Tokyo 107, Tokyo 107, Tokyo 107, Tokyo 107, Tokyo 107, Tokyo 107--------00520052005200520052005200520052TEL 03TEL 03TEL 03TEL 03TEL 03TEL 03TEL 03TEL 03--------54135413541354135413541354135413--------26002600260026002600260026002600 FAX 03FAX 03FAX 03FAX 03FAX 03FAX 03FAX 03FAX 03--------54135413541354135413541354135413--------26202620262026202620262026202620URL : http://www.URL : http://www.URL : http://www.URL : http://www.URL : http://www.URL : http://www.URL : http://www.URL : http://www.meitecmeitecmeitecmeitecmeitecmeitecmeitecmeitec.co..co..co..co..co..co..co..co.jpjpjpjpjpjpjpjp

Market OverviewMarket OverviewMarket OverviewMarket OverviewFiscal year ended March 31, 2003Fiscal year ended March 31, 2003Fiscal year ended March 31, 2003Fiscal year ended March 31, 2003
Market OverviewMarket OverviewMarket OverviewMarket OverviewMarket OverviewMarket OverviewMarket OverviewMarket OverviewFiscal year ended March 31, 2003Fiscal year ended March 31, 2003Fiscal year ended March 31, 2003Fiscal year ended March 31, 2003Fiscal year ended March 31, 2003Fiscal year ended March 31, 2003Fiscal year ended March 31, 2003Fiscal year ended March 31, 2003
11111111
・・・・・・・・The overall Japanese business environment continued to be sluggiThe overall Japanese business environment continued to be sluggiThe overall Japanese business environment continued to be sluggiThe overall Japanese business environment continued to be sluggiThe overall Japanese business environment continued to be sluggiThe overall Japanese business environment continued to be sluggiThe overall Japanese business environment continued to be sluggiThe overall Japanese business environment continued to be sluggish over sh over sh over sh over sh over sh over sh over sh over the fiscal year ended March 31, 2003. the fiscal year ended March 31, 2003. the fiscal year ended March 31, 2003. the fiscal year ended March 31, 2003. the fiscal year ended March 31, 2003. the fiscal year ended March 31, 2003. the fiscal year ended March 31, 2003. the fiscal year ended March 31, 2003.
・・・・・・・・Many of clients companies were under structural reforms. This rMany of clients companies were under structural reforms. This rMany of clients companies were under structural reforms. This rMany of clients companies were under structural reforms. This rMany of clients companies were under structural reforms. This rMany of clients companies were under structural reforms. This rMany of clients companies were under structural reforms. This rMany of clients companies were under structural reforms. This resulted in esulted in esulted in esulted in esulted in esulted in esulted in esulted in general decline in R&D and capital investment by the clients, angeneral decline in R&D and capital investment by the clients, angeneral decline in R&D and capital investment by the clients, angeneral decline in R&D and capital investment by the clients, angeneral decline in R&D and capital investment by the clients, angeneral decline in R&D and capital investment by the clients, angeneral decline in R&D and capital investment by the clients, angeneral decline in R&D and capital investment by the clients, andddddddd MeitecMeitecMeitecMeitecMeitecMeitecMeitecMeitec’’ssssssss business was no exception to be effected by the negative impact.business was no exception to be effected by the negative impact.business was no exception to be effected by the negative impact.business was no exception to be effected by the negative impact.business was no exception to be effected by the negative impact.business was no exception to be effected by the negative impact.business was no exception to be effected by the negative impact.business was no exception to be effected by the negative impact.
・・・・・・・・On the other hand, at the clients companies who had completed thOn the other hand, at the clients companies who had completed thOn the other hand, at the clients companies who had completed thOn the other hand, at the clients companies who had completed thOn the other hand, at the clients companies who had completed thOn the other hand, at the clients companies who had completed thOn the other hand, at the clients companies who had completed thOn the other hand, at the clients companies who had completed their eir eir eir eir eir eir eir restructuring and selected the business they want focus on, starrestructuring and selected the business they want focus on, starrestructuring and selected the business they want focus on, starrestructuring and selected the business they want focus on, starrestructuring and selected the business they want focus on, starrestructuring and selected the business they want focus on, starrestructuring and selected the business they want focus on, starrestructuring and selected the business they want focus on, started to show ted to show ted to show ted to show ted to show ted to show ted to show ted to show increase in R&D investments.increase in R&D investments.increase in R&D investments.increase in R&D investments.increase in R&D investments.increase in R&D investments.increase in R&D investments.increase in R&D investments.
・・・・・・・・MeitecMeitecMeitecMeitecMeitecMeitecMeitecMeitec was able obtain good number of orders in was able obtain good number of orders in was able obtain good number of orders in was able obtain good number of orders in was able obtain good number of orders in was able obtain good number of orders in was able obtain good number of orders in was able obtain good number of orders in the automotive, electronics, the automotive, electronics, the automotive, electronics, the automotive, electronics, the automotive, electronics, the automotive, electronics, the automotive, electronics, the automotive, electronics, and semiconductor design field compared to other industrial fieland semiconductor design field compared to other industrial fieland semiconductor design field compared to other industrial fieland semiconductor design field compared to other industrial fieland semiconductor design field compared to other industrial fieland semiconductor design field compared to other industrial fieland semiconductor design field compared to other industrial fieland semiconductor design field compared to other industrial fieldsdsdsdsdsdsdsds........
・・・・・・・・We forecasted the fiscal year to be a decline side of the mediumWe forecasted the fiscal year to be a decline side of the mediumWe forecasted the fiscal year to be a decline side of the mediumWe forecasted the fiscal year to be a decline side of the mediumWe forecasted the fiscal year to be a decline side of the mediumWe forecasted the fiscal year to be a decline side of the mediumWe forecasted the fiscal year to be a decline side of the mediumWe forecasted the fiscal year to be a decline side of the medium to long term to long term to long term to long term to long term to long term to long term to long term business cycle (three to four years) at the beginning of the yeabusiness cycle (three to four years) at the beginning of the yeabusiness cycle (three to four years) at the beginning of the yeabusiness cycle (three to four years) at the beginning of the yeabusiness cycle (three to four years) at the beginning of the yeabusiness cycle (three to four years) at the beginning of the yeabusiness cycle (three to four years) at the beginning of the yeabusiness cycle (three to four years) at the beginning of the year, and result r, and result r, and result r, and result r, and result r, and result r, and result r, and result was as nearly as we expected.was as nearly as we expected.was as nearly as we expected.was as nearly as we expected.was as nearly as we expected.was as nearly as we expected.was as nearly as we expected.was as nearly as we expected.
・・・・・・・・From the trend in orders, operating ratio and operating hours ofFrom the trend in orders, operating ratio and operating hours ofFrom the trend in orders, operating ratio and operating hours ofFrom the trend in orders, operating ratio and operating hours ofFrom the trend in orders, operating ratio and operating hours ofFrom the trend in orders, operating ratio and operating hours ofFrom the trend in orders, operating ratio and operating hours ofFrom the trend in orders, operating ratio and operating hours of engineers, we engineers, we engineers, we engineers, we engineers, we engineers, we engineers, we engineers, we believe that the first quarter represents the bottom of the markbelieve that the first quarter represents the bottom of the markbelieve that the first quarter represents the bottom of the markbelieve that the first quarter represents the bottom of the markbelieve that the first quarter represents the bottom of the markbelieve that the first quarter represents the bottom of the markbelieve that the first quarter represents the bottom of the markbelieve that the first quarter represents the bottom of the market condition. et condition. et condition. et condition. et condition. et condition. et condition. et condition.
Consolidated Operating PerformancesConsolidated Operating PerformancesConsolidated Operating PerformancesConsolidated Operating PerformancesFiscal year ended March 31, 2003Fiscal year ended March 31, 2003Fiscal year ended March 31, 2003Fiscal year ended March 31, 2003
Consolidated Operating PerformancesConsolidated Operating PerformancesConsolidated Operating PerformancesConsolidated Operating PerformancesConsolidated Operating PerformancesConsolidated Operating PerformancesConsolidated Operating PerformancesConsolidated Operating PerformancesFiscal year ended March 31, 2003Fiscal year ended March 31, 2003Fiscal year ended March 31, 2003Fiscal year ended March 31, 2003Fiscal year ended March 31, 2003Fiscal year ended March 31, 2003Fiscal year ended March 31, 2003Fiscal year ended March 31, 2003
22222222
・・・・・・・・Despite a slight increase in consolidated revenue, operating incDespite a slight increase in consolidated revenue, operating incDespite a slight increase in consolidated revenue, operating incDespite a slight increase in consolidated revenue, operating incDespite a slight increase in consolidated revenue, operating incDespite a slight increase in consolidated revenue, operating incDespite a slight increase in consolidated revenue, operating incDespite a slight increase in consolidated revenue, operating income fell 10.2%.ome fell 10.2%.ome fell 10.2%.ome fell 10.2%.ome fell 10.2%.ome fell 10.2%.ome fell 10.2%.ome fell 10.2%. NonNonNonNonNonNonNonNon--------consolidated revenue forconsolidated revenue forconsolidated revenue forconsolidated revenue forconsolidated revenue forconsolidated revenue forconsolidated revenue forconsolidated revenue for MeitecMeitecMeitecMeitecMeitecMeitecMeitecMeitec dropped slightly and operating income dropped slightly and operating income dropped slightly and operating income dropped slightly and operating income dropped slightly and operating income dropped slightly and operating income dropped slightly and operating income dropped slightly and operating income
fell 13.8%.fell 13.8%.fell 13.8%.fell 13.8%.fell 13.8%.fell 13.8%.fell 13.8%.fell 13.8%.
・・・・・・・・ Increased revenue and profit at a consolidated subsidiary, Increased revenue and profit at a consolidated subsidiary, Increased revenue and profit at a consolidated subsidiary, Increased revenue and profit at a consolidated subsidiary, Increased revenue and profit at a consolidated subsidiary, Increased revenue and profit at a consolidated subsidiary, Increased revenue and profit at a consolidated subsidiary, Increased revenue and profit at a consolidated subsidiary, Japan Outsourcing Japan Outsourcing Japan Outsourcing Japan Outsourcing Japan Outsourcing Japan Outsourcing Japan Outsourcing Japan Outsourcing Inc., has contributedInc., has contributedInc., has contributedInc., has contributedInc., has contributedInc., has contributedInc., has contributedInc., has contributed to the consolidated performances. This is an to the consolidated performances. This is an to the consolidated performances. This is an to the consolidated performances. This is an to the consolidated performances. This is an to the consolidated performances. This is an to the consolidated performances. This is an to the consolidated performances. This is an
achievement from the achievement from the achievement from the achievement from the achievement from the achievement from the achievement from the achievement from the group collaborating sales effortgroup collaborating sales effortgroup collaborating sales effortgroup collaborating sales effortgroup collaborating sales effortgroup collaborating sales effortgroup collaborating sales effortgroup collaborating sales effort started three years started three years started three years started three years started three years started three years started three years started three years ago.ago.ago.ago.ago.ago.ago.ago.
・・・・・・・・For the second half of the fiscal year, we can see that the busiFor the second half of the fiscal year, we can see that the busiFor the second half of the fiscal year, we can see that the busiFor the second half of the fiscal year, we can see that the busiFor the second half of the fiscal year, we can see that the busiFor the second half of the fiscal year, we can see that the busiFor the second half of the fiscal year, we can see that the busiFor the second half of the fiscal year, we can see that the business ness ness ness ness ness ness ness environments were in moderate recovery mode asenvironments were in moderate recovery mode asenvironments were in moderate recovery mode asenvironments were in moderate recovery mode asenvironments were in moderate recovery mode asenvironments were in moderate recovery mode asenvironments were in moderate recovery mode asenvironments were in moderate recovery mode as MeitecMeitecMeitecMeitecMeitecMeitecMeitecMeitec recorded increases recorded increases recorded increases recorded increases recorded increases recorded increases recorded increases recorded increases in revenue and profit for the latter half of the fiscal year comin revenue and profit for the latter half of the fiscal year comin revenue and profit for the latter half of the fiscal year comin revenue and profit for the latter half of the fiscal year comin revenue and profit for the latter half of the fiscal year comin revenue and profit for the latter half of the fiscal year comin revenue and profit for the latter half of the fiscal year comin revenue and profit for the latter half of the fiscal year compare to the pare to the pare to the pare to the pare to the pare to the pare to the pare to the
same period of the previous fiscal year.same period of the previous fiscal year.same period of the previous fiscal year.same period of the previous fiscal year.same period of the previous fiscal year.same period of the previous fiscal year.same period of the previous fiscal year.same period of the previous fiscal year.
・・・・・・・・Although the operating ratio of 94.6% did not quite reach the esAlthough the operating ratio of 94.6% did not quite reach the esAlthough the operating ratio of 94.6% did not quite reach the esAlthough the operating ratio of 94.6% did not quite reach the esAlthough the operating ratio of 94.6% did not quite reach the esAlthough the operating ratio of 94.6% did not quite reach the esAlthough the operating ratio of 94.6% did not quite reach the esAlthough the operating ratio of 94.6% did not quite reach the estimate of timate of timate of timate of timate of timate of timate of timate of 95.1% we made at the mid95.1% we made at the mid95.1% we made at the mid95.1% we made at the mid95.1% we made at the mid95.1% we made at the mid95.1% we made at the mid95.1% we made at the mid--------term, we were able to achieve operating hours of term, we were able to achieve operating hours of term, we were able to achieve operating hours of term, we were able to achieve operating hours of term, we were able to achieve operating hours of term, we were able to achieve operating hours of term, we were able to achieve operating hours of term, we were able to achieve operating hours of 9.25 hours per day which is above forecast of 9.15 hours per day9.25 hours per day which is above forecast of 9.15 hours per day9.25 hours per day which is above forecast of 9.15 hours per day9.25 hours per day which is above forecast of 9.15 hours per day9.25 hours per day which is above forecast of 9.15 hours per day9.25 hours per day which is above forecast of 9.15 hours per day9.25 hours per day which is above forecast of 9.15 hours per day9.25 hours per day which is above forecast of 9.15 hours per day, and , and , and , and , and , and , and , and accomplished the targeted revenue for the fiscal year.accomplished the targeted revenue for the fiscal year.accomplished the targeted revenue for the fiscal year.accomplished the targeted revenue for the fiscal year.accomplished the targeted revenue for the fiscal year.accomplished the targeted revenue for the fiscal year.accomplished the targeted revenue for the fiscal year.accomplished the targeted revenue for the fiscal year.
・・・・・・・・Also, operating ratio of Also, operating ratio of Also, operating ratio of Also, operating ratio of Also, operating ratio of Also, operating ratio of Also, operating ratio of Also, operating ratio of the newly graduated engineers advanced to 88% by the newly graduated engineers advanced to 88% by the newly graduated engineers advanced to 88% by the newly graduated engineers advanced to 88% by the newly graduated engineers advanced to 88% by the newly graduated engineers advanced to 88% by the newly graduated engineers advanced to 88% by the newly graduated engineers advanced to 88% by the end of the fiscal yearthe end of the fiscal yearthe end of the fiscal yearthe end of the fiscal yearthe end of the fiscal yearthe end of the fiscal yearthe end of the fiscal yearthe end of the fiscal year. . . . . . . .

Consolidated Operating ResultsConsolidated Operating ResultsConsolidated Operating ResultsConsolidated Operating ResultsFiscal year ended March 31, 2003Fiscal year ended March 31, 2003Fiscal year ended March 31, 2003Fiscal year ended March 31, 2003
Consolidated Operating ResultsConsolidated Operating ResultsConsolidated Operating ResultsConsolidated Operating ResultsConsolidated Operating ResultsConsolidated Operating ResultsConsolidated Operating ResultsConsolidated Operating ResultsFiscal year ended March 31, 2003Fiscal year ended March 31, 2003Fiscal year ended March 31, 2003Fiscal year ended March 31, 2003Fiscal year ended March 31, 2003Fiscal year ended March 31, 2003Fiscal year ended March 31, 2003Fiscal year ended March 31, 2003
33333333
(Millions of Yen)(Millions of Yen)(Millions of Yen)(Millions of Yen)
Net SalesNet SalesNet SalesNet SalesOperatingOperatingOperatingOperatingIncomeIncomeIncomeIncome
OrdinaryOrdinaryOrdinaryOrdinaryIncomeIncomeIncomeIncome
Net IncomeNet IncomeNet IncomeNet Income
2003200320032003 31,88831,88831,88831,888 4,1794,1794,1794,179 4,1984,1984,1984,198 2,2342,2342,2342,234
2002200220022002 32,95032,95032,95032,950 5,3485,3485,3485,348 5,4355,4355,4355,435 3,1403,1403,1403,140
Change(%)Change(%)Change(%)Change(%) -3.2%-3.2%-3.2%-3.2% -21.9%-21.9%-21.9%-21.9% -22.8%-22.8%-22.8%-22.8% -28.8%-28.8%-28.8%-28.8%
2003200320032003 65,73765,73765,73765,737 9,1489,1489,1489,148 9,1799,1799,1799,179 5,4725,4725,4725,472
Initial ForecastInitial ForecastInitial ForecastInitial Forecast 66,50066,50066,50066,500 10,10010,10010,10010,100 10,10010,10010,10010,100 4,9004,9004,9004,900
v.s .Initial Forecastv.s .Initial Forecastv.s .Initial Forecastv.s .Initial Forecast -1.1%-1.1%-1.1%-1.1% -9.4%-9.4%-9.4%-9.4% -9.1%-9.1%-9.1%-9.1% 11.7%11.7%11.7%11.7%
2002200220022002 64,99764,99764,99764,997 10,19310,19310,19310,193 10,32110,32110,32110,321 5,3095,3095,3095,309
Change(%)Change(%)Change(%)Change(%) 1.1%1.1%1.1%1.1% -10.2%-10.2%-10.2%-10.2% -11.1%-11.1%-11.1%-11.1% 3.1%3.1%3.1%3.1%
InterimInterimInterimInterimPeriodPeriodPeriodPeriod
FiscalFiscalFiscalFiscalYearYearYearYear
������������������������������������������������������������������������������������������������������������������������������������������������������������������
����������������������������������������������������������������������������������������������������������������������������������������������������������������������������������������������������������������������������������������������������������������������������������������������������
������������������������������������������������������������������������������������������������������������������������������������������������������������������
��������������������������������
44444444
Up to the fiscal year ended March 31, 2002, social insurance andUp to the fiscal year ended March 31, 2002, social insurance andUp to the fiscal year ended March 31, 2002, social insurance andUp to the fiscal year ended March 31, 2002, social insurance andUp to the fiscal year ended March 31, 2002, social insurance andUp to the fiscal year ended March 31, 2002, social insurance andUp to the fiscal year ended March 31, 2002, social insurance andUp to the fiscal year ended March 31, 2002, social insurance and other other other other other other other other payments related to unpaid bonuses were posted as expenses at thpayments related to unpaid bonuses were posted as expenses at thpayments related to unpaid bonuses were posted as expenses at thpayments related to unpaid bonuses were posted as expenses at thpayments related to unpaid bonuses were posted as expenses at thpayments related to unpaid bonuses were posted as expenses at thpayments related to unpaid bonuses were posted as expenses at thpayments related to unpaid bonuses were posted as expenses at the time of e time of e time of e time of e time of e time of e time of e time of actual payments.actual payments.actual payments.actual payments.actual payments.actual payments.actual payments.actual payments.
But because of the importance of But because of the importance of But because of the importance of But because of the importance of But because of the importance of But because of the importance of But because of the importance of But because of the importance of such unpaid expenses became greater as the such unpaid expenses became greater as the such unpaid expenses became greater as the such unpaid expenses became greater as the such unpaid expenses became greater as the such unpaid expenses became greater as the such unpaid expenses became greater as the such unpaid expenses became greater as the new social insurance system of applying same insurance rate to tnew social insurance system of applying same insurance rate to tnew social insurance system of applying same insurance rate to tnew social insurance system of applying same insurance rate to tnew social insurance system of applying same insurance rate to tnew social insurance system of applying same insurance rate to tnew social insurance system of applying same insurance rate to tnew social insurance system of applying same insurance rate to the bonus was he bonus was he bonus was he bonus was he bonus was he bonus was he bonus was he bonus was introduced from this year,introduced from this year,introduced from this year,introduced from this year,introduced from this year,introduced from this year,introduced from this year,introduced from this year, it is now recorded as unpaid expenses from the fiscal it is now recorded as unpaid expenses from the fiscal it is now recorded as unpaid expenses from the fiscal it is now recorded as unpaid expenses from the fiscal it is now recorded as unpaid expenses from the fiscal it is now recorded as unpaid expenses from the fiscal it is now recorded as unpaid expenses from the fiscal it is now recorded as unpaid expenses from the fiscal year ended March 31, 2003. year ended March 31, 2003. year ended March 31, 2003. year ended March 31, 2003. year ended March 31, 2003. year ended March 31, 2003. year ended March 31, 2003. year ended March 31, 2003. As a result, compared with the previous accounting method, cost As a result, compared with the previous accounting method, cost As a result, compared with the previous accounting method, cost As a result, compared with the previous accounting method, cost As a result, compared with the previous accounting method, cost As a result, compared with the previous accounting method, cost As a result, compared with the previous accounting method, cost As a result, compared with the previous accounting method, cost of sales and of sales and of sales and of sales and of sales and of sales and of sales and of sales and selling, general and administrative expenses increased selling, general and administrative expenses increased selling, general and administrative expenses increased selling, general and administrative expenses increased selling, general and administrative expenses increased selling, general and administrative expenses increased selling, general and administrative expenses increased selling, general and administrative expenses increased ¥¥¥¥¥¥¥¥562 million and 562 million and 562 million and 562 million and 562 million and 562 million and 562 million and 562 million and ¥¥¥¥¥¥¥¥43 43 43 43 43 43 43 43 million, respectively.million, respectively.million, respectively.million, respectively.million, respectively.million, respectively.million, respectively.million, respectively.
Operating income, ordinary income and net income before taxes eaOperating income, ordinary income and net income before taxes eaOperating income, ordinary income and net income before taxes eaOperating income, ordinary income and net income before taxes eaOperating income, ordinary income and net income before taxes eaOperating income, ordinary income and net income before taxes eaOperating income, ordinary income and net income before taxes eaOperating income, ordinary income and net income before taxes each fell ch fell ch fell ch fell ch fell ch fell ch fell ch fell ¥¥¥¥¥¥¥¥606 606 606 606 606 606 606 606 million. Net income decreased million. Net income decreased million. Net income decreased million. Net income decreased million. Net income decreased million. Net income decreased million. Net income decreased million. Net income decreased ¥¥¥¥¥¥¥¥352 million. 352 million. 352 million. 352 million. 352 million. 352 million. 352 million. 352 million. ((((((((seeseeseeseeseeseeseesee Financial Results, Fiscal Year Ended March 31, 2003, page 15) Financial Results, Fiscal Year Ended March 31, 2003, page 15) Financial Results, Fiscal Year Ended March 31, 2003, page 15) Financial Results, Fiscal Year Ended March 31, 2003, page 15) Financial Results, Fiscal Year Ended March 31, 2003, page 15) Financial Results, Fiscal Year Ended March 31, 2003, page 15) Financial Results, Fiscal Year Ended March 31, 2003, page 15) Financial Results, Fiscal Year Ended March 31, 2003, page 15)
Notes to the Financial StatementNotes to the Financial StatementNotes to the Financial StatementNotes to the Financial StatementStatutory Welfare Expenses Applicable to the Unpaid BonusesStatutory Welfare Expenses Applicable to the Unpaid BonusesStatutory Welfare Expenses Applicable to the Unpaid BonusesStatutory Welfare Expenses Applicable to the Unpaid Bonuses
Fiscal year ended March 31, 2003 Fiscal year ended March 31, 2003 Fiscal year ended March 31, 2003 Fiscal year ended March 31, 2003
Notes to the Financial StatementNotes to the Financial StatementNotes to the Financial StatementNotes to the Financial StatementNotes to the Financial StatementNotes to the Financial StatementNotes to the Financial StatementNotes to the Financial StatementStatutory Welfare Expenses Applicable to the Unpaid BonusesStatutory Welfare Expenses Applicable to the Unpaid BonusesStatutory Welfare Expenses Applicable to the Unpaid BonusesStatutory Welfare Expenses Applicable to the Unpaid BonusesStatutory Welfare Expenses Applicable to the Unpaid BonusesStatutory Welfare Expenses Applicable to the Unpaid BonusesStatutory Welfare Expenses Applicable to the Unpaid BonusesStatutory Welfare Expenses Applicable to the Unpaid Bonuses
Fiscal year ended March 31, 2003 Fiscal year ended March 31, 2003 Fiscal year ended March 31, 2003 Fiscal year ended March 31, 2003 Fiscal year ended March 31, 2003 Fiscal year ended March 31, 2003 Fiscal year ended March 31, 2003 Fiscal year ended March 31, 2003
⇒⇒⇒⇒⇒⇒⇒⇒Consolidated results based on the previous accounting method :Consolidated results based on the previous accounting method :Consolidated results based on the previous accounting method :Consolidated results based on the previous accounting method :Consolidated results based on the previous accounting method :Consolidated results based on the previous accounting method :Consolidated results based on the previous accounting method :Consolidated results based on the previous accounting method :
Operating incomeOperating incomeOperating incomeOperating incomeOperating incomeOperating incomeOperating incomeOperating income ::::::::¥¥¥¥¥¥¥¥9,754 million 9,754 million 9,754 million 9,754 million 9,754 million 9,754 million 9,754 million 9,754 million Ordinary income Ordinary income Ordinary income Ordinary income Ordinary income Ordinary income Ordinary income Ordinary income ::::::::¥¥¥¥¥¥¥¥9,785 million 9,785 million 9,785 million 9,785 million 9,785 million 9,785 million 9,785 million 9,785 million Net incomeNet incomeNet incomeNet incomeNet incomeNet incomeNet incomeNet income ::::::::¥¥¥¥¥¥¥¥5,824 million 5,824 million 5,824 million 5,824 million 5,824 million 5,824 million 5,824 million 5,824 million

55555555
414414414414
485485485485
591591591591 608608608608577577577577
641641641641
49494949
657657657657649649649649
91919191101101101101
8282828263636363
99999999
41414141
101101101101113113113113
91919191103103103103848484849797979792929292
5858585838383838
114114114114
545454545353535317171717 25252525 37373737 35353535 40404040
13.9%13.9%13.9%13.9%
8.3%8.3%8.3%8.3%
15.9%15.9%15.9%15.9%
9.2%9.2%9.2%9.2%
12.0%12.0%12.0%12.0%
15.6%15.6%15.6%15.6% 16.0%16.0%16.0%16.0%14.5%14.5%14.5%14.5%
17.8%17.8%17.8%17.8%
8.2%8.2%8.2%8.2%
4.1%4.1%4.1%4.1%5.1%5.1%5.1%5.1%
6.3%6.3%6.3%6.3% 5.8%5.8%5.8%5.8%7.0%7.0%7.0%7.0%
7.7%7.7%7.7%7.7%
0000
100100100100
200200200200
300300300300
400400400400
500500500500
600600600600
700700700700
1996199619961996 1997199719971997 1998199819981998 1999199919991999 2000200020002000 2001200120012001 2002200220022002 20032003200320030%0%0%0%
5%5%5%5%
10%10%10%10%
15%15%15%15%
20%20%20%20%
25%25%25%25%
Net SalesNet SalesNet SalesNet Sales Operat ing Income Operat ing Income Operat ing Income Operat ing Income Ordinary Income Ordinary Income Ordinary Income Ordinary Income
Net IncomeNet IncomeNet IncomeNet Income Ordinary Pro fit Margins Ordinary Pro fit Margins Ordinary Pro fit Margins Ordinary Pro fit Margins Net Margins Net Margins Net Margins Net Margins
(100 million Yen)(100 million Yen)(100 million Yen)(100 million Yen)
Consolidated Operating ResultsConsolidated Operating ResultsConsolidated Operating ResultsConsolidated Operating ResultsFiscal year ended March 31, 2003Fiscal year ended March 31, 2003Fiscal year ended March 31, 2003Fiscal year ended March 31, 2003
Consolidated Operating ResultsConsolidated Operating ResultsConsolidated Operating ResultsConsolidated Operating ResultsConsolidated Operating ResultsConsolidated Operating ResultsConsolidated Operating ResultsConsolidated Operating ResultsFiscal year ended March 31, 2003Fiscal year ended March 31, 2003Fiscal year ended March 31, 2003Fiscal year ended March 31, 2003Fiscal year ended March 31, 2003Fiscal year ended March 31, 2003Fiscal year ended March 31, 2003Fiscal year ended March 31, 2003
NonNonNonNon----Consolidated Operating ResultsConsolidated Operating ResultsConsolidated Operating ResultsConsolidated Operating ResultsFrom the Fiscal year ended March 31, 1996 to the Fiscal year endFrom the Fiscal year ended March 31, 1996 to the Fiscal year endFrom the Fiscal year ended March 31, 1996 to the Fiscal year endFrom the Fiscal year ended March 31, 1996 to the Fiscal year ended March 31, 2003ed March 31, 2003ed March 31, 2003ed March 31, 2003NonNonNonNonNonNonNonNon--------Consolidated Operating ResultsConsolidated Operating ResultsConsolidated Operating ResultsConsolidated Operating ResultsConsolidated Operating ResultsConsolidated Operating ResultsConsolidated Operating ResultsConsolidated Operating Results
From the Fiscal year ended March 31, 1996 to the Fiscal year endFrom the Fiscal year ended March 31, 1996 to the Fiscal year endFrom the Fiscal year ended March 31, 1996 to the Fiscal year endFrom the Fiscal year ended March 31, 1996 to the Fiscal year endFrom the Fiscal year ended March 31, 1996 to the Fiscal year endFrom the Fiscal year ended March 31, 1996 to the Fiscal year endFrom the Fiscal year ended March 31, 1996 to the Fiscal year endFrom the Fiscal year ended March 31, 1996 to the Fiscal year ended March 31, 2003ed March 31, 2003ed March 31, 2003ed March 31, 2003ed March 31, 2003ed March 31, 2003ed March 31, 2003ed March 31, 2003
66666666
(Millions of Yen)(Millions of Yen)(Millions of Yen)(Millions of Yen)
Net SalesNet SalesNet SalesNet SalesOperatingOperatingOperatingOperatingIncomeIncomeIncomeIncome
OrdinaryOrdinaryOrdinaryOrdinaryIncomeIncomeIncomeIncome
Net IncomeNet IncomeNet IncomeNet Income
2003200320032003 26,90126,90126,90126,901 3,7303,7303,7303,730 3,9413,9413,9413,941 2,1592,1592,1592,159
2002200220022002 28,25028,25028,25028,250 5,0055,0055,0055,005 5,1245,1245,1245,124 2,9882,9882,9882,988
Change(%)Change(%)Change(%)Change(%) -4.8%-4.8%-4.8%-4.8% -25.5%-25.5%-25.5%-25.5% -23.1%-23.1%-23.1%-23.1% -27.7%-27.7%-27.7%-27.7%
2003200320032003 55,37955,37955,37955,379 8,0278,0278,0278,027 8,2488,2488,2488,248 5,0175,0175,0175,017
Initial ForecastInitial ForecastInitial ForecastInitial Forecast 56,00056,00056,00056,000 9,0009,0009,0009,000 9,1009,1009,1009,100 4,4004,4004,4004,400
v.s .Initial Forecastv.s .Initial Forecastv.s .Initial Forecastv.s .Initial Forecast -1.1%-1.1%-1.1%-1.1% -10.8%-10.8%-10.8%-10.8% -9.4%-9.4%-9.4%-9.4% 14.0%14.0%14.0%14.0%
2002200220022002 55,63755,63755,63755,637 9,3119,3119,3119,311 9,4319,4319,4319,431 4,8224,8224,8224,822
Change(%)Change(%)Change(%)Change(%) -0.5%-0.5%-0.5%-0.5% -13.8%-13.8%-13.8%-13.8% -12.5%-12.5%-12.5%-12.5% 4.1%4.1%4.1%4.1%
InterimInterimInterimInterimPeriodPeriodPeriodPeriod
FiscalFiscalFiscalFiscalYearYearYearYear
������������������������������������������������������������������������������������������������������������������������������������������������������������������
������������������������������������������������������������������������������������������������������������������������������������������������������������������
����������������������������������������������������������������������������������������������������������������������������������������������������������������������������������������������������������������������������������������������������������������������������������������������������
��������������������������������

77777777
339339339339
395395395395
489489489489518518518518 508508508508
553553553553555555555555 556556556556
808080809393939377777777
5858585894949494
37373737
98989898104104104104
8282828294949494787878789494949488888888
5454545435353535
106106106106
48484848 505050504848484815151515 22222222
35353535 32323232 37373737
14 .8%14 .8%14 .8%14 .8%
17 .0%17 .0%17 .0%17 .0%
10 .5%10 .5%10 .5%10 .5%
13 .6%13 .6%13 .6%13 .6%
18 .0%18 .0%18 .0%18 .0% 18 .2%18 .2%18 .2%18 .2%
15 .4%15 .4%15 .4%15 .4%
19 .0%19 .0%19 .0%19 .0%
9 .0%9 .0%9 .0%9 .0%8 .7%8 .7%8 .7%8 .7%
4 .4%4 .4%4 .4%4 .4%5 .6%5 .6%5 .6%5 .6%
7 .2%7 .2%7 .2%7 .2%6 .1%6 .1%6 .1%6 .1%
7 .3%7 .3%7 .3%7 .3%8 .6%8 .6%8 .6%8 .6%
0000
100100100100
200200200200
300300300300
400400400400
500500500500
600600600600
1996199619961996 1997199719971997 1998199819981998 1999199919991999 2000200020002000 2001200120012001 2002200220022002 20032003200320030%0%0%0%
5%5%5%5%
10%10%10%10%
15%15%15%15%
20%20%20%20%
25%25%25%25%
Net Sa lesNet Sa lesNet Sa lesNet Sa les Operat i ng Income Operat i ng Income Operat i ng Income Operat i ng Income Ordinary Income Ordinary Income Ordinary Income Ordinary Income
Net IncomeNet IncomeNet IncomeNet Income Ordinary Prof i t Marg ins Ordinary Prof i t Marg ins Ordinary Prof i t Marg ins Ordinary Prof i t Marg ins Net Margi ns Net Margi ns Net Margi ns Net Margi ns
(100 m i l l i on Yen)(100 m i l l i on Yen)(100 m i l l i on Yen)(100 m i l l i on Yen)
NonNonNonNon----Consolidated Operating ResultsConsolidated Operating ResultsConsolidated Operating ResultsConsolidated Operating ResultsFrom the Fiscal year ended March 31, 1996 to the Fiscal year endFrom the Fiscal year ended March 31, 1996 to the Fiscal year endFrom the Fiscal year ended March 31, 1996 to the Fiscal year endFrom the Fiscal year ended March 31, 1996 to the Fiscal year ended March 31, 2003ed March 31, 2003ed March 31, 2003ed March 31, 2003NonNonNonNonNonNonNonNon--------Consolidated Operating ResultsConsolidated Operating ResultsConsolidated Operating ResultsConsolidated Operating ResultsConsolidated Operating ResultsConsolidated Operating ResultsConsolidated Operating ResultsConsolidated Operating Results
From the Fiscal year ended March 31, 1996 to the Fiscal year endFrom the Fiscal year ended March 31, 1996 to the Fiscal year endFrom the Fiscal year ended March 31, 1996 to the Fiscal year endFrom the Fiscal year ended March 31, 1996 to the Fiscal year endFrom the Fiscal year ended March 31, 1996 to the Fiscal year endFrom the Fiscal year ended March 31, 1996 to the Fiscal year endFrom the Fiscal year ended March 31, 1996 to the Fiscal year endFrom the Fiscal year ended March 31, 1996 to the Fiscal year ended March 31, 2003ed March 31, 2003ed March 31, 2003ed March 31, 2003ed March 31, 2003ed March 31, 2003ed March 31, 2003ed March 31, 2003
Return on Equity (ROE)Return on Equity (ROE)Return on Equity (ROE)Return on Equity (ROE)From the Fiscal year ended March 31, 1994 to the Fiscal year endFrom the Fiscal year ended March 31, 1994 to the Fiscal year endFrom the Fiscal year ended March 31, 1994 to the Fiscal year endFrom the Fiscal year ended March 31, 1994 to the Fiscal year ended March 31, 2003ed March 31, 2003ed March 31, 2003ed March 31, 2003
Return on Equity (ROE)Return on Equity (ROE)Return on Equity (ROE)Return on Equity (ROE)Return on Equity (ROE)Return on Equity (ROE)Return on Equity (ROE)Return on Equity (ROE)From the Fiscal year ended March 31, 1994 to the Fiscal year endFrom the Fiscal year ended March 31, 1994 to the Fiscal year endFrom the Fiscal year ended March 31, 1994 to the Fiscal year endFrom the Fiscal year ended March 31, 1994 to the Fiscal year endFrom the Fiscal year ended March 31, 1994 to the Fiscal year endFrom the Fiscal year ended March 31, 1994 to the Fiscal year endFrom the Fiscal year ended March 31, 1994 to the Fiscal year endFrom the Fiscal year ended March 31, 1994 to the Fiscal year ended March 31, 2003ed March 31, 2003ed March 31, 2003ed March 31, 2003ed March 31, 2003ed March 31, 2003ed March 31, 2003ed March 31, 2003
88888888
11.7%11.7%11.7%11.7%10.4%10.4%10.4%10.4%
8.2%8.2%8.2%8.2%
4.5%4.5%4.5%4.5% 4.7%4.7%4.7%4.7%
6.1%6.1%6.1%6.1%
8.6%8.6%8.6%8.6%7.3%7.3%7.3%7.3%
4.6%4.6%4.6%4.6%
10.0%10.0%10.0%10.0%
12.1%12.1%12.1%12.1%11.2%11.2%11.2%11.2%
8.7%8.7%8.7%8.7%
2.3%2.3%2.3%2.3%
8.0%8.0%8.0%8.0%9.1%9.1%9.1%9.1%
6.8%6.8%6.8%6.8%5.4%5.4%5.4%5.4%
4.9%4.9%4.9%4.9%
10.2%10.2%10.2%10.2%
0%0%0%0%
2%2%2%2%
4%4%4%4%
6%6%6%6%
8%8%8%8%
10%10%10%10%
12%12%12%12%
14%14%14%14%
1 99 41 99 41 99 41 99 4 1 99 51 99 51 99 51 99 5 1 99 61 99 61 99 61 99 6 1 99 71 99 71 99 71 99 7 1 99 81 99 81 99 81 99 8 1 99 91 99 91 99 91 99 9 2 00 02 00 02 00 02 00 0 2 00 12 00 12 00 12 00 1 2 00 22 00 22 00 22 00 2 2 00 32 00 32 00 32 00 3
Non-ConsolidatedNon-ConsolidatedNon-ConsolidatedNon-Consolidated
Consol idatedConsol idatedConsol idatedConsol idated

Key Factor in Operation <NonKey Factor in Operation <NonKey Factor in Operation <NonKey Factor in Operation <Non----Consolidated>Consolidated>Consolidated>Consolidated>Fiscal year ended March 31, 2003 Fiscal year ended March 31, 2003 Fiscal year ended March 31, 2003 Fiscal year ended March 31, 2003
Key Factor in Operation <NonKey Factor in Operation <NonKey Factor in Operation <NonKey Factor in Operation <NonKey Factor in Operation <NonKey Factor in Operation <NonKey Factor in Operation <NonKey Factor in Operation <Non--------Consolidated>Consolidated>Consolidated>Consolidated>Consolidated>Consolidated>Consolidated>Consolidated>Fiscal year ended March 31, 2003 Fiscal year ended March 31, 2003 Fiscal year ended March 31, 2003 Fiscal year ended March 31, 2003 Fiscal year ended March 31, 2003 Fiscal year ended March 31, 2003 Fiscal year ended March 31, 2003 Fiscal year ended March 31, 2003
99999999
11111111. . . . . . . . EngineerEngineerEngineerEngineerEngineerEngineerEngineerEngineer’’s Operating Ratio s Operating Ratio s Operating Ratio s Operating Ratio s Operating Ratio s Operating Ratio s Operating Ratio s Operating Ratio (average for the fiscal year)(average for the fiscal year)(average for the fiscal year)(average for the fiscal year)(average for the fiscal year)(average for the fiscal year)(average for the fiscal year)(average for the fiscal year)
・・・・・・・・ Average engineerAverage engineerAverage engineerAverage engineerAverage engineerAverage engineerAverage engineerAverage engineer’’s utilization ratio for the fiscal year was s utilization ratio for the fiscal year was s utilization ratio for the fiscal year was s utilization ratio for the fiscal year was s utilization ratio for the fiscal year was s utilization ratio for the fiscal year was s utilization ratio for the fiscal year was s utilization ratio for the fiscal year was 91.6%91.6%91.6%91.6%91.6%91.6%91.6%91.6%. . . . . . . .
This was slightly less than forecasted This was slightly less than forecasted This was slightly less than forecasted This was slightly less than forecasted This was slightly less than forecasted This was slightly less than forecasted This was slightly less than forecasted This was slightly less than forecasted 91.7%91.7%91.7%91.7%91.7%91.7%91.7%91.7%........
******** By the end of fiscal year, the ratio improved to 97.1% from 85.By the end of fiscal year, the ratio improved to 97.1% from 85.By the end of fiscal year, the ratio improved to 97.1% from 85.By the end of fiscal year, the ratio improved to 97.1% from 85.By the end of fiscal year, the ratio improved to 97.1% from 85.By the end of fiscal year, the ratio improved to 97.1% from 85.By the end of fiscal year, the ratio improved to 97.1% from 85.By the end of fiscal year, the ratio improved to 97.1% from 85.4% at 4% at 4% at 4% at 4% at 4% at 4% at 4% at
the end of April 2002.the end of April 2002.the end of April 2002.the end of April 2002.the end of April 2002.the end of April 2002.the end of April 2002.the end of April 2002.
22222222. . . . . . . . Operating Hours Operating Hours Operating Hours Operating Hours Operating Hours Operating Hours Operating Hours Operating Hours (average for the fiscal year)(average for the fiscal year)(average for the fiscal year)(average for the fiscal year)(average for the fiscal year)(average for the fiscal year)(average for the fiscal year)(average for the fiscal year)
・・・・・・・・Average operating hours for the fiscal year was Average operating hours for the fiscal year was Average operating hours for the fiscal year was Average operating hours for the fiscal year was Average operating hours for the fiscal year was Average operating hours for the fiscal year was Average operating hours for the fiscal year was Average operating hours for the fiscal year was 9.189.189.189.189.189.189.189.18 hours per dayhours per dayhours per dayhours per dayhours per dayhours per dayhours per dayhours per daywhere it was where it was where it was where it was where it was where it was where it was where it was 9.109.109.109.109.109.109.109.10 hours per dayhours per dayhours per dayhours per dayhours per dayhours per dayhours per dayhours per day for the previous fiscal year. for the previous fiscal year. for the previous fiscal year. for the previous fiscal year. for the previous fiscal year. for the previous fiscal year. for the previous fiscal year. for the previous fiscal year.
********Average for the second half of the fiscal year was Average for the second half of the fiscal year was Average for the second half of the fiscal year was Average for the second half of the fiscal year was Average for the second half of the fiscal year was Average for the second half of the fiscal year was Average for the second half of the fiscal year was Average for the second half of the fiscal year was 9.25 hours per day9.25 hours per day9.25 hours per day9.25 hours per day9.25 hours per day9.25 hours per day9.25 hours per day9.25 hours per day. . . . . . . .
33333333. . . . . . . . Rate RevisionRate RevisionRate RevisionRate RevisionRate RevisionRate RevisionRate RevisionRate Revision ・・・・・・・・ Price per hour was improved for Price per hour was improved for Price per hour was improved for Price per hour was improved for Price per hour was improved for Price per hour was improved for Price per hour was improved for Price per hour was improved for 0.96% 0.96% 0.96% 0.96% 0.96% 0.96% 0.96% 0.96% compared to the previous fiscal year. compared to the previous fiscal year. compared to the previous fiscal year. compared to the previous fiscal year. compared to the previous fiscal year. compared to the previous fiscal year. compared to the previous fiscal year. compared to the previous fiscal year.
Consolidated Operating ResultsConsolidated Operating ResultsConsolidated Operating ResultsConsolidated Operating ResultsFiscal year ended March 31, 2003 Fiscal year ended March 31, 2003 Fiscal year ended March 31, 2003 Fiscal year ended March 31, 2003
Consolidated Operating ResultsConsolidated Operating ResultsConsolidated Operating ResultsConsolidated Operating ResultsConsolidated Operating ResultsConsolidated Operating ResultsConsolidated Operating ResultsConsolidated Operating ResultsFiscal year ended March 31, 2003 Fiscal year ended March 31, 2003 Fiscal year ended March 31, 2003 Fiscal year ended March 31, 2003 Fiscal year ended March 31, 2003 Fiscal year ended March 31, 2003 Fiscal year ended March 31, 2003 Fiscal year ended March 31, 2003
1010101010101010
(Millions of Yen)(Millions of Yen)(Millions of Yen)(Millions of Yen)
Net SalesNet SalesNet SalesNet SalesOperatingOperatingOperatingOperatingIncomeIncomeIncomeIncome
OrdinaryOrdinaryOrdinaryOrdinaryIncomeIncomeIncomeIncome
Net IncomeNet IncomeNet IncomeNet Income
MeitecMeitecMeitecMeitec 55,37955,37955,37955,379 8,0278,0278,0278,027 8,2488,2488,2488,248 5,0175,0175,0175,017
Japan OutsourcingJapan OutsourcingJapan OutsourcingJapan Outsourcing 7,6007,6007,6007,600 993993993993 1,0001,0001,0001,000 572572572572
Japan CastJapan CastJapan CastJapan Cast 2,4882,4882,4882,488 94949494 94949494 54545454
3D Tec3D Tec3D Tec3D Tec 196196196196 -9-9-9-9 -3-3-3-3 -3-3-3-3
IMSIMSIMSIMS 291291291291 -3-3-3-3 3333 0000
MeiServiceMeiServiceMeiServiceMeiService 242242242242 12121212 13131313 8888
ConsolidatedConsolidatedConsolidatedConsolidated 65,73765,73765,73765,737 9,1489,1489,1489,148 9,1799,1799,1799,179 5,4725,4725,4725,472
※ Figures for the each companies are consolidated basis.※ Figures for the each companies are consolidated basis.※ Figures for the each companies are consolidated basis.※ Figures for the each companies are consolidated basis.
FiscalFiscalFiscalFiscalYearYearYearYear
����������������������������������������������������������������������������������������������������������������������������
����������������������������������������������������������������������������������������������������������������������������
����������������������������������������������������������������������������������������������������������������������������
������������������������������������������������������������������������������������������������������������������������������������������������������������������������������������������������������������������������������������������������������������������������������������
����������������������������
����������������������������
����������������������������
����������������������������

Growth in Group RevenueGrowth in Group RevenueGrowth in Group RevenueGrowth in Group RevenueFiscal year ended March 31, 2003 Fiscal year ended March 31, 2003 Fiscal year ended March 31, 2003 Fiscal year ended March 31, 2003
Growth in Group RevenueGrowth in Group RevenueGrowth in Group RevenueGrowth in Group RevenueGrowth in Group RevenueGrowth in Group RevenueGrowth in Group RevenueGrowth in Group RevenueFiscal year ended March 31, 2003 Fiscal year ended March 31, 2003 Fiscal year ended March 31, 2003 Fiscal year ended March 31, 2003 Fiscal year ended March 31, 2003 Fiscal year ended March 31, 2003 Fiscal year ended March 31, 2003 Fiscal year ended March 31, 2003
※※※※※※※※Amounts are nonAmounts are nonAmounts are nonAmounts are nonAmounts are nonAmounts are nonAmounts are nonAmounts are non--------consolidated basisconsolidated basisconsolidated basisconsolidated basisconsolidated basisconsolidated basisconsolidated basisconsolidated basis
Fisc al Year 2 001Fisc al Year 2 001Fisc al Year 2 001Fisc al Year 2 001 Fisc al Year 2 003Fisc al Year 2 003Fisc al Year 2 003Fisc al Year 2 003 ChangeChangeChangeChange Change(% )Change(% )Change(% )Change(% )
Me i t ecMei t ecMei t ecMei t ec 555 .45 55 .45 55 .45 55 .4 5 53 .75 53 .75 53 .75 53 .7 - 1 .6- 1 .6- 1 .6- 1 .6 - 0 .3%-0 .3%-0 .3%-0 .3%
JO+JC+3D tec+IMS ※JO+JC+3D tec+IMS ※JO+JC+3D tec+IMS ※JO+JC+3D tec+IMS ※ 85 .78 5 .78 5 .78 5 .7 1 05 .71 05 .71 05 .71 05 .7 2 0 .02 0 .02 0 .02 0 .0 2 3 .3%23 .3%23 .3%23 .3%
Conso l idate d Net Sale sConso l idate d Net Sale sConso l idate d Net Sale sConso l idate d Net Sale s 640 .76 40 .76 40 .76 40 .7 6 57 .36 57 .36 57 .36 57 .3 1 6 .61 6 .61 6 .61 6 .6 2 .6 %2 .6 %2 .6 %2 .6 %
Rat io o f (JO+JC +3DTe c+IMS )R at io o f (JO+JC +3DTe c+IMS )R at io o f (JO+JC +3DTe c+IMS )R at io o f (JO+JC +3DTe c+IMS )
to Co nso l idate d Ne t Sa le sto Co nso l idate d Ne t Sa le sto Co nso l idate d Ne t Sa le sto Co nso l idate d Ne t Sa le s1 3 .4%13 .4%13 .4%13 .4% 16 .0%16 .0%16 .0%16 .0% 2 .6 %2 .6 %2 .6 %2 .6 % ----
��������������������������������������������������������������������������������������������������������������������������������������������������������������������������������
1111111111111111
MeitecMeitecMeitecMeitecMeitecMeitecMeitecMeitec86.686.686.686.686.686.686.686.6%%%%%%%%
JO+JC+JO+JC+JO+JC+JO+JC+JO+JC+JO+JC+JO+JC+JO+JC+3D3D3D3D3D3D3D3D tectectectectectectectec13.413.413.413.413.413.413.413.4%%%%%%%%
Fiscal Year 2001Fiscal Year 2001Fiscal Year 2001Fiscal Year 2001Fiscal Year 2001Fiscal Year 2001Fiscal Year 2001Fiscal Year 2001
MeitecMeitecMeitecMeitecMeitecMeitecMeitecMeitec84.084.084.084.084.084.084.084.0%%%%%%%%
JO+JC+JO+JC+JO+JC+JO+JC+JO+JC+JO+JC+JO+JC+JO+JC+3D 3D 3D 3D 3D 3D 3D 3D tectectectectectectectec+IMS+IMS+IMS+IMS+IMS+IMS+IMS+IMS
16.016.016.016.016.016.016.016.0%%%%%%%%
Fiscal Year 2003Fiscal Year 2003Fiscal Year 2003Fiscal Year 2003Fiscal Year 2003Fiscal Year 2003Fiscal Year 2003Fiscal Year 2003((((Millions of Yen)Millions of Yen)Millions of Yen)Millions of Yen)
NonNonNonNon----Consolidated SG&A Expenses and Cost of Sales,Consolidated SG&A Expenses and Cost of Sales,Consolidated SG&A Expenses and Cost of Sales,Consolidated SG&A Expenses and Cost of Sales,and Their Ratio to the Salesand Their Ratio to the Salesand Their Ratio to the Salesand Their Ratio to the Sales
NonNonNonNonNonNonNonNon--------Consolidated SG&A Expenses and Cost of Sales,Consolidated SG&A Expenses and Cost of Sales,Consolidated SG&A Expenses and Cost of Sales,Consolidated SG&A Expenses and Cost of Sales,Consolidated SG&A Expenses and Cost of Sales,Consolidated SG&A Expenses and Cost of Sales,Consolidated SG&A Expenses and Cost of Sales,Consolidated SG&A Expenses and Cost of Sales,
and Their Ratio to the Salesand Their Ratio to the Salesand Their Ratio to the Salesand Their Ratio to the Salesand Their Ratio to the Salesand Their Ratio to the Salesand Their Ratio to the Salesand Their Ratio to the Sales
1212121212121212
73737373 85858585 86868686 76767676 76767676 75757575 71717171 70707070
229229229229252252252252
309309309309 344344344344 355355355355 376376376376 392392392392 403403403403
7777777780808080
98989898
5858585837373737
94949494
104104104104 93939393
12 .7%12 .7%12 .7%12 .7%15 .0%15 .0%15 .0%15 .0%14 .7%14 .7%14 .7%14 .7%17 .6%17 .6%17 .6%17 .6%21 .5%21 .5%21 .5%21 .5%21 .5%21 .5%21 .5%21 .5%
13 .6%13 .6%13 .6%13 .6%12 .8%12 .8%12 .8%12 .8%
73%73%73%73%70%70%70%70%66%66%66%66%63%63%63%63%64%64%64%64%
68%68%68%68% 68%68%68%68% 70%70%70%70%
86%86%86%86%85%85%85%85%85%85%85%85%
81%81%81%81% 81%81%81%81%89%89%89%89%
81%81%81%81% 83%83%83%83%
0000
100100100100
200200200200
300300300300
400400400400
500500500500
600600600600
19 96/ 319 96/ 319 96/ 319 96/ 3 19 97/ 319 97/ 319 97/ 319 97/ 3 19 98/ 319 98/ 319 98/ 319 98/ 3 19 99/ 319 99/ 319 99/ 319 99/ 3 20 00/ 320 00/ 320 00/ 320 00/ 3 20 01/ 320 01/ 320 01/ 320 01/ 3 20 02/ 320 02/ 320 02/ 320 02/ 3 20 03/ 320 03/ 320 03/ 320 03/ 3
0%0%0%0%
10%10%10%10%
20%20%20%20%
30%30%30%30%
40%40%40%40%
50%50%50%50%
60%60%60%60%
70%70%70%70%
80%80%80%80%
90%90%90%90%
100%100%100%100%
SG&A E xpensesSG&A E xpensesSG&A E xpensesSG&A E xpenses Cost of Sal esCost of Sal esCost of Sal esCost of Sal es
Operat i ng IncomeOperat i ng IncomeOperat i ng IncomeOperat i ng Income SG&A E xpenses t o Net Sal esSG&A E xpenses t o Net Sal esSG&A E xpenses t o Net Sal esSG&A E xpenses t o Net Sal esCost of Sal es to Net Sal esCost of Sal es to Net Sal esCost of Sal es to Net Sal esCost of Sal es to Net Sal es Cost of Sal es+SG&A E xpenses t o Net Sal esCost of Sal es+SG&A E xpenses t o Net Sal esCost of Sal es+SG&A E xpenses t o Net Sal esCost of Sal es+SG&A E xpenses t o Net Sal es
39 539 539 539 5
48 948 948 948 9 51 851 851 851 8 50 850 850 850 8
33 933 933 933 9
55 555 555 555 5 55 655 655 655 6 55 355 355 355 3((((Millions of YenMillions of YenMillions of YenMillions of Yen))))

Consolidated SG&A Expenses and Cost of Sales,Consolidated SG&A Expenses and Cost of Sales,Consolidated SG&A Expenses and Cost of Sales,Consolidated SG&A Expenses and Cost of Sales,and Their Ratio to the Salesand Their Ratio to the Salesand Their Ratio to the Salesand Their Ratio to the Sales
Consolidated SG&A Expenses and Cost of Sales,Consolidated SG&A Expenses and Cost of Sales,Consolidated SG&A Expenses and Cost of Sales,Consolidated SG&A Expenses and Cost of Sales,Consolidated SG&A Expenses and Cost of Sales,Consolidated SG&A Expenses and Cost of Sales,Consolidated SG&A Expenses and Cost of Sales,Consolidated SG&A Expenses and Cost of Sales,and Their Ratio to the Salesand Their Ratio to the Salesand Their Ratio to the Salesand Their Ratio to the Salesand Their Ratio to the Salesand Their Ratio to the Salesand Their Ratio to the Salesand Their Ratio to the Sales
1313131313131313
81818181 88888888 92929292 90909090 86868686 88888888 84848484 83838383
292292292292 327327327327391391391391 416416416416 409409409409 440440440440 464464464464 483483483483
82828282
91919191101101101101113113113113108108108108
4141414171717171
101101101101
12 .6%12 .6%12 .6%12 .6%12 .9%12 .9%12 .9%12 .9%13 .7%13 .7%13 .7%13 .7%19 .6%19 .6%19 .6%19 .6% 18 .1%18 .1%18 .1%18 .1% 15 .6%15 .6%15 .6%15 .6% 14 .9%14 .9%14 .9%14 .9% 14 .9%14 .9%14 .9%14 .9%
73%73%73%73%72%72%72%72%69%69%69%69%71%71%71%71% 67%67%67%67% 66%66%66%66% 68%68%68%68% 71%71%71%71%
86%86%86%86%84%84%84%84%82%82%82%82%90%90%90%90%
83%83%83%83%82%82%82%82%85%85%85%85% 86%86%86%86%
0000
100100100100
200200200200
300300300300
400400400400
500500500500
600600600600
700700700700
199 6/3199 6/3199 6/3199 6/3 199 7/3199 7/3199 7/3199 7/3 199 8/3199 8/3199 8/3199 8/3 199 9/3199 9/3199 9/3199 9/3 200 0/3200 0/3200 0/3200 0/3 200 1/3200 1/3200 1/3200 1/3 200 2/3200 2/3200 2/3200 2/3 200 3/3200 3/3200 3/3200 3/3
0%0%0%0%
20%20%20%20%
40%40%40%40%
60%60%60%60%
80%80%80%80%
100%100%100%100%
Co st o f S al e s t o Ne t Sal e sCo st o f S al e s t o Ne t Sal e sCo st o f S al e s t o Ne t Sal e sCo st o f S al e s t o Ne t Sal e s Co st o f S al e sCo st o f S al e sCo st o f S al e sCo st o f S al e s
S G& A E xpe n se s t o Ne t S al e sS G& A E xpe n se s t o Ne t S al e sS G& A E xpe n se s t o Ne t S al e sS G& A E xpe n se s t o Ne t S al e s S G& A E xpe n se s t o Ne t S al e sS G& A E xpe n se s t o Ne t S al e sS G& A E xpe n se s t o Ne t S al e sS G& A E xpe n se s t o Ne t S al e s
Co st o f S al e s t o Ne t Sal e sCo st o f S al e s t o Ne t Sal e sCo st o f S al e s t o Ne t Sal e sCo st o f S al e s t o Ne t Sal e s Co st o f S al e s+ SG& A E xpe n se s t o Ne t S al e sCo st o f S al e s+ SG& A E xpe n se s t o Ne t S al e sCo st o f S al e s+ SG& A E xpe n se s t o Ne t S al e sCo st o f S al e s+ SG& A E xpe n se s t o Ne t S al e s
4 8 54 8 54 8 54 8 5
5 9 15 9 15 9 15 9 1 6 0 86 0 86 0 86 0 8 5 7 75 7 75 7 75 7 7
4 1 44 1 44 1 44 1 4
6 4 16 4 16 4 16 4 1 6 4 96 4 96 4 96 4 9 6 5 76 5 76 5 76 5 7((((Millions of YenMillions of YenMillions of YenMillions of Yen))))
Capital Investments and DepreciationsCapital Investments and DepreciationsCapital Investments and DepreciationsCapital Investments and Depreciations <Non<Non<Non<Non----Consolidated>Consolidated>Consolidated>Consolidated>From the Fiscal year ended March 31, 1998 to the Fiscal year endFrom the Fiscal year ended March 31, 1998 to the Fiscal year endFrom the Fiscal year ended March 31, 1998 to the Fiscal year endFrom the Fiscal year ended March 31, 1998 to the Fiscal year ended March 31, 2003ed March 31, 2003ed March 31, 2003ed March 31, 2003
Capital Investments and DepreciationsCapital Investments and DepreciationsCapital Investments and DepreciationsCapital Investments and DepreciationsCapital Investments and DepreciationsCapital Investments and DepreciationsCapital Investments and DepreciationsCapital Investments and Depreciations <Non<Non<Non<Non<Non<Non<Non<Non--------Consolidated>Consolidated>Consolidated>Consolidated>Consolidated>Consolidated>Consolidated>Consolidated>From the Fiscal year ended March 31, 1998 to the Fiscal year endFrom the Fiscal year ended March 31, 1998 to the Fiscal year endFrom the Fiscal year ended March 31, 1998 to the Fiscal year endFrom the Fiscal year ended March 31, 1998 to the Fiscal year endFrom the Fiscal year ended March 31, 1998 to the Fiscal year endFrom the Fiscal year ended March 31, 1998 to the Fiscal year endFrom the Fiscal year ended March 31, 1998 to the Fiscal year endFrom the Fiscal year ended March 31, 1998 to the Fiscal year ended March 31, 2003ed March 31, 2003ed March 31, 2003ed March 31, 2003ed March 31, 2003ed March 31, 2003ed March 31, 2003ed March 31, 2003
1414141414141414
11.311.311.311.3
9.49.49.49.4
6.06.06.06.0
9.09.09.09.0
3.43.43.43.44.84.84.84.8
5.05.05.05.0
12.012.012.012.012.712.712.712.712.712.712.712.7
10.310.310.310.3
11.011.011.011.0
0000
4444
8888
12121212
16161616
1998199819981998 1999199919991999 2000200020002000 2001200120012001 2002200220022002 2003200320032003
Capita l InCapita l InCapita l InCapita l InDeprDeprDeprDepr
(100 Mmllion yen)(100 Mmllion yen)(100 Mmllion yen)(100 Mmllion yen)
Capital InvestmentCapital InvestmentCapital InvestmentCapital InvestmentDepreciationDepreciationDepreciationDepreciation

92.5%92.5%92.5%92.5%
94.7%94.7%94.7%94.7%93.9%93.9%93.9%93.9%
95.6%95.6%95.6%95.6%95.9%95.9%95.9%95.9%
88.7%88.7%88.7%88.7%
91.2%91.2%91.2%91.2% 86.7%86.7%86.7%86.7%
93.1%93.1%93.1%93.1%
93.7%93.7%93.7%93.7%
95.9%95.9%95.9%95.9%
90.5%90.5%90.5%90.5%
95.6%95.6%95.6%95.6%
96.8%96.8%96.8%96.8%
99.1%99.1%99.1%99.1%99.3%99.3%99.3%99.3%
94.7%94.7%94.7%94.7% 95.3%95.3%95.3%95.3%
88.6%88.6%88.6%88.6%
94.6%94.6%94.6%94.6%
75%
80%
85%
90%
95%
100%
98/04 98/07 98/10 99/01 99/04 99/07 99/10 00/01 00/04 00/07 00/10 01/01 01/04 01/07 01/10 02/01 02/04 02/07 02/10 03/01
QuartQuartQuartQuart Operating Ratio,excluding new employeesOperating Ratio,excluding new employeesOperating Ratio,excluding new employeesOperating Ratio,excluding new employees Companywide Operating RatioCompanywide Operating RatioCompanywide Operating RatioCompanywide Operating Ratio
Operating Ratio <NonOperating Ratio <NonOperating Ratio <NonOperating Ratio <Non----Consolidated>Consolidated>Consolidated>Consolidated>Operating Ratio <NonOperating Ratio <NonOperating Ratio <NonOperating Ratio <NonOperating Ratio <NonOperating Ratio <NonOperating Ratio <NonOperating Ratio <Non--------Consolidated>Consolidated>Consolidated>Consolidated>Consolidated>Consolidated>Consolidated>Consolidated>
1515151515151515
Restructuring Restructuring Restructuring Restructuring periods periods periods periods
by customersby customersby customersby customers
Restructuring Restructuring Restructuring Restructuring periods periods periods periods
by customersby customersby customersby customers
Quarter Period AverageQuarter Period AverageQuarter Period AverageQuarter Period Average
Fiscal Year Ended Fiscal Year Ended Fiscal Year Ended Fiscal Year Ended March 31,1999March 31,1999March 31,1999March 31,1999
Fiscal Year EndedFiscal Year EndedFiscal Year EndedFiscal Year EndedMarch 31,2001March 31,2001March 31,2001March 31,2001
Fiscal Year EndedFiscal Year EndedFiscal Year EndedFiscal Year EndedMarch 31,2002March 31,2002March 31,2002March 31,2002
Fiscal Year EndedFiscal Year EndedFiscal Year EndedFiscal Year EndedMarch 31,2003March 31,2003March 31,2003March 31,2003
Fiscal Year EndedFiscal Year EndedFiscal Year EndedFiscal Year EndedMarch 31,2000March 31,2000March 31,2000March 31,2000
****Operating ratio=Total hours in operation/(Total hours in operatiOperating ratio=Total hours in operation/(Total hours in operatiOperating ratio=Total hours in operation/(Total hours in operatiOperating ratio=Total hours in operation/(Total hours in operation+Total hours not in operation)on+Total hours not in operation)on+Total hours not in operation)on+Total hours not in operation)
Hours of Operations <NonHours of Operations <NonHours of Operations <NonHours of Operations <Non----Consolidated>Consolidated>Consolidated>Consolidated>Hours of Operations <NonHours of Operations <NonHours of Operations <NonHours of Operations <NonHours of Operations <NonHours of Operations <NonHours of Operations <NonHours of Operations <Non--------Consolidated>Consolidated>Consolidated>Consolidated>Consolidated>Consolidated>Consolidated>Consolidated>
1616161616161616
8.08.08.08.0
8.28.28.28.2
8.48.48.48.4
8.68.68.68.6
8.88.88.88.8
9.09.09.09.0
9.29.29.29.2
9.49.49.49.4
9.69.69.69.6
9.89.89.89.8
1995/041995/041995/041995/04 1996/041996/041996/041996/04 1997/041997/041997/041997/04 1998/041998/041998/041998/04 1999/041999/041999/041999/04 2000/042000/042000/042000/04 2001/042001/042001/042001/04 2002/042002/042002/042002/04
Hours
of
Opera
tions(H
/day
Hours
of
Opera
tions(H
/day
Hours
of
Opera
tions(H
/day
Hours
of
Opera
tions(H
/day
Average Hours of OperationsAverage Hours of OperationsAverage Hours of OperationsAverage Hours of Operations
Hours of OperationsHours of OperationsHours of OperationsHours of Operations
polynomial expression (Hours of Operations)polynomial expression (Hours of Operations)polynomial expression (Hours of Operations)polynomial expression (Hours of Operations)
Fiscal YearFiscal YearFiscal YearFiscal YearEnded MarchEnded MarchEnded MarchEnded March
31,200131,200131,200131,2001
Average Average Average Average ::::9.239.239.239.23HHHH
Fiscal YearFiscal YearFiscal YearFiscal YearEnded MarchEnded MarchEnded MarchEnded March
31,199631,199631,199631,1996
Average Average Average Average ::::9.049.049.049.04HHHH
Fiscal YearFiscal YearFiscal YearFiscal YearEnded MarchEnded MarchEnded MarchEnded March
31,199731,199731,199731,1997
Average Average Average Average ::::9.199.199.199.19HHHH
Fiscal YearFiscal YearFiscal YearFiscal YearEnded MarchEnded MarchEnded MarchEnded March
31,199831,199831,199831,1998
Average Average Average Average ::::9.349.349.349.34HHHH
Fiscal YearFiscal YearFiscal YearFiscal YearEnded MarchEnded MarchEnded MarchEnded March
31,199931,199931,199931,1999
Average Average Average Average ::::9.059.059.059.05HHHH
Fiscal YearFiscal YearFiscal YearFiscal YearEnded MarchEnded MarchEnded MarchEnded March
31,200031,200031,200031,2000
Average Average Average Average ::::9.069.069.069.06HHHH
Fiscal YearFiscal YearFiscal YearFiscal YearEnded MarchEnded MarchEnded MarchEnded March
31,200231,200231,200231,2002
Average Average Average Average ::::9.109.109.109.10HHHH
Fiscal YearFiscal YearFiscal YearFiscal YearEnded MarchEnded MarchEnded MarchEnded March
31,200331,200331,200331,2003
Average Average Average Average ::::9.189.189.189.18HHHH
( (((H/da
y)H
/da
y)H
/da
y)H
/da
y)

Trend in New Orders by the Month Trend in New Orders by the Month Trend in New Orders by the Month Trend in New Orders by the Month <Non<Non<Non<Non----Consolidated>Consolidated>Consolidated>Consolidated>
Trend in New Orders by the Month Trend in New Orders by the Month Trend in New Orders by the Month Trend in New Orders by the Month Trend in New Orders by the Month Trend in New Orders by the Month Trend in New Orders by the Month Trend in New Orders by the Month <Non<Non<Non<Non<Non<Non<Non<Non--------Consolidated>Consolidated>Consolidated>Consolidated>Consolidated>Consolidated>Consolidated>Consolidated>
1717171717171717
0000
50505050
100100100100
150150150150
200200200200
250250250250
300300300300
350350350350
400400400400
450450450450
4444 5555 6666 7777 8888 9999 101010101111111112121212 1111 2222 3333 4444 5555 6666 7777 8888 9999 101010101111111112121212 1111 2222 3333 4444 5555 6666 7777 8888 9999 101010101111111112121212 1111 2222 3333 4444 5555 6666 7777 8888 9999 101010101111111112121212 1111 2222 3333 4444
(Nomber of New Orders)(Nomber of New Orders)(Nomber of New Orders)(Nomber of New Orders)
0000
50505050
100100100100
150150150150
200200200200
250250250250
300300300300
350350350350
400400400400
450450450450
New OrdersNew OrdersNew OrdersNew Orders
Compared with the same month in the previous yearCompared with the same month in the previous yearCompared with the same month in the previous yearCompared with the same month in the previous year
‘99999999 ‘00000000 ‘01010101 ‘02020202
Compared withCompared withCompared withCompared withthe same month the same month the same month the same month in the previous in the previous in the previous in the previous year year year year (%)(%)(%)(%)
Trend in Average Rate <NonTrend in Average Rate <NonTrend in Average Rate <NonTrend in Average Rate <Non----Consolidate>Consolidate>Consolidate>Consolidate>From the Fiscal year ended March 31, 1997 to the Fiscal year endFrom the Fiscal year ended March 31, 1997 to the Fiscal year endFrom the Fiscal year ended March 31, 1997 to the Fiscal year endFrom the Fiscal year ended March 31, 1997 to the Fiscal year ended March 31, 2003ed March 31, 2003ed March 31, 2003ed March 31, 2003
Trend in Average Rate <NonTrend in Average Rate <NonTrend in Average Rate <NonTrend in Average Rate <NonTrend in Average Rate <NonTrend in Average Rate <NonTrend in Average Rate <NonTrend in Average Rate <Non--------Consolidate>Consolidate>Consolidate>Consolidate>Consolidate>Consolidate>Consolidate>Consolidate>From the Fiscal year ended March 31, 1997 to the Fiscal year endFrom the Fiscal year ended March 31, 1997 to the Fiscal year endFrom the Fiscal year ended March 31, 1997 to the Fiscal year endFrom the Fiscal year ended March 31, 1997 to the Fiscal year endFrom the Fiscal year ended March 31, 1997 to the Fiscal year endFrom the Fiscal year ended March 31, 1997 to the Fiscal year endFrom the Fiscal year ended March 31, 1997 to the Fiscal year endFrom the Fiscal year ended March 31, 1997 to the Fiscal year ended March 31, 2003ed March 31, 2003ed March 31, 2003ed March 31, 2003ed March 31, 2003ed March 31, 2003ed March 31, 2003ed March 31, 2003
4,6304,6304,6304,630 4,6524,6524,6524,652 4,6674,6674,6674,667 4,6074,6074,6074,607 4,6824,6824,6824,682 4,7194,7194,7194,719 4,7004,7004,7004,700
3 ,0003 ,0003 ,0003 ,000
3 ,5003 ,5003 ,5003 ,500
4 ,0004 ,0004 ,0004 ,000
4 ,5004 ,5004 ,5004 ,500
5 ,0005 ,0005 ,0005 ,000
5 ,5005 ,5005 ,5005 ,500
6 ,0006 ,0006 ,0006 ,000
FiscalFiscalFiscalFiscal
19 97199719971997
FiscalFiscalFiscalFiscal
19 98199819981998
FiscalFiscalFiscalFiscal
19 99199919991999
FiscalFiscalFiscalFiscal
20 00200020002000
FiscalFiscalFiscalFiscal
20 01200120012001
FiscalFiscalFiscalFiscal
20 02200220022002
FiscalFiscalFiscalFiscal
20 03200320032003
RateRateRateRate
1818181818181818
((((YenYenYenYen))))

Trend in Number of SG&A Staff Trend in Number of SG&A Staff Trend in Number of SG&A Staff Trend in Number of SG&A Staff and Overhead Ratio <Nonand Overhead Ratio <Nonand Overhead Ratio <Nonand Overhead Ratio <Non----Consolidated>Consolidated>Consolidated>Consolidated>
From the Fiscal year ended March 31, 1997 to the Fiscal year endFrom the Fiscal year ended March 31, 1997 to the Fiscal year endFrom the Fiscal year ended March 31, 1997 to the Fiscal year endFrom the Fiscal year ended March 31, 1997 to the Fiscal year ended March 31, 2003 ed March 31, 2003 ed March 31, 2003 ed March 31, 2003
Trend in Number of SG&A Staff Trend in Number of SG&A Staff Trend in Number of SG&A Staff Trend in Number of SG&A Staff Trend in Number of SG&A Staff Trend in Number of SG&A Staff Trend in Number of SG&A Staff Trend in Number of SG&A Staff and Overhead Ratio <Nonand Overhead Ratio <Nonand Overhead Ratio <Nonand Overhead Ratio <Nonand Overhead Ratio <Nonand Overhead Ratio <Nonand Overhead Ratio <Nonand Overhead Ratio <Non--------Consolidated>Consolidated>Consolidated>Consolidated>Consolidated>Consolidated>Consolidated>Consolidated>
From the Fiscal year ended March 31, 1997 to the Fiscal year endFrom the Fiscal year ended March 31, 1997 to the Fiscal year endFrom the Fiscal year ended March 31, 1997 to the Fiscal year endFrom the Fiscal year ended March 31, 1997 to the Fiscal year endFrom the Fiscal year ended March 31, 1997 to the Fiscal year endFrom the Fiscal year ended March 31, 1997 to the Fiscal year endFrom the Fiscal year ended March 31, 1997 to the Fiscal year endFrom the Fiscal year ended March 31, 1997 to the Fiscal year ended March 31, 2003 ed March 31, 2003 ed March 31, 2003 ed March 31, 2003 ed March 31, 2003 ed March 31, 2003 ed March 31, 2003 ed March 31, 2003
1919191919191919
315315315315 341341341341 325325325325 344344344344 335335335335334334334334 335335335335
5,6815,6815,6815,6815,2975,2975,2975,2975,1655,1655,1655,165
4,7134,7134,7134,7133,8733,8733,8733,873
5,3505,3505,3505,350 5,5395,5395,5395,5395.6%5.6%5.6%5.6%5.9%5.9%5.9%5.9%5.9%5.9%5.9%5.9%
6.7%6.7%6.7%6.7%
7.5%7.5%7.5%7.5%
6.0%6.0%6.0%6.0% 5.7%5.7%5.7%5.7%
0000
1,0001,0001,0001,000
2,0002,0002,0002,000
3,0003,0003,0003,000
4,0004,0004,0004,000
5,0005,0005,0005,000
6,0006,0006,0006,000
7,0007,0007,0007,000
FY1997FY1997FY1997FY1997 FY1998FY1998FY1998FY1998 FY1999FY1999FY1999FY1999 FY2000FY2000FY2000FY2000 FY2001FY2001FY2001FY2001 FY2002FY2002FY2002FY2002 FY2003FY2003FY2003FY20030% 0% 0% 0%
2% 2% 2% 2%
4% 4% 4% 4%
6% 6% 6% 6%
8% 8% 8% 8%
10% 10% 10% 10%
12% 12% 12% 12%
14% 14% 14% 14%
Selling,general and administrative staff(SG&A)Selling,general and administrative staff(SG&A)Selling,general and administrative staff(SG&A)Selling,general and administrative staff(SG&A) EngineersEngineersEngineersEngineers SG&A ratioSG&A ratioSG&A ratioSG&A ratio
4,1884,1884,1884,188
5,0545,0545,0545,0545,4905,4905,4905,490
5,6315,6315,6315,631 5,6945,6945,6945,694 5,8745,8745,8745,874 6,0166,0166,0166,016
0000
20202020
40404040
60606060
80808080
100100100100
120120120120
140140140140
Auto
mob
ile/T
rans
portaion
Airc
raft/
Aero
spac
e
Indu
stria
l Mch
iner
y
Prec
ision
Equ
ipmen
t
IT R
elat
ed H
ardw
are
and De
vice
s
Elec
tric and
Elect
ronics
Semicon
duct
or and
Inte
grat
ed C
ircuits
Des
ign
Semicon
duct
or E
quipmen
t an
d De
vice
s
Info
rmat
ion
Proc
essin
g/So
ftwar
ePl
ant
Con
stru
ction
Oth
er
1997/3 1998/3 1999/3 2000/3 2001/3 2002/3 2003/3
Comparison of Sales Trend by the Industrial Comparison of Sales Trend by the Industrial Comparison of Sales Trend by the Industrial Comparison of Sales Trend by the Industrial Segments <NonSegments <NonSegments <NonSegments <Non----Consolidated>Consolidated>Consolidated>Consolidated>
Comparison of Sales Trend by the Industrial Comparison of Sales Trend by the Industrial Comparison of Sales Trend by the Industrial Comparison of Sales Trend by the Industrial Comparison of Sales Trend by the Industrial Comparison of Sales Trend by the Industrial Comparison of Sales Trend by the Industrial Comparison of Sales Trend by the Industrial Segments <NonSegments <NonSegments <NonSegments <NonSegments <NonSegments <NonSegments <NonSegments <Non--------Consolidated>Consolidated>Consolidated>Consolidated>Consolidated>Consolidated>Consolidated>Consolidated>
2020202020202020
( (((100
100
100
100
Mill
ion Y
enM
illio
n Y
enM
illio
n Y
enM
illio
n Y
en) )))

Sales at the Interim Period by the Industrial Sales at the Interim Period by the Industrial Sales at the Interim Period by the Industrial Sales at the Interim Period by the Industrial Segments <NonSegments <NonSegments <NonSegments <Non----Consolidated>Consolidated>Consolidated>Consolidated>
Sales at the Interim Period by the Industrial Sales at the Interim Period by the Industrial Sales at the Interim Period by the Industrial Sales at the Interim Period by the Industrial Sales at the Interim Period by the Industrial Sales at the Interim Period by the Industrial Sales at the Interim Period by the Industrial Sales at the Interim Period by the Industrial Segments <NonSegments <NonSegments <NonSegments <NonSegments <NonSegments <NonSegments <NonSegments <Non--------Consolidated>Consolidated>Consolidated>Consolidated>Consolidated>Consolidated>Consolidated>Consolidated>
2121212121212121
FiscalFiscalFiscalFiscal2000200020002000
FiscalFiscalFiscalFiscal2001200120012001
FiscalFiscalFiscalFiscal2002200220022002
NetNetNetNetSalesSalesSalesSales
Total NetTotal NetTotal NetTotal NetSales(%)Sales(%)Sales(%)Sales(%)
ChangChangChangChangeeee
Automobile/Transpor tat ionAutomobile/Transpor tat ionAutomobile/Transpor tat ionAutomobile/Transpor tat ion 8 ,5018 ,5018 ,5018 ,501 9 ,4649 ,4649 ,4649 ,464 10 ,90410 ,90410 ,90410 ,904 12 ,09012 ,09012 ,09012 ,090 21 .8% 21 .8% 21 .8% 21 .8% 1 ,1851 ,1851 ,1851 ,185 +10 .9%+10 .9%+10 .9%+10 .9% ↑↑↑↑
Aircraft/AerospaceAi rcraft/AerospaceAi rcraft/AerospaceAi rcraft/Aerospace 4 ,4174 ,4174 ,4174 ,417 3 ,5923 ,5923 ,5923 ,592 3 ,4313 ,4313 ,4313 ,431 3 ,6563 ,6563 ,6563 ,656 6 .6% 6 .6% 6 .6% 6 .6% 224224224224 +6 .6%+6 .6%+6 .6%+6 .6% ↑↑↑↑
Industr ial Mach ineryIndustr ial Mach ineryIndustr ial Mach ineryIndustr ial Mach inery 6 ,7246 ,7246 ,7246 ,724 6 ,0286 ,0286 ,0286 ,028 5 ,3195 ,3195 ,3195 ,319 5 ,2135 ,2135 ,2135 ,213 9 .4% 9 .4% 9 .4% 9 .4% -105-105-105-105 -2 .0%-2 .0%-2 .0%-2 .0% ↓↓↓↓
Prec ision Equ ipmentPrec ision Equ ipmentPrec ision Equ ipmentPrec ision Equ ipment 2 ,4192 ,4192 ,4192 ,419 2 ,2382 ,2382 ,2382 ,238 2 ,3172 ,3172 ,3172 ,317 2 ,2152 ,2152 ,2152 ,215 4 .0% 4 .0% 4 .0% 4 .0% -101-101-101-101 -4 .4%-4 .4%-4 .4%-4 .4% ↓↓↓↓
IT Re lated Hardware and DevicesIT Related Hardware and DevicesIT Related Hardware and DevicesIT Related Hardware and Devices 6 ,1526 ,1526 ,1526 ,152 6 ,8206 ,8206 ,8206 ,820 6 ,4746 ,4746 ,4746 ,474 5 ,5295 ,5295 ,5295 ,529 10 .0% 10 .0% 10 .0% 10 .0% -944-944-944-944 -14 .6%-14 .6%-14 .6%-14 .6% ↓↓↓↓
Electric and ElectronicsElectric and ElectronicsElectric and ElectronicsElectric and Electronics 5 ,3375 ,3375 ,3375 ,337 6 ,0506 ,0506 ,0506 ,050 6 ,7296 ,7296 ,7296 ,729 7 ,3597 ,3597 ,3597 ,359 13 .3% 13 .3% 13 .3% 13 .3% 630630630630 +9 .4%+9 .4%+9 .4%+9 .4% ↑↑↑↑S em i cond uct or s an d In te g ra te d Ci rc ui ts De s i gnS em i cond uct or s an d In te g ra te d Ci rc ui ts De s i gnS em i cond uct or s an d In te g ra te d Ci rc ui ts De s i gnS em i cond uct or s an d In te g ra te d Ci rc ui ts De s i gn 6 ,4476 ,4476 ,4476 ,447 8 ,5988 ,5988 ,5988 ,598 9 ,0069 ,0069 ,0069 ,006 8 ,8198 ,8198 ,8198 ,819 15 .9% 15 .9% 15 .9% 15 .9% -187-187-187-187 -2 .1%-2 .1%-2 .1%-2 .1% ↓↓↓↓
Semic on duc to r Equ ipmen t an d De vic esSemic on duc to r Equ ipmen t an d De vic esSemic on duc to r Equ ipmen t an d De vic esSemic on duc to r Equ ipmen t an d De vic es 3 ,3253 ,3253 ,3253 ,325 5 ,2775 ,2775 ,2775 ,277 4 ,3554 ,3554 ,3554 ,355 3 ,3463 ,3463 ,3463 ,346 6 .0% 6 .0% 6 .0% 6 .0% -1 ,008-1 ,008-1 ,008-1 ,008 -23 .2%-23 .2%-23 .2%-23 .2% ↓↓↓↓
In format ion Processing/SoftwareInformat ion Processing/SoftwareInformat ion Processing/SoftwareInformat ion Processing/Software 4 ,2124 ,2124 ,2124 ,212 3 ,9003 ,9003 ,9003 ,900 3 ,5403 ,5403 ,5403 ,540 3 ,8593 ,8593 ,8593 ,859 7 .0% 7 .0% 7 .0% 7 .0% 318318318318 +9 .0%+9 .0%+9 .0%+9 .0% ↑↑↑↑
PlantPlantPlantPlant 1 ,3461 ,3461 ,3461 ,346 1 ,2591 ,2591 ,2591 ,259 1 ,1851 ,1851 ,1851 ,185 1 ,0411 ,0411 ,0411 ,041 1 .9% 1 .9% 1 .9% 1 .9% -144-144-144-144 -12 .2%-12 .2%-12 .2%-12 .2% ↓↓↓↓
Construct ionConstruct ionConstruct ionConstruct ion 447447447447 497497497497 369369369369 384384384384 0 .7% 0 .7% 0 .7% 0 .7% 15151515 +4 .1%+4 .1%+4 .1%+4 .1% ↑↑↑↑
OtherOtherOtherOther 1 ,4471 ,4471 ,4471 ,447 1 ,8201 ,8201 ,8201 ,820 2 ,0032 ,0032 ,0032 ,003 1 ,8621 ,8621 ,8621 ,862 3 .4% 3 .4% 3 .4% 3 .4% -141-141-141-141 -7 .0%-7 .0%-7 .0%-7 .0% ↓↓↓↓
TotalTotalTotalTotal 50 ,77350 ,77350 ,77350 ,773 55 ,54255 ,54255 ,54255 ,542 55 ,63755 ,63755 ,63755 ,637 55 ,37955 ,37955 ,37955 ,379 100 .0% 100 .0% 100 .0% 100 .0% -258-258-258-258 ---- ----
SegmentSegmentSegmentSegment
Net SalesNet SalesNet SalesNet Sales
Fiscal 2003Fiscal 2003Fiscal 2003Fiscal 2003
Change (%)Change (%)Change (%)Change (%)
��������������������������������������������������������������������������������������������������������������������������������������������������������������������������������������������������������������������������������������������������������������������������������������������������������������������������������������������������������������������������������������������������������������������������������������������������������������������������
������������������������������
����������������������������
����������������������������
����������������������������
����������������������������������������
������������������������������
�����������������������������������������������������������������������������������������������������������������������������������������������������������������������������������������������������������
�������������������������������������������������������������������������������������������������������������������������������������������������������������������������������������������������������������������������������������������������������������������������������������������������������������������������������������������������������������������������������������������������������������������������������������������������������������������������������������������������������������������������������������������������������������������������������������������������������������������������������������������������������������������������������������������������������������������������������������������������������������������������������������������������������������������������������������������������������������������������������������������������������������������������������������������������������������������������������������������������������������������������������������������������������������������������������������������������������������������������������������������������������������������������������������������������������������������������������
������������������������������������������������������������������������������������������������������������������������
((((((((Millions of Yen)Millions of Yen)Millions of Yen)Millions of Yen)Millions of Yen)Millions of Yen)Millions of Yen)Millions of Yen)
Weight of Sales from Semiconductor Weight of Sales from Semiconductor Weight of Sales from Semiconductor Weight of Sales from Semiconductor Integrated Circuits Design and Semiconductor Integrated Circuits Design and Semiconductor Integrated Circuits Design and Semiconductor Integrated Circuits Design and Semiconductor
Manufacturing Equipments Industries Manufacturing Equipments Industries Manufacturing Equipments Industries Manufacturing Equipments Industries
Weight of Sales from Semiconductor Weight of Sales from Semiconductor Weight of Sales from Semiconductor Weight of Sales from Semiconductor Weight of Sales from Semiconductor Weight of Sales from Semiconductor Weight of Sales from Semiconductor Weight of Sales from Semiconductor Integrated Circuits Design and Semiconductor Integrated Circuits Design and Semiconductor Integrated Circuits Design and Semiconductor Integrated Circuits Design and Semiconductor Integrated Circuits Design and Semiconductor Integrated Circuits Design and Semiconductor Integrated Circuits Design and Semiconductor Integrated Circuits Design and Semiconductor
Manufacturing Equipments Industries Manufacturing Equipments Industries Manufacturing Equipments Industries Manufacturing Equipments Industries Manufacturing Equipments Industries Manufacturing Equipments Industries Manufacturing Equipments Industries Manufacturing Equipments Industries
2222222222222222
8,5988,5988,5988,598
6,4476,4476,4476,447
5,2165,2165,2165,216
9,0069,0069,0069,006 8,8198,8198,8198,819
2,9182,9182,9182,918
3,9823,9823,9823,982
2,7702,7702,7702,770
5,2775,2775,2775,2774,8404,8404,8404,840
3,8033,8033,8033,803
3,3253,3253,3253,325 3,3463,3463,3463,346
4,3554,3554,3554,3557.4%7.4%7.4%7.4%8.1%8.1%8.1%8.1%
10.1%10.1%10.1%10.1%
12.7%12.7%12.7%12.7%
15.5%15.5%15.5%15.5%
15.9%15.9%15.9%15.9%
16.2%16.2%16.2%16.2%
9.5%9.5%9.5%9.5%
6.5%6.5%6.5%6.5%7.3%7.3%7.3%7.3%
9.9%9.9%9.9%9.9%
7.0%7.0%7.0%7.0%
7.8%7.8%7.8%7.8%
6.0%6.0%6.0%6.0%
0000
1,0001,0001,0001,000
2,0002,0002,0002,000
3,0003,0003,0003,000
4,0004,0004,0004,000
5,0005,0005,0005,000
6,0006,0006,0006,000
7,0007,0007,0007,000
8,0008,0008,0008,000
9,0009,0009,0009,000
10,00010,00010,00010,000
1997年3月期1997年3月期1997年3月期1997年3月期 1998年3月期1998年3月期1998年3月期1998年3月期 1999年3月期1999年3月期1999年3月期1999年3月期 2000年3月期2000年3月期2000年3月期2000年3月期 2001年3月期2001年3月期2001年3月期2001年3月期 2002年3月期2002年3月期2002年3月期2002年3月期 2003年3月期2003年3月期2003年3月期2003年3月期
NetSales (Millions of Yen)
NetSales (Millions of Yen)
NetSales (Millions of Yen)
NetSales (Millions of Yen)
0%0%0%0%
2%2%2%2%
4%4%4%4%
6%6%6%6%
8%8%8%8%
10%10%10%10%
12%12%12%12%
14%14%14%14%
16%16%16%16%
18%18%18%18%
Persentage of Total Net Sales(%)
Persentage of Total Net Sales(%)
Persentage of Total Net Sales(%)
Persentage of Total Net Sales(%)
半導体・集積回路関連半導体・集積回路関連半導体・集積回路関連半導体・集積回路関連 半導体製造装置関連半導体製造装置関連半導体製造装置関連半導体製造装置関連 集積回路売上構成比集積回路売上構成比集積回路売上構成比集積回路売上構成比 製造装置売上構成比製造装置売上構成比製造装置売上構成比製造装置売上構成比
Fiscal Year EndedFiscal Year EndedFiscal Year EndedFiscal Year Ended
March 31,1997March 31,1997March 31,1997March 31,1997
Fiscal Year EndedFiscal Year EndedFiscal Year EndedFiscal Year Ended
March 31,1998March 31,1998March 31,1998March 31,1998
Fiscal Year EndedFiscal Year EndedFiscal Year EndedFiscal Year Ended
March 31,1999March 31,1999March 31,1999March 31,1999
Fiscal Year EndedFiscal Year EndedFiscal Year EndedFiscal Year Ended
March 31,2000March 31,2000March 31,2000March 31,2000
Fiscal Year EndedFiscal Year EndedFiscal Year EndedFiscal Year Ended
March 31,2001March 31,2001March 31,2001March 31,2001
Fiscal Year EndedFiscal Year EndedFiscal Year EndedFiscal Year Ended
March 31,2002March 31,2002March 31,2002March 31,2002
Fiscal Year EndedFiscal Year EndedFiscal Year EndedFiscal Year Ended
March 31,2003March 31,2003March 31,2003March 31,2003
Sales from Semiconductor Sales from Semiconductor Sales from Semiconductor Sales from Semiconductor IC Design IC Design IC Design IC Design
Sales from Semiconductor Sales from Semiconductor Sales from Semiconductor Sales from Semiconductor Manufacturing Equipments Design Manufacturing Equipments Design Manufacturing Equipments Design Manufacturing Equipments Design
Ratio to the Total Net Ratio to the Total Net Ratio to the Total Net Ratio to the Total Net Sales for IC Design Sales for IC Design Sales for IC Design Sales for IC Design
Ratio to the Total Net SalesRatio to the Total Net SalesRatio to the Total Net SalesRatio to the Total Net Salesfor Semiconductor MFG Equipment Design for Semiconductor MFG Equipment Design for Semiconductor MFG Equipment Design for Semiconductor MFG Equipment Design

2323232323232323
New Contracts by Segments (Apr,1 ,2002, to Mar,31 ,2003)New Contracts by Segments (Apr,1 ,2002, to Mar,31 ,2003)New Contracts by Segments (Apr,1 ,2002, to Mar,31 ,2003)New Contracts by Segments (Apr,1 ,2002, to Mar,31 ,2003)
15
11
3
7
27
147
23
40
95
33
245
50
220
230
35
43
24
20
62
10
10
4
4
8
11
19
2
7
5
6
4
3
1
13
7
45
40
14
3
4
7
7
15
116
1
5
2
31
1
1
2
1
86868686
99999999
43434343
59595959
123123123123
40404040
10101010
4444
77777777
246246246246
442442442442
128128128128
355355355355
0 50 100 150 200 250 300 350 400 450 500
Ot he rOt he rOt he rOt he r
Ot he r Mat e r i alsOt he r Mat e r i alsOt he r Mat e r i alsOt he r Mat e r i als
Con str u ct io nCon str u ct io nCon str u ct io nCon str u ct io n
Pl an tPl an tPl an tPl an t
In fo rmat io n Pr oc e ssi n g/So ftware De ve l opmen t an d M an agem en tIn fo rmat io n Pr oc e ssi n g/So ftware De ve l opmen t an d M an agem en tIn fo rmat io n Pr oc e ssi n g/So ftware De ve l opmen t an d M an agem en tIn fo rmat io n Pr oc e ssi n g/So ftware De ve l opmen t an d M an agem en t
Sem ic onduc t o r Equ ipm ent an d Devi c esSem ic onduc t o r Equ ipm ent an d Devi c esSem ic onduc t o r Equ ipm ent an d Devi c esSem ic onduc t o r Equ ipm ent an d Devi c es
Sem ic onduc t o rs an d In te gr ate d C i rc u it s De si gnSem ic onduc t o rs an d In te gr ate d C i rc u it s De si gnSem ic onduc t o rs an d In te gr ate d C i rc u it s De si gnSem ic onduc t o rs an d In te gr ate d C i rc u it s De si gn
Ele c tr ic an d Ele c tr o n icEle c tr ic an d Ele c tr o n icEle c tr ic an d Ele c tr o n icEle c tr ic an d Ele c tr o n ic
IT -Re lat e d Har dware an d De vi c esIT -Re lat e d Har dware an d De vi c esIT -Re lat e d Har dware an d De vi c esIT -Re lat e d Har dware an d De vi c es
Pr e c isio n Equ ipm entPr e c isio n Equ ipm entPr e c isio n Equ ipm entPr e c isio n Equ ipm ent
In du st r i al M ac h in e ryIn du st r i al M ac h in e ryIn du st r i al M ac h in e ryIn du st r i al M ac h in e ry
Ai rc r aft/Roc ke t ryAi rc r aft/Roc ke t ryAi rc r aft/Roc ke t ryAi rc r aft/Roc ke t ry
Au t omobi l e /T ran spor t at i onAu t omobi l e /T ran spor t at i onAu t omobi l e /T ran spor t at i onAu t omobi l e /T ran spor t at i on
MachineryMachineryMachineryMachinery Control SystemsControl SystemsControl SystemsControl Systems Information SystemsInformation SystemsInformation SystemsInformation Systems OtherOtherOtherOther
(Segment)(Segment)(Segment)(Segment)
(Number of Cortracts)(Number of Cortracts)(Number of Cortracts)(Number of Cortracts)
********Figures have been revised from the document posted on May 7, 200Figures have been revised from the document posted on May 7, 200Figures have been revised from the document posted on May 7, 200Figures have been revised from the document posted on May 7, 200Figures have been revised from the document posted on May 7, 200Figures have been revised from the document posted on May 7, 200Figures have been revised from the document posted on May 7, 200Figures have been revised from the document posted on May 7, 2003.3.3.3.3.3.3.3.
Electric and ElectronicElectric and ElectronicElectric and ElectronicElectric and Electronic
New Contracts<NonNew Contracts<NonNew Contracts<NonNew Contracts<Non----consolidated>consolidated>consolidated>consolidated>Existing Engineers and Recent GraduatesExisting Engineers and Recent GraduatesExisting Engineers and Recent GraduatesExisting Engineers and Recent Graduates
New Contracts<NonNew Contracts<NonNew Contracts<NonNew Contracts<NonNew Contracts<NonNew Contracts<NonNew Contracts<NonNew Contracts<Non--------consolidated>consolidated>consolidated>consolidated>consolidated>consolidated>consolidated>consolidated>Existing Engineers and Recent GraduatesExisting Engineers and Recent GraduatesExisting Engineers and Recent GraduatesExisting Engineers and Recent GraduatesExisting Engineers and Recent GraduatesExisting Engineers and Recent GraduatesExisting Engineers and Recent GraduatesExisting Engineers and Recent Graduates
2424242424242424
New Contracts by Segments (Apr,1 ,2002, to Mar,31 ,2003)New Contracts by Segments (Apr,1 ,2002, to Mar,31 ,2003)New Contracts by Segments (Apr,1 ,2002, to Mar,31 ,2003)New Contracts by Segments (Apr,1 ,2002, to Mar,31 ,2003)
5
16
3
3
4
11
47
78
58
13
14
4
9
15
5
4
1012
1
1
1
28
1
1
1
3
5
2
2
1
14
6
1
3
1
2
2
30
3
14
4
2
3
82828282
10101010
86868686
86868686
23232323
1111
2222
15151515
33333333
23232323
17171717
18181818
38383838
0 20 40 60 80 100 120 140 160 180 200
Ot he rOt he rOt he rOt he r
Ot he r Mat e r i alsOt he r Mat e r i alsOt he r Mat e r i alsOt he r Mat e r i als
Con str u ct io nCon str u ct io nCon str u ct io nCon str u ct io n
Pl an tPl an tPl an tPl an t
In fo rmat io n Pr oc e ssi n g/So ftware De ve l opmen t an d M an agem en tIn fo rmat io n Pr oc e ssi n g/So ftware De ve l opmen t an d M an agem en tIn fo rmat io n Pr oc e ssi n g/So ftware De ve l opmen t an d M an agem en tIn fo rmat io n Pr oc e ssi n g/So ftware De ve l opmen t an d M an agem en t
Sem ic onduc t o r Equ ipm ent an d Devi c esSem ic onduc t o r Equ ipm ent an d Devi c esSem ic onduc t o r Equ ipm ent an d Devi c esSem ic onduc t o r Equ ipm ent an d Devi c es
Sem ic onduc t o rs an d In te gr ate d C i rc u it s De si gnSem ic onduc t o rs an d In te gr ate d C i rc u it s De si gnSem ic onduc t o rs an d In te gr ate d C i rc u it s De si gnSem ic onduc t o rs an d In te gr ate d C i rc u it s De si gn
Ele c tr ic an d Ele c tr o n icEle c tr ic an d Ele c tr o n icEle c tr ic an d Ele c tr o n icEle c tr ic an d Ele c tr o n ic
IT -Re lat e d Har dware an d De vi c esIT -Re lat e d Har dware an d De vi c esIT -Re lat e d Har dware an d De vi c esIT -Re lat e d Har dware an d De vi c es
Pr e c isio n Equ ipm entPr e c isio n Equ ipm entPr e c isio n Equ ipm entPr e c isio n Equ ipm ent
In du st r i al M ac h in e ryIn du st r i al M ac h in e ryIn du st r i al M ac h in e ryIn du st r i al M ac h in e ry
Ai rc r aft/Roc ke t ryAi rc r aft/Roc ke t ryAi rc r aft/Roc ke t ryAi rc r aft/Roc ke t ry
Au t omobi l e /T ran spor t at i onAu t omobi l e /T ran spor t at i onAu t omobi l e /T ran spor t at i onAu t omobi l e /T ran spor t at i on
MachineryMachineryMachineryMachinery Control SystemsControl SystemsControl SystemsControl Systems Information SystemsInformation SystemsInformation SystemsInformation Systems OtherOtherOtherOther
(Segment)(Segment)(Segment)(Segment)
(Number of Cortracts)(Number of Cortracts)(Number of Cortracts)(Number of Cortracts)
New Contracts<NonNew Contracts<NonNew Contracts<NonNew Contracts<Non----consolidated>consolidated>consolidated>consolidated>Recent GraduatesRecent GraduatesRecent GraduatesRecent Graduates
New Contracts<NonNew Contracts<NonNew Contracts<NonNew Contracts<NonNew Contracts<NonNew Contracts<NonNew Contracts<NonNew Contracts<Non--------consolidated>consolidated>consolidated>consolidated>consolidated>consolidated>consolidated>consolidated>Recent GraduatesRecent GraduatesRecent GraduatesRecent GraduatesRecent GraduatesRecent GraduatesRecent GraduatesRecent Graduates
Electric and ElectronicElectric and ElectronicElectric and ElectronicElectric and Electronic
********Figures have been revised from the document posted on May 7, 200Figures have been revised from the document posted on May 7, 200Figures have been revised from the document posted on May 7, 200Figures have been revised from the document posted on May 7, 200Figures have been revised from the document posted on May 7, 200Figures have been revised from the document posted on May 7, 200Figures have been revised from the document posted on May 7, 200Figures have been revised from the document posted on May 7, 2003.3.3.3.3.3.3.3.

Top 10 Clients by Sales and Shares of Top 10 Clients by Sales and Shares of Top 10 Clients by Sales and Shares of Top 10 Clients by Sales and Shares of Net Sales <NonNet Sales <NonNet Sales <NonNet Sales <Non----Consolidated>Consolidated>Consolidated>Consolidated>
Top 10 Clients by Sales and Shares of Top 10 Clients by Sales and Shares of Top 10 Clients by Sales and Shares of Top 10 Clients by Sales and Shares of Top 10 Clients by Sales and Shares of Top 10 Clients by Sales and Shares of Top 10 Clients by Sales and Shares of Top 10 Clients by Sales and Shares of Net Sales <NonNet Sales <NonNet Sales <NonNet Sales <NonNet Sales <NonNet Sales <NonNet Sales <NonNet Sales <Non--------Consolidated>Consolidated>Consolidated>Consolidated>Consolidated>Consolidated>Consolidated>Consolidated>
2525252525252525
SalesSalesSalesSales %%%% SalesSalesSalesSales %%%% SalesSalesSalesSales %%%%
1111 Mitsubishi HeavyMitsubishi HeavyMitsubishi HeavyMitsubishi Heavy 2,7632,7632,7632,763 5.6%5.6%5.6%5.6% 1111 Sony Corp.Sony Corp.Sony Corp.Sony Corp. 3,6743,6743,6743,674 6.6%6.6%6.6%6.6% 1111 Matsushita Elect r icMatsushita Elect r icMatsushita Elect r icMatsushita Elect r ic 4,1324,1324,1324,132 7.5%7.5%7.5%7.5%
2222 Oki ElectricOki ElectricOki ElectricOki Electric 1,9621,9621,9621,962 4.0%4.0%4.0%4.0% 2222 Seiko EpsonSeiko EpsonSeiko EpsonSeiko Epson 3,1843,1843,1843,184 5.8%5.8%5.8%5.8% 2222 Sony Corp.Sony Corp.Sony Corp.Sony Corp. 3,7373,7373,7373,737 6.7%6.7%6.7%6.7%
3333 NikonNikonNikonNikon 1,6571,6571,6571,657 3.4%3.4%3.4%3.4% 3333 Matsushita Elect r icMatsushita Elect r icMatsushita Elect r icMatsushita Elect r ic 3,0033,0033,0033,003 5.4%5.4%5.4%5.4% 3333 Seiko EpsonSeiko EpsonSeiko EpsonSeiko Epson 2,0702,0702,0702,070 3.7%3.7%3.7%3.7%
4444 Matsush ita ElectricMatsush ita ElectricMatsush ita ElectricMatsush ita Electric 1,6101,6101,6101,610 3.3%3.3%3.3%3.3% 4444 Mitsubishi H eavyMitsubishi H eavyMitsubishi H eavyMitsubishi H eavy 2,1342,1342,1342,134 3.9%3.9%3.9%3.9% 4444 Mitsubishi H eavyMitsubishi H eavyMitsubishi H eavyMitsubishi H eavy 2,0272,0272,0272,027 3.7%3.7%3.7%3.7%
5555 OmronOmronOmronOmron 1,6051,6051,6051,605 3.3%3.3%3.3%3.3% 5555 Canon Inc.Canon Inc.Canon Inc.Canon Inc. 1,9251,9251,9251,925 3.5%3.5%3.5%3.5% 5555 Toyota MotorToyota MotorToyota MotorToyota Motor 1,8721,8721,8721,872 3.4%3.4%3.4%3.4%
6666 Kawasaki HeavyKawasaki HeavyKawasaki HeavyKawasaki Heavy 1,4661,4661,4661,466 3.0%3.0%3.0%3.0% 6666 Toyota MotorToyota MotorToyota MotorToyota Motor 1,3221,3221,3221,322 2.4%2.4%2.4%2.4% 6666 Canon Inc.Canon Inc.Canon Inc.Canon Inc. 1,7781,7781,7781,778 3.2%3.2%3.2%3.2%
7777 Sony Corp.Sony Corp.Sony Corp.Sony Corp. 1,3911,3911,3911,391 2.8%2.8%2.8%2.8% 7777 NikonNikonNikonNikon 1,2921,2921,2921,292 2.3%2.3%2.3%2.3% 7777 Kawasaki HeavyKawasaki HeavyKawasaki HeavyKawasaki Heavy 1,2151,2151,2151,215 2.2%2.2%2.2%2.2%
8888 Canon Inc.Canon Inc.Canon Inc.Canon Inc. 1,0981,0981,0981,098 2.2%2.2%2.2%2.2% 8888 Jatoco T.T.Jatoco T.T.Jatoco T.T.Jatoco T.T. 1,2181,2181,2181,218 2.2%2.2%2.2%2.2% 8888 Jatoco T.T.Jatoco T.T.Jatoco T.T.Jatoco T.T. 1,1491,1491,1491,149 2.1%2.1%2.1%2.1%
9999 Seiko EpsonSeiko EpsonSeiko EpsonSeiko Epson 1,0701,0701,0701,070 2.2%2.2%2.2%2.2% 9999 OmronOmronOmronOmron 1,1311,1311,1311,131 2.0%2.0%2.0%2.0% 9999 OmronOmronOmronOmron 1,0851,0851,0851,085 2.0%2.0%2.0%2.0%
10101010 Nissan MotorNissan MotorNissan MotorNissan Motor 1,0511,0511,0511,051 2.1%2.1%2.1%2.1% 10101010 Kawasaki HeavyKawasaki HeavyKawasaki HeavyKawasaki Heavy 878878878878 1.6%1.6%1.6%1.6% 10101010 NikonNikonNikonNikon 1,0841,0841,0841,084 2.0%2.0%2.0%2.0%
15,673 32.0%32.0%32.0%32.0% 19,762 35.5%35.5%35.5%35.5% 20,149 36.4%36.4%36.4%36.4%
21,800 44.6%44.6%44.6%44.6% 26,357 47.4%47.4%47.4%47.4% 26,483 47.8%47.8%47.8%47.8%
OthersOthersOthersOthers 27,106 55.4%55.4%55.4%55.4% OthersOthersOthersOthers 29,281 52.6%52.6%52.6%52.6% OthersOthersOthersOthers 28,896 52.2%52.2%52.2%52.2%
48,906 100.0% 55,638 100.0% 55,379 100.0%
Top 10 Total Top 10 Total Top 10 Total Top 10 Total
Top 20 Total Top 20 Total Top 20 Total Top 20 Total
Total Total Total Total Total Total Total Total Total Total Total Total
Top 10 Total Top 10 Total Top 10 Total Top 10 Total
Top 20 Total Top 20 Total Top 20 Total Top 20 Total
Fiscal year ended March 31,1998Fiscal year ended March 31,1998Fiscal year ended March 31,1998Fiscal year ended March 31,1998
Top 10 Total Top 10 Total Top 10 Total Top 10 Total
Top 20 Total Top 20 Total Top 20 Total Top 20 Total
Fiscal year ended March 31,2002Fiscal year ended March 31,2002Fiscal year ended March 31,2002Fiscal year ended March 31,2002 Fiscal year ended March 31,2003Fiscal year ended March 31,2003Fiscal year ended March 31,2003Fiscal year ended March 31,2003
Company NameCompany NameCompany NameCompany Name Company NameCompany NameCompany NameCompany Name Company NameCompany NameCompany NameCompany Name
������������������������������������������������������������������������������������������������������������������������������������������������
���������
<<<<<<<<Five years agoFive years agoFive years agoFive years agoFive years agoFive years agoFive years agoFive years ago>>>>>>>> <<<<<<<< CurrentCurrentCurrentCurrentCurrentCurrentCurrentCurrent>>>>>>>> ((((Million of Yen)Million of Yen)Million of Yen)Million of Yen)
Progress in Strategic RotationProgress in Strategic RotationProgress in Strategic RotationProgress in Strategic RotationProgress in Strategic RotationProgress in Strategic RotationProgress in Strategic RotationProgress in Strategic RotationProgress in Strategic RotationProgress in Strategic RotationProgress in Strategic RotationProgress in Strategic Rotation
2626262626262626
Strategic RotationStrategic RotationStrategic RotationStrategic Rotation:::: <<<< Planned CasesPlanned CasesPlanned CasesPlanned Cases=753=753=753=753>>>> ⇒⇒⇒⇒ Achieved improvement in job phase and rotation to other clientsAchieved improvement in job phase and rotation to other clientsAchieved improvement in job phase and rotation to other clientsAchieved improvement in job phase and rotation to other clients. . . .
2 062 062 062 06
2 932 932 932 93
1 441 441 441 44
1 101 101 101 102 062 062 062 06
4 994 994 994 99
6 436 436 436 43
7 537 537 537 53
0000
1 001 001 001 00
2 002 002 002 00
3 003 003 003 00
4 004 004 004 00
20 01/320 01/320 01/320 01/3 20 02/320 02/320 02/320 02/3 20 03/320 03/320 03/320 03/3 20 03/4~20 03/4~20 03/4~20 03/4~
Case
sC
ase
sC
ase
sC
ase
s
0000
2 002 002 002 00
4 004 004 004 00
6 006 006 006 00
8 008 008 008 00Nu mbe r o f r o t at io n in a fisc a l ye arNu mbe r o f r o t at io n in a fisc a l ye arNu mbe r o f r o t at io n in a fisc a l ye arNu mbe r o f r o t at io n in a fisc a l ye ar
Cu mu lat ive n u mbe r s o f r at io n do n eCu mu lat ive n u mbe r s o f r at io n do n eCu mu lat ive n u mbe r s o f r at io n do n eCu mu lat ive n u mbe r s o f r at io n do n e
( Pl a nne d)( Pl a nne d)( Pl a nne d)( Pl a nne d)
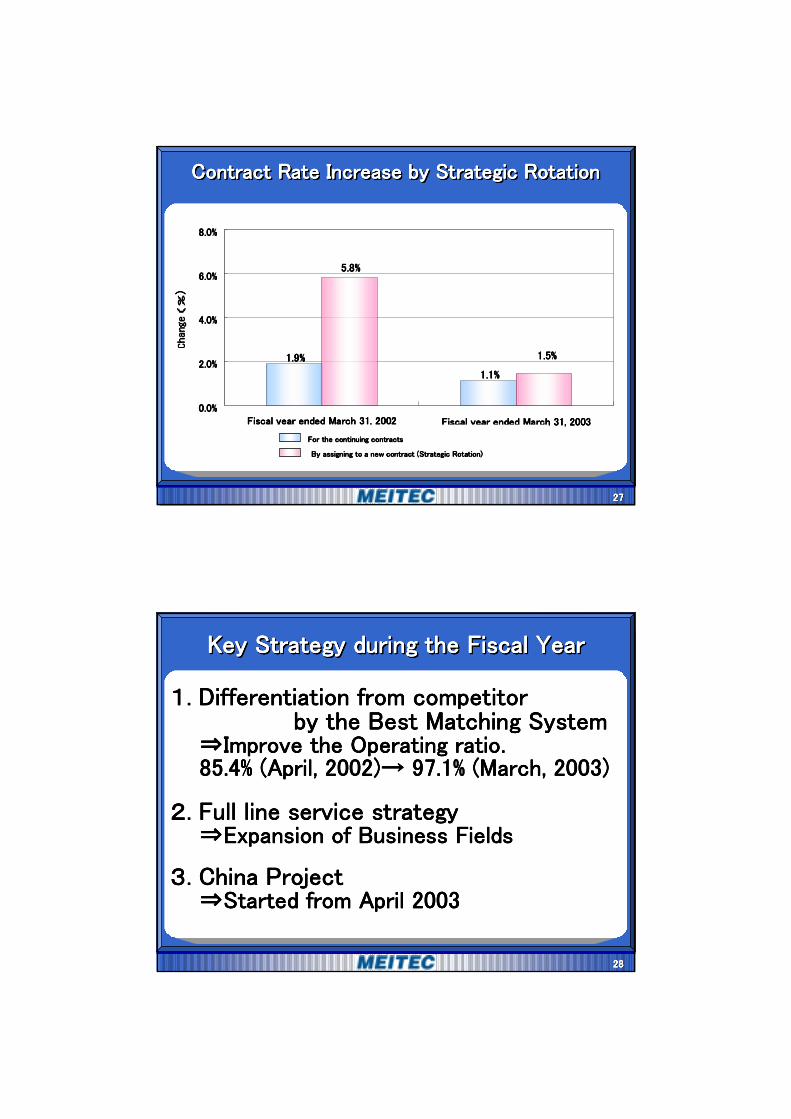
Contract Rate Increase by Strategic RotationContract Rate Increase by Strategic RotationContract Rate Increase by Strategic RotationContract Rate Increase by Strategic RotationContract Rate Increase by Strategic RotationContract Rate Increase by Strategic RotationContract Rate Increase by Strategic RotationContract Rate Increase by Strategic Rotation
2727272727272727
Change
Change
Change
Change(%
(%(%
(%) )))
1.9%1.9%1.9%1.9%
1.1%1.1%1.1%1.1%
1.5%1.5%1.5%1.5%
5.8%5.8%5.8%5.8%
0.0%0.0%0.0%0.0%
2.0%2.0%2.0%2.0%
4.0%4.0%4.0%4.0%
6.0%6.0%6.0%6.0%
8.0%8.0%8.0%8.0%
Fiscal year ended March 31, 2002 Fiscal year ended March 31, 2002 Fiscal year ended March 31, 2002 Fiscal year ended March 31, 2002 Fiscal year ended March 31, 2003 Fiscal year ended March 31, 2003 Fiscal year ended March 31, 2003 Fiscal year ended March 31, 2003
For the continuing contractsFor the continuing contractsFor the continuing contractsFor the continuing contracts
By assigning to a new contract (Strategic Rotation)By assigning to a new contract (Strategic Rotation)By assigning to a new contract (Strategic Rotation)By assigning to a new contract (Strategic Rotation)
Key Strategy during the Fiscal Year Key Strategy during the Fiscal Year Key Strategy during the Fiscal Year Key Strategy during the Fiscal Year Key Strategy during the Fiscal Year Key Strategy during the Fiscal Year Key Strategy during the Fiscal Year Key Strategy during the Fiscal Year Key Strategy during the Fiscal Year Key Strategy during the Fiscal Year Key Strategy during the Fiscal Year Key Strategy during the Fiscal Year
2828282828282828
11111111 . . . . . . . . Differentiation from competitor Differentiation from competitor Differentiation from competitor Differentiation from competitor Differentiation from competitor Differentiation from competitor Differentiation from competitor Differentiation from competitor by the Best Matching System by the Best Matching System by the Best Matching System by the Best Matching System by the Best Matching System by the Best Matching System by the Best Matching System by the Best Matching System
⇒⇒⇒⇒⇒⇒⇒⇒Improve the Operating ratio. Improve the Operating ratio. Improve the Operating ratio. Improve the Operating ratio. Improve the Operating ratio. Improve the Operating ratio. Improve the Operating ratio. Improve the Operating ratio. 85.4% (85.4% (85.4% (85.4% (85.4% (85.4% (85.4% (85.4% (April, 2002)April, 2002)April, 2002)April, 2002)April, 2002)April, 2002)April, 2002)April, 2002)→→→→→→→→ 97.1% (March, 2003)97.1% (March, 2003)97.1% (March, 2003)97.1% (March, 2003)97.1% (March, 2003)97.1% (March, 2003)97.1% (March, 2003)97.1% (March, 2003)
22222222 . . . . . . . . Full line service strategyFull line service strategyFull line service strategyFull line service strategyFull line service strategyFull line service strategyFull line service strategyFull line service strategy⇒⇒⇒⇒⇒⇒⇒⇒Expansion of Business Fields Expansion of Business Fields Expansion of Business Fields Expansion of Business Fields Expansion of Business Fields Expansion of Business Fields Expansion of Business Fields Expansion of Business Fields
33333333 . . . . . . . . China ProjectChina ProjectChina ProjectChina ProjectChina ProjectChina ProjectChina ProjectChina Project⇒⇒⇒⇒⇒⇒⇒⇒Started from April 2003 Started from April 2003 Started from April 2003 Started from April 2003 Started from April 2003 Started from April 2003 Started from April 2003 Started from April 2003

BESTBESTBESTBEST MATCHINGMATCHINGMATCHINGMATCHING SYSTEMSYSTEMSYSTEMSYSTEMBESTBESTBESTBEST MATCHINGMATCHINGMATCHINGMATCHING SYSTEMSYSTEMSYSTEMSYSTEM
2929292929292929
The Best matching System quantifies the technical details requirThe Best matching System quantifies the technical details requirThe Best matching System quantifies the technical details requirThe Best matching System quantifies the technical details requirThe Best matching System quantifies the technical details requirThe Best matching System quantifies the technical details requirThe Best matching System quantifies the technical details requirThe Best matching System quantifies the technical details required by the ed by the ed by the ed by the ed by the ed by the ed by the ed by the customers and match against a database of abilities, skills and customers and match against a database of abilities, skills and customers and match against a database of abilities, skills and customers and match against a database of abilities, skills and customers and match against a database of abilities, skills and customers and match against a database of abilities, skills and customers and match against a database of abilities, skills and customers and match against a database of abilities, skills and career of Meitec career of Meitec career of Meitec career of Meitec career of Meitec career of Meitec career of Meitec career of Meitec engineers. engineers. engineers. engineers. engineers. engineers. engineers. engineers.
Matching Matching Matching Matching Matching Matching Matching Matching process process process process process process process process
based on ITbased on ITbased on ITbased on ITbased on ITbased on ITbased on ITbased on IT
Best matching engineer for the clientBest matching engineer for the clientBest matching engineer for the clientBest matching engineer for the clientBest matching engineer for the clientBest matching engineer for the clientBest matching engineer for the clientBest matching engineer for the client’’s requirement is s requirement is s requirement is s requirement is s requirement is s requirement is s requirement is s requirement is
quickly selected suggested from our engineer across Japan. quickly selected suggested from our engineer across Japan. quickly selected suggested from our engineer across Japan. quickly selected suggested from our engineer across Japan. quickly selected suggested from our engineer across Japan. quickly selected suggested from our engineer across Japan. quickly selected suggested from our engineer across Japan. quickly selected suggested from our engineer across Japan.
Customer Customer Customer Customer Customer Customer Customer Customer needs needs needs needs needs needs needs needs
Technical Technical Technical Technical Career DataCareer DataCareer DataCareer Data・・・・Product field Product field Product field Product field ・・・・Technical knowledge Technical knowledge Technical knowledge Technical knowledge ・・・・Tools Tools Tools Tools ・・・・Operation segment Operation segment Operation segment Operation segment ・・・・Operation phase Operation phase Operation phase Operation phase ・・・・Operation experience Operation experience Operation experience Operation experience ・・・・Education Education Education Education
(Qualifications)(Qualifications)(Qualifications)(Qualifications)
Technical Technical Technical Technical Technical Technical Technical Technical Career DataCareer DataCareer DataCareer DataCareer DataCareer DataCareer DataCareer Data・・・・・・・・Product field Product field Product field Product field Product field Product field Product field Product field ・・・・・・・・Technical knowledge Technical knowledge Technical knowledge Technical knowledge Technical knowledge Technical knowledge Technical knowledge Technical knowledge ・・・・・・・・Tools Tools Tools Tools Tools Tools Tools Tools ・・・・・・・・Operation segment Operation segment Operation segment Operation segment Operation segment Operation segment Operation segment Operation segment ・・・・・・・・Operation phase Operation phase Operation phase Operation phase Operation phase Operation phase Operation phase Operation phase ・・・・・・・・Operation experience Operation experience Operation experience Operation experience Operation experience Operation experience Operation experience Operation experience ・・・・・・・・Education Education Education Education Education Education Education Education
(Qualifications)(Qualifications)(Qualifications)(Qualifications)(Qualifications)(Qualifications)(Qualifications)(Qualifications)
MeitecMeitecMeitecMeitecMeitecMeitecMeitecMeitec’’ssssssss 6,000 6,000 6,000 6,000 6,000 6,000 6,000 6,000 engineersengineersengineersengineersengineersengineersengineersengineers
700 700 700 700 700 700 700 700 client companiesclient companiesclient companiesclient companiesclient companiesclient companiesclient companiesclient companies
Promotion of a FullPromotion of a FullPromotion of a FullPromotion of a Full----line Service Strategyline Service Strategyline Service Strategyline Service StrategyPromotion of a FullPromotion of a FullPromotion of a FullPromotion of a FullPromotion of a FullPromotion of a FullPromotion of a FullPromotion of a Full--------line Service Strategyline Service Strategyline Service Strategyline Service Strategyline Service Strategyline Service Strategyline Service Strategyline Service Strategy
3030303030303030
・
EngineerEngineerEngineerEngineerEngineerEngineerEngineerEngineer
Engineer Dispatch ModelEngineer Dispatch ModelEngineer Dispatch ModelEngineer Dispatch ModelEngineer Dispatch ModelEngineer Dispatch ModelEngineer Dispatch ModelEngineer Dispatch Model
ManufacturingManufacturingManufacturingManufacturingManufacturingManufacturingManufacturingManufacturingIndustryIndustryIndustryIndustryIndustryIndustryIndustryIndustry
Engineer Service Content ModelEngineer Service Content ModelEngineer Service Content ModelEngineer Service Content ModelEngineer Service Content ModelEngineer Service Content ModelEngineer Service Content ModelEngineer Service Content Model
<<<<<<<<Until 2000 Until 2000 Until 2000 Until 2000 Until 2000 Until 2000 Until 2000 Until 2000 >>>>>>>>
Manufacturing IndustryManufacturing IndustryManufacturing IndustryManufacturing IndustryManufacturing IndustryManufacturing IndustryManufacturing IndustryManufacturing Industry
<<<<<<<<From 2001 From 2001 From 2001 From 2001 From 2001 From 2001 From 2001 From 2001 >>>>>>>>
DispatchDispatchDispatchDispatchDispatchDispatchDispatchDispatch
・・・・・・・・HighHighHighHighHighHighHighHigh--------Added ValueAdded ValueAdded ValueAdded ValueAdded ValueAdded ValueAdded ValueAdded Value・・・・・・・・High ReturnHigh ReturnHigh ReturnHigh ReturnHigh ReturnHigh ReturnHigh ReturnHigh Return・・・・・・・・DifferentiationDifferentiationDifferentiationDifferentiationDifferentiationDifferentiationDifferentiationDifferentiation
AnalysisAnalysisAnalysisAnalysisAnalysisAnalysisAnalysisAnalysis
Dispatch & Highly value Dispatch & Highly value Dispatch & Highly value Dispatch & Highly value Dispatch & Highly value Dispatch & Highly value Dispatch & Highly value Dispatch & Highly value added serviceadded serviceadded serviceadded serviceadded serviceadded serviceadded serviceadded service
PrototypePrototypePrototypePrototypePrototypePrototypePrototypePrototype
Printed CircuitPrinted CircuitPrinted CircuitPrinted CircuitPrinted CircuitPrinted CircuitPrinted CircuitPrinted CircuitBoard DesignBoard DesignBoard DesignBoard DesignBoard DesignBoard DesignBoard DesignBoard Design
LSI LSI LSI LSI LSI LSI LSI LSI DesignDesignDesignDesignDesignDesignDesignDesign
TechnicalTechnicalTechnicalTechnicalTechnicalTechnicalTechnicalTechnicalManualManualManualManualManualManualManualManual
ITITITITITITITITSupportSupportSupportSupportSupportSupportSupportSupport
EngineerEngineerEngineerEngineerEngineerEngineerEngineerEngineer
Construction of a HighConstruction of a HighConstruction of a HighConstruction of a HighConstruction of a HighConstruction of a HighConstruction of a HighConstruction of a High--------end, Highend, Highend, Highend, Highend, Highend, Highend, Highend, High--------return Service Structurereturn Service Structurereturn Service Structurereturn Service Structurereturn Service Structurereturn Service Structurereturn Service Structurereturn Service Structure

FullFullFullFull----line Service Strategy Construction of a line Service Strategy Construction of a line Service Strategy Construction of a line Service Strategy Construction of a highhighhighhigh----profit service structure at the highprofit service structure at the highprofit service structure at the highprofit service structure at the high----end servicesend servicesend servicesend services
FullFullFullFullFullFullFullFull--------line Service Strategy Construction of a line Service Strategy Construction of a line Service Strategy Construction of a line Service Strategy Construction of a line Service Strategy Construction of a line Service Strategy Construction of a line Service Strategy Construction of a line Service Strategy Construction of a highhighhighhighhighhighhighhigh--------profit service structure at the highprofit service structure at the highprofit service structure at the highprofit service structure at the highprofit service structure at the highprofit service structure at the highprofit service structure at the highprofit service structure at the high--------end servicesend servicesend servicesend servicesend servicesend servicesend servicesend services
3131313131313131
ContentContentContentContent ContractContractContractContract
ITCITCITCITC 15151515
LSIDCLSIDCLSIDCLSIDC 12121212
e-ECe-ECe-ECe-EC 46464646
AnalysisEC AnalysisEC AnalysisEC AnalysisEC 12121212
IMSIMSIMSIMS 26262626
3DTec3DTec3DTec3DTec 133133133133
合計合計合計合計 244244244244
Fiscal 2003Fiscal 2003Fiscal 2003Fiscal 2003
Full line engineering serviceFull line engineering serviceFull line engineering serviceFull line engineering service
DispatchDispatchDispatchDispatchServicesServicesServicesServices
SolutionSolutionSolutionSolutionServicesServicesServicesServices
++++
Results of Group Coordination in Sales EffortResults of Group Coordination in Sales EffortResults of Group Coordination in Sales EffortResults of Group Coordination in Sales EffortResults of Group Coordination in Sales EffortResults of Group Coordination in Sales EffortResults of Group Coordination in Sales EffortResults of Group Coordination in Sales EffortResults of Group Coordination in Sales EffortResults of Group Coordination in Sales EffortResults of Group Coordination in Sales EffortResults of Group Coordination in Sales Effort
3232323232323232
→→→→ MEITECMEITECMEITECMEITEC JOJOJOJO JCJCJCJC TotalTotalTotalTotal
MEITECMEITECMEITECMEITEC 89898989 190190190190 279279279279
JOJOJOJO 32323232 60606060 92929292
JCJCJCJC 21212121 27272727 48484848
TotalTotalTotalTotal 53535353 116116116116 250250250250 419419419419
<Number of Orders>:April 2002 ー March, 2003 <Number of Orders>:April 2002 ー March, 2003 <Number of Orders>:April 2002 ー March, 2003 <Number of Orders>:April 2002 ー March, 2003
Ord
ers
Rec
eive
d by
Ord
ers
Rec
eive
d by
Ord
ers
Rec
eive
d by
Ord
ers
Rec
eive
d by
Responded byResponded byResponded byResponded by

Strategy to expand business for the entire Strategy to expand business for the entire Strategy to expand business for the entire Strategy to expand business for the entire Strategy to expand business for the entire Strategy to expand business for the entire Strategy to expand business for the entire Strategy to expand business for the entire group companies with group companies with group companies with group companies with group companies with group companies with group companies with group companies with ““MeitecMeitecMeitecMeitecMeitecMeitecMeitecMeitec”” as a core brand as a core brand as a core brand as a core brand as a core brand as a core brand as a core brand as a core brand name for the business. name for the business. name for the business. name for the business. name for the business. name for the business. name for the business. name for the business.
Global Vision21:Strategic PointsGlobal Vision21:Strategic PointsGlobal Vision21:Strategic PointsGlobal Vision21:Strategic PointsGlobal Vision21:Strategic PointsGlobal Vision21:Strategic PointsGlobal Vision21:Strategic PointsGlobal Vision21:Strategic Points
3333333333333333
Enhancing QualityEnhancing QualityEnhancing QualityEnhancing QualityEnhancing QualityEnhancing QualityEnhancing QualityEnhancing Quality MeitecMeitecMeitecMeitecMeitecMeitecMeitecMeitec
Quantitative GrowthQuantitative GrowthQuantitative GrowthQuantitative GrowthQuantitative GrowthQuantitative GrowthQuantitative GrowthQuantitative Growth Meitec GroupMeitec GroupMeitec GroupMeitec GroupMeitec GroupMeitec GroupMeitec GroupMeitec Group
Comprehensive Group evolution and growthComprehensive Group evolution and growthComprehensive Group evolution and growthComprehensive Group evolution and growthComprehensive Group evolution and growthComprehensive Group evolution and growthComprehensive Group evolution and growthComprehensive Group evolution and growth
Global Vision21: KeywordsGlobal Vision21: KeywordsGlobal Vision21: KeywordsGlobal Vision21: KeywordsGlobal Vision21: KeywordsGlobal Vision21: KeywordsGlobal Vision21: KeywordsGlobal Vision21: Keywords
3434343434343434
Global evolution and growthGlobal evolution and growthGlobal evolution and growthGlobal evolution and growthGlobal evolution and growthGlobal evolution and growthGlobal evolution and growthGlobal evolution and growth
Comprehensive corporate evolution and growth Comprehensive corporate evolution and growth Comprehensive corporate evolution and growth Comprehensive corporate evolution and growth Comprehensive corporate evolution and growth Comprehensive corporate evolution and growth Comprehensive corporate evolution and growth Comprehensive corporate evolution and growth based on supporting individual development based on supporting individual development based on supporting individual development based on supporting individual development based on supporting individual development based on supporting individual development based on supporting individual development based on supporting individual development 『 『 『 『 『 『 『 『 Mutual Growth and ProsperityMutual Growth and ProsperityMutual Growth and ProsperityMutual Growth and Prosperity 』』』』』』』』
GroupGroupGroupGroupGroupGroupGroupGroup
GlobalGlobalGlobalGlobalGlobalGlobalGlobalGlobal
GrowingGrowingGrowingGrowingGrowingGrowingGrowingGrowing

Most Important measures of Most Important measures of Most Important measures of Most Important measures of The Global Vision 21 The Global Vision 21 The Global Vision 21 The Global Vision 21
Most Important measures of Most Important measures of Most Important measures of Most Important measures of The Global Vision 21 The Global Vision 21 The Global Vision 21 The Global Vision 21
3535353535353535
11111111. . . . . . . . Efficient job assignment to Efficient job assignment to Efficient job assignment to Efficient job assignment to Efficient job assignment to Efficient job assignment to Efficient job assignment to Efficient job assignment to the engineers with the Best Matching System. the engineers with the Best Matching System. the engineers with the Best Matching System. the engineers with the Best Matching System. the engineers with the Best Matching System. the engineers with the Best Matching System. the engineers with the Best Matching System. the engineers with the Best Matching System.
⇒⇒⇒⇒⇒⇒⇒⇒Strengthening the main business. Strengthening the main business. Strengthening the main business. Strengthening the main business. Strengthening the main business. Strengthening the main business. Strengthening the main business. Strengthening the main business.
22222222. . . . . . . . Expansion of the services provided by the entire Expansion of the services provided by the entire Expansion of the services provided by the entire Expansion of the services provided by the entire Expansion of the services provided by the entire Expansion of the services provided by the entire Expansion of the services provided by the entire Expansion of the services provided by the entire group to fulfill the needs for the full line up outsourcing. group to fulfill the needs for the full line up outsourcing. group to fulfill the needs for the full line up outsourcing. group to fulfill the needs for the full line up outsourcing. group to fulfill the needs for the full line up outsourcing. group to fulfill the needs for the full line up outsourcing. group to fulfill the needs for the full line up outsourcing. group to fulfill the needs for the full line up outsourcing.
⇒⇒⇒⇒⇒⇒⇒⇒Expansion of business area. Expansion of business area. Expansion of business area. Expansion of business area. Expansion of business area. Expansion of business area. Expansion of business area. Expansion of business area.
33333333. . . . . . . . Promote the cost reduced services Promote the cost reduced services Promote the cost reduced services Promote the cost reduced services Promote the cost reduced services Promote the cost reduced services Promote the cost reduced services Promote the cost reduced services by applying the Chinese resources.by applying the Chinese resources.by applying the Chinese resources.by applying the Chinese resources.by applying the Chinese resources.by applying the Chinese resources.by applying the Chinese resources.by applying the Chinese resources.
⇒⇒⇒⇒⇒⇒⇒⇒Utilization of the global resources Utilization of the global resources Utilization of the global resources Utilization of the global resources Utilization of the global resources Utilization of the global resources Utilization of the global resources Utilization of the global resources
44444444. . . . . . . . Promote the out placement businesses. Promote the out placement businesses. Promote the out placement businesses. Promote the out placement businesses. Promote the out placement businesses. Promote the out placement businesses. Promote the out placement businesses. Promote the out placement businesses. ⇒⇒⇒⇒⇒⇒⇒⇒Strengthening the partnership with clients. Strengthening the partnership with clients. Strengthening the partnership with clients. Strengthening the partnership with clients. Strengthening the partnership with clients. Strengthening the partnership with clients. Strengthening the partnership with clients. Strengthening the partnership with clients.
3636363636363636
MeitecMeitecMeitecMeitecMeitecMeitecMeitecMeitecGroupGroupGroupGroupGroupGroupGroupGroup
700700700700700700700700ClientsClientsClientsClientsClientsClientsClientsClients
MeitecMeitecMeitecMeitecMeitecMeitecMeitecMeitec
Needs of 700 ClientsNeeds of 700 ClientsNeeds of 700 ClientsNeeds of 700 ClientsNeeds of 700 ClientsNeeds of 700 ClientsNeeds of 700 ClientsNeeds of 700 Clients
Assign appropriate Assign appropriate Assign appropriate Assign appropriate Assign appropriate Assign appropriate Assign appropriate Assign appropriate engineers by utilizing engineers by utilizing engineers by utilizing engineers by utilizing engineers by utilizing engineers by utilizing engineers by utilizing engineers by utilizing the Best Matching the Best Matching the Best Matching the Best Matching the Best Matching the Best Matching the Best Matching the Best Matching
SystemSystemSystemSystemSystemSystemSystemSystem

Tools to Develop Custom Business Tools to Develop Custom Business Tools to Develop Custom Business Tools to Develop Custom Business Model for Each ClientsModel for Each ClientsModel for Each ClientsModel for Each Clients
Tools to Develop Custom Business Tools to Develop Custom Business Tools to Develop Custom Business Tools to Develop Custom Business Model for Each ClientsModel for Each ClientsModel for Each ClientsModel for Each Clients
3737373737373737
Strategic Rotation of Our EngineersStrategic Rotation of Our EngineersStrategic Rotation of Our EngineersStrategic Rotation of Our EngineersStrategic Rotation of Our EngineersStrategic Rotation of Our EngineersStrategic Rotation of Our EngineersStrategic Rotation of Our Engineers
Customized Training ProgramsCustomized Training ProgramsCustomized Training ProgramsCustomized Training ProgramsCustomized Training ProgramsCustomized Training ProgramsCustomized Training ProgramsCustomized Training Programs
Dispatching a Unit of Young EngineersDispatching a Unit of Young EngineersDispatching a Unit of Young EngineersDispatching a Unit of Young EngineersDispatching a Unit of Young EngineersDispatching a Unit of Young EngineersDispatching a Unit of Young EngineersDispatching a Unit of Young Engineersand Experienced Engineersand Experienced Engineersand Experienced Engineersand Experienced Engineersand Experienced Engineersand Experienced Engineersand Experienced Engineersand Experienced Engineers
Building the Team StructureBuilding the Team StructureBuilding the Team StructureBuilding the Team StructureBuilding the Team StructureBuilding the Team StructureBuilding the Team StructureBuilding the Team Structure
「「「「「「「「MeitecMeitecMeitecMeitecMeitecMeitecMeitecMeitec++++++++Chinese CorporationsChinese CorporationsChinese CorporationsChinese CorporationsChinese CorporationsChinese CorporationsChinese CorporationsChinese Corporations」」」」」」」」
Expanding theExpanding theExpanding theExpanding the MeitecMeitecMeitecMeitec Group by Collaboration Group by Collaboration Group by Collaboration Group by Collaboration Expanding theExpanding theExpanding theExpanding the MeitecMeitecMeitecMeitec Group by Collaboration Group by Collaboration Group by Collaboration Group by Collaboration
3838383838383838
「「「「「「「「MeitecMeitecMeitecMeitecMeitecMeitecMeitecMeitec++++++++JO」JO」JO」JO」JO」JO」JO」JO」TeamTeamTeamTeamTeamTeamTeamTeam
「「「「「「「「MeitecMeitecMeitecMeitecMeitecMeitecMeitecMeitec++++++++JC」JC」JC」JC」JC」JC」JC」JC」TeamTeamTeamTeamTeamTeamTeamTeam
「「「「「「「「MeitecMeitecMeitecMeitecMeitecMeitecMeitecMeitec++++++++JO+JC」JO+JC」JO+JC」JO+JC」JO+JC」JO+JC」JO+JC」JO+JC」TeamTeamTeamTeamTeamTeamTeamTeam
「JO+JC」「JO+JC」「JO+JC」「JO+JC」「JO+JC」「JO+JC」「JO+JC」「JO+JC」TeamTeamTeamTeamTeamTeamTeamTeam

3939393939393939
Expansion the Meitec Group by CollaborationExpansion the Meitec Group by CollaborationExpansion the Meitec Group by CollaborationExpansion the Meitec Group by CollaborationExpansion the Meitec Group by CollaborationExpansion the Meitec Group by CollaborationExpansion the Meitec Group by CollaborationExpansion the Meitec Group by Collaboration
R&DR&DR&DR&DR&DR&DR&DR&DSolutionSolutionSolutionSolutionSolutionSolutionSolutionSolution
MeitecMeitecMeitecMeitecMeitecMeitecMeitecMeitecFTRFTRFTRFTRFTRFTRFTRFTR
IMSIMSIMSIMSIMSIMSIMSIMSJOJOJOJOJOJOJOJO
JCJCJCJCJCJCJCJC3D3D3D3D3D3D3D3D TECTECTECTECTECTECTECTEC
WebWebWebWebWebWebWebWeb--------IIIIIIII
SystemSystemSystemSystemSystemSystemSystemSystemSolutionSolutionSolutionSolutionSolutionSolutionSolutionSolution
CAECAECAECAECAECAECAECAESolutionSolutionSolutionSolutionSolutionSolutionSolutionSolution
Human Human Human Human Human Human Human Human ResourcesResourcesResourcesResourcesResourcesResourcesResourcesResourcesSolutionSolutionSolutionSolutionSolutionSolutionSolutionSolution
4040404040404040
China ProjectChina ProjectChina ProjectChina ProjectChina ProjectChina ProjectChina ProjectChina ProjectChina ProjectChina ProjectChina ProjectChina Project
May 2002May 2002May 2002May 2002May 2002May 2002May 2002May 2002 ::::::::Trial project beganTrial project beganTrial project beganTrial project beganTrial project beganTrial project beganTrial project beganTrial project beganApril 2003April 2003April 2003April 2003April 2003April 2003April 2003April 2003 ::::::::Start of operationsStart of operationsStart of operationsStart of operationsStart of operationsStart of operationsStart of operationsStart of operationsFiscal 2006Fiscal 2006Fiscal 2006Fiscal 2006Fiscal 2006Fiscal 2006Fiscal 2006Fiscal 2006 ::::::::Sales of Sales of Sales of Sales of Sales of Sales of Sales of Sales of ¥¥¥¥¥¥¥¥10 billion10 billion10 billion10 billion10 billion10 billion10 billion10 billion
Japanese Japanese Japanese Japanese Japanese Japanese Japanese Japanese Corporations Corporations Corporations Corporations Corporations Corporations Corporations Corporations (Customers)(Customers)(Customers)(Customers)(Customers)(Customers)(Customers)(Customers)
Meitec Meitec Meitec Meitec Meitec Meitec Meitec Meitec GroupGroupGroupGroupGroupGroupGroupGroup
Chinese Chinese Chinese Chinese Chinese Chinese Chinese Chinese CorporationsCorporationsCorporationsCorporationsCorporationsCorporationsCorporationsCorporations CooperationCooperationCooperationCooperationCooperationCooperationCooperationCooperation
AlliancesAlliancesAlliancesAlliancesAlliancesAlliancesAlliancesAlliances
・・・・・・・・LowLowLowLowLowLowLowLow--------level designlevel designlevel designlevel designlevel designlevel designlevel designlevel design・・・・・・・・Software developmentSoftware developmentSoftware developmentSoftware developmentSoftware developmentSoftware developmentSoftware developmentSoftware development・・・・・・・・Data entryData entryData entryData entryData entryData entryData entryData entry
LowLowLowLowLowLowLowLow--------endendendendendendendend HighHighHighHighHighHighHighHigh--------endendendendendendendend
Receive Receive Receive Receive Receive Receive Receive Receive ordersordersordersordersordersordersordersorders
2003.4.12003.4.12003.4.12003.4.12003.4.12003.4.12003.4.12003.4.1Establishment ofEstablishment ofEstablishment ofEstablishment ofEstablishment ofEstablishment ofEstablishment ofEstablishment ofMeitecMeitecMeitecMeitecMeitecMeitecMeitecMeitec Global SolutionsGlobal SolutionsGlobal SolutionsGlobal SolutionsGlobal SolutionsGlobal SolutionsGlobal SolutionsGlobal Solutions
cost reductioncost reductioncost reductioncost reductioncost reductioncost reductioncost reductioncost reductionserviceserviceserviceserviceserviceserviceserviceservice

4141414141414141
Corporate Alliance Network in ChinaCorporate Alliance Network in ChinaCorporate Alliance Network in ChinaCorporate Alliance Network in ChinaCorporate Alliance Network in ChinaCorporate Alliance Network in ChinaCorporate Alliance Network in ChinaCorporate Alliance Network in China
< < < < < < < <Network with 16 companiesNetwork with 16 companiesNetwork with 16 companiesNetwork with 16 companiesNetwork with 16 companiesNetwork with 16 companiesNetwork with 16 companiesNetwork with 16 companies>>>>>>>>
Alliance conditionsAlliance conditionsAlliance conditionsAlliance conditionsAlliance conditionsAlliance conditionsAlliance conditionsAlliance conditions・・・・・・・・Management policy toward Management policy toward Management policy toward Management policy toward Management policy toward Management policy toward Management policy toward Management policy toward expansion in global business expansion in global business expansion in global business expansion in global business expansion in global business expansion in global business expansion in global business expansion in global business
・・・・・・・・Good human resources in Good human resources in Good human resources in Good human resources in Good human resources in Good human resources in Good human resources in Good human resources in management and engineers management and engineers management and engineers management and engineers management and engineers management and engineers management and engineers management and engineers
・・・・・・・・Good track record with Good track record with Good track record with Good track record with Good track record with Good track record with Good track record with Good track record with Japanese companies Japanese companies Japanese companies Japanese companies Japanese companies Japanese companies Japanese companies Japanese companies
BeijingBeijingBeijingBeijing
HeilongjiangHeilongjiangHeilongjiangHeilongjiang
ShanghaiShanghaiShanghaiShanghai
JapaneseJapaneseJapaneseJapanesecompaniescompaniescompaniescompanies
ZhejiangZhejiangZhejiangZhejiang
GuangdongGuangdongGuangdongGuangdong
Analysis of Engineering Outsourcing MarketAnalysis of Engineering Outsourcing MarketAnalysis of Engineering Outsourcing MarketAnalysis of Engineering Outsourcing MarketAnalysis of Engineering Outsourcing MarketAnalysis of Engineering Outsourcing MarketAnalysis of Engineering Outsourcing MarketAnalysis of Engineering Outsourcing Market
4242424242424242
Engineering Outsourcing MarketEngineering Outsourcing MarketEngineering Outsourcing MarketEngineering Outsourcing MarketEngineering Outsourcing MarketEngineering Outsourcing MarketEngineering Outsourcing MarketEngineering Outsourcing Market: Approx. : Approx. : Approx. : Approx. : Approx. : Approx. : Approx. : Approx. ¥¥425 billion (Estimate)425 billion (Estimate)425 billion (Estimate)425 billion (Estimate)425 billion (Estimate)425 billion (Estimate)425 billion (Estimate)425 billion (Estimate)
Other Staff Outsourcing78%%%%
((((¥425 425 425 425 billion)billion)billion)billion)22%%%%
MeitecMeitecMeitecMeitec GroupGroupGroupGroup
Other Engineering Outsourcing85%%%%
((((¥64.964.964.964.9billion : Ended March 31,2002)billion : Ended March 31,2002)billion : Ended March 31,2002)billion : Ended March 31,2002)
15%15%15%15%
Engineering Outsourcing Market
Staff Outsourcing MarketStaff Outsourcing MarketStaff Outsourcing MarketStaff Outsourcing MarketStaff Outsourcing MarketStaff Outsourcing MarketStaff Outsourcing MarketStaff Outsourcing Market: Approx. : Approx. : Approx. : Approx. : Approx. : Approx. : Approx. : Approx. ¥¥1.9 trillion1.9 trillion1.9 trillion1.9 trillion1.9 trillion1.9 trillion1.9 trillion1.9 trillion
(Source: Ministry of Health, Labor and Welfare(Source: Ministry of Health, Labor and Welfare(Source: Ministry of Health, Labor and Welfare(Source: Ministry of Health, Labor and Welfare(Source: Ministry of Health, Labor and Welfare(Source: Ministry of Health, Labor and Welfare(Source: Ministry of Health, Labor and Welfare(Source: Ministry of Health, Labor and WelfareLabor Statistics, Labor Statistics, Labor Statistics, Labor Statistics, Labor Statistics, Labor Statistics, Labor Statistics, Labor Statistics, Ended March 31,2002Ended March 31,2002Ended March 31,2002Ended March 31,2002))))))))
Market for the China ProjectMarket for the China ProjectMarket for the China ProjectMarket for the China ProjectMarket for the China ProjectMarket for the China ProjectMarket for the China ProjectMarket for the China Project((((((((average rateaverage rateaverage rateaverage rateaverage rateaverage rateaverage rateaverage rate::::::::¥¥¥¥¥¥¥¥3,100/hr)3,100/hr)3,100/hr)3,100/hr)3,100/hr)3,100/hr)3,100/hr)3,100/hr)
--------Strategy to Expand Market ShareStrategy to Expand Market ShareStrategy to Expand Market ShareStrategy to Expand Market ShareStrategy to Expand Market ShareStrategy to Expand Market ShareStrategy to Expand Market ShareStrategy to Expand Market Share--------

4343434343434343
Objectives of the Chinese ProjectObjectives of the Chinese ProjectObjectives of the Chinese ProjectObjectives of the Chinese ProjectObjectives of the Chinese ProjectObjectives of the Chinese ProjectObjectives of the Chinese ProjectObjectives of the Chinese Project
11111111))))))))Achieve an overwhelming share Achieve an overwhelming share Achieve an overwhelming share Achieve an overwhelming share Achieve an overwhelming share Achieve an overwhelming share Achieve an overwhelming share Achieve an overwhelming share in the Japanese market. in the Japanese market. in the Japanese market. in the Japanese market. in the Japanese market. in the Japanese market. in the Japanese market. in the Japanese market.
22222222))))))))Produce more opportunities Produce more opportunities Produce more opportunities Produce more opportunities Produce more opportunities Produce more opportunities Produce more opportunities Produce more opportunities for thefor thefor thefor thefor thefor thefor thefor the MeitecMeitecMeitecMeitecMeitecMeitecMeitecMeitec engineers to participate. engineers to participate. engineers to participate. engineers to participate. engineers to participate. engineers to participate. engineers to participate. engineers to participate.
Composite Business Model of Composite Business Model of Composite Business Model of Composite Business Model of Outplacement and OutsourcingOutplacement and OutsourcingOutplacement and OutsourcingOutplacement and OutsourcingComposite Business Model of Composite Business Model of Composite Business Model of Composite Business Model of
Outplacement and OutsourcingOutplacement and OutsourcingOutplacement and OutsourcingOutplacement and Outsourcing<<<<Manufacturing IndustryManufacturing IndustryManufacturing IndustryManufacturing Industry>>>>
<<<<CustomerCustomerCustomerCustomer>>>>InInInIn----house house house house
mismatching of mismatching of mismatching of mismatching of personnelpersonnelpersonnelpersonnel
((((Candidate forCandidate forCandidate forCandidate forrestructuringrestructuringrestructuringrestructuring))))
ExternalExternalExternalExternalassignmentassignmentassignmentassignment
MeitecMeitecMeitecMeitec((((Best MatchingBest MatchingBest MatchingBest Matching SystemSystemSystemSystem))))
PlacementPlacementPlacementPlacementJapanJapanJapanJapan’ssss
ManufacturersManufacturersManufacturersManufacturers
<<<<Merit for the clients Merit for the clients Merit for the clients Merit for the clients >>>>
・・・・Second career support for personnel who do not fit the immediateSecond career support for personnel who do not fit the immediateSecond career support for personnel who do not fit the immediateSecond career support for personnel who do not fit the immediate needs of their respective companiesneeds of their respective companiesneeds of their respective companiesneeds of their respective companies ・・・・Reduction in personnel expensesReduction in personnel expensesReduction in personnel expensesReduction in personnel expenses
Role of Company A: IntroductionRole of Company A: IntroductionRole of Company A: IntroductionRole of Company A: IntroductionRole ofRole ofRole ofRole of MeitecMeitecMeitecMeitec: Agency services: Agency services: Agency services: Agency services
Second Personnel Second Personnel Second Personnel Second Personnel Department for Department for Department for Department for
Japanese ManufacturersJapanese ManufacturersJapanese ManufacturersJapanese Manufacturers
Company ACompany ACompany ACompany AIntermediaryIntermediaryIntermediaryIntermediary
4444444444444444

・・・・・・・・ Consolidated Net Sales Consolidated Net Sales Consolidated Net Sales Consolidated Net Sales Consolidated Net Sales Consolidated Net Sales Consolidated Net Sales Consolidated Net Sales ::::::::100 billion Yen100 billion Yen100 billion Yen100 billion Yen100 billion Yen100 billion Yen100 billion Yen100 billion Yen
Targeted Group Earnings to be achieved by Targeted Group Earnings to be achieved by Targeted Group Earnings to be achieved by Targeted Group Earnings to be achieved by the end of the fiscal year ending March 31, 2007 the end of the fiscal year ending March 31, 2007 the end of the fiscal year ending March 31, 2007 the end of the fiscal year ending March 31, 2007
Targeted Group Earnings to be achieved by Targeted Group Earnings to be achieved by Targeted Group Earnings to be achieved by Targeted Group Earnings to be achieved by the end of the fiscal year ending March 31, 2007 the end of the fiscal year ending March 31, 2007 the end of the fiscal year ending March 31, 2007 the end of the fiscal year ending March 31, 2007
4545454545454545
・・・・・・・・ Consolidated Operating RatioConsolidated Operating RatioConsolidated Operating RatioConsolidated Operating RatioConsolidated Operating RatioConsolidated Operating RatioConsolidated Operating RatioConsolidated Operating Ratio::::::::15%15%15%15%15%15%15%15%
・・・・・・・・ ROEROEROEROEROEROEROEROE ::::::::1515151515151515%%%%%%%%
MeitecMeitecMeitecMeitecMeitecMeitecMeitecMeitec GroupGroupGroupGroupGroupGroupGroupGroup’’s Missions Missions Missions Missions Missions Missions Missions Mission
4646464646464646
MeitecMeitecMeitecMeitecMeitecMeitecMeitecMeitec GroupGroupGroupGroupGroupGroupGroupGroup’’s mission is to contribute s mission is to contribute s mission is to contribute s mission is to contribute s mission is to contribute s mission is to contribute s mission is to contribute s mission is to contribute to the industries and society by to the industries and society by to the industries and society by to the industries and society by to the industries and society by to the industries and society by to the industries and society by to the industries and society by supporting the optimum use of supporting the optimum use of supporting the optimum use of supporting the optimum use of supporting the optimum use of supporting the optimum use of supporting the optimum use of supporting the optimum use of engineering resource engineering resource engineering resource engineering resource engineering resource engineering resource engineering resource engineering resource as clientas clientas clientas clientas clientas clientas clientas client’’s s s s s s s s alternate engineering division and alternate engineering division and alternate engineering division and alternate engineering division and alternate engineering division and alternate engineering division and alternate engineering division and alternate engineering division and personnel department.personnel department.personnel department.personnel department.personnel department.personnel department.personnel department.personnel department.
Realizing Realizing Realizing Realizing Realizing Realizing Realizing Realizing ““mutual growth and prosperitymutual growth and prosperitymutual growth and prosperitymutual growth and prosperitymutual growth and prosperitymutual growth and prosperitymutual growth and prosperitymutual growth and prosperity””with customers through the establishment with customers through the establishment with customers through the establishment with customers through the establishment with customers through the establishment with customers through the establishment with customers through the establishment with customers through the establishment of a total engineering solutions service of a total engineering solutions service of a total engineering solutions service of a total engineering solutions service of a total engineering solutions service of a total engineering solutions service of a total engineering solutions service of a total engineering solutions service system.system.system.system.system.system.system.system.

Shareholders by Business Segments Shareholders by Business Segments Shareholders by Business Segments Shareholders by Business Segments <Non<Non<Non<Non----Consolidated>Consolidated>Consolidated>Consolidated>
Shareholders by Business Segments Shareholders by Business Segments Shareholders by Business Segments Shareholders by Business Segments <Non<Non<Non<Non----Consolidated>Consolidated>Consolidated>Consolidated>
4747474747474747
ShareholdersShareholdersShareholdersShareholders %%%% Shares HeldShares HeldShares HeldShares Held %%%%
BanksBanksBanksBanks 10101010 0.2%0.2%0.2%0.2% 1,615,9141,615,9141,615,9141,615,914 4.4%4.4%4.4%4.4%
Trust BanksTrust BanksTrust BanksTrust Banks 42424242 0.7%0.7%0.7%0.7% 13,203,80013,203,80013,203,80013,203,800 35.6%35.6%35.6%35.6%Life and non-life insuranceLife and non-life insuranceLife and non-life insuranceLife and non-life insurancecompaniescompaniescompaniescompanies 22222222 0.4%0.4%0.4%0.4% 4,873,4334,873,4334,873,4334,873,433 13.1%13.1%13.1%13.1%
Securities financing and otherSecurities financing and otherSecurities financing and otherSecurities financing and otherfinancial companiesfinancial companiesfinancial companiesfinancial companies 5555 0.1%0.1%0.1%0.1% 48,66048,66048,66048,660 0.1%0.1%0.1%0.1%
Securities companies Securities companies Securities companies Securities companies 20202020 0.3%0.3%0.3%0.3% 402,430402,430402,430402,430 1.1%1.1%1.1%1.1%Business concerns and otherBusiness concerns and otherBusiness concerns and otherBusiness concerns and othercompaniescompaniescompaniescompanies 131131131131 2.2%2.2%2.2%2.2% 773,056773,056773,056773,056 2.1%2.1%2.1%2.1%
Overseas companiesOverseas companiesOverseas companiesOverseas companiesand investorand investorand investorand investor
217217217217 3.6%3.6%3.6%3.6% 12,167,69612,167,69612,167,69612,167,696 32.8%32.8%32.8%32.8%
Individuals and othersIndividuals and othersIndividuals and othersIndividuals and others 5,5395,5395,5395,539 92.5%92.5%92.5%92.5% 4,038,3384,038,3384,038,3384,038,338 10.9%10.9%10.9%10.9%
TotalTotalTotalTotal 5,9865,9865,9865,986 100.0%100.0%100.0%100.0% 37,123,32737,123,32737,123,32737,123,327 100.0%100.0%100.0%100.0%
Shareholder SegmentShareholder SegmentShareholder SegmentShareholder Segment(As of the fiscal year ended March 31, 2003)(As of the fiscal year ended March 31, 2003)(As of the fiscal year ended March 31, 2003)(As of the fiscal year ended March 31, 2003)
��
��
������������������������������������������������������������������������������������������������������������������������������������������������������������������������������������������������������������������������������������������������������������������������������������������������������������������������������������������������������������������
���������������������������������������������������������������������������������������������������������������������������������������������������������������������������������������������������������������������������������������������������������������������������������������������������������������������������������������������������������������������������������������������������������������������������������������������������������������������������������������������������������������������������������������������������
���������������������������������������������������������������������������������������������������������������������������������������������������������������������������������
���������������������������������������������������������������������������������������������������������������������������������������������������������������������������������
�������������
��������������
���
Projections: Fiscal Year Ending March 31, 2004Projections: Fiscal Year Ending March 31, 2004Projections: Fiscal Year Ending March 31, 2004Projections: Fiscal Year Ending March 31, 2004Projections: Fiscal Year Ending March 31, 2004Projections: Fiscal Year Ending March 31, 2004Projections: Fiscal Year Ending March 31, 2004Projections: Fiscal Year Ending March 31, 2004
4848484848484848
(Millions of(Millions of(Millions of(Millions of
Net SalesNet SalesNet SalesNet SalesOperatingOperatingOperatingOperatingIncomeIncomeIncomeIncome
OrdinaryOrdinaryOrdinaryOrdinaryIncomeIncomeIncomeIncome
Net IncomeNet IncomeNet IncomeNet Income
Interim 2004Interim 2004Interim 2004Interim 2004 34,20034,20034,20034,200 5,6005,6005,6005,600 5,6005,6005,6005,600 3,0003,0003,0003,0002003200320032003 31,88831,88831,88831,888 4,1794,1794,1794,179 4,1984,1984,1984,198 2,2342,2342,2342,234
Change (%)Change (%)Change (%)Change (%) 7.2%7.2%7.2%7.2% 34.0%34.0%34.0%34.0% 33.4%33.4%33.4%33.4% 34.3%34.3%34.3%34.3%
Fiscal 20034Fiscal 20034Fiscal 20034Fiscal 20034 69,00069,00069,00069,000 11,70011,70011,70011,700 11,70011,70011,70011,700 6,3006,3006,3006,3002003200320032003 65,73765,73765,73765,737 9,1489,1489,1489,148 9,1799,1799,1799,179 5,4725,4725,4725,472
Change (%)Change (%)Change (%)Change (%) 5.0%5.0%5.0%5.0% 27.9%27.9%27.9%27.9% 27.5%27.5%27.5%27.5% 15.1%15.1%15.1%15.1%
Interim 2004Interim 2004Interim 2004Interim 2004 28,50028,50028,50028,500 5,1005,1005,1005,100 5,3005,3005,3005,300 2,8002,8002,8002,8002003200320032003 26,90126,90126,90126,901 3,7303,7303,7303,730 3,9413,9413,9413,941 2,1592,1592,1592,159
Change (%)Change (%)Change (%)Change (%) 5.9%5.9%5.9%5.9% 36.7%36.7%36.7%36.7% 34.5%34.5%34.5%34.5% 29.6%29.6%29.6%29.6%
Fiscal 2004Fiscal 2004Fiscal 2004Fiscal 2004 57,50057,50057,50057,500 10,50010,50010,50010,500 10,80010,80010,80010,800 5,8005,8005,8005,8002003200320032003 55,37955,37955,37955,379 8,0278,0278,0278,027 8,2488,2488,2488,248 5,0175,0175,0175,017
Change (%)Change (%)Change (%)Change (%) 3.8%3.8%3.8%3.8% 30.8%30.8%30.8%30.8% 30.9%30.9%30.9%30.9% 15.6%15.6%15.6%15.6%
Conso
lidate
dC
onso
lidate
dC
onso
lidate
dC
onso
lidate
dN
on-C
onsolidate
dN
on-C
onsolidate
dN
on-C
onsolidate
dN
on-C
onsolidate
d
���������������������������������������������������������������������������������������������������������������������������������������������������������������������������������������������������������������������������������������������������������������������������������������
��������������������������������������������������������������������������������������������������������������������������������������������������������������������������������������������������������������������������������������������������������
��������������������������������������������������������������������������������������������������������������������������������������������������������������������������������������������������������������������������������������������������������
���������������������������������������������������������������������������������������������������������������������������������������������������������������������������������������������������������������������������������������������������������������������������������������
�������������������������������
��������������������������������������������������������������
��������������������������������������������������������������
�������������������������������

Projections by Company:Projections by Company:Projections by Company:Projections by Company:Fiscal Year Ending March 31, 2004Fiscal Year Ending March 31, 2004Fiscal Year Ending March 31, 2004Fiscal Year Ending March 31, 2004
Projections by Company:Projections by Company:Projections by Company:Projections by Company:Fiscal Year Ending March 31, 2004Fiscal Year Ending March 31, 2004Fiscal Year Ending March 31, 2004Fiscal Year Ending March 31, 2004
4949494949494949
(Millions of Yen)(Millions of Yen)(Millions of Yen)(Millions of Yen)
Net SalesNet SalesNet SalesNet SalesOperatingOperatingOperatingOperatingIncomeIncomeIncomeIncome
OrdinaryOrdinaryOrdinaryOrdinaryIncomeIncomeIncomeIncome
Net IncomeNet IncomeNet IncomeNet Income
MeitecMeitecMeitecMeitec 28,50028,50028,50028,500 5,1005,1005,1005,100 5,3005,3005,3005,300 2,8002,8002,8002,800
Japan OutsourcingJapan OutsourcingJapan OutsourcingJapan Outsourcing 4,0504,0504,0504,050 450450450450 450450450450 250250250250
Japan CastJapan CastJapan CastJapan Cast 1,3301,3301,3301,330 60606060 60606060 30303030
MeiServiceMeiServiceMeiServiceMeiService 130130130130 5555 5555 3333
3D Tec3D Tec3D Tec3D Tec 140140140140 0000 0000 0000
IMSIMSIMSIMS 20202020 0000 0000 0000
Meitec Global SolitionsMeitec Global SolitionsMeitec Global SolitionsMeitec Global Solitions 100100100100 2222 2222 1111
ConsolidatedConsolidatedConsolidatedConsolidated 34,20034,20034,20034,200 5,6005,6005,6005,600 5,6005,6005,6005,600 3,0003,0003,0003,000
MeitecMeitecMeitecMeitec 57,50057,50057,50057,500 10,50010,50010,50010,500 10,80010,80010,80010,800 5,8005,8005,8005,800
Japan OutsourcingJapan OutsourcingJapan OutsourcingJapan Outsourcing 8,1008,1008,1008,100 1,1001,1001,1001,100 1,1001,1001,1001,100 600600600600
Japan CastJapan CastJapan CastJapan Cast 2,7502,7502,7502,750 130130130130 130130130130 75757575
MeiServiceMeiServiceMeiServiceMeiService 260260260260 10101010 10101010 5555
3D Tec3D Tec3D Tec3D Tec 300300300300 10101010 10101010 5555
IMSIMSIMSIMS 140140140140 20202020 20202020 10101010
Meitec Global SolitionsMeitec Global SolitionsMeitec Global SolitionsMeitec Global Solitions 190190190190 3333 3333 2222
ConsolidatedConsolidatedConsolidatedConsolidated 69,00069,00069,00069,000 11,70011,70011,70011,700 11,70011,70011,70011,700 6,3006,3006,3006,300
InterimInterimInterimInterimPeriodPeriodPeriodPeriod
FiscalFiscalFiscalFiscalYearYearYearYear
��������������������������������������������������������������������������������������������������������������������������������������������������������������������������������������������������������������������������������������������������������������������������������������������������������������������������������������������������������������������������������������������������������������������������������������������������������������������������������������������������������������������������������������������
����������������������������������������������������������������������������������������������������������������������������
����������������������������������������������������������������������������������������������������������������������������������������������������������������������������������������������������������������������������������������������������������������������������������������������������������������������������������������������������������������������������������������������������������������������������������������������������������������������������������������������������������������������������������������������������������������������������������������������������������������������������������������������������������������������������������������������������������������������������������������������������������������������������������������������������
������������������������������������������������������������������������������������
����������������������������
������������������������������������������������������������������������������������
��������������������������������������������������������
Presuppositions for the Performance ProjectionsPresuppositions for the Performance ProjectionsPresuppositions for the Performance ProjectionsPresuppositions for the Performance Projections<Non<Non<Non<Non----consolidated>consolidated>consolidated>consolidated>
For the fiscal year ending March 31, 2004 For the fiscal year ending March 31, 2004 For the fiscal year ending March 31, 2004 For the fiscal year ending March 31, 2004
Presuppositions for the Performance ProjectionsPresuppositions for the Performance ProjectionsPresuppositions for the Performance ProjectionsPresuppositions for the Performance ProjectionsPresuppositions for the Performance ProjectionsPresuppositions for the Performance ProjectionsPresuppositions for the Performance ProjectionsPresuppositions for the Performance Projections<Non<Non<Non<Non<Non<Non<Non<Non--------consolidated>consolidated>consolidated>consolidated>consolidated>consolidated>consolidated>consolidated>
For the fiscal year ending March 31, 2004 For the fiscal year ending March 31, 2004 For the fiscal year ending March 31, 2004 For the fiscal year ending March 31, 2004 For the fiscal year ending March 31, 2004 For the fiscal year ending March 31, 2004 For the fiscal year ending March 31, 2004 For the fiscal year ending March 31, 2004
5050505050505050
11111111. . . . . . . . Operating Ratio (Average)Operating Ratio (Average)Operating Ratio (Average)Operating Ratio (Average)Operating Ratio (Average)Operating Ratio (Average)Operating Ratio (Average)Operating Ratio (Average)First Half : 94.9%First Half : 94.9%First Half : 94.9%First Half : 94.9%Second Half : 97.1% Fiscal Year : 96.0%Second Half : 97.1% Fiscal Year : 96.0%Second Half : 97.1% Fiscal Year : 96.0%Second Half : 97.1% Fiscal Year : 96.0%
22222222. Assignment of . Assignment of . Assignment of . Assignment of . Assignment of . Assignment of . Assignment of . Assignment of New GraduateNew GraduateNew GraduateNew GraduateNew GraduateNew GraduateNew GraduateNew Graduate: 100% (Projected for September 31, 2003) : 100% (Projected for September 31, 2003) : 100% (Projected for September 31, 2003) : 100% (Projected for September 31, 2003) : 100% (Projected for September 31, 2003) : 100% (Projected for September 31, 2003) : 100% (Projected for September 31, 2003) : 100% (Projected for September 31, 2003)
33333333. Hours of Operation. Hours of Operation. Hours of Operation. Hours of Operation. Hours of Operation. Hours of Operation. Hours of Operation. Hours of Operation 9.189.189.189.189.189.189.189.18hhhhhhhh////////DayDayDayDayDayDayDayDay((((((((averageaverageaverageaverageaverageaverageaverageaverage))))))))
44444444. . . . . . . . Rate RevisionRate RevisionRate RevisionRate RevisionRate RevisionRate RevisionRate RevisionRate Revision:1.3% increase in rate per hour compared to previous year:1.3% increase in rate per hour compared to previous year:1.3% increase in rate per hour compared to previous year:1.3% increase in rate per hour compared to previous year:1.3% increase in rate per hour compared to previous year:1.3% increase in rate per hour compared to previous year:1.3% increase in rate per hour compared to previous year:1.3% increase in rate per hour compared to previous year
5.5.5.5.5.5.5.5.MidMidMidMidMidMidMidMid--------career hiring during the fiscal year : 60 engineers career hiring during the fiscal year : 60 engineers career hiring during the fiscal year : 60 engineers career hiring during the fiscal year : 60 engineers career hiring during the fiscal year : 60 engineers career hiring during the fiscal year : 60 engineers career hiring during the fiscal year : 60 engineers career hiring during the fiscal year : 60 engineers

Initiatives to Increase Capital EfficiencyInitiatives to Increase Capital EfficiencyInitiatives to Increase Capital EfficiencyInitiatives to Increase Capital EfficiencyInitiatives to Increase Capital EfficiencyInitiatives to Increase Capital EfficiencyInitiatives to Increase Capital EfficiencyInitiatives to Increase Capital EfficiencyInitiatives to Increase Capital EfficiencyInitiatives to Increase Capital EfficiencyInitiatives to Increase Capital EfficiencyInitiatives to Increase Capital Efficiency
5151515151515151
Retirement of Retirement of Retirement of Retirement of Retirement of Retirement of Retirement of Retirement of ¥¥¥¥¥¥¥¥7,000 million of common stock7,000 million of common stock7,000 million of common stock7,000 million of common stock7,000 million of common stock7,000 million of common stock7,000 million of common stock7,000 million of common stock
in fiscal 2004, ending March 31, 2004in fiscal 2004, ending March 31, 2004in fiscal 2004, ending March 31, 2004in fiscal 2004, ending March 31, 2004in fiscal 2004, ending March 31, 2004in fiscal 2004, ending March 31, 2004in fiscal 2004, ending March 31, 2004in fiscal 2004, ending March 31, 2004
Establishment in November 2002 of Establishment in November 2002 of Establishment in November 2002 of Establishment in November 2002 of Establishment in November 2002 of Establishment in November 2002 of Establishment in November 2002 of Establishment in November 2002 of ¥¥¥¥¥¥¥¥6,0006,0006,0006,0006,0006,0006,0006,000 million commitment linemillion commitment linemillion commitment linemillion commitment linemillion commitment linemillion commitment linemillion commitment linemillion commitment line
Amendment of cash position in NovemberAmendment of cash position in NovemberAmendment of cash position in NovemberAmendment of cash position in NovemberAmendment of cash position in NovemberAmendment of cash position in NovemberAmendment of cash position in NovemberAmendment of cash position in November 2002 from 2002 from 2002 from 2002 from 2002 from 2002 from 2002 from 2002 from ¥¥¥¥¥¥¥¥15,000 million to 15,000 million to 15,000 million to 15,000 million to 15,000 million to 15,000 million to 15,000 million to 15,000 million to ¥¥¥¥¥¥¥¥12,000 million12,000 million12,000 million12,000 million12,000 million12,000 million12,000 million12,000 million