CORPORATE GOVERNANCE, RISK MANAGEMENT, FIRM ...
209
CORPORATE GOVERNANCE, RISK MANAGEMENT, FIRM CHARACTERISTICS AND FINANCIAL PERFORMANCE OF COMMERCIAL BANKS IN KENYA BY ONDIGO HERICK OCHIENG D80/8526/2003 A THESIS SUBMITTED IN PARTIAL FULFILMENT OF THE REQUIREMENTS FOR THE AWARD OF THE DEGREE OF DOCTOR OF PHILOSOPHY IN BUSINESS ADMINISTRATION, SCHOOL OF BUSINESS, UNIVERSITY OF NAIROBI NOVEMBER, 2016
Transcript of CORPORATE GOVERNANCE, RISK MANAGEMENT, FIRM ...

CORPORATE GOVERNANCE, RISK MANAGEMENT, FIRM
CHARACTERISTICS AND FINANCIAL PERFORMANCE OF
COMMERCIAL BANKS IN KENYA
BY
ONDIGO HERICK OCHIENG
D80/8526/2003
A THESIS SUBMITTED IN PARTIAL FULFILMENT OF THE
REQUIREMENTS FOR THE AWARD OF THE DEGREE OF
DOCTOR OF PHILOSOPHY IN BUSINESS ADMINISTRATION,
SCHOOL OF BUSINESS, UNIVERSITY OF NAIROBI
NOVEMBER, 2016

ii
DECLARATION
I declare that this PhD research thesis is my original work and has not been previously
submitted in part or in totality to any other university for an award of a degree. All
material referred to have been dully acknowledged.
Signature…………………………………………….Date………………………………
ONDIGO HERICK OCHIENG
D80/8526/2003
This PhD research thesis has been submitted for examination with our approval as the
University Supervisors:
Signature……………………………………………………Date…………………
PROF. JOSIAH O ADUDA
Department of Finance and Accounting
School of Business, University of Nairobi
Signature……………………………………………………Date……………………
PROF. ERASMUS S KAIJAGE
Department of Finance and Accounting
School of Business, University of Nairobi
Signature……………………………………………………Date…………………
DR. CYRUS I MWANGI
Department of Finance and Accounting
School of Business, University of Nairobi

iii
COPYRIGHT
All rights reserved. Accordingly, no part of this thesis may be used or reproduced in any
form by any means, or stored in any database or retrieval system, without prior written
permission of the author or University of Nairobi on that behalf except in the case of
brief quotations embodied in reviews, articles and research papers.
Making copies of any part of this thesis for any purpose other than personal use is a
violation of the Kenyan and international laws.
©hondigo2016
By Ondigo Herick Ochieng

iv
AKNOWLEDGEMENTS
I wish to thank the Almighty God for the gift of life and good health to undertake and
complete the PhD programme. My most sincere acknowledgements goes to my inspiring
and dedicated supervisors: Prof. Josiah Omollo Aduda, Prof. Erasmus Shubi Kaijage and
Dr. Cyrus Mwangi Iraya for their patience, constructive criticisms and guidance
throughout the study.
I am deeply indebted to my colleagues and staff in the department of Finance and
Accounting for their unwavering support, inspiration and encouragement throughout the
journey. I wish to specifically appreciate the members of staff of the School of Business
and UoN who made suggestions, resourceful contributions and critiques during the
presentations and interactions at various forums including departmental, open forum,
doctoral studies committee and finally oral defence stage.
My sincere appreciation goes to the University of Nairobi for granting me the fee waiver
that to pursue and complete the PhD programme without financial strain. Special thanks
to Eunice, Ruth, Fredrick and Chris for assistance with data collection and typesetting of
the work. Chris particularly went out his way to ensure quality work within very strict
deadlines. Your inputs were most valuable and sincerely appreciated.
Last but not least, I am extremely grateful to the support of my wife Martha and children
Jackie Germaine, Terry Val and Mannu Barry for their understanding and encouragement
to keep on keeping on. There are many days I would hibernate into my study room for
long hours, compromising on my parental role, yet you appreciated without complaint.
Special appreciation to my extended family for the moral support and encouragement to
reach this far. To all friends, relatives and colleagues not specifically mentioned, accept
my sincere gratitude for the contribution made towards the successful completion of this
thesis.
MAY GOD BLESS YOU ALL

v
DEDICATION
I dedicate this PhD thesis to:
My nuclear family
Wife Martha; Daughters- Jackie Germaine & Terry Val; Son -Mannu Barry.
&
My parents Regina Ondigo and the late Helekia Ondigo (who never lived long enough to
see this dream)
&
My Uncle and academic mentor the late Jackson Onyango.
For the inspiration, mentorship and encouragement to seek and attain the highest levels
in Academia.
.
vi
TABLE OF CONTENTS
DECLARATION .......................................................................................... ii
COPYRIGHT ............................................................................................... iii
AKNOWLEDGEMENTS ........................................................................... iv
DEDICATION ............................................................................................... v
LIST OF TABLES ....................................................................................... xi
LIST OF FIGURES .....................................................................................xv
LIST OF ABBREVIATIONS AND ACRONYMS ................................. xvi
ABSTRACT .............................................................................................. xviii
CHAPTER ONE ............................................................................................ 1
INTRODUCTION ......................................................................................... 1
1.1.1 Corporate Governance .................................................................................. 3
1.1.2 Risk Management .......................................................................................... 4
1.1.3 Firm Characteristics ...................................................................................... 5
1.1.4 Financial Performance .................................................................................. 6
1.1.5 Interactions among Corporate Governance, Risk Management, Firm
Characteristics and Bank Financial Performance ......................................... 8
1.1.6 Commercial Banks in Kenya ........................................................................ 9
CHAPTER TWO .........................................................................................19
LITERATURE REVIEW ...........................................................................19
1.1 Background of the Study ................................................................................... 1
1.2 Research Problem ............................................................................................ 12
1.3 Research Questions .......................................................................................... 15
1.4 Research Objectives ........................................................................................ 15
1.5 Value of the Study ........................................................................................... 16
1.6 Organization of the Thesis ............................................................................... 16

vii
2.2.1 Agency Theory ............................................................................................ 19
2.2.2 Stewardship Theory ................................................................................... 21
2.2.3 Stakeholder Theory ..................................................................................... 23
2.2.4 Transaction Cost Theory ............................................................................. 25
2.3.1 Relationship between Corporate Governance and Financial Performance . 26
2.3.2 Relationships among Corporate Governance, Risk Management and
Financial Performance ................................................................................ 29
2.3.3 Relationships among Corporate Governance, Firm Characteristics and
Financial Performance ................................................................................ 33
2.3.4 The Relationships among Corporate Governance, Risk Management, Firm
Characteristics and Financial Performance ................................................. 36
CHAPTER THREE .....................................................................................47
RESEARCH METHODOLOGY ...............................................................47
3.2.1 Positivism: ................................................................................................... 48
3.2.2 Realism ....................................................................................................... 49
3.2.3 Interpretivism ............................................................................................. 50
3.2.4 Pragmatism .................................................................................................. 51
3.3.1 Exploratory Research Design ..................................................................... 53
3.3.2 Descriptive Research Design ...................................................................... 54
3.3.3 Explanatory Research Design ..................................................................... 54
2.1 Introduction ..................................................................................................... 19
2.2 Theoretical Review .......................................................................................... 19
2.3 Empirical Literature Review ............................................................................ 26
2.4 Summary of Research Gaps ............................................................................. 37
2.5 Conceptual Framework ................................................................................... 43
2.6 Conceptual Hypotheses .................................................................................... 46
3.1 Introduction ..................................................................................................... 47
3.2 Research Philosophy ....................................................................................... 47
3.3 Research Design............................................................................................... 53
viii
3.6.1 Independence Test ....................................................................................... 57
3.6.2 Linearity ...................................................................................................... 58
3.6.3 Multicollinearity Test ................................................................................. 58
3.6.4 Heteroscedasticity Test ............................................................................... 58
3.6.5 Multivariate Normality Test ........................................................................ 59
3.8.1 Corporate Governance and Bank Financial Performance ........................... 64
3.8.2 Corporate Governance, Risk Management and Bank Financial Performance
..................................................................................................................... 65
3.8.3 Corporate Governance, Firm Characteristics and Bank Financial
Performance ................................................................................................ 67
3.8.4 Corporate Governance, Firm Characteristics, Risk Management and Bank
Financial Performance ................................................................................ 68
CHAPTER FOUR .......................................................................................71
DESCRIPTIVE ANALYSIS AND RESULTS ..........................................71
4.3.1 Financial Performance Panel Data Independence Test ............................... 75
4.3.2 Financial Performance Panel Data Linearity Test ...................................... 76
4.3.3 Financial Performance Panel Data Multicollinearity Test ......................... 78
4.3.4 Financial Performance Panel Data Heteroscedasticity Test ........................ 79
4.3.5 Financial Performance Panel Data Normality Test ..................................... 82
4.3.6 Risk Management Panel Data Independence Test ...................................... 83
4.3.7 Risk Management Panel Data Linearity Test .............................................. 84
4.3.8 Financial Management Panel Data Multicollinearity Test .......................... 84
4.3.10 Risk Management Panel Data Heteroscedasticity Test ............................... 86
4.3.11 Risk Management Panel Data Normality Test ............................................ 89
3.4 Population ........................................................................................................ 56
3.5 Data Collection ................................................................................................ 56
3.6 Diagnostic Tests ............................................................................................... 57
3.7 Operationalization and Measurement of the Study Variables ......................... 59
3.8 Data Analysis ................................................................................................... 63
4.1 Introduction ...................................................................................................... 71
4.2 Descriptive Statistics ........................................................................................ 71
4.3 Diagnostic Tests of Statistical Assumptions .................................................... 75
ix
4.3.16 Corporate Governance Panel Data Heteroscedasticity Test ....................... 92
4.3.16 Corporate Governance Panel Data Normality Test .................................... 95
4.3.17 Firm Characteristics Panel Data Independence Test ................................. 96
4.3.19 Firm Characteristics Panel Data Multicollinearity Test ............................. 97
4.3.20 Firm Characteristics Panel Data Heteroscedasticity Test .......................... 98
4.3.21 Firm Characteristics Panel Data Normality Test ..................................... 102
4.3.22 Summary Statistics of the Diagnostic Tests ............................................. 102
4.4.1 Correlation between Corporate Governance and Composite Financial
Performance .............................................................................................. 105
4.4.2 Correlation between Corporate Governance and Risk Management ........ 106
4.4.3 Correlation between Risk Management and Financial Performance ........ 107
4.4.4 Correlation between Corporate Governance, Risk Management and Firm
Characteristics ........................................................................................... 108
CHAPTER FIVE .......................................................................................110
HYPOTHESIS TESTING AND DISCUSSION OF FINDINGS ..........110
5.6.1 The Influence Corporate Governance on Bank Financial Performance ... 157
5.6.2 The Effect of Risk Management on the Relationship between Corporate
Governance and Bank Financial Performance ........................................ 160
5.6.3 The Moderating Effect of Firm Characteristics on the Relationship between
Corporate Governance and Bank Financial Performance ....................... 163
5.6.4 Joint Effect of Corporate Governance, Risk Management and Firm
Characteristics on Bank Financial Performance ....................................... 165
4.4. Correlation Analysis ............................................................................................ 104
5.1 Introduction ................................................................................................... 110
5.2 The Effect of Corporate Governance on Bank Financial Performance ......... 110
5. 3 Intervening Effect Risk Management on the Relationship between Corporate
Governance and Bank Financial Performance ............................................... 120
5.4 Moderating Effect of Firm Characteristics on the Relationship between
Corporate Governance and Bank Financial Performance .............................. 136
5.5 Joint Effect of Corporate Governance, Risk Management and Firm
Characteristics on Bank Financial Performance ............................................ 146
5.6 Discussion of the Hypotheses Tests and Research Findings ......................... 156
5.7 Summary of Research Findings ..................................................................... 166

x
CHAPTER SIX ..........................................................................................166
SUMMARY, CONCLUSIONS AND RECOMMENDATIONS ...........166
6.4.1 Contribution to Knowledge ....................................................................... 171
6.4.2 Contributions to Policy and Practice ......................................................... 173
6.4.3 Contribution to Theory .............................................................................. 175
REFERENCES ..........................................................................................178
APPENDICES ............................................................................................187
6.1 Introduction .................................................................................................... 166
6.2 Summary ........................................................................................................ 166
6.3 Conclusions .................................................................................................... 169
6.4 Contributions of the Study ............................................................................. 170
6.5 Limitations of the Study................................................................................. 176
6.6 Suggestions for Future Research ................................................................... 177
xi
LIST OF TABLES
Table 2.1: Summary of Empirical Literature Review and Research Gaps ....................... 39
Table 3.1: Major Elements of Research Philosophies ...................................................... 48
Table 3.2: Comparison of Research Philosophies used in Management Research .......... 52
Table 3.3: Degree of Uncertainty and Research Design ................................................... 55
Table 3.4: Operationalization and Measurement of Variables ......................................... 61
Table 3.5: Objectives, Hypothesis, Analytical Model and Interpretation of Results ....... 69
Table 4.1: Financial Performance Descriptive Statistics .................................................. 72
Table 4.2: Risk Management Descriptive Statistics ......................................................... 72
Table 4.3: Corporate Governance Descriptive Statistics .................................................. 73
Table 4.4: Firm Characteristics Descriptive Statistics ...................................................... 73
Table 4.5: Summary Statistics of the Diagnostic Tests .................................................... 74
Table 4.6: Results of Financial Performance Independence Test ..................................... 76
Table 4.7: Results of Financial Performance Linearity ANOVA Test ............................. 77
Table 4.8: Results of Financial Performance Multicollinearity Test ................................ 78
Table 4.9: Test of Homogeneity of Variances for Financial Performance Data .............. 82
Table 4.10: Normality Test for Financial Performance Data ........................................... 82
Table 4.11: Results of Risk Management Linearity ANOVA Test .................................. 83
Table 4.12: Results of Risk Management Linearity Data ANOVA Test ......................... 84
Table 4.13: Results of Risk Management Linearity Data ANOVA Test ......................... 85
Table 4.14: Test of Homogeneity of Variances for Risk Management data .................... 88
Table 4.15: Normality test for Risk Management data ..................................................... 89
Table 4.16: Results of Corporate Governance Panel Data Independence Test ................ 90
xii
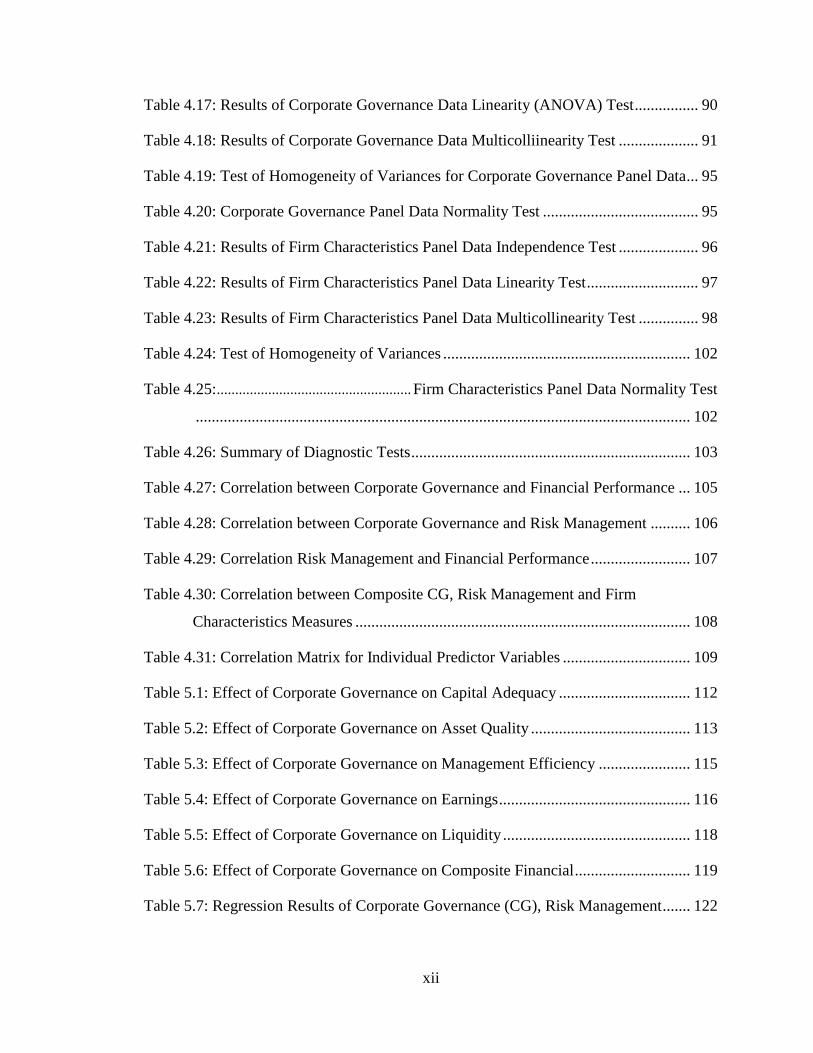
Table 4.17: Results of Corporate Governance Data Linearity (ANOVA) Test ................ 90
Table 4.18: Results of Corporate Governance Data Multicolliinearity Test .................... 91
Table 4.19: Test of Homogeneity of Variances for Corporate Governance Panel Data ... 95
Table 4.20: Corporate Governance Panel Data Normality Test ....................................... 95
Table 4.21: Results of Firm Characteristics Panel Data Independence Test .................... 96
Table 4.22: Results of Firm Characteristics Panel Data Linearity Test ............................ 97
Table 4.23: Results of Firm Characteristics Panel Data Multicollinearity Test ............... 98
Table 4.24: Test of Homogeneity of Variances .............................................................. 102
Table 4.25: ..................................................... Firm Characteristics Panel Data Normality Test
............................................................................................................................ 102
Table 4.26: Summary of Diagnostic Tests ...................................................................... 103
Table 4.27: Correlation between Corporate Governance and Financial Performance ... 105
Table 4.28: Correlation between Corporate Governance and Risk Management .......... 106
Table 4.29: Correlation Risk Management and Financial Performance ......................... 107
Table 4.30: Correlation between Composite CG, Risk Management and Firm
Characteristics Measures .................................................................................... 108
Table 4.31: Correlation Matrix for Individual Predictor Variables ................................ 109
Table 5.1: Effect of Corporate Governance on Capital Adequacy ................................. 112
Table 5.2: Effect of Corporate Governance on Asset Quality ........................................ 113
Table 5.3: Effect of Corporate Governance on Management Efficiency ....................... 115
Table 5.4: Effect of Corporate Governance on Earnings ................................................ 116
Table 5.5: Effect of Corporate Governance on Liquidity ............................................... 118
Table 5.6: Effect of Corporate Governance on Composite Financial ............................. 119
Table 5.7: Regression Results of Corporate Governance (CG), Risk Management ....... 122
xiii
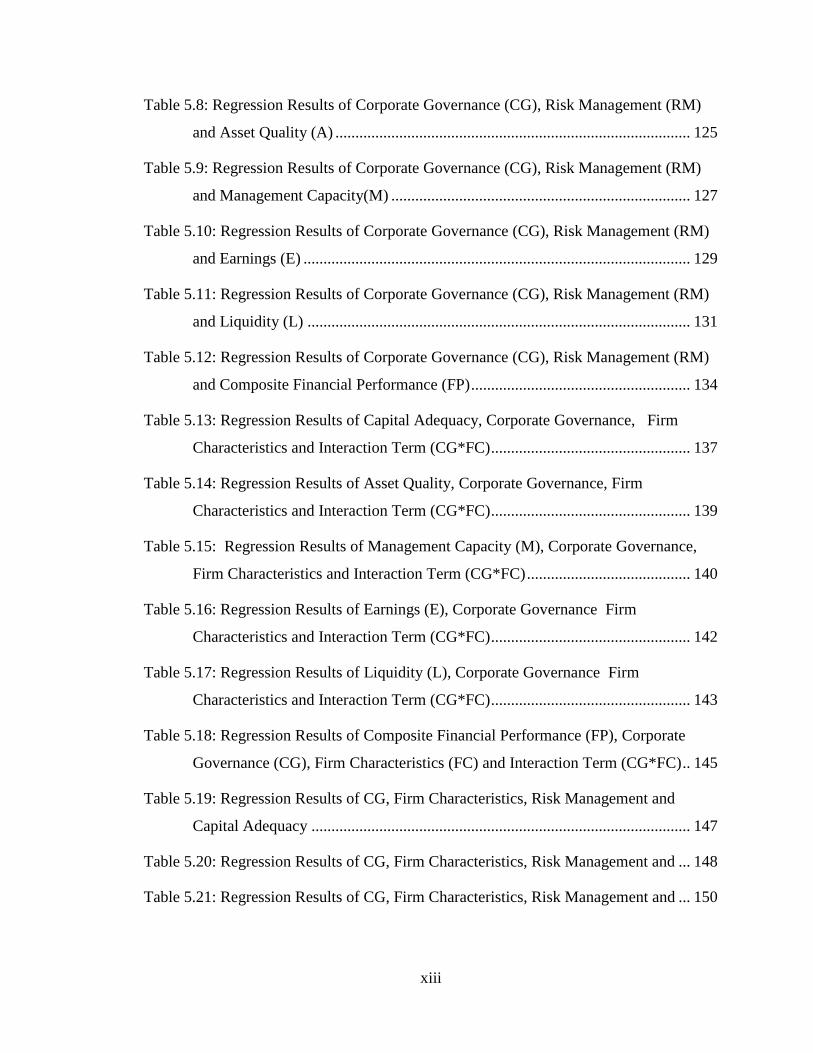
Table 5.8: Regression Results of Corporate Governance (CG), Risk Management (RM)
and Asset Quality (A) ......................................................................................... 125
Table 5.9: Regression Results of Corporate Governance (CG), Risk Management (RM)
and Management Capacity(M) ........................................................................... 127
Table 5.10: Regression Results of Corporate Governance (CG), Risk Management (RM)
and Earnings (E) ................................................................................................. 129
Table 5.11: Regression Results of Corporate Governance (CG), Risk Management (RM)
and Liquidity (L) ................................................................................................ 131
Table 5.12: Regression Results of Corporate Governance (CG), Risk Management (RM)
and Composite Financial Performance (FP) ....................................................... 134
Table 5.13: Regression Results of Capital Adequacy, Corporate Governance, Firm
Characteristics and Interaction Term (CG*FC) .................................................. 137
Table 5.14: Regression Results of Asset Quality, Corporate Governance, Firm
Characteristics and Interaction Term (CG*FC) .................................................. 139
Table 5.15: Regression Results of Management Capacity (M), Corporate Governance,
Firm Characteristics and Interaction Term (CG*FC) ......................................... 140
Table 5.16: Regression Results of Earnings (E), Corporate Governance Firm
Characteristics and Interaction Term (CG*FC) .................................................. 142
Table 5.17: Regression Results of Liquidity (L), Corporate Governance Firm
Characteristics and Interaction Term (CG*FC) .................................................. 143
Table 5.18: Regression Results of Composite Financial Performance (FP), Corporate
Governance (CG), Firm Characteristics (FC) and Interaction Term (CG*FC) .. 145
Table 5.19: Regression Results of CG, Firm Characteristics, Risk Management and
Capital Adequacy ............................................................................................... 147
Table 5.20: Regression Results of CG, Firm Characteristics, Risk Management and ... 148
Table 5.21: Regression Results of CG, Firm Characteristics, Risk Management and ... 150

xiv
Table 5.22: Regression Results of CG, Firm Characteristics, Risk Management and
Earnings .............................................................................................................. 152
Table 5.23: Regression Results of CG, Firm Characteristics, Risk Management and
Liquidity ............................................................................................................. 153
Table 5.24: Regression Results of CG, Firm Characteristics, Risk Management and
Composite Bank Financial Performance ............................................................ 155
Table 5.25: Summary of Results of Hypothesis Testing Relating to Objective One ..... 159
Table 5.26: Summary of Results of Hypothesis Testing Relating to Objective Two ..... 162
Table 5.27: Summary of Results of Hypothesis Testing Relating to Objective Three ... 164
Table 5.28: Summary of Results of Hypothesis Testing Relating to Objective Four ..... 166
Table 5.29: Summary of Research Objectives, Hypotheses Results and Test Results ... 168

xv
LIST OF FIGURES
Figure 2.1: Conceptual Model .......................................................................................... 45
Figure 4.1: Histogram of the Residuals of Financial Performance Data .......................... 79
Figure 4.2: Scatterplot of the Residuals of Financial Performance Variable ................... 80
Figure 4.3: Normal P-P Plot of Regression Standardized Residual of Financial
Performamnce Data .............................................................................................. 81
Figure 4.4: Histogram of the Residuals of Risk Management Data ................................. 86
Figure 4.5: Normal P-P Plot of Regression Standardized Residual of Risk Management
Data ....................................................................................................................... 87
Figure 4.6: Scatterplot the Residuals of Financial Performance Data .............................. 88
Figure 4.7: Histogram of the Residuals of Corporate Governance Data .......................... 92
Figure 4.8: Normal P-P Plot of Regression Standardized Residual of Corporate
Governance Data .................................................................................................. 93
Figure 4.9: Scatterplot the Residuals of Corporate Governance data ............................... 94
Figure 4.10: Histogram of the Residuals of Firm Characteristics Data ............................ 99
Figure 4.11: Normal P-P Plot of Regression Standardized Residual of Firm
Characteristics Data ............................................................................................ 100
Figure 4.12: Scatterplot the Residuals of Firm Characteristics Data .............................. 101

xvi
LIST OF ABBREVIATIONS AND ACRONYMS
ASX: Australian Securities Exchange
BoD: Board of Directors
BRR: Business Risk Ratio
CAR: Capital Adequacy Ratio
CBK: Central Bank of Kenya
CCC: Cash Claim on Central Bank
CCG: Centre for Corporate Governance
CDS: Credit Default Swap
CEO: Chief Executive Officer
COSO: Committee of Sponsoring Organizations
CPD: Continuous Professional Development
EAS: Egyptian Accounting Standards
EGX: Egyptian Stock Exchange
ERM: Enterprise Risk Management
EVA: Economic Value Added
FAI: Fixed Assets and Inventories to Capital
GCC: Gulf Cooperation Council
GDP: Gross Domestic Product
ICT: Information and Communication Technology
LCR: Liquidity Coverage Ratio
LLP: Loan Loss Provision
MCCG: Malaysian Code of Corporate Governance

xvii
NED: Non-Executive Directors
NIM: Net Interest Margin
NPL: Non Performing Loans
NPM: Net Profit Margin
P/BV: Price-to-Book Value
P/ER: Price-Earnings Ratio
ROA: Return on Assets
ROE: Return on Equity
SCR: Secondary Reserve Ratio
USA: United States of America
VARR: Value at Risk Ratio
xviii
ABSTRACT
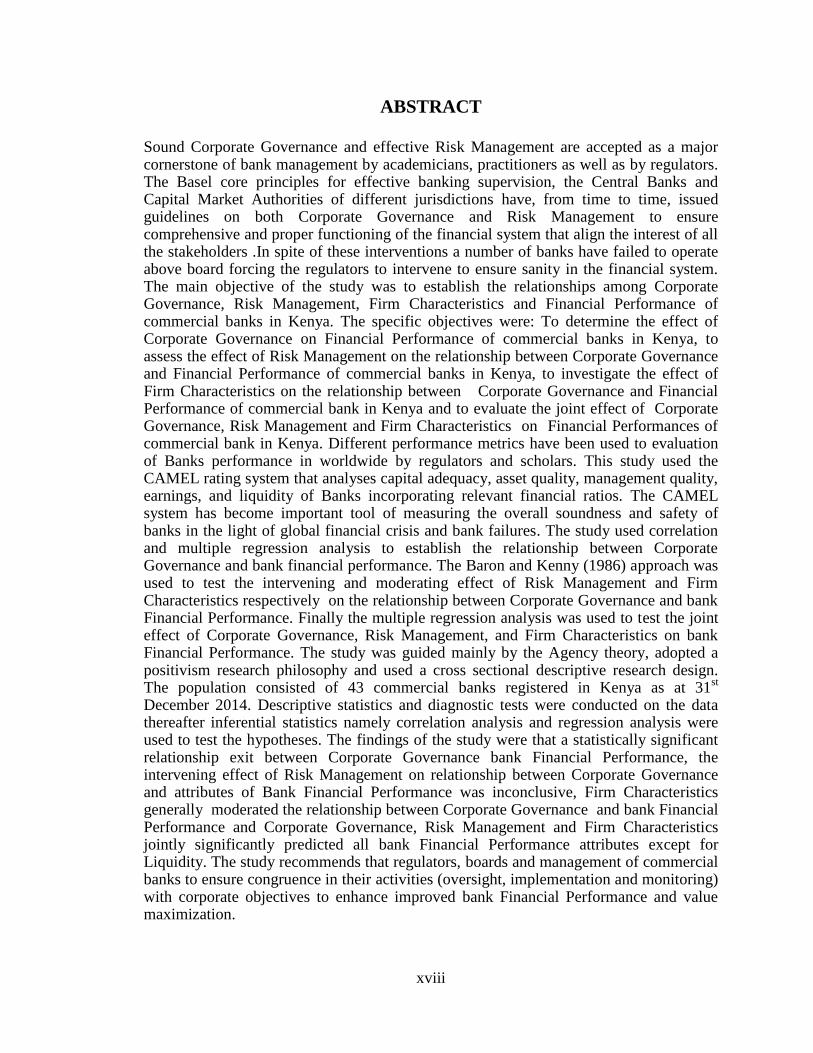
Sound Corporate Governance and effective Risk Management are accepted as a major cornerstone of bank management by academicians, practitioners as well as by regulators. The Basel core principles for effective banking supervision, the Central Banks and Capital Market Authorities of different jurisdictions have, from time to time, issued guidelines on both Corporate Governance and Risk Management to ensure comprehensive and proper functioning of the financial system that align the interest of all the stakeholders .In spite of these interventions a number of banks have failed to operate above board forcing the regulators to intervene to ensure sanity in the financial system. The main objective of the study was to establish the relationships among Corporate Governance, Risk Management, Firm Characteristics and Financial Performance of commercial banks in Kenya. The specific objectives were: To determine the effect of Corporate Governance on Financial Performance of commercial banks in Kenya, to assess the effect of Risk Management on the relationship between Corporate Governance and Financial Performance of commercial banks in Kenya, to investigate the effect of Firm Characteristics on the relationship between Corporate Governance and Financial Performance of commercial bank in Kenya and to evaluate the joint effect of Corporate Governance, Risk Management and Firm Characteristics on Financial Performances of commercial bank in Kenya. Different performance metrics have been used to evaluation of Banks performance in worldwide by regulators and scholars. This study used the CAMEL rating system that analyses capital adequacy, asset quality, management quality, earnings, and liquidity of Banks incorporating relevant financial ratios. The CAMEL system has become important tool of measuring the overall soundness and safety of banks in the light of global financial crisis and bank failures. The study used correlation and multiple regression analysis to establish the relationship between Corporate Governance and bank financial performance. The Baron and Kenny (1986) approach was used to test the intervening and moderating effect of Risk Management and Firm Characteristics respectively on the relationship between Corporate Governance and bank Financial Performance. Finally the multiple regression analysis was used to test the joint effect of Corporate Governance, Risk Management, and Firm Characteristics on bank Financial Performance. The study was guided mainly by the Agency theory, adopted a positivism research philosophy and used a cross sectional descriptive research design. The population consisted of 43 commercial banks registered in Kenya as at 31
st
December 2014. Descriptive statistics and diagnostic tests were conducted on the data thereafter inferential statistics namely correlation analysis and regression analysis were used to test the hypotheses. The findings of the study were that a statistically significant relationship exit between Corporate Governance bank Financial Performance, the intervening effect of Risk Management on relationship between Corporate Governance and attributes of Bank Financial Performance was inconclusive, Firm Characteristics generally moderated the relationship between Corporate Governance and bank Financial Performance and Corporate Governance, Risk Management and Firm Characteristics jointly significantly predicted all bank Financial Performance attributes except for Liquidity. The study recommends that regulators, boards and management of commercial banks to ensure congruence in their activities (oversight, implementation and monitoring) with corporate objectives to enhance improved bank Financial Performance and value maximization.
1
CHAPTER ONE
INTRODUCTION
1.1 Background of the Study
Financial institutions exist to mobilize resources from savers to borrowers and thereby
improve the efficiency of the financial markets. If savers and investors as well as buyers
and sellers, could locate each other efficiently, purchase any, and all assets, at no
transaction cost, and make their decisions with freely available perfect information, then
commercial banks would have little or no scope for replacing or mediating these direct
transactions. In the real world, market participants seek the services of commercial banks
because of the banks‟ ability to provide market knowledge, transaction efficiency, and
contract enforcement. Commercial banks discover, underwrite, and service investments
made using their own resources, or merely act as agents for market participants who
contract them to obtain some of these services. In the process of undertaking such noble
duties banks face a number of risks that must be managed prudently to ensure
sustainability and success (Oldfield & Santomero, 1995).
According to Khan and Ahmed (2001), the survival and success of a financial
organization depends critically on the efficiency of Risk Management. Due to their
involvement in the financial intermediation process Corporate Governance, Risk
Management and Financial Performance are important concepts in ensuring stability in
the financial system and the economy in general. Poor Risk Management and weak
Corporate Governance systems in the banking sector can lead to contagion effect, which
would affect a class of banks or even the entire financial system and the economy.
2
Weaknesses in corporate governance and risk management were the main contributing
factors in both the Asian and the global financial crises.
By virtue of the relationship that exists between commercial banks and their stakeholders,
the stakeholders have a duty to ensure that the bank is managed well. Stakeholders must
exert influence in all areas of the health of commercial banks. Empirical findings on the
effect of Corporate Governance on bank Risk Management have received mixed results
from different researchers. For example, Jensen (1993) hypothesize that stakeholders in
the Corporate Governance of banks impact how banks manage risks, while Simpson and
Gleason (1999) and Prowse (1997) argue that stakeholders in the Corporate Governance
do not have significant impact on Risk Management.
The complexity of Corporate Governance and Risk Management was articulated in a
report prepared by the United States Senate‟s Permanent Subcommittee investigating the
collapse of Enron which stated in part as follows “based on an exhaustive review of
evidence found, the Enron corporation‟s board of directors failed to monitor, ensure or
halt abuse, sometimes the board chose to ignore problems, other times it knowingly
allowed Enron to engage in high risk practices, the board also approved an unprecedented
arrangement, in so doing, the board breached its duties to safeguard Enron shareholders”,
(Rosen, 2003).
Theoretically, Corporate Governance and Risk Management are mechanisms of aligning
the interests of all the stakeholders in order to achieve corporate goals. Agency theory
(Jensen & Meckling, 1976) argue that the separation of ownership from control creates a
situation in which conflicts of interests naturally arise and as such the agents have to be

3
monitored and controlled to align their interests with those of the principals. Stewardship
theory (Donaldson, 1990) on the other hand contend that agents are faithful custodians of
the principals and therefore there is no need for monitoring and controls as agents work
faithfully in the interests of the principals. Stakeholder theory (Freeman, 1989)
acknowledges that there are several parties that have an interest (stake) in the financial
health of an entity and the role of management is to ensure a balance in the interest of all
stakeholders.
1.1.1 Corporate Governance
Council (2007) defines Corporate Governance as the framework of rules, relationships,
systems and processes, within and by which authority is exercised and controlled in
corporations. It encompasses the mechanisms by which companies, and those in control,
are held to account. Effective Corporate Governance structures thus encourage
companies to create value, through entrepreneurialism, innovation, development and
exploration, and provide accountability and control systems commensurate with the risks
involved.
Nambiro (2007) define Corporate Governance as the mechanisms used to align the
interests of the executives with those of the shareholders including, but not limited to,
boards of directors, executive compensation, and active use of ownership prerogatives by
large shareholders, like institutional investors, and the market for corporate control, like
acquisitions. Whether regulation substitutes or complements traditional governance
mechanisms and controls is a subject of debate, however it is generally agreed that the

4
external controls coming from takeovers and product-market competition turn out to be
weaker in banks than in other firms (Prowse, 1997).
The Banking Act (Cap. 488) defines Corporate Governance as the manner in which the
business and affairs of an institution are governed by its board and senior management
and provides the structure through which the objectives of the company are set, and the
means of attaining those objectives and monitoring performance are determined. The Act
states further that good Corporate Governance should provide proper incentives for the
board and management to pursue objectives that are in the interests of the institution and
its shareholders, facilitate effective monitoring and define how an institution sets
corporate objectives, including generating economic returns to owners; runs the day-to-
day operations of the business; considers the interests of recognized stakeholders; aligns
corporate activities and behaviours with the expectation that the institution will operate in
a safe and sound manner, and in compliance with applicable laws and regulations; and
protects the interests of depositors.
1.1.2 Risk Management
Cumming and Hirtle (2001) define Risk Management as the overall process that a
financial institution follows to define a business strategy, to identify the risks to which it
is exposed, to quantify those risks, and to understand and control the nature of risks it
faces. Risk Management therefore refers to the process of identification, analysis and
either acceptance or mitigation of uncertainty in investment decision-making (Cumming
& Hirtle, 2001).
5
Parreñas (2005) states that robust Risk Management practices in the banking sector are
important for both financial stability and economic development. Unsound Risk
Management practices governing bank lending greatly contributed to the recent episodes
of financial turmoil. The development of adequate capacity to measure and manage risks
is therefore important for banks to effectively perform their roles in financing economic
activities, most especially the task of continuously providing credit to a large number of
enterprises whose activities underpin economic growth. The problem of Risk
Management in the banking industry involves identification, measurement and control of
five major risks namely liquidity risk, interest rate risk, market risk, credit risk and
operational risk (Lukic, 2015).
1.1.3 Firm Characteristics
Firm Characteristics are distinguishing features or attributes of an entity that can
influence its performance. Aaccording to Bauwhede and Willekens (2008), the most
common firm attributes include size and leverage. Ownership structure is also a key firm
characteristic that influence Corporate Governance in firms (Jensen & Meckling, 1976).
Eng and Mak (2003) have identified other Firm Characteristics to include industry type,
growth opportunities, analyst following, stock price performance, profitability, stock
volatility, audit fee, audited by Big5/ Big4 audit firm, overseas listing, equity market
liquidity, short term accrual, non-common law, change in stock price, political
connection , reserves, product diversification, geographical diversification, market to
book equity ratio, listing status, equity financing, liquidity, and high quality of accounting

6
standard. The influence of these attributes on firm Financial Performance has received
mixed results from previous scholars.
1.1.4 Financial Performance
According to Simerly and Li (2000), measuring firm performance has been a major
challenge for scholars and practitioners. Performance is a multidimensional construct
and thus, any single index may not be able to provide a comprehensive understanding of
the performance relationship relative to the constructs of interest (Chakravathy, 1986).
Kaplan and Norton (1996) , in their balanced score card (BSC) model, suggest a
framework of translating vision and strategy into shareholder value by focusing on the
four drivers of value including financial, customer, learning & growth and finally internal
business processes perspectives. They however argue that Financial Performance metric
is the ultimate outcome measure for company success.
Khrawish (2011) state that there are a multitude of measures used to assess bank
performance, with each group of stakeholders having its own focus of interest.
Academicians and practitioners generally use three types of performance measures
including traditional, economic and market-based. Traditional performance measures
include return on equity (the ratio of income after taxes divided by total common equity
capital); return on assets (the ratio of net income to average total asset); cost-to-income
ratio (ratio of operating expenses to operating income generated) and net interest margin
(net interest income divided by total earnings assets)
7
The economic measures of performance, identified by Khrawish (2011), include
economic value added (the surplus value created by a firm in its existing environment);
cash flow return on investment (the percentage return made by a firm on its existing
investments) and risk-adjusted return on capital (the ratio of risk adjusted return to
economic capital). The market-based measures of performance are total shareholder
returns (combines share price appreciation and dividends paid to show the total return to
the shareholder expressed as an annualized percentage); the price-earnings Ratio (the
ratio for valuing a company that measures its current share price relative to its per-share
earnings); the price-to-book value (relates the market value of stockholders‟ equity to its
book value) and the credit default swap (derivative used to hedge credit risk or to take a
position on a basket of credit entities).
The most widely used Financial Performance tool for financial institutions by the
principal regulators all around the world is the CAMEL rating (Kabir & Dey, 2012).
CAMEL is considered as one of the most widely used tools for judging Capital
Adequacy, Asset Quality, Management Capacity, Earnings Ability, and Liquidity of the
financial institution. CAMEL rating system is generally used by the Government and
commercial bank regulators for the purpose of assessing the soundness of a saving
associations and banks (Siems & Barr, 1998)
The applicability of the CAMEL rating system for evaluating financial strengths of
commercial banks has grown internationally and several studies have been conducted to
examine whether, and to what extent, private supervisory information is useful in
8
supervisory monitoring of banks (Kabir & Dey, 2012). Barker and Holdsworth (1993)
found evidence that CAMEL ratings were useful to predicting banks failure, even after
controlling a wide range of publicly available information about the condition and
performance of banks. Cole and Gunther (1998) found that CAMEL rating contain useful
information for predicting bank failure.
1.1.5 Interactions among Corporate Governance, Risk Management,
Firm Characteristics and Bank Financial Performance
The Triangle Model, developed by Tandelilin, Kaaro and Mahadwartha (2007), states
that Corporate Governance can influence the performance of banks either directly or
indirectly through the regulation of Risk Management. Through the implementation of
effective Corporate Governance mechanisms, the stakeholders of banks are able to
enhance the market creditability and thereby be able to raise capital at both lower cost as
well as lower risk level. As a consequence, banks that implement good Corporate
Governance are likely to report better Financial Performance. Bank Financial
Performance and Risk Management therefore depend on the implementation of good
Corporate Governance. The trade-off between risk-bearing and return earning therefore
influences both bank Financial Performance and Risk Management.
Prudent Risk Management improves the Financial Performance of banks and better
Financial Performance leads to an increase in bank reputation which allows banks to
enjoy lower cost of risky capital and other sources of fund. A study by Jiang, Feng and
Zhang (2012) found a positive relationship between Corporate Governance and bank
Financial Performance. Similarly, Black, Jang and Kim (2006) found a positive influence

9
of Corporate Governance on bank Financial Performance in Korea. Beasley, Clune and
Hermanson (2005) found that for entities in the banking, education, and insurance
industries, the stage of enterprise risk management (ERM) implementation was positively
related to the presence of a chief risk officer, board independence, chief executive officer
(CEO) and chief finance officer (CFO) apparent support for ERM, the presence of a big
four auditor and entity size. Abate (2014) found that Corporate Governance, as measured
by board meeting frequency, negatively impacted on both credit and liquidity risks.
The influence of Firm Characteristics on Risk Management, Corporate Governance or
bank Financial Performance has equally been investigated by scholars. Boateng, Huang
and Kufuor (2015) examined the determinants of bank Financial Performance and found
that foreign banks appeared to have better Asset Quality and overall Financial
Performance although lower profitability compared to domestic banks. The study also
found that state-owned banks tended to be more profitable and had better Liquidity
position compared with other domestic banks and foreign banks. Phuong, Harvie and
Arjomandi (2015) found that state-owned banks were more efficient and had a smaller
technology gap compared with foreign and private banks.
1.1.6 Commercial Banks in Kenya
According to the Central Bank of Kenya (CBK) Bank Supervision Annual Report 2014,
as at 31 December 2014, the Kenyan banking sector comprised of the Central Bank as the
regulator, 44 banking institutions (43 commercial banks and one mortgage finance
institution), 8 representative offices of foreign banks, 9 microfinance banks, 2 credit

10
reference bureaus, 13 money remittance providers and 87 foreign exchange bureaus. Out
of the 44 banking institutions 30 were locally owned (comprising 3 with public
shareholding), 27 were privately owned while 14 were foreign owned. The microfinance
banks, credit reference bureaus, money remittance providers and foreign exchange
bureaus were all privately owned. (Retrieved from https://www.centralbank.go.ke).
Commercial banks play an important role in the economy of a country. The main
functions of commercial banks include the provision of a safe place for clients to keep
their money by accepting money deposited by customers and making the money
accessible to customers when the need arises. They facilitate convenient transfer of
money from one account to another which is useful to customers when making payment
directly into another account (Retrieved from https://www.centralbank.go.ke).
Commercial banks offer lending services in form of loans to customers who need the
money. They offer foreign exchange services by selling foreign currencies to the
customers at the market value of the currency and also offer exchange of currencies to the
customers. They provide assistance to traders dealing in international trade by providing
statement of credit worthiness and acting as the collateral for the trader to secure a deal.
They offer other services including investment services by selling their own shares or
shares of other companies to their customers. They provide financial advice to their
customer on the best business practices to engage in when asking for a loan to start a
business and also provide customers with the best payment plan. They keep valuable
items for customers including title deeds and expensive jewelry. They offer their

11
customers advice on taxation matters by proving information useful when
preparing/filling tax returns and finally they act as trustees by managing the property of
the deceased on behalf of the family thus preventing wrangles from destroying the
profitability of the business or estate left by a deceased (retrieved from
https://www.centralbank.go.ke).
The banking industry in Kenya is regulated by the CBK Act (Cap 491), Banking Act
(Cap 488), Companies Act (Cap 486), as well as the prudential guidelines issued by the
CBK. The principal objectives of the CBK are formulation and implementation of
monetary policy directed to achieving and maintaining stability in general level of prices
in Kenya, fostering liquidity/solvency and proper functioning of stable market-based
financial system. In effect the CBK enforces prudent Risk Management and Corporate
Governance in the banking industry in Kenya.
According to Prowse (1997), Corporate Governance in the banking sector is significantly
different from corporations in other economic sectors since there is a conflict of interest
between shareholders and depositors, with the former being willing to take high-risk
projects that increase share value at the expense of the increased risk for latter. Although
small bank deposits are insured and banks are regulated to avoid crisis of confidence and
bank runs, this can increase the moral hazard problem. Macey and O'hara (2003) argue
that commercial banks pose unique Corporate Governance problems for managers and
regulators, as well as for claimants on the banks' cash flows, such as investors and
depositors. They supports the general principle that fiduciary duties should be owed
12
exclusively to shareholders but in the special case of banks, the scope of the fiduciary
duties and obligations of officers and directors should be broadened to include creditors.
Naushad and Malik (2015) argue that the structure of the governance of banks remains
unique in nature since unlike other corporations, banks carry a special responsibility to
take care of people‟s money as well as maintain trust among the other stakeholders.
Therefore, banks need to be more accountable and transparent.
1.2 Research Problem
Corporate Governance, Risk Management, Bank Characteristics and Financial
Performance are significant concepts among commercial banks due to their involvement
in the financial intermediation process. Acknowledging this, several interventions, legal
regulatory, have been undertaken to address weaknesses in Risk Management and
Corporate Governance mechanisms in commercial banks. The Basel Committee on
Banking Supervision adopted several accords. In 1988, the Basel I was issued focusing
on credit/default risk. In 2004, Basel II was issued on guidelines on capital adequacy,
Risk Management and disclosure requirements and in finally 2010, the Basel III issued
accord to promote a more resilient banking system by focusing on four vital banking
parameters that is; capital, leverage, funding and liquidity. To address weaknesses in
Corporate Governance and Risk Management practices of commercial banks in Kenya,
the CBK has issued several prudential guidelines, created of the Kenya Deposit Insurance
Corporation (formerly Deposit Protection Fund) and made changes in both CBK Act
(Cap 491) and the Banking Act (Cap 488) including progressively raising the minimum

13
core capital requirement (to Ksh2 billion, by December 2017, Ksh3.5 billion by
December 2018, and finally Ksh5 billion by December 2019)
The recent wave of corporate scandals leading to resignations/convictions of CEOs in
several corporations (Petrobras, 2015; Toshiba,2015; Mumias Sugar, 2015; CMC Motors,
2011; Fannie Mae, 2011; Lehman Brothers, 2008; WorldCom, 2002 ;Enron 2001, among
others) has led to increased interest and attention from regulators, academicians and
researchers on the governance practices among corporation. The increased media
coverage has turned transparency, managerial accountability, Corporate Governance
failures, weak boards of directors, hostile takeovers, protection of minority shareholders,
and investor activism into household phrases.
Regardless of the interventions internationally and locally, Kenya has witnessed several
cases of weaknesses in Risk Management and poor Corporate Governance practices
among commercial banks resulting into receivership/statutory management and
liquidation. A chronology of bank failures in Kenya include; Rural Urban Credit Finance
(1984), Continental Bank of Kenya and Continental Credit Finance Ltd (1986), Capital
Finance (1987), Post Bank Credit (1993), Euro bank (2003), Daima bank (2003) and
Charterhouse Bank (2006). In 2015 Dubai bank was put under receivership and
ultimately closed. In October 2015, Imperial bank was placed under statutory
management and in April 2016, Chase bank was put under receivership and later
reopened under KCB oversight. In the all these cases the regulator cited liquidity, Risk
Management and Corporate Governance problems in the banks.

14
There are conflicts in Agency, Stewardship and Stakeholder theories. Heracleous (2001)
states “researches have failed to find any convincing connection between the best
practices in Corporate Governance and organizational performance”. Some studies find
significant relationships between Corporate Governance and firm performance
(Rosenstein & Wyatt, 1990; Yermack, 1996; Tandelilin et al. 2007; Brown and Caylor,
2004), while others find no relationship (Fosberg, 1989; Bhagat & Black, 2002). The
influence of Risk Management as well as Firm Characteristics on Financial Performance
is equally inconclusive. While Brinkmann and Horvitz (1995) document a negative
relationship between Risk Management and Financial Performance, other studies report
positive relationships (Peek & Rosengren, 1995; Smith Jr., 1995; Ndung‟u, 2013). Some
studies find that Firm Characteristics are related to performance (Morck, Shleifer &
Vishny, 1988; Chantapong, 2005 Olweny & Shipho, 2011; Ongore & Kusa, 2013) while
others find that Firm Characteristics are unrelated to firm performance (Himmelberg,
Hubbard & Palia, 1999; Mang‟unyi, 2011).
Methodologically previous empirical researches that have focused mainly on the direct
effect of Corporate Governance on Financial Performance with limited studies testing the
intervening and moderating effect of Risk Management and Firm Characteristics. Further
the previous studies have tended to focus on one aspect of bank Financial Performance
(Earnings) ignoring other components of the CAMEL model that comprehensively
evaluates bank Financial and managerial Performance. The research question was: What
are the relationships among Corporate Governance, Risk Management, Firm
Characteristics and Financial Performance of commercial banks in Kenya?

15
1.3 Research Questions
The study addressed the following specific research questions:
i. Does Corporate Governance significantly affect the Financial Performance of
commercial banks in Kenya?
ii. Does Risk Management significantly affect the relationship between Corporate
Governance and Financial Performance of commercial banks in Kenya?
iii. Do Firm Characteristics significantly affect the relationship between Corporate
Governance and Financial Performance of commercial banks in Kenya?
iv. Do Corporate Governance, Risk Management and Firm Characteristics jointly
significantly affect Financial Performance of commercial banks in Kenya?
1.4 Research Objectives
The general objective of the study was to establish the relationships among Corporate
Governance, Risk Management, Firm Characteristics and Financial Performance of
commercial banks in Kenya. The specific objectives were to:
i. To determine the effect of Corporate Governance on Financial Performance of
commercial banks in Kenya.
ii. To assess the effect of Risk Management on the relationship between Corporate
Governance and Financial Performance of commercial banks in Kenya.
iii. To investigate the effect of Firm Characteristics on the relationship between
Corporate Governance and Financial Performance of commercial bank in Kenya.
iv. To evaluate the joint effect of Corporate Governance, Risk Management and
Firm Characteristics on Financial Performances of commercial bank in Kenya.

16
1.5 Value of the Study
This study makes contribution to the conflicting corporate finance theories by empirically
analysing the relationships among Corporate Governance, Risk Management, Firm
Characteristics and bank Financial Performance. It would help resolve the conflicts in
theories that document contradictory propositions on the effects of Corporate Governance
and Risk Management on Financial Performance such as Agency, Stewardship and
Stakeholder theories.
The findings of this study makes contribution to policy and practice by improving
understanding the mechanisms through which Corporate Governance influence bank
Financial Performance. Policy makers can develop guidelines to be implemented by
commercial bank in Corporate Governance and Risk Management to improve Financial
Performance. Practitioners can adopt best practices in Risk Management and Corporate
Governance that maximize the shareholder value.
This study makes contributions to future research by empirically testing the relationships
among Corporate Governance, Risk Management, Firm Characteristics and bank
Financial Performance. The findings of this study provide room for further studies on the
concepts in Kenya and beyond.
1.6 Organization of the Thesis
The thesis is divided into six chapters: introduction; literature review; research
methodology; descriptive data analysis and results; hypotheses testing and discussion of

17
findings; and finally summary, conclusions and recommendations. Chapter one
introduces the four concepts of the study: Corporate Governance, Risk Management,
Firm Characteristics and Financial Performance. A contextual discussion of commercial
banks in Kenya is then provided which leads to the research problem, research questions
and research objectives. The chapter concludes with a discussing on the value of the
study as well as justification of the research.
Chapter two brings out the theoretical literature underpinning the study. The theories are
Agency theory (Jensen & Meckling, 1976), Stewardship theory (Donaldson, 1990),
Stakeholder theory (Freeman, 1989) and Transaction cost theory (Cyert & March 1963).
The chapter further provides a discussion on the empirical literature, summary of
empirical studies and research gaps identified. A conceptual framework and model,
together with the conceptual hypotheses to be tested are provided at the end of the
chapter.
Chapter three presents the research methodology used in the study including research
philosophy, research design, population, data collection, diagnostic tests of statistical
assumptions, operationalization and measurement of the variables and data analysis.
Chapter four covers the descriptive statistics and results. The chapter presents the
descriptive statics (minimum, maximum, mean, standard deviation, skewness and
kurtosis), diagnostic tests (linearity, normality, collinearity, independence and
heteroscadasticity) and finally analysis of the correlation among the variables.

18
Chapter five encompasses hypothesis testing and results. It presents the tests and results
of the four hypotheses (and sub hypotheses) as well as a discussion of the research
findings. The hypotheses test the direct linkage between Corporate Governance and bank
Financial Performance, the intervening effect of Risk Management on the relationship
between Corporate Governance and bank Financial Performance, the moderating effect
of Firm Characteristics on the relationship between Corporate Governance and bank
Financial Performance, and finally the joint effect of Corporate Governance, Risk
Management and Firm Characteristics on bank Financial Performance. Chapter six
focuses on summary, conclusions, contribution to knowledge, policy, practice, theory
limitations of the study and suggestions for future research.
19
CHAPTER TWO
LITERATURE REVIEW
2.1 Introduction
This chapter reviews theoretical and empirical literature relevant to the study. It identifies
the research gaps, develops a conceptual framework, conceptual model and the research
hypotheses.
2.2 Theoretical Review
There are several theories that explain the relationship between Corporate Governance
and bank Financial Performance namely Agency theory (Jensen & Meckling, 1976) the
Stewardship theory (Donaldson, 1990), Stakeholder theory (Freeman, 1989) and
Transaction cost theory (Cyert & March, 1963).These theories are discussed below.
2.2.1 Agency Theory
The theory (also called principal-agent theory), was originally proposed by Ross (1973)
to explain relationships between two parties (such as those between an employer and its
employees, between organizational executives and shareholders, and between buyers and
sellers) whose goals are not congruent with each other. The theory was expounded by
Jensen and Meckling (1976) who argue that the separation of ownership from control
creates an agency problem whereby managers operate the firm aligned with their own
interests, and not those of shareholders. This creates opportunities for managers to spend
firm resources for the maximization of their own utilities rather than those of the
shareholders. Agency conflicts may arise among shareholders versus bondholders,

20
shareholders and independent auditors, shareholders and Government, dominant versus
minority shareholders, as well management and subordinates.
In the field of corporate Risk Management, agency issues have been shown to influence
managerial decisions towards risk taking and hedging (Smith & Stulz, 1985). According
to Mayers and Smith (1987), the theory can explain the mismatch of interest between
shareholders, management and debt holders due to asymmetries in earning distribution,
which can result in the firm taking too much risk or not engaging in positive net value
projects. Consequently, Agency theory implies defining hedging policies that impact on
firm value. Jensen (1993) argues that the role of managers as agents for stakeholders is
full of conflict of interest which can affect asset selection, firm behaviour, efficiency and
performance.
Agency theory is concerned with resolving two problems that can occur in agency
relationships. The first problem arises when the desires or goals of the principal and agent
conflict and the second problem arises when it is difficult or expensive for the principal
to verify what the agent is actually doing. Based on this theory, prudent Corporate
Governance mechanisms align interests of directors and managers with those of
shareholders , translate into efficient Risk Management strategies which, combined with
optimal Firm Characteristics translates into better Financial Performance and returns to
the stakeholders. In agency relationships , the key role of the Non-Executive Directors
in Corporate Governance include among others scrutinising the performance of
management in meeting agreed goals and objectives, monitoring the reporting of
performance as well as satisfying themselves on the integrity of financial information
21
and that financial controls and systems of risk management are robust and defensible .
Thus effective involvement of Nonexecutive board members can greatly improve Risk
Management and Financial Performance.
2.2.2 Stewardship Theory
The theory was developed by Donaldson in 1990. It holds that there is no conflict of
interest between managers and owners, and that the goal of governance is, precisely, to
find the mechanisms and structure that facilitate the most effective coordination between
the two parties (Donaldson, 1990). In contrast to Agency theory, Stewardship theory,
regard managers as good stewards, who are willing to sacrifice their self- interests and act
in the best interests of the shareholders (Donaldson & Davis, 1991). Managers are
therefore concerned with identifying the situational and psychological factors that align
their interests with those of the principals. Davis, Schoorman and Donaldson (1997),
argue that the behaviour of stewards is pro-organizational and it produces higher utility
than self-serving behaviour. They argue that stewards protect and maximize shareholders
wealth through firm performance, because by so doing, the stewards‟ utility functions are
maximized.
In the stewardship theory, the „model of man‟ is someone whose behaviour is ordered
such that pro-organizational behaviours have higher utility than individualistic
behaviours (Davis et al., 1997). The steward is considered rational as well, but perceives
greater utility in cooperative behaviours rather than in self-serving behaviours. A
steward‟s utility function is maximized when the shareholders‟ wealth is maximized. The
steward perceives that the utility gained from interest alignment and collaborative

22
behaviour with the principal is higher than the utility that can be gained through
individualistic, self-serving behaviours (Davis et al., 1997).
Stewardship theory focus on intrinsic rewards that are not easily quantified (such as
growth, achievement, and duty), while Agency theory places more emphasis on extrinsic
motivation (Donaldson & Davis. 1991). Unlike Agency theory, Stewardship theory focus
not on the perspective of individualism, but rather on the role of top management being
as stewards, integrating their goals as part of the organization. Stewards are therefore
satisfied and motivated when organizational success is attained.
The theory is relevant to this study since if directors and managers act as stewards, then
Corporate Governance and Risk Management practices would all be geared towards
ensuring a proper balance of power among directors and corporate management to ensure
their behaviours, decisions and actions are aligned with the interests of the principals.
This implies that directors and manager who are willing to sacrifice their self- interests
and act in the best interests of the shareholders would generate better Financial
Performance and returns to the shareholders. Stewards seek to achieve the goals of the
corporations, so their behaviour is not conflict with the interests of organization.
Stewards generally protect and take care of the needs of others. In commercial banks the
CEOs and managers protect the interests of the owners or shareholders and make
decisions on their behalf with the main objective being creation and maintenance of
successful organizations to prosper shareholders. Commercial banks that embrace the
23
stewardship theory would generally combine the role of the CEO and Chairman under
one executive.
2.2.3 Stakeholder Theory
The theory was developed by Freeman (1989) who defines a stakeholder as any group or
individual who can affect or is affected by the achievement of the organization‟s
objectives. Accordingly, shareholders are but one of a number of important stakeholder
groups. According to stakeholder theory, just like business owes special and particular
duties to its investor; it also has different duties to the various stakeholder groups. The
firm and its managers have special obligations to ensure that the shareholders receive a
fair return on their investment, but the firm also has special obligations to other
stakeholders, which goes above and beyond those required by law (Freeman, 1989).
Therefore stakeholder theory provides a new insight into possible rationale for Risk
Management.
Dao and Giang (2012) contend that the affected parties in a company can be divided into
two main groups; internal and external stakeholders. Internal stakeholders comprises of
executives, board of directors and employees while the external ones comprises of
customers, suppliers, debt creditors, trade creditors and shareholders. All these
stakeholders are involved in managing the process of the firm‟s performance in different
ways with different purposes. They argue that the three parties that affect the
performance of the corporation directly and substantially are shareholders, board of
directors and executive board. These stakeholders are mainly the ones in charge of
controlling the firm to assure that all the set-up goals of the business will be achieved.
24
The argument that shareholders are just another stakeholder group is not one that is
supported by the corporate law in most economies. In Kenya for example, the Companies
Act (Cap 486) gives prominent status to shareholders as the owners of the firm. They
elect all, or most of the members of board of directors, which in turn have the right to hire
and fire senior executives and approve or reject important policies and strategies of the
firm. In effect, the shareholders have the right to treat the firm as a vehicle to maximize
the return on their investment. While the board is supposed to ensure that the firm respect
legal and contractual obligations to other stakeholders, it is also fully within its rights to
instruct managers to consider the ultimate purpose of the firm to be the maximization of
profits and shareholder value (Freeman, 1989).
The stakeholder theory is relevant to the study as it focuses explicitly on equilibrium of
stakeholder interest as the main determinant of corporate policy, whether in Risk
Management, Corporate Governance or Financial Performance. As the theory states; the
business owes special and particular duties to its investor but it also has different duties to
the various stakeholder groups. The firm and its managers have special obligations to
ensure that the shareholders receive a fair return on their investment; but the firm also has
special obligations to other stakeholders. Thus the Corporate Governance and Risk
Management functions have special obligations to ensure that the shareholders receive a
fair return on their investment while at the same time ensuring the firm satisfies the
obligations to the other stakeholders.

25
2.2.4 Transaction Cost Theory
This theory was originated by Cyert and March (1963) and later expounded by
Williamson (1996) as an interdisciplinary alliance of law, economics and organizations.
According to this theory firms are viewed as organizations comprising people with
different views and objectives. The theory assumes that firms become so large such that
in effect they substitute for the market in determining the optimal allocation of scarce
economic resources.
The argument of the theory is that the organization and structure of a firm can determine
price and production of goods and services in the society. It suggests that the combination
of people with transaction creates managers with opportunities to arrange firms
„transactions to their interests (Williamson, 1996). The relevance of the theory to the
study is that since commercial banks comprise people (Directors, managers, employees
and other shareholders) with different views and objectives and the fact that managers
can arrange transactions to their interest, there ought to be an optimal mechanism of
allocation of the scarce resources through Corporate Governance and Risk Management
to ensure Financial Performance is enhanced. The most promising contribution to Risk
Management is the extension of implicit contracts theory from employment to other
contracts, including sales and financing (Cornell & Shapiro, 1987).
Transaction cost theory is applicable to Corporate Governance by viewing it as an
alternative to the agency relationship by describing Corporate Governance as being based
on the net effects of internal and external transactions, rather than as contractual
26
relationships with parties outside the firm (like with shareholders). Transaction cost
theory and agency theory essentially deal with the same issues and problems. Where
agency theory focuses on the individual agent, transaction cost theory focuses on the
individual transaction. Whereas Agency theory looks at the tendency of directors to act
in their own best interests, pursuing salary and status, the Transaction cost theory
considers that managers (or directors) may arrange transactions in an opportunistic way.
Just like Agency theory, Transaction cost theory focus on effective and efficient
accomplishment of transactions by firms rather the protection of ownership rights of
shareholders.
2.3 Empirical Literature Review
This section reviews the empirical studies on the relationships among Risk Management,
Corporate Governance, Firm Characteristics and Firm Performance. A summary of the
empirical literature reviewed identifying the research gap is presented and forms the basis
for the development of the conceptual model.
2.3.1 Relationship between Corporate Governance and Financial
Performance
The relationship between CEO duality and organizational performance was examined by
Rechner and Dalton (1991) using a random sample of corporations from the Fortune 500.
The study identified corporations which had remained as either dual or independent
chair-CEO structures for each year of a six-year period (1978–1983) and found that
corporations which had independent chair-CEO structures had higher return on equity
27
(ROE), return on investment (ROI) and profit margins. Their study supports agency
theory expectations about inferior shareholder returns from CEO duality.
Whether firms with weaker Corporate Governance performed differently from those with
stronger Corporate Governance was studied by Brown and Caylor (2004). The
researchers examined whether firms with weaker Corporate Governance were riskier and
pay out fewer dividends, than firms with stronger Corporate Governance and found out
that firms with weaker Corporate Governance were riskier and had lower dividend pay-
outs and lower dividend yields than firms with stronger Corporate Governance.
In Poland, Aluchna (2009) investigated the relationship between compliance with
Corporate Governance best practice and Corporate Performance on a sample of Polish
public listed companies for years 2004-2006. The findings were that complying with
Corporate Governance best practice in Poland was associated with lower return on
investment. However, the tendency changed into negative but statistically insignificant
for the second and third years and positive but statistically insignificant when only rated
companies were included in the research sample. Further, the relationship between proxy
of Tobin's q and Corporate Governance rating was statistically insignificant and negative
for the whole sample and positive for first and third year as well as for rated companies.
The relationship between Corporate Governance and bank Performance during the credit
crisis was investigated by Beltratti and Stulz (2012) in an international sample of 98
banks. They found that banks with more shareholder-friendly boards as measured by the

28
“Corporate Governance Quotient” (CGQ) obtained performed worse during the crisis.
The findings suggest that the generally good Governance is not necessarily have in the
best interest of shareholders.
Using a unique dataset of 296 financial firms from 30 countries that were at the centre of
the 2007–2008 financial crises, Erkens, Hung and Matos (2012) investigated the
influence of Corporate Governance on firm Financial Performance during the crisis. They
found that firms with more independent boards and higher institutional ownership
experienced worse stock returns during the crisis. The findings suggest a negative
relationship exists between Corporate Governance and Firm Performance.
Naushad and Malik (2015) examined the effect of Corporate Governance (denoted by
board size, duality & agency cost) on the Performance of selected 24 Gulf Cooperation
Council (GCC) banks for the financial year 2012-13. The findings were that smaller
boards were more capable for monitoring the management closely in GCC banking
sector. Further dual role of Chief Executive Officer (CEO) were likely to improve the
GCC bank Performance and the presence of block holders in ownership structure of GCC
banks had a positive effect on the Performance of banking sector. The conclusion of the
study was that the Corporate Governance posed a significant influence on the Financial
and Accounting Performance of GCC banking sector.
Using a sample of 107 banks in Russia and fifty banks in Ukraine, Love and Rachinsky
(2015) did a study on the relationship between Corporate Governance and operating

29
Performance in banks. The study found a significant, but modest, relationships between
Governance and operating performance and a non-significant link with the subsequent
performance. The study concluded that other than the popularity of Corporate
Governance in public discussions, it had at best a second-order effect on operating
performance in Russian and Ukrainian banks.
2.3.2 Relationships among Corporate Governance, Risk Management and
Financial Performance
The relationship between credit risk and performance of Egypt and Lebanon banks in the
1990s was examined Hakim and Neamie (2001). Using data from 1993-1999, the study
estimated a fixed effects model of bank return with varying intercepts and coefficients.
The study found that credit risk was positively related to profitability, while liquidity risk
was insignificant across all banks and had no impact on profitability. The study
recommends to policymakers to set performance targets that enable bank managers to
allocate capital more efficiently across their business units.
Kleffner, Lee, and McGannon (2003) examined the use of ERM by companies in Canada,
the characteristics that were associated with the use of ERM, what obstacles companies
faced in implementing ERM, and what role, if any, Corporate Governance guidelines had
played in the decision to adopt ERM. Primary data was obtained from responses to mail
surveys as well as telephone interviews with the respondents. The findings were that 31
percent of the respondents had adopted ERM, the reasons for adopting ERM included the
influence of the risk manager, encouragement from the board of directors, and
compliance with Toronto Stock Exchange (TSE) guidelines. The major deterrents to

30
ERM were an organizational structure that discouraged ERM and an overall resistance to
change.
Beasley, Clune and Hermanson (2005) did an exploratory study to examine the factors
associated with the stage of ERM implementation at 123 USA and international
organizations. The findings of the study were that the stage of ERM implementation was
positively related to the presence of a chief risk officer, board independence, CEO and
CFO apparent support for ERM, the presence of a big four auditor, entity size, entities in
the banking, education, and insurance industries. The study further found that USA
organizations had less-developed ERM processes than international organizations.
Minton, Taillard and Williamson (2010) investigated how risk taking and bank
Performance were related to board independence and financial expertise of the board in
USA commercial banks before and during the financial crisis. They found that financial
expertise of the board was positively related to risk taking and bank Performance before
the crisis but is negatively related to bank Performance in the crisis.
Using a sample of 74 large U.S banks, Ellul and Yerramilli (2013) investigated the
relationship between Risk Management and bank risk taking as well as performance
during credit crisis. The study constructed a Risk Management Index (RMI) based on five
variables related to the strength of a bank‟s Risk Management. The study used three
dummy variables; whether the bank had a designated credit risk officer (CRO) who was a
member of the executive board, whether the CRO was among the top five highly paid
31
executives, and whether at least one of the non-executive directors on the banks risk
committee met more frequently in the respective year as compared to the average value
across the other sample banks. The study found that banks with a high RMI value were
less active in trading off balance sheet derivatives and had a smaller fraction of non-
performing loans, a lower downside risk and a higher Sharpe ratio during the crisis year
2007-2008.
Aebi, Sabato and Schmid (2012) investigated the association between Risk Management
and Corporate Governance mechanisms with bank performance during the financial crisis
of 2007/2008. The study used a sample of 372 USA banks. Bank performance was
measured using buy-and-hold returns and ROE while Corporate Governance variables
included CEO ownership, board size, and board independence. The findings of the study
were that banks in which the CRO directly reported to the board of directors, and not to
the CEO, demonstrated significantly higher stock returns and ROE. On the contrary,
Corporate Governance variables were mostly insignificant or even negatively related to
the bank performance. The study found a significant relationship between Risk
Management and bank Financial Performance whereas Corporate Governance
insignificantly or negatively affected bank Performance during the 2007/2008 financial
crisis.
Ndung‟u (2013) examined the effect of financial Risk Management on Financial
Performance of oil companies in Kenya. The study adopted causal research design. Semi-
structured questionnaires were used to obtain primary data on Risk Management while
32
the financial performance data was obtained from financial statements. A linear
regression model of Financial Performance versus financial Risk Management techniques
was applied on the data. The study found that financial Risk Management practices had a
positive correlation to the Financial Performance of oil companies in Kenya.
Adeusi, Akeke, Adebisi, and Oladunjoye (2014) investigated the association between
Risk Management practices and bank Financial Performance in Nigeria. The study used
secondary data obtained from 4 year progressive annual reports and financial statements
of 10 banks. A panel data estimation technique was adopted in the data analysis. The
study found a significant inverse relationship between banks Financial Performance and
doubt loans as well as capital asset ratio. The study concluded that a significant
relationship exists between banks Performance and Risk Management.
Abate (2014) analysed the impact of Corporate Governance on credit and liquidity risks
of commercial banks in Ethiopia. The study employed a panel multiple regression model.
Ordinary Least Squares (OLS) with random effects and pooled OLS estimation procedure
were applied to a panel data set of 9 banks over the period 2005 through 2011. The study
found as follows; that Central Bank regulations negatively affected both measures of
risks but management capacity was found to have positively impacted on both risks;
board meeting frequency negatively impacted on both measures of risks; bank size and
inflation both had significant impact on credit risk with a negative and positive
coefficients respectively, but insignificant for liquidity. The study concluded that
Corporate Governance had an impact on bank Risk Management.
33
2.3.3 Relationships among Corporate Governance, Firm
Characteristics and Financial Performance
Using sample of 263 Canadian firms, Klein, Shapiro and Young (2005) studied the
relationship between firm value as measured by Tobin‟s Q, and newly released indices of
effective Corporate Governance. The study used four control variables; size, advantage,
growth and profit variability. They found that size and advantage were consistently
negatively related to performance while growth and performance were positively related.
Further, board independence had no effect on performance and board independence was
negatively related to performance for family owned firms. Their conclusion was that
Corporate Governance did matter in Canada.
Mang‟unyi (2011) explored the effects of ownership structure and Corporate Governance
on Performance of banks in Kenya. Using a survey research design and purposive
sampling procedure to select 40 bank managers drawn from state-owned, locally-owned
and foreign-owned banking institutions banks, data was collected using a semi-structured
questionnaire consisting of both closed and open-ended questions that were administered
to the bank managers. The study used one-way analysis of variance (ANOVA) to test the
hypotheses and found that there was no significant difference between type of ownership
and Financial Performance, there was no significant difference between banks ownership
structure and Corporate Governance practices. Further, there were significant differences
between Corporate Governance and Financial Performance of foreign-owned and
domestically-owned banks.
34
Using an explanatory approach and panel data research design, Olweny and Shipho
(2011) investigated the effects of banking sectorial factors on the profitability of
commercial banks in Kenya. Secondary data, obtained from the CBK banking survey and
financial statements of 38 Kenyan commercial banks from 2002 to 2008, was used in a
multiple linear regression analysis. The study found that all the bank specific factors had
a statistically significant impact on profitability; on the contrary none of the market
factors had any significant impact on profitability. The implication of this study was that
Firm Characteristics significantly influenced Financial Performance of commercial banks
in Kenya.
Boateng, Huang and Kufuor (2015) examined the determinants of bank performance
based on proxy variables that assessed the quality of assets, profitability, liquidity and
overall performance. The study used a sample of 111 Chinese commercial banks over
the period of 2000–2012. The findings of the study were that foreign owned banks
appeared to have better asset quality and overall Performance although lower profitability
compared to domestic banks. On the contrary, the state-owned banks tended to be more
profitable and had better liquidity positions compared with domestic banks and foreign
banks. At the micro level, equity/liability ratio exerted significant influence on overall
bank Performance, while at the macroeconomic level, per capital GDP, GDP growth,
inflation and unemployment rates had a bearing on bank Performance.
Phuong, Harvie and Arjomandi (2015) investigated the impact of financial reforms, bank
characteristics, and time trends on the performance of the Vietnamese banking sector for
35
the period 2007 – 2012. The study hypothesized that ownership could result in a
divergence of technologies utilized by different bank groups (state - owned, private, and
foreign banks). Using combined Meta - frontier analysis with double - bootstrap two -
stage DEA the study analysed the impact of environmental variables on bank efficiency
across separate groups operating under different technologies. The study employed
ownership as an ex ante rather than an ex post factor when examining the influence on
bank efficiency. The study found that the performances of the different bank groups were
significantly different, and that state - owned banks were more efficient and had a smaller
technology gap to the Meta - frontier in comparison with foreign and private banks.
Moreover, the different bank groups reacted dissimilarly to a number of variables, for
instance, state - owned banks had a negative, while private banks had a positive,
relationship to the loan to asset ratio.
The determinants of the performance of commercial banks in Kenya were evaluated by
Ongore and Kusa (2013) using an explanatory research design. Secondary from 2001 to
2010 obtained was from financial statements of the 37 commercial banks commercial
banks in Kenya, CBK, IMF and World Bank. The study used both multiple linear
regression model and t-statistic to determine the effect of each the explanatory variables
on the performance of banks. The moderating effect of ownership identity was evaluated
using a dummy variable. The study found that bank specific factors significantly affected
the performance of commercial banks in Kenya, except for liquidity variable. The effect
of macroeconomic variables were inconclusive at 5% level of significance level. Finally
the moderating effect of ownership identity on the Financial Performance of commercial

36
banks was insignificant. The study concluded that the Financial Performance of
commercial banks in Kenya was mainly influenced by board and management decisions;
however the influence of macroeconomic factors was insignificant.
2.3.4 The Relationships among Corporate Governance, Risk
Management, Firm Characteristics and Financial Performance
The relationship between the core principles of Corporate Governance and Financial
Performance in commercial banks of Uganda was analyzed by Rogers (2006). The study
found that Corporate Governance predicts 34.5 % of the variance Financial Performance
of commercial banks in Uganda. However the significant contributors on Financial
Performance included openness and reliability. Openness and reliability were used as
measures of trust. On the other hand credit risk had a negative relationship with Financial
Performance. Trust had a significant impact on Financial Performance.
Tandelilin et al. (2007) investigated the relationships among Corporate Governance, Risk
Management, and bank performance in Indonesian banking sector using the generalized
methods of moments. Both primary and secondary data were used in the analyses. The
study examined whether the type of ownership had a moderating effect on the
relationships among Corporate Governance, Risk Management, and bank Performance.
The study further investigated whether ownership structure was a key determinant of
Corporate Governance. The study found that the relationships between Corporate
Governance and Risk Management and between Corporate Governance and bank
37
Performance were sensitive to the type of bank ownership. However, ownership structure
showed partial support as a key determinant of Corporate Governance. Foreign-owned
banks had better implemented good Corporate Governance than joint venture-owned
banks, state-owned banks, and private domestic-owned banks. Foreign-owned banks also
depicted a significant relationship between Corporate Governance and Risk Management.
They also found that state-owned banks underperformed the other types of bank
ownership in implementing good Corporate Governance. The study further found an
interrelationship between Risk Management and bank performance.
2.4 Summary of Research Gaps
The empirical analysis of relationships among Corporate Governance, Risk Management,
Firm Characteristics and Financial Performance have not provided uncontested causal
link among the variables. The previous studies pose theoretical and methodological as
well as contextual gaps. Agency theory argues that separation of ownership from control
creates conflicts of interests whereas in both Stewardship and Stakeholder theories no
such conflicts are envisaged. Most of the previous studies reviewed have evaluated the
relationships among two or three of the variables with conflicting and inconclusive
results.
Studies relating Corporate Governance and Financial Performance have yielded
contradictory and inconclusive results. Some studies have documented positive
relationships while others have reported either negative or no relationships. The possible
explanation for the conflicts and contradictions could be that intervention and moderation
38
effects are excluded from the studies, the differences in the attributes of predictor and
dependent used, as well as methodological differences.
The influence of Firm Characteristics on the relationship between Corporate Governance
and Financial Performance is also inconclusive as previous studies have documented
either positive, negative or no effect. Further studies on the influence of Firm
Characteristics on the relationship between Corporate Governance and Financial
Performance are few, contradictory and inconclusive. This area has not been fully
investigated. Another gap arises from the fact that previous studies have in many
instances used one attribute of bank Financial Performance measure (Earnings). The
current study was based on the CAMEL model and therefore used all the five attributes in
the CAMEL model (Capital Adequacy, Asset Quality, Management Capacity, Earnings
and Liquidity) as well as the composite CAMEL ratio
Most of the studies on the four concepts have been conducted in developed economies
that differ in terms of market efficiencies, legal as well as regulatory environments.
Further limited studies have evaluated intervention and moderation effects of Risk
Management and Firm Characteristics at the same time. Given the contextual and
methodological differences, the inconclusive and sometimes conflicting results, this is an
area that requires the current and further research. Table 2.1 provides a summary of the
empirical studies reviewed, findings, research gaps and how gaps were addressed in
current study.
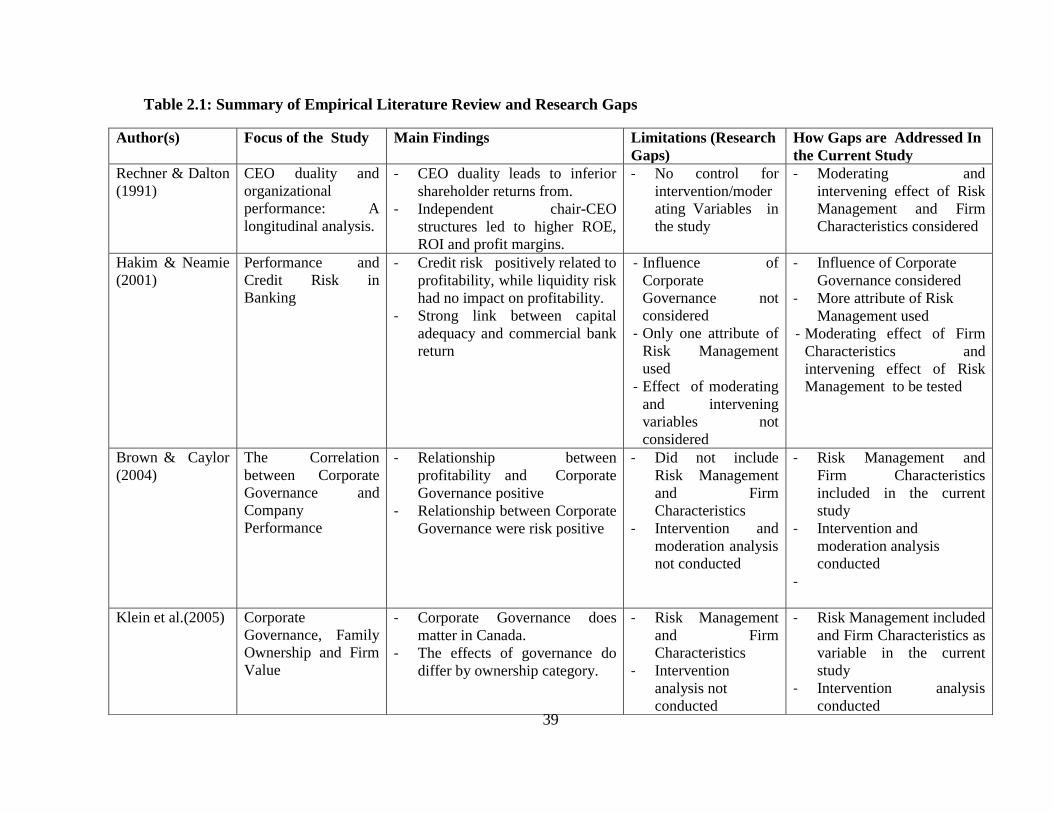
39
Table 2.1: Summary of Empirical Literature Review and Research Gaps
Author(s) Focus of the Study Main Findings Limitations (Research
Gaps)
How Gaps are Addressed In
the Current Study
Rechner & Dalton
(1991)
CEO duality and
organizational
performance: A
longitudinal analysis.
- CEO duality leads to inferior
shareholder returns from.
- Independent chair-CEO
structures led to higher ROE,
ROI and profit margins.
- No control for
intervention/moder
ating Variables in
the study
- Moderating and
intervening effect of Risk
Management and Firm
Characteristics considered
Hakim & Neamie
(2001)
Performance and
Credit Risk in
Banking
- Credit risk positively related to
profitability, while liquidity risk
had no impact on profitability.
- Strong link between capital
adequacy and commercial bank
return
- Influence of
Corporate
Governance not
considered
- Only one attribute of
Risk Management
used
- Effect of moderating
and intervening
variables not
considered
- Influence of Corporate
Governance considered
- More attribute of Risk
Management used
- Moderating effect of Firm
Characteristics and
intervening effect of Risk
Management to be tested
Brown & Caylor
(2004)
The Correlation
between Corporate
Governance and
Company
Performance
- Relationship between
profitability and Corporate
Governance positive
- Relationship between Corporate
Governance were risk positive
- Did not include
Risk Management
and Firm
Characteristics
- Intervention and
moderation analysis
not conducted
- Risk Management and
Firm Characteristics
included in the current
study
- Intervention and
moderation analysis
conducted
-
Klein et al.(2005) Corporate
Governance, Family
Ownership and Firm
Value
- Corporate Governance does
matter in Canada.
- The effects of governance do
differ by ownership category.
- Risk Management
and Firm
Characteristics
- Intervention
analysis not
conducted
- Risk Management included
and Firm Characteristics as
variable in the current
study
- Intervention analysis
conducted

40
Roger (2006). Corporate
Governance and
Financial
Performance of
Commercial Banks
- Corporate Governance predicts
Financial Performance
insignificantly
- Credit risk has a negative
relationship with financial
performance.
- Moderating effect
of Firm
Characteristics not
considered
- Intervening effects
of Corporate
Governance not
assessed
- Both intervention and
moderating effects
considered in the current
study
Tandelilin et al
.(2007)
Corporate
Governance, Risk
Management,
Bank Performance,
Type of Ownership
- Positive relationship between
Corporate Governance practices
and Risk Management
- Corporate Governance practices
have significant effect on bank
Performance
- Type of bank ownership has
moderating effect
- Other aspects of
Firm
Characteristics
limited to
ownership structure
- Firm Characteristics
measures have been
increased to three
- Moderation and
intervention both tested
Aluchna (2009) Effect of Corporate
Governance and
return of equity
- Corporate Governance is
associated with lower return on
investment;
- Risk Management
and Firm
Characteristics not
considered
- Moderation and
intervention not
tested
-
- Risk Management & Firm
Characteristics included in
the study
- Moderation and
intervention both tested
Minton et al.
(2010).
Effect of
Independence and
Financial Expertise of
the Board on Risk
Taking and
Performance
- Financial expertise among
independent directors is
negatively related to changes in
both firm value and cumulative
stock returns.
- Financial expertise is positively
associated with risk-taking
levels
- Firm
Characteristics not
included in the
study
- Moderation and
intervention not
tested
- Considers Firm
Characteristics as
mediating
- Moderation and
intervention both tested
Mang‟unyi (2011) Ownership Structure - No significant difference - Risk Management - Risk Management included
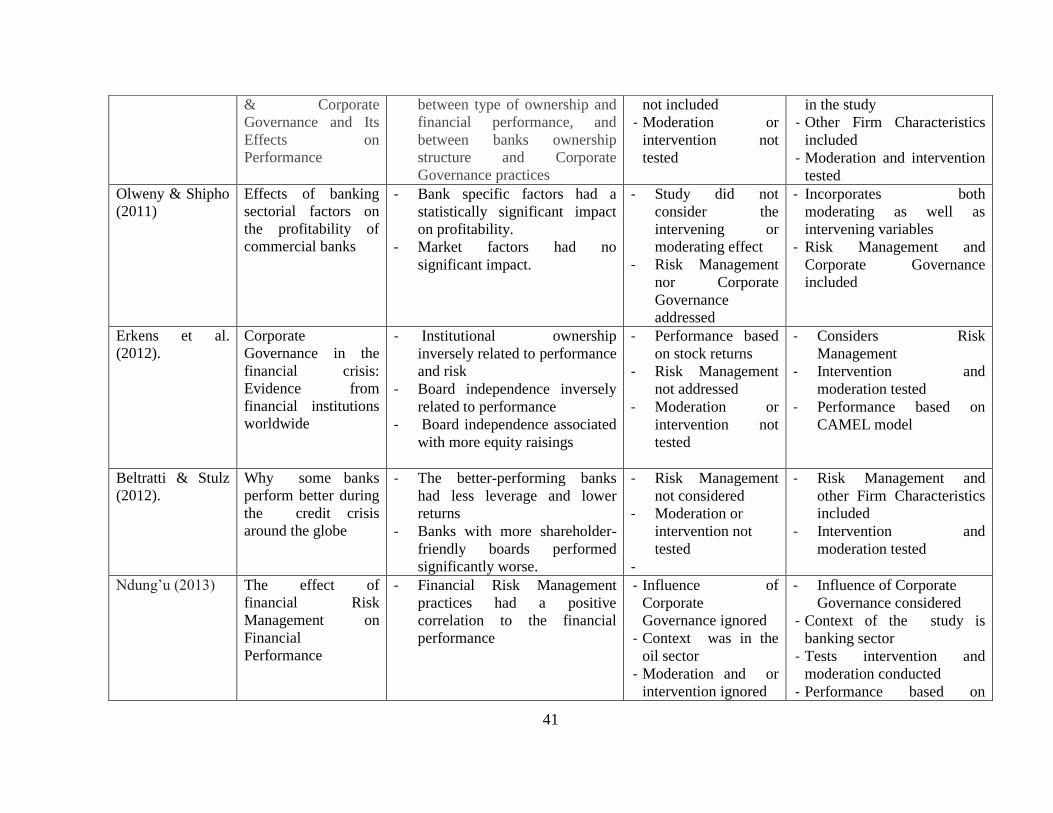
41
& Corporate
Governance and Its
Effects on
Performance
between type of ownership and
financial performance, and
between banks ownership
structure and Corporate
Governance practices
not included
- Moderation or
intervention not
tested
in the study
- Other Firm Characteristics
included
- Moderation and intervention
tested
Olweny & Shipho
(2011)
Effects of banking
sectorial factors on
the profitability of
commercial banks
- Bank specific factors had a
statistically significant impact
on profitability.
- Market factors had no
significant impact.
- Study did not
consider the
intervening or
moderating effect
- Risk Management
nor Corporate
Governance
addressed
- Incorporates both
moderating as well as
intervening variables
- Risk Management and
Corporate Governance
included
Erkens et al.
(2012).
Corporate
Governance in the
financial crisis:
Evidence from
financial institutions
worldwide
- Institutional ownership
inversely related to performance
and risk
- Board independence inversely
related to performance
- Board independence associated
with more equity raisings
- Performance based
on stock returns
- Risk Management
not addressed
- Moderation or
intervention not
tested
- Considers Risk
Management
- Intervention and
moderation tested
- Performance based on
CAMEL model
Beltratti & Stulz
(2012).
Why some banks
perform better during
the credit crisis
around the globe
- The better-performing banks
had less leverage and lower
returns
- Banks with more shareholder-
friendly boards performed
significantly worse.
- Risk Management
not considered
- Moderation or
intervention not
tested
-
- Risk Management and
other Firm Characteristics
included
- Intervention and
moderation tested
Ndung‟u (2013) The effect of
financial Risk
Management on
Financial
Performance
- Financial Risk Management
practices had a positive
correlation to the financial
performance
- Influence of
Corporate
Governance ignored
- Context was in the
oil sector
- Moderation and or
intervention ignored
- Influence of Corporate
Governance considered
- Context of the study is
banking sector
- Tests intervention and
moderation conducted
- Performance based on

42
Source: Researcher
- Performance based on
Earnings
CAMEL model
Ongore & Kusa
(2013)
The determinants of
the performance of
commercial banks
- Bank specific factors
significantly affected the
performance
- The moderating effect of
ownership identity was
insignificant
- Ignored Corporate
Governance and
Risk Management
- Intervening effect
of variables not
considered
- Performance based
on Earnings
- Corporate Governance, Firm
Characteristics and Risk
Management
- Both intervening and
moderating variables
considered in the study
- Performance based on
CAMEL model
Adeusi et al.
(2014)
Risk Management
and Financial
Performance of
Banks
- Better Risk Management results
in better bank performance.
- No investigation of
moderation and /or
intervention
- Performance based
on Earnings
- Intervention of Risk
Management investigated
- Performance based on
CAMEL model
Naushad & Malik
(2015)
Effect of Corporate
Governance on the
performance of
selected banks.
- Corporate Governance
significantly influenced
financial and accounting
performance
- Intervention and
moderation not
tested
- Performance based
on Earnings
- Both intervening and
moderating variables
considered in the study
- Performance based on
CAMEL model

43
2.5 Conceptual Framework
Figure 2.1 presents a conceptual framework model of relationships among Corporate
Governance, Risk Management, Firm Characteristics and bank Financial Performance.
The figure shows that Corporate Governance influences Financial Performance in several
ways. First, Corporate Governance can directly influence bank Financial Performance. In
other words when directors exercise prudently their oversight responsibility it is likely to
lead to improved bank Financial Performance. This proposition, supported by the Agency
theory, is shown in hypothesis one in the diagram. This position has been investigated by
a number of scholars who have investigated the relationship between Corporate
Governance and bank Financial Performance with mixed and inconclusive results.
Corporate Governance can affect bank Financial Performance indirectly through Risk
Management. Directors, who are appointed by shareholders at the AGM, do not engage
in the daily operational activities of the firm rather they monitor the managerial activities
and approve critical managerial decisions in the firm. Banks for example have a Risk
Management committee of the board whose main duty is to assist the board in the
execution of its responsibility for the governance of risk. The Risk Management
committee reviews the risk philosophy, strategy, policies and risk tolerance and appetite
recommended by management and ensure compliance with the overall risk profile of the
bank. Hypothesis two therefore proposes that the board through the Risk Management
committee would influence enterprise Risk Management that then leads to better
Financial Performance.

44
Corporate Governance could also influence bank Financial Performance through the
moderation of the Firm Characteristics. Large firms for example are able to have
effective broad based board that can effectively discharge oversight role compared with
small banks. Use of debt in financing also imposes restrictive covenants and financial
discipline on management. The big four audit firms improve on the audit quality and
Corporate Governance mechanism. Firm Characteristics have been documented from
empirical studies to have an influence on Financial Performance although the nature and
direction of the effect is inconclusive. The most common firm attributes include Size
Leverage and Nature of Audit Firm. Hypothesis three therefore proposes that Firm
Characteristics moderates the relationship between Corporate Governance and bank
Financial Performance.
Corporate Governance, Risk Management, Firm Characteristics could jointly affect bank
Financial Performance. From the past empirical studies each of these variables have been
documented by scholars to have some effect (positive, negative or none) on bank
Financial Performance. The joint effect of the variables have also been investigated by
few scholars. This fourth hypothesis evaluated the joint effect of Corporate Governance,
Risk Management and Firm Characteristics on bank Financial Performance. The
conceptual model relating the study variables is presented in figure 2.1 below:
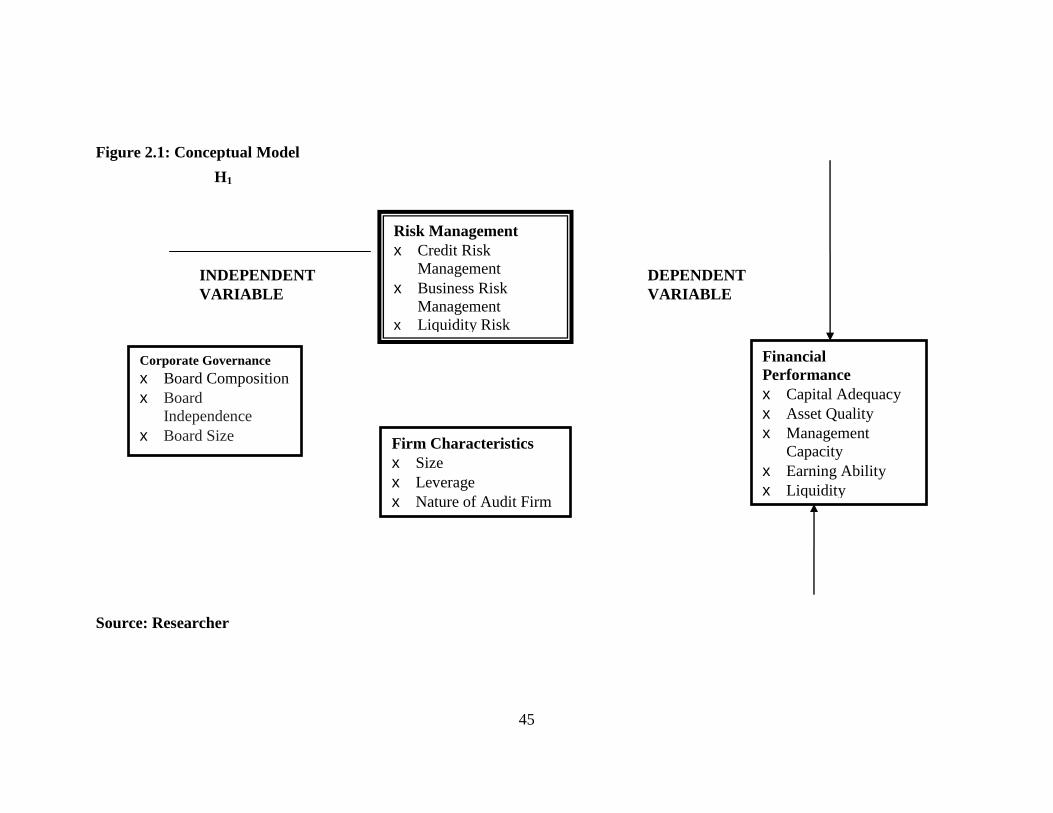
45
Figure 2.1: Conceptual Model
Source: Researcher
Corporate Governance
�x Board Composition
�x Board
Independence
�x Board Size
Financial
Performance
�x Capital Adequacy
�x Asset Quality
�x Management
Capacity
�x Earning Ability
�x Liquidity
�x CAMEL ratio
�x Return on Equity
Risk Management
�x Credit Risk
Management
�x Business Risk
Management
�x Liquidity Risk
Management
Firm Characteristics
�x Size
�x Leverage
�x Nature of Audit Firm
INDEPENDENT
VARIABLE
DEPENDENT
VARIABLE
H1


48
Table 3.1: Major Elements of Research Philosophies
The research philosophies are discussed in detail in the next section.
3.2.1 Positivism:
According to Remenyi and Williams (1998) positivism is concerned with facts rather
than impressions. Such facts are consistent with the notion of „observable social reality‟.
Positivism research is undertaken, as far as possible, in a value-free way in that „the
researcher is independent of and neither affects nor is affected by the subject of the
research‟. The positivist researcher use a highly structured methodology in order to
facilitate replication (Collis & Hussey, 2009). Furthermore, the emphasis is on
quantifiable observations that lend themselves to statistical analysis.
Positivism research philosophy entails production of quantitative data based on large
samples as well as testing of theory and hypothesis. According to Myers (1997),
Positivism Constructivism
�x Determination
�x Reductionism
�x Empirical observation and measurement
�x Theory verification
�x Understanding
�x Multiple participant meanings
�x Social and historical construction
�x Theory generation
Realism Pragmatism
�x Political
�x Power and justice oriented
�x Collaborative
�x Change-oriented
�x Consequences of action
�x Problem-centred
�x Pluralistic
�x Real-world practice oriented
Source: Creswell (2013)
49
positivists generally assume that reality is objectively given and can be described by
measurable properties which are independent of the observer (researcher) and his or her
instruments. Orlikowski and Baroudi (1991) state that positivist studies generally attempt
to test theory, in an attempt to increase the predictive understanding of phenomena.
Orlikowski and Baroudi (1991) supports this proposition by stating that positivism is
applicable if there is evidence of formal propositions, quantifiable measures of variables,
hypothesis testing, and the drawing of inferences about a phenomenon from the sample to
a stated population. This study was therefore premised on the positivism research
philosophy as it tested several quantitative hypotheses.
3.2.2 Realism
According to Creswell (2013), the philosophy of realism is that there is a reality quite
independent of the mind. Direct realism states that what you see is what you get: what we
experience through our senses portrays the world accurately. Critical realists argue that
what we experience are sensations, the images of the things in the real world, not the
things directly. Critical realism claims that there are two steps to experiencing the world:
there is the thing itself and the sensations it conveys then there is the mental processing
that goes on sometime after that sensation meets our senses. Bhaskar (2014) identifies
with the epistemology of critical realists and argue that as researchers we will only be
able to understand what is going on in the social world if we understand the social
structures that have given rise to the phenomena that we are trying to understand. In other
words, what we see is only part of the bigger picture.

50
Bhaskar (2014) argues that we can identify what we do not see through the practical and
theoretical processes of the social sciences. Our knowledge of reality is a result of social
conditioning and cannot be understood independently of the social actors involved in the
knowledge derivation process (Dobson, 2002).
3.2.3 Interpretivism
This research paradigm postulates that knowledge is subjective, based on experience and
is based on the personal experience of the researcher. The emphasis of the approach is
that the world as experienced by a person and not the world or reality is something
separate from the person (Saunders et al., 2009). The paradigm is appropriate in
explaining social matters that surround human activity as well as understanding the social
context of an organization. It relies on the immediate experience and adopts mainly case
studies and open/unstructured interviews in data collection.
According to Saunders (2007), Interpretivism comes from two intellectual traditions:
phenomenology and symbolic interactionism. Phenomenology refers to the way in which
we as humans make sense of the world around us (Saunders, 2007). In symbolic
interactionism, we are in a continual process of interpreting the social world around us in
that we interpret the actions of others with whom we interact and this interpretation leads
to adjustments of our own meanings and actions. Interpretivist paradigm is highly
appropriate in the case of business and management research, particularly in such fields
as organisational behaviour, marketing and human resource management. Not only are

51
business situations complex, they are also unique. They are a function of a particular set
of circumstances and individuals coming together at a specific time (Creswell, 2013).
3.2.4 Pragmatism
According to Cherryholmes (1992), pragmatism derives from the work of Peirce, James,
Mead, and Dewey. It arises out of actions, situations, and consequences rather than
antecedent conditions. It is a concerned with applications, what works, and solutions to
problems (Patton, 1990). Instead of focusing on methods, researchers emphasize the
research problem and use all approaches available to understand the problem (Rossman
& Wilson, 1985).
As a philosophical underpinning for mixed methods studies, the pragmatism focuses
attention on the research problem in social science research and then uses pluralistic
approaches to derive knowledge about the problem (Cherryholmes, 1992). Pragmatism is
intuitively appealing, largely because it avoids the researcher engaging in what they see
as rather pointless debates about such concepts as truth and reality. Under the paradigm,
“you study what interests you and is of value to you, study in the different ways in which
you deem appropriate, and use the results in ways that can bring about positive
consequences within your value system‟‟ (Tashakkori & Teddlie, 1998). A comparison of
the four research philosophies based on Ontology, Epistemology, Axiology and Data
collection techniques most often used is provided in Table 3.2 below:

52
Table 3.2: Comparison of Research Philosophies used in Management Research
Positivism Realism Interpretivism Pragmatism
Ontology: The researcher‟s
view of the nature
of reality or being
External, objective and
independent of social
actors
Is objective, Exists independently of
human thoughts and beliefs or
knowledge of their existence (realist),
but is interpreted through social
conditioning (critical realist
Socially constructed,
subjective, may
change, multiple
External, multiple, view
chosen to best enable
answering of research
question
Epistemology: The researcher‟s
view regarding
what constitutes
acceptable
knowledge
Only observable
phenomena can provide
credible data, facts.
Focus on causality and
law like generalisations,
reducing phenomena to
simplest elements
Observable phenomena provide
credible data, facts. Insufficient data
means inaccuracies in sensations
(direct realism). Alternatively,
phenomena create sensations which
are open to misinterpretation (critical
realism). Focus on explaining within
a context or contexts
Subjective meanings
and social
phenomena. Focus
upon the details of
situation, a reality
behind these details,
subjective meanings
motivating actions
Either or both observable
phenomena and subjective
meanings can provide
acceptable knowledge
dependent upon the research
question. Focus on practical
applied research, integrating
different perspectives to help
interpret the data
Axiology:
The researcher‟s
view of the role of
values in research
Research is undertaken
in a value-free way, the
researcher is independent
of the data and maintains
an objective stance
Research is value laden; the
researcher is biased by world views,
cultural experiences and upbringing.
These will impact on the research
Research is value
bound, the researcher
is part of what is
being researched,
cannot be separated
and so will be
subjective
Values play a large role in
interpreting results, the
researcher adopting both
objective and subjective
points of vie
Data collection
techniques most
often used
Highly structured, large
samples, measurement,
quantitative, but can use
qualitative
Methods chosen must fit the subject
matter, quantitative or qualitative
Small samples, in-
depth investigations,
qualitative
Mixed or multiple method
designs, quantitative and
qualitative
Source: Saunders et al. (2009)

53
3.3 Research Design
A research design is a blue print for conducting the study with maximum control over factors
that may interfere with the validity of the findings (Burns & Grove, 2010). According to
Trochim (2005), research design “provides the glue that holds the research project together”. A
design is used to structure the research, to show how all of the major parts of the research
project work together to try to address the central research questions. Research designs can be
grouped into three main types: exploratory, descriptive, and explanatory (Bhattacherjee, 2012).
A detailed discussion of each research design is provided in the section below:
3.3.1 Exploratory Research Design
An exploratory research design is a valuable means of finding out „what is happening; to seek
new insights; to ask questions and to assess phenomena in a new light‟ (Robson & McCartan,
Robson, 2016). The design is useful to clarify the understanding of a problem, for example if
the researcher is unsure of the precise nature of the problem. The three principal ways of
conducting exploratory research include a search of the literature; interviewing „experts‟ in the
subject and conducting focus group interview.
Bhattacherjee (2012) states that exploratory designs are often used in new areas of inquiry,
where the goals of the research are to scope out the magnitude or extent of a particular
phenomenon, problem, or behaviour; to generate some initial ideas (or “hunches”) about that
phenomenon, or to test the feasibility of undertaking a more extensive study regarding that
phenomenon. Adams and Schvaneveldt (1991) liken exploratory design to the activities of the
traveller or explorer with the advantage flexibility and adaptability to change. They argue that in
conducting exploratory research, the researcher must be willing to change direction as a result

54
of new data that appear and new insights that occur. They argue that the flexibility inherent in
exploratory research does not mean absence of direction to the enquiry, it simply means that the
focus is initially broad and becomes progressively narrower as the research progresses.
3.3.2 Descriptive Research Design
Burns and Grove (2003) define descriptive research as a design to provide a picture of a
situation as it naturally happens. The design may be used to justify current practice and make
judgment and also to develop theories. Robson and McCartan (2016) state that the objective of a
descriptive research is to portray an accurate profile of persons, events or situations. A
descriptive design can be an extension of, or a forerunner to, a piece of exploratory research or,
more often, a piece of explanatory research. It is necessary to have a clear picture of the
phenomena on which you wish to collect data prior to the collection of the data. Descriptive
designs in management and business research should be thought of as a means to an end rather
than an end in itself. Descriptive design is likely to be a precursor to an explanatory study
design, known as descriptor-explanatory studies (Saunders et al., 2009).
3.3.3 Explanatory Research Design
An explanatory design involves studies that establish causal relationships between variables
(Saunders et al., 2009). The emphasis of an explanatory design is to study a situation or a
problem in order to explain the relationships between variables. This design attempt to clarify
how and why there is a relationship between two or more aspects of a situation or a phenomena.
Zikmund, Babin, Carr and Griffin (2013) suggest that the degree of uncertainty about the
research problem determines the research design. Table 3.3 below provides a summary of
degree of problem definition and possible situations that would be appropriate for each of the
three research designs.
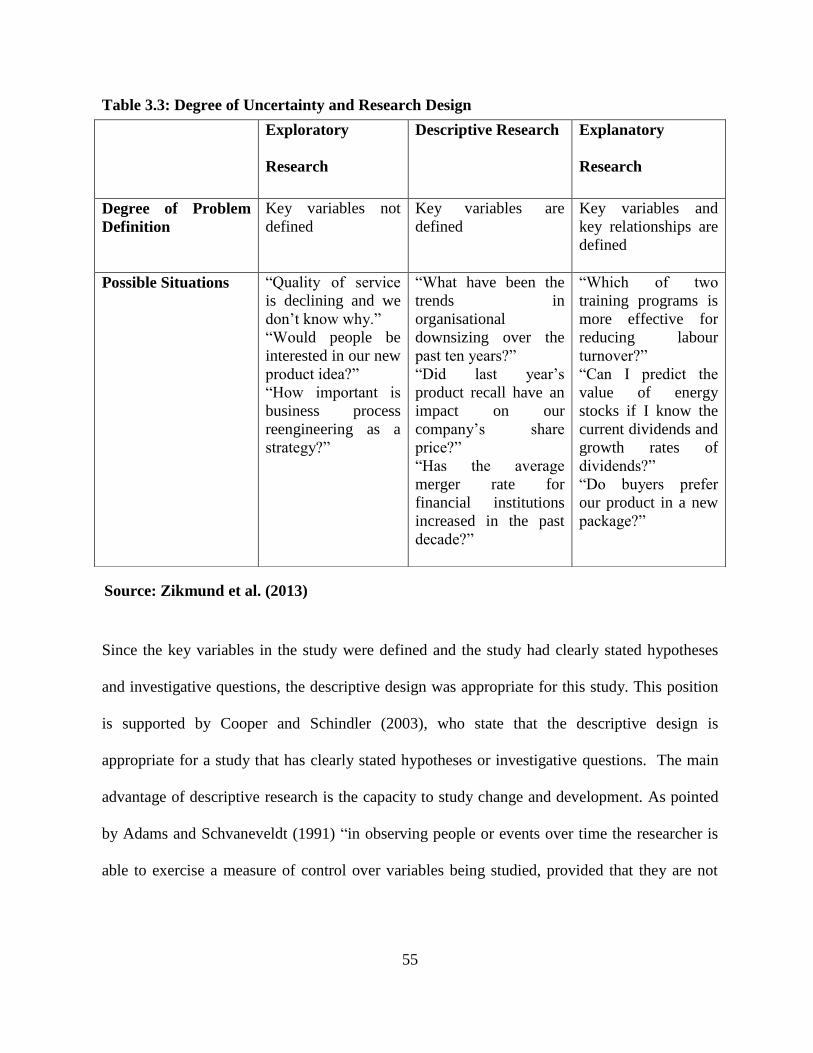
55
Table 3.3: Degree of Uncertainty and Research Design
Since the key variables in the study were defined and the study had clearly stated hypotheses
and investigative questions, the descriptive design was appropriate for this study. This position
is supported by Cooper and Schindler (2003), who state that the descriptive design is
appropriate for a study that has clearly stated hypotheses or investigative questions. The main
advantage of descriptive research is the capacity to study change and development. As pointed
by Adams and Schvaneveldt (1991) “in observing people or events over time the researcher is
able to exercise a measure of control over variables being studied, provided that they are not
Exploratory
Research
Descriptive Research Explanatory
Research
Degree of Problem
Definition
Key variables not
defined
Key variables are
defined
Key variables and
key relationships are
defined
Possible Situations
“Quality of service
is declining and we
don‟t know why.”
“Would people be
interested in our new
product idea?”
“How important is
business process
reengineering as a
strategy?”
“What have been the
trends in
organisational
downsizing over the
past ten years?”
“Did last year‟s
product recall have an
impact on our
company‟s share
price?”
“Has the average
merger rate for
financial institutions
increased in the past
decade?”
“Which of two
training programs is
more effective for
reducing labour
turnover?”
“Can I predict the
value of energy
stocks if I know the
current dividends and
growth rates of
dividends?”
“Do buyers prefer
our product in a new
package?”
Source: Zikmund et al. (2013)

56
affected by the research process itself”. Previous studies have used the descriptive approach
(Tandelilin et al., 2007; Ndung‟u, 2013; Mang‟unyi, 2011).
3.4 Population
Cooper and Schindler (2003) defines population as an entire group of individuals, events or
objects having common characteristics that conform to a given specification. The population of
the study were all the forty three (43) commercial banks registered in Kenya as at December 31,
2014 (Appendix I). A census was adopted hence no sampling.
Commercial banks were selected for this study due to the uniqueness of Corporate Governance
and Risk Management adopted by them. There are unique Corporate Governance and Risk
Management challenges in commercial banks as evidenced by the interventions by regulatory
bodies through the issuance of prudential guidelines on Corporate Governance and Risk
Management. In addition commercial banks are involved in the financial mediation process and
problems in the banking industry can have a contagious effect on the entire financial factor and
the economy as a whole.
3.5 Data Collection
According to Burns and Grove (2010) data collection is the precise, systematic gathering of
information relevant to the research sub-problems, using methods such as interviews,
participant observations, focus group discussion, narratives and case histories. The study used
quantitative secondary data collected in Microsoft excel sheets for a five year period (2010 to
2014). Secondary data on Risk Management, Firm Characteristics and Financial Performance
57
was collected from the annual reports and accounts of the commercial banks as well as the CBK
Bank Supervision and Banking Sector Reports. Tandelilin et al., (2007) used both primary and
secondary data in the analysis with consistent results.
Corporate Governance was measured using three attributes; board size, board composition and
board independence, obtained from the annual reports of the commercial banks. These measures
were adopted from those used by Akhtaruddin, Hossain, Hossain and Yao (2009). Risk
Management indicators (adopted from Jorion, 2001), were Credit Risk Management, Business
Risk Management and Liquidity Risk Management. Firm Characteristics indicators were
adopted from Akhtaruddin, et al. (2009), which were Size, Leverage and Nature of the Audit
Firm. Bank Financial Performance indicators were based on the CAMEL model (Capital
Adequacy, Asset Quality, Management Capacity, Earning Ability and Liquidity) which were
adopted from those used by Reddy (2012).
3.6 Diagnostic Tests
The classical linear regression model is based on a number of assumptions including linear
relationship, multivariate normality, no or little multicollinearity, no auto-correlation and
homoscedasticity. The following diagnostic tests were conducted on the data.
3.6.1 Independence Test
Linear regression analysis requires that there is little or no autocorrelation in the data.
Autocorrelation occurs when the residuals are not independent from each other. The Durbin –
Watson statistic (1.5<d<2.5) as proposed by Durbin and Watson (1951) was used to test the

58
autocorrelation in the panel data. To ensure that the value of y(x+1) is independent from the
value of y(x).
3.6.2 Linearity
The ANOVA test of linearity was used to check for linearity of the relationships between the
independent and the dependent variables data. The test computed both the linear and nonlinear
components of a pair of variables. Nonlinearity was considered significant if the computed F
value for the nonlinear component was below 0.05.
3.6.3 Multicollinearity Test
Multicollinearity occurs when the independent variables are not independent from each other
meaning one independent variables can be linearly predicted from the others with some
reasonable degree of accuracy (Woolridge, 2002). A second important independence
assumption is that the error of the mean has to be independent from the independent variables.
When the independent variables are highly correlated the resultant regression model run will
have high standard errors of the individual coefficients making the regression model very
sensitive to small changes in the specifications (Brook. 2008). The presence of multicollinearity
was assessed using the VIF (Tolerance) test.
3.6.4 Heteroscedasticity Test
The classical linear regression model assumes that the data is homoscedastic (literally, same
variance). Homoscedasticity describes a situation in which the error term (that is, the “noise” or

59
random disturbance in the relationship between the independent variables and the dependent
variable) is the same across all values of the independent variables that is that is the variance of
the errors is constant and is known. Histograms, scatterplots, normal P-P plots were used to
test for heteroscedasticity by splitting the data in high and low value to assess whether the
samples were significantly different. In addition the Levene‟s test was used to assess the
assumption that variances of the populations from which different samples drawn were equal.
The Levene‟s statistic tested the null hypothesis that the population variances are equal (called
homogeneity of variance or homoscedasticity). When there is no heteroscedasticity there is
homoscedasticity.
3.6.5 Multivariate Normality Test
The linear regression analysis requires all variables to be multivariate normal. Normality was
checked with a goodness of fit test, the Kolmogorov-Smirnov test, which is nonparametric test
of the equality of continuous, one-dimensional probability distribution that compares a sample
with a reference probability distribution (one-sample K–S test), or compares two samples (two-
sample K–S test). In addition the Shapiro–Wilk (1965) test, which is a more robust test of
normality, was also adopted. Data that was not normally distributed was adjusted for using a
non-linear transformation, log-transformation.
3.7 Operationalization and Measurement of the Study Variables
Operationalization is the process of assigning numerals, numbers and other symbols to the study
variables. According to Sekaran (2006), operationalization is the explicit specification of a
variable in such a way that its measurement is possible. The four variables of the study were
Corporate Governance, Risk Management, Firm Characteristics, and bank Financial
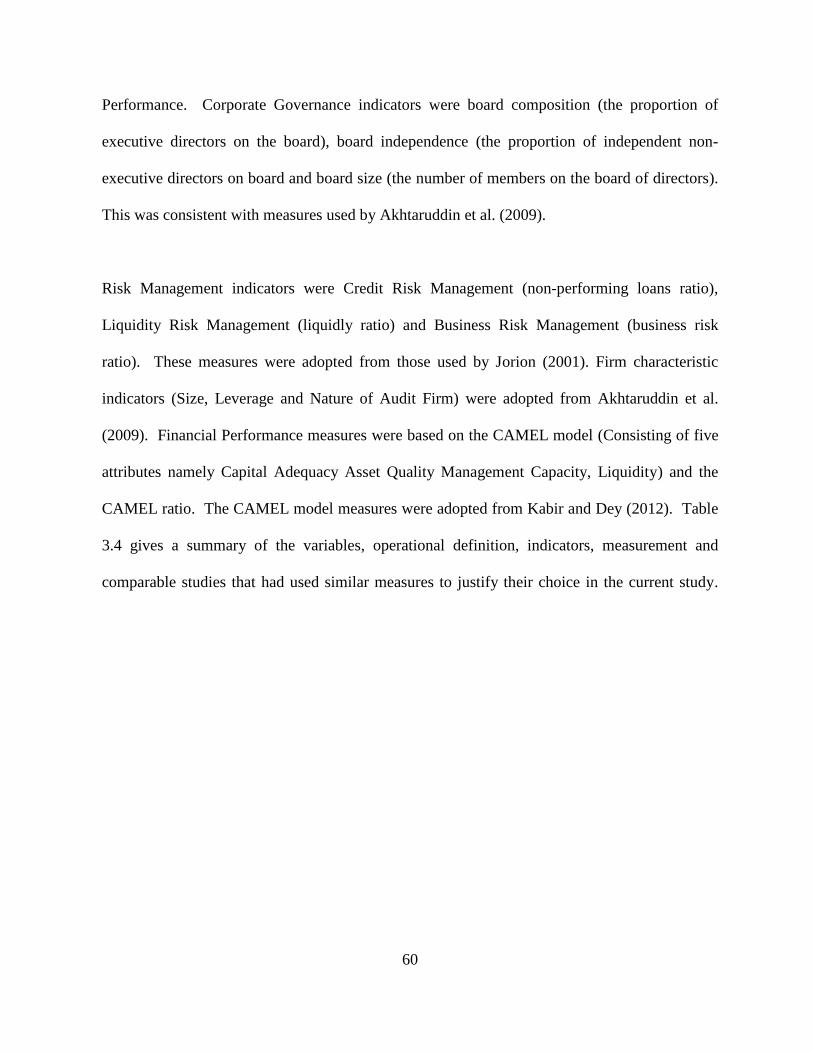
60
Performance. Corporate Governance indicators were board composition (the proportion of
executive directors on the board), board independence (the proportion of independent non-
executive directors on board and board size (the number of members on the board of directors).
This was consistent with measures used by Akhtaruddin et al. (2009).
Risk Management indicators were Credit Risk Management (non-performing loans ratio),
Liquidity Risk Management (liquidly ratio) and Business Risk Management (business risk
ratio). These measures were adopted from those used by Jorion (2001). Firm characteristic
indicators (Size, Leverage and Nature of Audit Firm) were adopted from Akhtaruddin et al.
(2009). Financial Performance measures were based on the CAMEL model (Consisting of five
attributes namely Capital Adequacy Asset Quality Management Capacity, Liquidity) and the
CAMEL ratio. The CAMEL model measures were adopted from Kabir and Dey (2012). Table
3.4 gives a summary of the variables, operational definition, indicators, measurement and
comparable studies that had used similar measures to justify their choice in the current study.
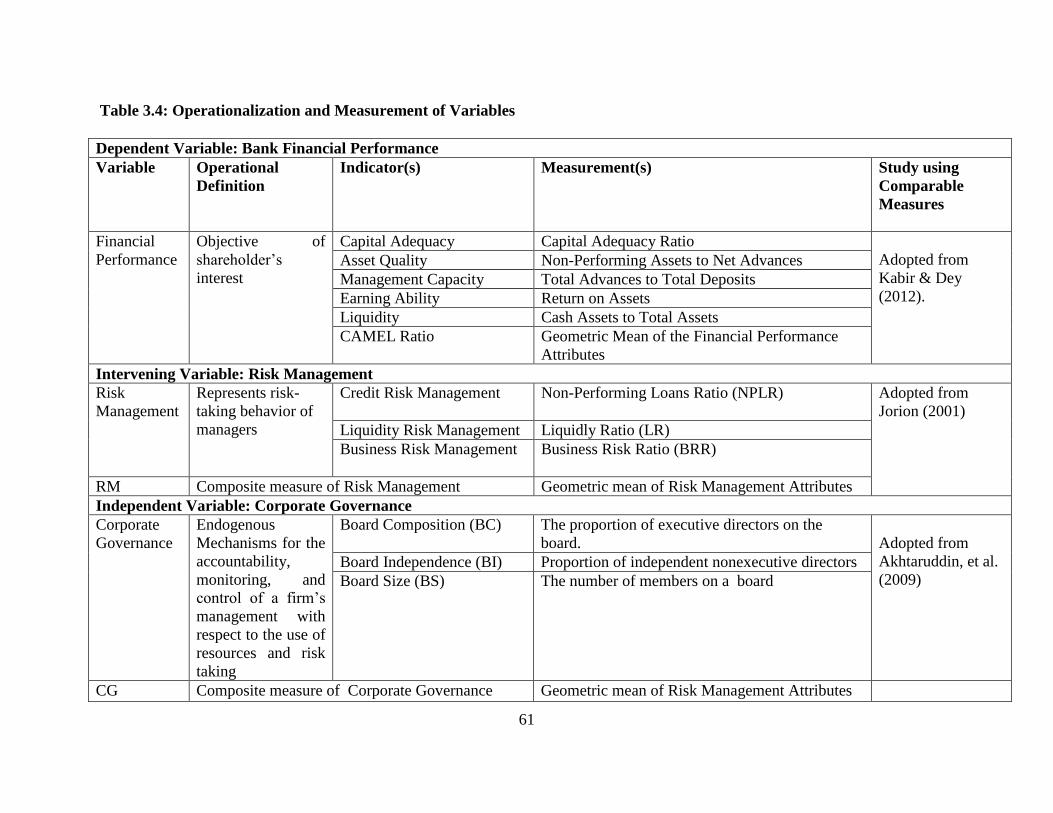
61
Table 3.4: Operationalization and Measurement of Variables
Dependent Variable: Bank Financial Performance
Variable Operational
Definition
Indicator(s) Measurement(s) Study using
Comparable
Measures
Financial
Performance
Objective of
shareholder‟s
interest
Capital Adequacy Capital Adequacy Ratio
Adopted from
Kabir & Dey
(2012).
Asset Quality Non-Performing Assets to Net Advances
Management Capacity Total Advances to Total Deposits
Earning Ability Return on Assets
Liquidity Cash Assets to Total Assets
CAMEL Ratio Geometric Mean of the Financial Performance
Attributes
Intervening Variable: Risk Management
Risk
Management
Represents risk-
taking behavior of
managers
Credit Risk Management Non-Performing Loans Ratio (NPLR)
Adopted from
Jorion (2001)
Liquidity Risk Management Liquidly Ratio (LR)
Business Risk Management Business Risk Ratio (BRR)
RM Composite measure of Risk Management Geometric mean of Risk Management Attributes
Independent Variable: Corporate Governance
Corporate
Governance
Endogenous
Mechanisms for the
accountability,
monitoring, and
control of a firm‟s
management with
respect to the use of
resources and risk
taking
Board Composition (BC) The proportion of executive directors on the
board.
Adopted from
Akhtaruddin, et al.
(2009) Board Independence (BI) Proportion of independent nonexecutive directors
Board Size (BS) The number of members on a board
CG Composite measure of Corporate Governance Geometric mean of Risk Management Attributes

62
Source: Researcher
Moderating Variable: Firm Characteristics
Size Total Assets Size of the firms measured
by total assets.
Log of total assets.
Akhtaruddin, et al.
(2009) Leverage Represents the
relationship
between a firm‟s
long term debt and
its book value of
equity.
Represents the relationship
between a firm‟s long term
debt and its book value of
equity.
Ratio of long term debt to book value of equity
Nature of
audit firm
Independent
auditors
The nature of independent
audit firms hired by the bank
1 for local audit firm affiliated with Big-4; 0
otherwise
FC Composite measure of Corporate Governance
Geometric mean of Risk Management Attributes

63
3.8 Data Analysis
Zikmund et al. (2013) define data analysis as the application of reasoning to understand
the data that has been gathered with the aim of determining consistent patterns and
summarizing the relevant details revealed in the investigation. Sekaran (2006) suggests a
four step approach in data analysis namely; get the data ready for analysis (editing for
accuracy, consistency and completeness); get a feel of the data (descriptive statistics); test
the goodness of fit (diagnostic tests) and finally hypothesis testing. The statistical
package for social sciences (SPSS) version 21 was used in the data analysis.
The study used correlation and multiple regression analysis to establish the relationship
between Corporate Governance and bank Financial Performance. The Baron and Kenny
(1986) approach was used to test the intervening and moderating effect of Risk
Management and Firm Characteristics respectively, on the relationship between
Corporate Governance and bank Financial Performance. Finally the multiple regression
analysis was used to test the joint effect of Corporate Governance, Risk Management,
and Firm Characteristics on bank Financial Performance.
The above analysis was consistent with those used in the previous studies to test the main
effect, intervention, moderation and joint effect (Klein et al., 2005, Mang‟unyi, 2011,
Tandelilin et al., 2007, Rogers, 2006). Previous studies that have used multiple measures
of Financial Performance include Ongore and Kusa, (2013) who used three measures of
Financial Performance (ROA, ROE & NIM); Rogers (2006) who measured Financial
Performance based on each of the components of the CAMEL model (Capital adequacy,

64
Asset Quality, Management Capacity, Earnings, and Liquidity) and Reddy (2012) who
evaluated the relative performance of commercial banks using CAMEL approach. The
current study adopted the CAMEL model to evaluate Financial Performance for the
attributes and composite (CAMEL ratio) measure as follows:
3.8.1 Corporate Governance and Bank Financial Performance
Hierarchical multiple regression model was used to determine the relationship between
Corporate Governance and Financial Performance of commercial banks in Kenya. The
following multiple regression models were used to test hypothesis one of the study.
FPi = β0 + β1BC +β2BI + β3BS + εi.................................................... (3.1)
CAMEL = β0 + β1BC +β2BI + β3BS + εi.................................................... (3.2)
Where:
FPi, Financial Performance Attribute i, (i=1 to 5; i1=Capital Adequacy,
i2=Asset Quality, i3=Management Capacity, i4=Earnings, and
i5=Liquidity)
CAMEL Composite ratio of Financial Performance that was computed as a
geometric mean of the attributes of Financial Performance
β0 Regression constant or intercept,
βi Regression coefficients of variable i
BC Board Composition,
BI Board Independence
BS Board Size
εi is a random error term that accounts for the unexplained variations.
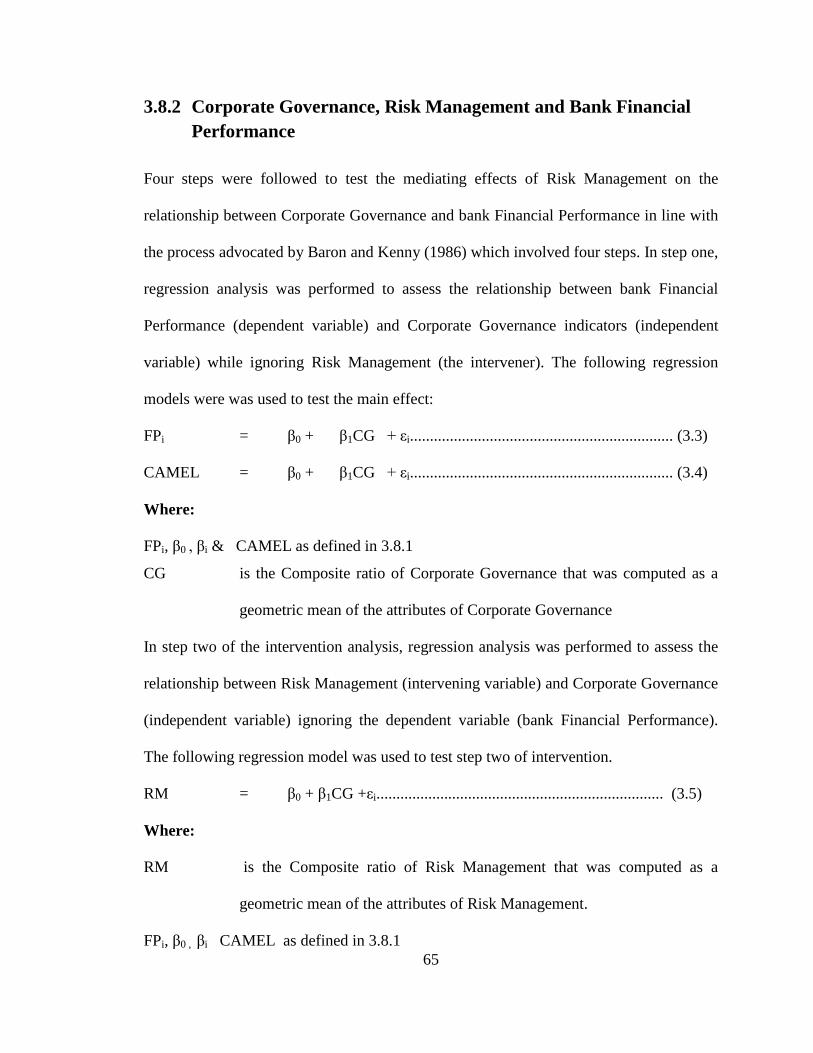
65
3.8.2 Corporate Governance, Risk Management and Bank Financial
Performance
Four steps were followed to test the mediating effects of Risk Management on the
relationship between Corporate Governance and bank Financial Performance in line with
the process advocated by Baron and Kenny (1986) which involved four steps. In step one,
regression analysis was performed to assess the relationship between bank Financial
Performance (dependent variable) and Corporate Governance indicators (independent
variable) while ignoring Risk Management (the intervener). The following regression
models were was used to test the main effect:
FPi = β0 + β1CG + εi.................................................................. (3.3)
CAMEL = β0 + β1CG + εi.................................................................. (3.4)
Where:
FPi, β0 , βi & CAMEL as defined in 3.8.1
CG is the Composite ratio of Corporate Governance that was computed as a
geometric mean of the attributes of Corporate Governance
In step two of the intervention analysis, regression analysis was performed to assess the
relationship between Risk Management (intervening variable) and Corporate Governance
(independent variable) ignoring the dependent variable (bank Financial Performance).
The following regression model was used to test step two of intervention.
RM = β0 + β1CG +εi........................................................................ (3.5)
Where:
RM is the Composite ratio of Risk Management that was computed as a
geometric mean of the attributes of Risk Management.
FPi, β0 , βi CAMEL as defined in 3.8.1
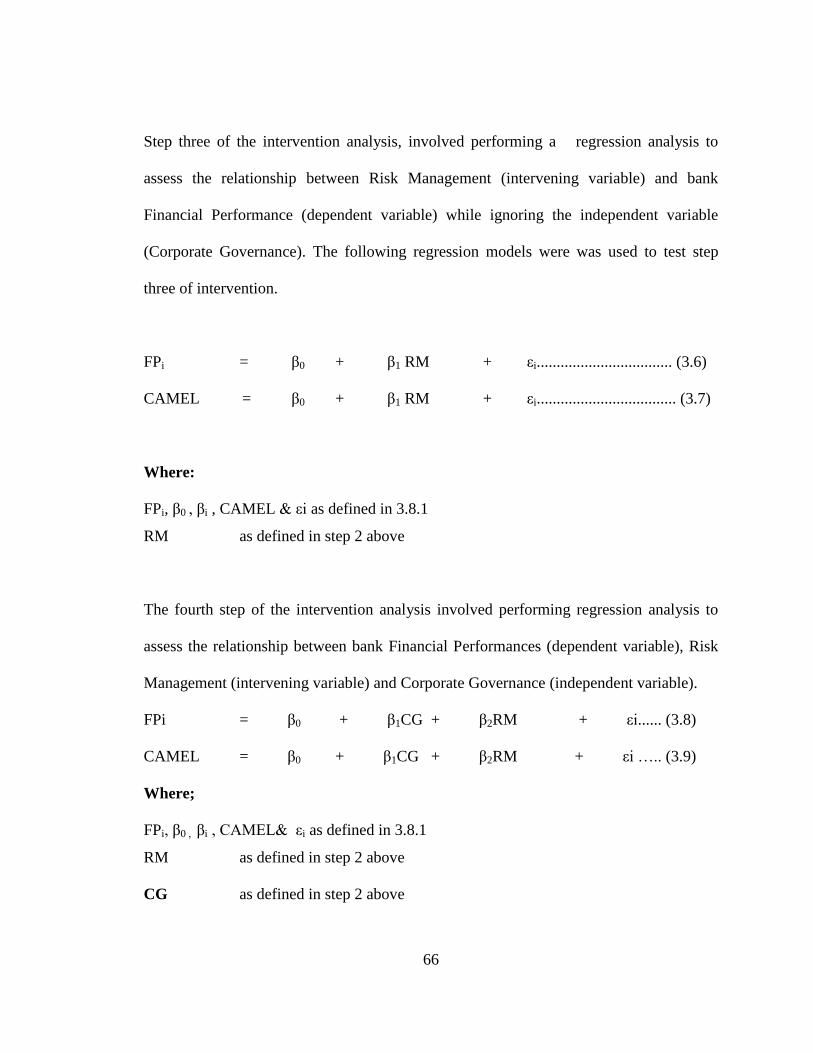
66
Step three of the intervention analysis, involved performing a regression analysis to
assess the relationship between Risk Management (intervening variable) and bank
Financial Performance (dependent variable) while ignoring the independent variable
(Corporate Governance). The following regression models were was used to test step
three of intervention.
FPi = β0 + β1 RM + εi.................................. (3.6)
CAMEL = β0 + β1 RM + εi................................... (3.7)
Where:
FPi, β0 , βi , CAMEL & εi as defined in 3.8.1
RM as defined in step 2 above
The fourth step of the intervention analysis involved performing regression analysis to
assess the relationship between bank Financial Performances (dependent variable), Risk
Management (intervening variable) and Corporate Governance (independent variable).
FPi = β0 + β1CG + β2RM + εi...... (3.8)
CAMEL = β0 + β1CG + β2RM + εi ….. (3.9)
Where;
FPi, β0 , βi , CAMEL& εi as defined in 3.8.1
RM as defined in step 2 above
CG as defined in step 2 above

67
Intervention occurs if Corporate Governance predicts bank Financial Performance,
Corporate Governance predicts Risk Management, Risk Management predicts bank
Financial Performance and still Corporate Governance predicts performance when Risk
Management is in the model.
3.8.3 Corporate Governance, Firm Characteristics and Bank Financial
Performance
Multiple regression models were used to determine the moderating effect of the Firm
Characteristics on the relationship between Corporate Governance and bank Financial
Performance attributes (Capital Adequacy, Asset Quality, Management Efficiency,
Earnings and Liquidity) as well as the composite CAMEL ratio. The methodology
suggested by Baron and Kenny (1986) was adopted as follows:
FPi = β0 + β1 (CG) + β2 (FC) + β3 (CG*FC) + εi ……. (3.10)
CAMEL = β0 + β1 (CG) + β2 (FC) + β3 (CG*FC) + εi ……. (3.11)
Where;
FPi, β0 , βi, CAMEL & εi as defined in 3.8.1
CG as defined in 3.8.2
FC Composite ratio of Firm Characteristics that was computed as a
geometric mean of the attributes of Firm Characteristics

68
3.8.4 Corporate Governance, Firm Characteristics, Risk Management
and Bank Financial Performance
Multiple regression models were used to determine the joint effect of Corporate
Governance, Firm Characteristics and Risk Management on bank financial performance.
The models used to test hypothesis four was as follows:
FPi=β0 + β1BC +β2BI + β3BS + β4CRM + β5BRM + β6LRM+ β7FS + β8FL + β9NAF+εi
….............................................................................................................................. (3.12)
CAMEL = β0 + β1BC +β2BI + β3BS + β4CRM + β5BRM + β6LRM+ β7FS + β8FL
+ β9NAF+εi ……................................................................................ (3.13)
Where:
FPi, BC, BI, BS β0 & εi are as defined in section 3.8.1 above
CRM Credit Risk Management
BRM Business Risk Management
LRM Liquidity Risk Management
FS Firm Size
FL Firm Leverage.
NAF Nature of the Audit Firm
β1….. Β9 Regression coefficients,
The objectives, hypotheses analytical models, and interpretation of the results are
summarized in Table 3.5 below:
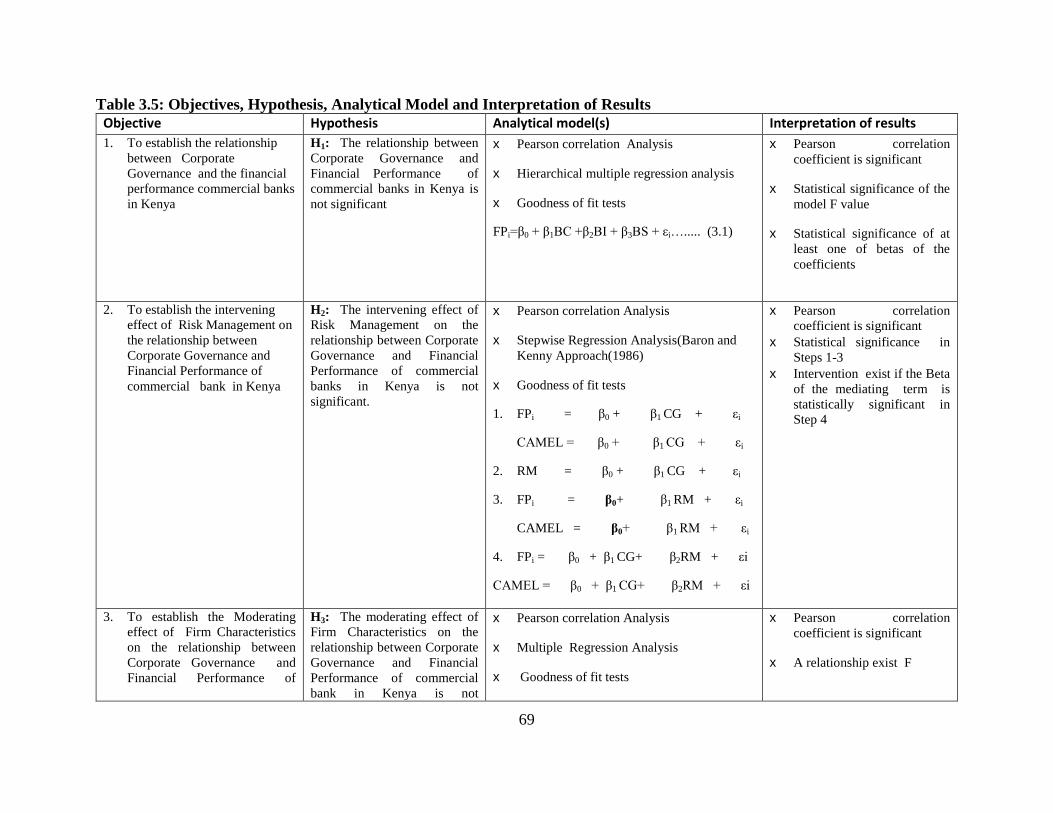
69
Table 3.5: Objectives, Hypothesis, Analytical Model and Interpretation of Results
Objective Hypothesis Analytical model(s) Interpretation of results
1. To establish the relationship
between Corporate
Governance and the financial
performance commercial banks
in Kenya
H1: The relationship between
Corporate Governance and
Financial Performance of
commercial banks in Kenya is
not significant
�x Pearson correlation Analysis
�x Hierarchical multiple regression analysis
�x Goodness of fit tests
FPi=β0 + β1BC +β2BI + β3BS + εi…..... (3.1)
�x Pearson correlation
coefficient is significant
�x Statistical significance of the
model F value
�x Statistical significance of at
least one of betas of the
coefficients
2. To establish the intervening
effect of Risk Management on
the relationship between
Corporate Governance and
Financial Performance of
commercial bank in Kenya
H2: The intervening effect of
Risk Management on the
relationship between Corporate
Governance and Financial
Performance of commercial
banks in Kenya is not
significant.
�x Pearson correlation Analysis
�x Stepwise Regression Analysis(Baron and
Kenny Approach(1986)
�x Goodness of fit tests
1. FPi = β0 + β1 CG + εi
CAMEL = β0 + β1 CG + εi
2. RM = β0 + β1 CG + εi
3. FPi = β0+ β1 RM + εi
CAMEL = β0+ β1 RM + εi
4. FPi = β0 + β1 CG+ β2RM + εi
CAMEL = β0 + β1 CG+ β2RM + εi
�x Pearson correlation
coefficient is significant
�x Statistical significance in
Steps 1-3
�x Intervention exist if the Beta
of the mediating term is
statistically significant in
Step 4
3. To establish the Moderating
effect of Firm Characteristics
on the relationship between
Corporate Governance and
Financial Performance of
H3: The moderating effect of
Firm Characteristics on the
relationship between Corporate
Governance and Financial
Performance of commercial
bank in Kenya is not
�x Pearson correlation Analysis
�x Multiple Regression Analysis
�x Goodness of fit tests
�x Pearson correlation
coefficient is significant
�x A relationship exist F

70
commercial banks in Kenya
significant. 1. FPi =β0 + β1CG + β2FC + β3(CG*FC)
2. CAMEL= β0 + β1CG + β2FC + β3(CG*FC)
is statistically significant
�x Statistical significance of
explanatory coefficients
4. To establish the joint effect of
Corporate Governance ,Risk
Management and Firm
Characteristics on the financial
performances of commercial
bank in Kenya
H4: The joint effect of
Corporate Governance, Risk
Management and Firm
Characteristics on the Financial
Performance of commercial
banks in Kenya is not
significant.
�x Pearson correlation Analysis
�x Multiple Regression Analysis
�x Goodness of fit tests
FPi = β0 + β1BC +β2BI + β3BS + β4CRM +
β5BRM + β6LRM+ β7FS + β8FL + β9NAF+εi
CAMEL = β0 + β1BC +β2BI + β3BS + β4CRM +
β5BRM + β6LRM+ β7FS + β8FL + β9NAF+εi
�x Pearson correlation
coefficient is significant A
relationship exists F value is
statistically significant
�x Statistical significance of
explanatory coefficients
Source: Researcher
71
CHAPTER FOUR
DESCRIPTIVE ANALYSIS AND RESULTS
4.1 Introduction
. Descriptive statistics are very important for the researcher to visualize the data was showing,
especially if there was a lot of it and also to present the data in a more meaningful way, which
allows simpler interpretation of the data. Whereas descriptive analysis relies solely on a sample
inferential statistics (hypothesis testing) enables the researcher to make generalisations about a
larger population. This chapter presents results of the diagnostic tests of the statistical
assumptions of the regression analysis as well as descriptive statistics of Corporate Governance,
Risk Management, Firm Characteristics and Financial Performance. Measures of central
tendency, dispersion and sleekness including mean, standard deviation and kurtosis are also
presented. The chapter concludes with a correlation analysis of the study variables.
4.2 Descriptive Statistics
Descriptive statistics included measures of mean, maximum, minimum, standard error of
estimate, skewness and kurtosis. Mean is a measure of central tendency used to describe the most
typical value in a set of values. The standard error is a statistical term that measures the accuracy
within a set of values. Skewness is a measure of symmetry, or more precisely, the lack of
symmetry. A distribution, or data set, is symmetric if it looks the same to the left and right of the
centre point. Kurtosis is a measure of whether the data are peaked or flat relative to a normal
distribution (Cooper & Schindler, 2003).
The results of the descriptive statistics of all the study variables for the number of observations
(N) are shown in Table 4.1 to 4.5 below:

72
Table 4.1: Financial Performance Descriptive Statistics
Capital
Adequacy
Asset
Quality
Management
Capacity Earnings Liquidity
CAMEL
Ratio
N Valid 209 209 209 209 210 210
Missing 1 1 1 1 0 0
Mean .241430 .045823 .765666 .024232 .051000 .224804
Median .197000 .033000 .757710 .027000 .052500 .215872
Std. Deviation .1482142 .0551310 .2374044 .0233923 .0030072 .0570096
Skewness 2.356 4.145 1.249 -1.859 -1.511 2.226
Std. Error of
Skewness .168 .168 .168 .168 .168 .168
Kurtosis 7.733 24.546 4.910 7.732 .285 8.821
Std. Error of Kurtosis .335 .335 .335 .335 .334 .334
Minimum .0000 .0000 .2020 -.1140 .0450 .0525
Maximum 1.1020 .4660 2.0440 .0730 .0525 .5549
Source: Research Findings
Table 4.1 above shows that Capital Adequacy, Asset Quality, Management Efficiency, Earnings,
Liquidity and CAMEL Ratio had a mean of .24±.15, .05±.06, .77±.24, .02±.02, .05±.00 and
022±.06 respectively. The results show Capital Adequacy, Asset Quality, Management Capacity
and CAMEL Ratio had positive skewneness while all the variables showed positive Kurtosis.
Table 4.2: Risk Management Descriptive Statistics
Liquidity Risk Mgt. Credit Risk Mgt. Business Risk Mgt.
N Valid 210 210 210
Missing 0 0 0
Mean .438210 .078552 .167114
Median .391000 .050500 .193000
Std. Deviation .1926412 .0945374 1.8504503
Skewness 1.707 2.960 -.432
Std. Error of Skewness .168 .168 .168
Kurtosis 4.629 10.534 29.883
Std. Error of Kurtosis .334 .334 .334
Minimum .0000 .0000 -12.8390
Maximum 1.2950 .6070 13.2000
Source: Research Findings

73
Table 4.2 above shows that Liquidity Risk Management, Credit Risk Management and Business
Risk Management had a mean of .44±.19, .08±.09 and .17±1.9 respectively. The results show
that Liquidity Risk Management and Credit Risk Management had positive skewneness while all
the variables showed positive Kurtosis.
Table 4.3: Corporate Governance Descriptive Statistics
Board Size Board Composition Board Independence
N Valid 210 210 210
Missing 0 0 0
Mean 8.88 .193375 .806625
Median 8.00 .166700 .8333000
Std. Deviation 2.567 .0874315 .0874315
Skewness 1.404 1.232 -1.232
Std. Error of Skewness .168 .168
Kurtosis 3.696 1.993 .168
Std. Error of Kurtosis .334 .334 .334
Minimum 5 .0526 .5000
Maximum 19 .5000 .9474
Source: Research Findings
Table 4.3 above shows that Board Size, Board Composition and Board independence had a mean
of 8.9±2.57, .193±.09 and .81±.09 respectively. The results show that Board Size and Board
composition had positive skewneness while Board independence had negative skewness and all
the variables showed positive Kurtosis.
Table 4.4: Firm Characteristics Descriptive Statistics
Nature of Audit Firm Firm Leverage Firm Size
N Valid 210 210 209
Missing 0 0 1
Mean .90 .244163 23.951177
Median 1.00 .192000 23.681700
Std. Deviation .294 .3219124 1.3127337
Skewness -2.778 8.281 .199
Std. Error of Skewness .168 .168 .168
Kurtosis 5.770 84.011 -.972
Std. Error of Kurtosis .334 .334 .335
Minimum 0 .0000 21.2754
Maximum 1 3.8890 26.6726
Source: Research Findings

74
Table 4.4 above shows that Nature of Audit Firm, Leverage and Firm Size had a mean of
.90±.29, .24±.32 and 23.95±1.31 respectively. The results show that Leverage and Firm Size had
positive skewneness with Nature of Audit Firm and Leverage showing positive Kurtosis.
Table 4.5: Summary Statistics of the Diagnostic Tests
Variable Mean Median Skewness Kurtosis
Corporate
Governance
Board Size 8.88 8 1.404 3.696
Board Composition 0.193375 0.1667 1.232 1.993
Board Independence 0.806625 0.8333 -1.232 0.168
Risk
Management
Liquidity Risk Mgt. 0.43821 0.391 1.707 4.629
Credit Risk Mgt. 0.078552 0.0505 2.96 10.534
Business Risk Mgt. 0.167114 0.193 -0.432 29.883
Firm
Characteristics
Nature of Audit Firm .90 1.00 -2.778 5.770
Leverage .244163 .192000 8.281 84.011
Firm Size 23.951177 23.681700 .199 -.972
Bank
Financial
Performance
Capital Adequacy 0.24143 0.197 2.356 7.733
Asset Quality 0.045823 0.033 4.145 24.546
Management Capacity 0.765666 0.75771 1.249 4.91
Earnings 0.024232 0.027 -1.859 7.732
Liquidity 0.051 0.0525 -1.511 0.285
Source: Reseach Findings
Table 4.5 above shows that Board Size, Board Composition and Board independence had mean
scores of 8.9±2.57, .193±.09 and .81±.09 respectively. The results show that Board Size and
Board composition had positive skewneness while Board independence had negative skewness.

75
Liquidity Risk Management, Credit Risk Management and Business Risk Management had a
mean of .44±.19, .08±.09 and .17±1.9 respectively. Liquidity Risk Management and Credit Risk
Management had positive skewneness. Nature of Audit Firm, Leverage and Firm Size had a
mean of .90±.29, .24±.32 and 23.95±1.31 respectively. Leverage and Firm Size had positive
skewneness. Capital Adequacy, Asset Quality, Management Efficiency, Earnings and Liquidity
had a mean of .24±.15, .05±.06, .77±.24, .02±.02 and .05±.00 respectively. The results show
Capital Adequacy, Asset Quality, Management Capacity and CAMEL Ratio had positive
skewneness. All the variables showed positive Kurtosis except firm size.
4.3 Diagnostic Tests of Statistical Assumptions
The classical linear regression model is based on a number of assumptions including linear
relationship, multivariate normality, no or little multicollinearity, no auto-correlation and
homoscedasticity. A multiple linear regression analysis was performed to test the assumptions
on the variables in the study. The Stepwise method was used to enter the variables in the
equation. The results of the diagnostic tests conducted on the data are presented below.
4.3.1 Financial Performance Panel Data Independence Test
Linear regression analysis requires that there is little or no autocorrelation in the data.
Autocorrelation occurs when the residuals are not independent from each other. The Durbin –
Watson (1951) statistic was used to test the autocorrelation in the panel data. The results are
presented in Table 4.6 below
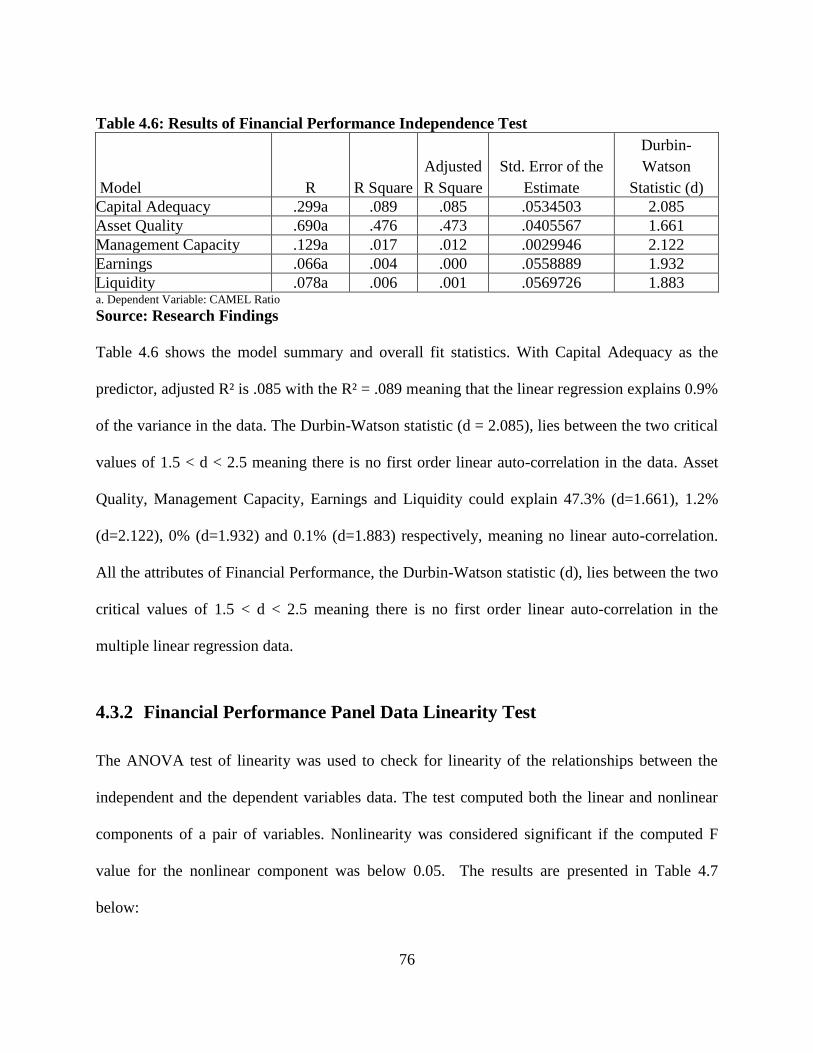
76
Table 4.6: Results of Financial Performance Independence Test
Model R R Square
Adjusted
R Square
Std. Error of the
Estimate
Durbin-
Watson
Statistic (d)
Capital Adequacy .299a .089 .085 .0534503 2.085
Asset Quality .690a .476 .473 .0405567 1.661
Management Capacity .129a .017 .012 .0029946 2.122
Earnings .066a .004 .000 .0558889 1.932
Liquidity .078a .006 .001 .0569726 1.883 a. Dependent Variable: CAMEL Ratio
Source: Research Findings
Table 4.6 shows the model summary and overall fit statistics. With Capital Adequacy as the
predictor, adjusted R² is .085 with the R² = .089 meaning that the linear regression explains 0.9%
of the variance in the data. The Durbin-Watson statistic (d = 2.085), lies between the two critical
values of 1.5 < d < 2.5 meaning there is no first order linear auto-correlation in the data. Asset
Quality, Management Capacity, Earnings and Liquidity could explain 47.3% (d=1.661), 1.2%
(d=2.122), 0% (d=1.932) and 0.1% (d=1.883) respectively, meaning no linear auto-correlation.
All the attributes of Financial Performance, the Durbin-Watson statistic (d), lies between the two
critical values of 1.5 < d < 2.5 meaning there is no first order linear auto-correlation in the
multiple linear regression data.
4.3.2 Financial Performance Panel Data Linearity Test
The ANOVA test of linearity was used to check for linearity of the relationships between the
independent and the dependent variables data. The test computed both the linear and nonlinear
components of a pair of variables. Nonlinearity was considered significant if the computed F
value for the nonlinear component was below 0.05. The results are presented in Table 4.7
below:
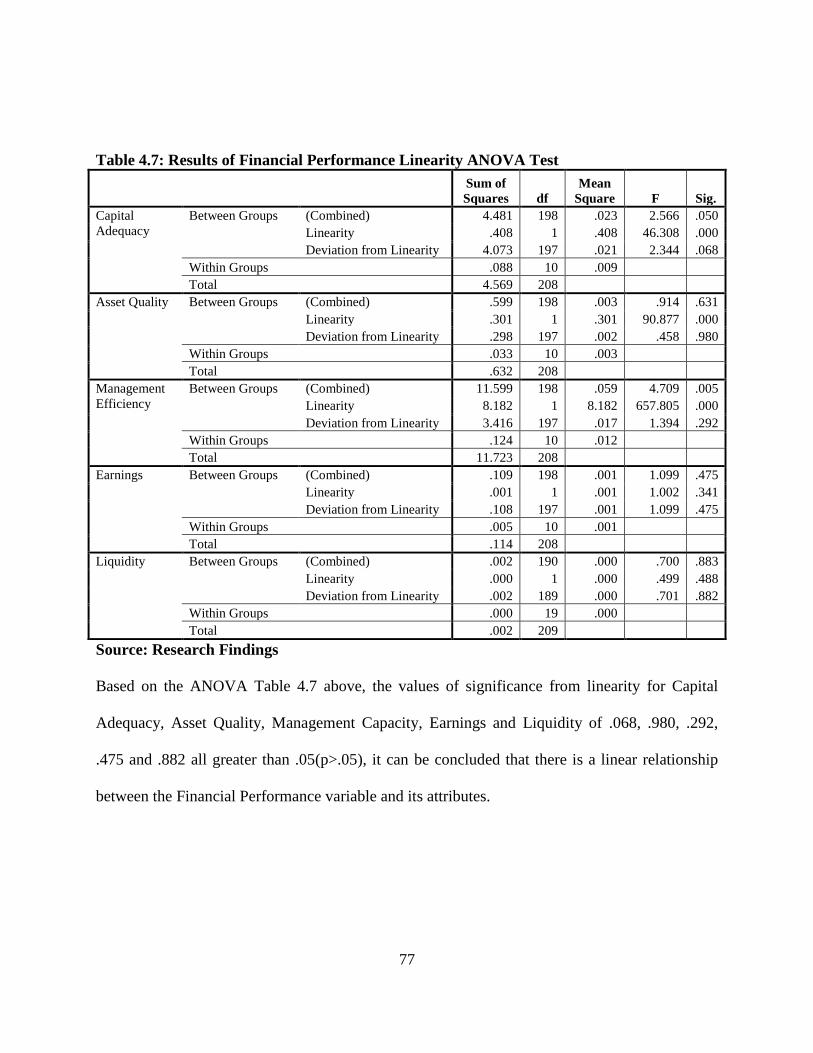
77
Table 4.7: Results of Financial Performance Linearity ANOVA Test
Sum of
Squares df
Mean
Square F Sig.
Capital
Adequacy
Between Groups (Combined) 4.481 198 .023 2.566 .050
Linearity .408 1 .408 46.308 .000
Deviation from Linearity 4.073 197 .021 2.344 .068
Within Groups .088 10 .009
Total 4.569 208
Asset Quality Between Groups (Combined) .599 198 .003 .914 .631
Linearity .301 1 .301 90.877 .000
Deviation from Linearity .298 197 .002 .458 .980
Within Groups .033 10 .003
Total .632 208
Management
Efficiency
Between Groups (Combined) 11.599 198 .059 4.709 .005
Linearity 8.182 1 8.182 657.805 .000
Deviation from Linearity 3.416 197 .017 1.394 .292
Within Groups .124 10 .012
Total 11.723 208
Earnings Between Groups (Combined) .109 198 .001 1.099 .475
Linearity .001 1 .001 1.002 .341
Deviation from Linearity .108 197 .001 1.099 .475
Within Groups .005 10 .001
Total .114 208
Liquidity Between Groups (Combined) .002 190 .000 .700 .883
Linearity .000 1 .000 .499 .488
Deviation from Linearity .002 189 .000 .701 .882
Within Groups .000 19 .000
Total .002 209
Source: Research Findings
Based on the ANOVA Table 4.7 above, the values of significance from linearity for Capital
Adequacy, Asset Quality, Management Capacity, Earnings and Liquidity of .068, .980, .292,
.475 and .882 all greater than .05(p>.05), it can be concluded that there is a linear relationship
between the Financial Performance variable and its attributes.

78
4.3.3 Financial Performance Panel Data Multicollinearity Test
Multicollinearity occurs when the variables are not independent from each other meaning one
independent variables can be linearly predicted from the others with some reasonable degree of
accuracy (Woolridge, 2002). The presence of multicollinearity in the Financial Performance was
assessed using the VIF (Tolerance) test. The results are presented in Table 4.8 below:
Table 4.8: Results of Financial Performance Multicollinearity Test
Model
Unstandardized
Coefficients
Standardized
Coefficients t
Sig.
Collinearity
Statistics
B Std.
Error Beta Tolerance VIF
1 (Constant) .075 .007 10.418 .000
Management
Capacity .197 .009 .835 21.871 .000 1.000 1.000
2 (Constant) .000 .002 .169 .866
Management
Capacity .229 .003 .974 88.942 .000 .936 1.069
Capital Adequacy .206 .004 .546 49.861 .000 .936 1.069
3 (Constant) .015 .001 10.491 .000
Management
Capacity .205 .002 .869 124.570 .000 .588 1.701
Capital Adequacy .193 .002 .513 90.115 .000 .884 1.132
Asset Quality .168 .007 .166 24.539 .000 .627 1.594
4 (Constant) .010 .000 50.277 .000
Management
Capacity .201 .000 .852 866.491 .000 .570 1.754
Capital Adequacy .200 .000 .530 656.484 .000 .845 1.184
Asset Quality .198 .001 .196 199.278 .000 .571 1.750
Earnings .198 .002 .083 102.198 .000 .841 1.189
5 (Constant) 6.765E-17 .000 .000 1.000
Management
Capacity .200 .000 .850 286025831.516 .000 .555 1.802
Capital Adequacy .200 .000 .530 220287508.905 .000 .845 1.184
Asset Quality .200 .000 .197 66964168.788 .000 .564 1.773
Earnings .200 .000 .084 34571118.013 .000 .835 1.198
Liquidity .200 .000 .011 4791583.802 .000 .967 1.034 a. Dependent Variable: CAMEL Ratio
Source: Research Findings
In the stepwise multiple linear regression analysis, there are highly significant coefficients. When
Camel Ratio was predicted against the attributes of Financial Performance, it was found that
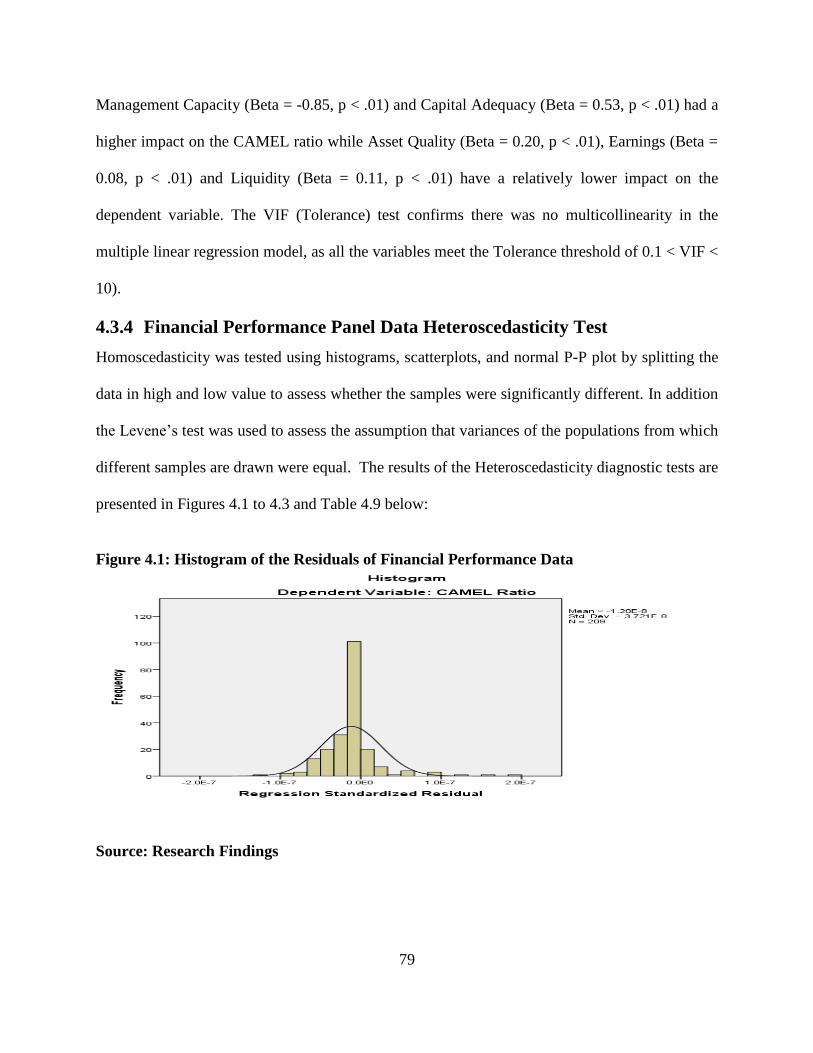
79
Management Capacity (Beta = -0.85, p < .01) and Capital Adequacy (Beta = 0.53, p < .01) had a
higher impact on the CAMEL ratio while Asset Quality (Beta = 0.20, p < .01), Earnings (Beta =
0.08, p < .01) and Liquidity (Beta = 0.11, p < .01) have a relatively lower impact on the
dependent variable. The VIF (Tolerance) test confirms there was no multicollinearity in the
multiple linear regression model, as all the variables meet the Tolerance threshold of 0.1 < VIF <
10).
4.3.4 Financial Performance Panel Data Heteroscedasticity Test
Homoscedasticity was tested using histograms, scatterplots, and normal P-P plot by splitting the
data in high and low value to assess whether the samples were significantly different. In addition
the Levene‟s test was used to assess the assumption that variances of the populations from which
different samples are drawn were equal. The results of the Heteroscedasticity diagnostic tests are
presented in Figures 4.1 to 4.3 and Table 4.9 below:
Figure 4.1: Histogram of the Residuals of Financial Performance Data
Source: Research Findings

80
The histogram above shows a normal distribution of the data and no evidence of
heteroscedasticity.
Figure 4.2: Scatterplot of the Residuals of Financial Performance Variable
Source: Research Findings
Figure 4.2 above shows there was no tendency in the error terms hence providence evidence of
no heteroscedasticity in the data.

81
Figure 4.3: Normal P-P Plot of Regression Standardized Residual of Financial
Performamnce Data
Source: Research Findings
The Normal P-P Plot in Figures 4.3 above shows there was no evidence of heteroscedasticity in
the Financial Performance panel data
Figures 4.1 to 4. 3 for testing for homoscedasticity and normality of residuals in the multiple
linear regression analysis there was no tendency in the error terms and no heteroscedasticity in
the Financial Performance data.
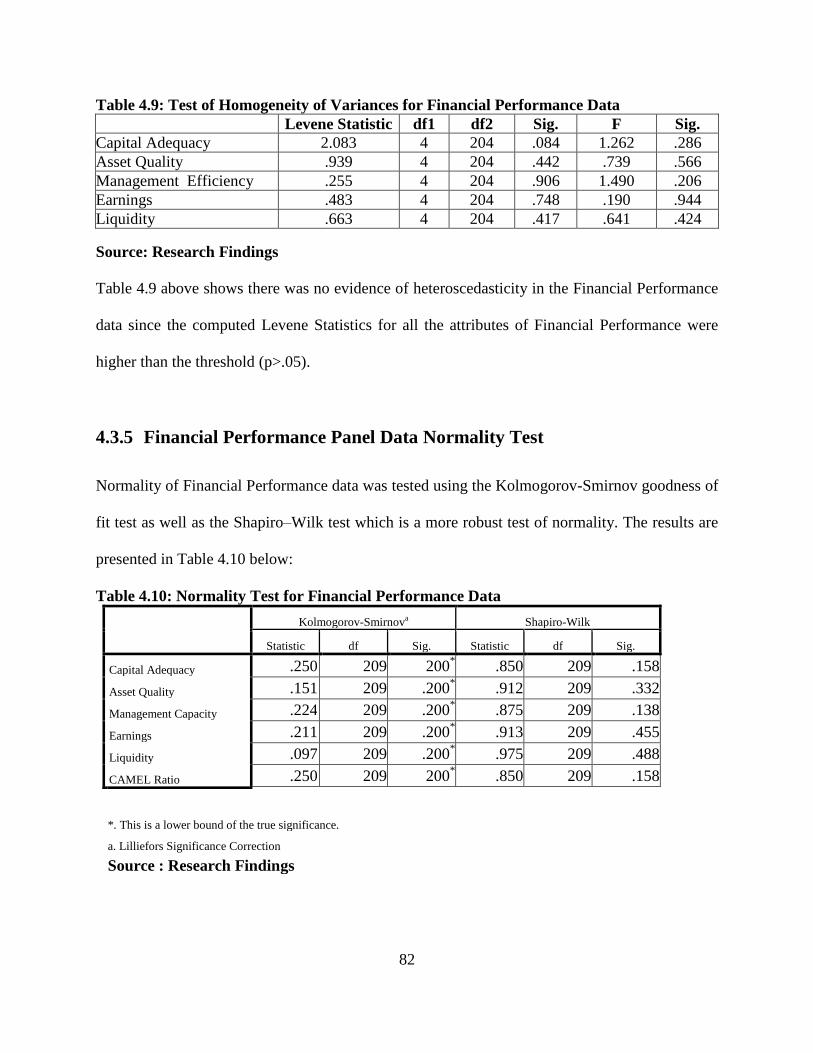
82
Table 4.9: Test of Homogeneity of Variances for Financial Performance Data
Levene Statistic df1 df2 Sig. F Sig.
Capital Adequacy 2.083 4 204 .084 1.262 .286
Asset Quality .939 4 204 .442 .739 .566
Management Efficiency .255 4 204 .906 1.490 .206
Earnings .483 4 204 .748 .190 .944
Liquidity .663 4 204 .417 .641 .424
Source: Research Findings
Table 4.9 above shows there was no evidence of heteroscedasticity in the Financial Performance
data since the computed Levene Statistics for all the attributes of Financial Performance were
higher than the threshold (p>.05).
4.3.5 Financial Performance Panel Data Normality Test
Normality of Financial Performance data was tested using the Kolmogorov-Smirnov goodness of
fit test as well as the Shapiro–Wilk test which is a more robust test of normality. The results are
presented in Table 4.10 below:
Table 4.10: Normality Test for Financial Performance Data
Kolmogorov-Smirnova Shapiro-Wilk
Statistic df Sig. Statistic df Sig.
Capital Adequacy .250 209 200* .850 209 .158
Asset Quality .151 209 .200* .912 209 .332
Management Capacity .224 209 .200* .875 209 .138
Earnings .211 209 .200* .913 209 .455
Liquidity .097 209 .200* .975 209 .488
CAMEL Ratio .250 209 200* .850 209 .158
*. This is a lower bound of the true significance.
a. Lilliefors Significance Correction
Source : Research Findings
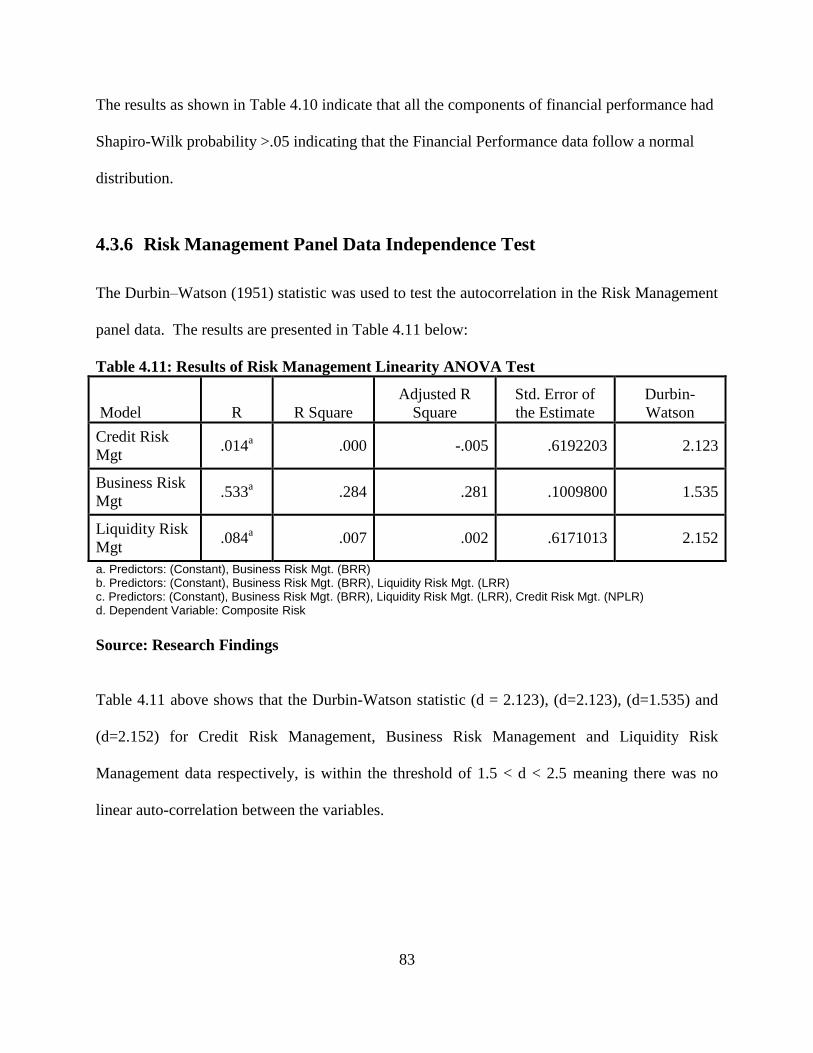
83
The results as shown in Table 4.10 indicate that all the components of financial performance had
Shapiro-Wilk probability >.05 indicating that the Financial Performance data follow a normal
distribution.
4.3.6 Risk Management Panel Data Independence Test
The Durbin–Watson (1951) statistic was used to test the autocorrelation in the Risk Management
panel data. The results are presented in Table 4.11 below:
Table 4.11: Results of Risk Management Linearity ANOVA Test
Model R R Square
Adjusted R
Square
Std. Error of
the Estimate
Durbin-
Watson
Credit Risk
Mgt .014
a .000 -.005 .6192203 2.123
Business Risk
Mgt .533
a .284 .281 .1009800 1.535
Liquidity Risk
Mgt .084
a .007 .002 .6171013 2.152
a. Predictors: (Constant), Business Risk Mgt. (BRR) b. Predictors: (Constant), Business Risk Mgt. (BRR), Liquidity Risk Mgt. (LRR) c. Predictors: (Constant), Business Risk Mgt. (BRR), Liquidity Risk Mgt. (LRR), Credit Risk Mgt. (NPLR) d. Dependent Variable: Composite Risk
Source: Research Findings
Table 4.11 above shows that the Durbin-Watson statistic (d = 2.123), (d=2.123), (d=1.535) and
(d=2.152) for Credit Risk Management, Business Risk Management and Liquidity Risk
Management data respectively, is within the threshold of 1.5 < d < 2.5 meaning there was no
linear auto-correlation between the variables.
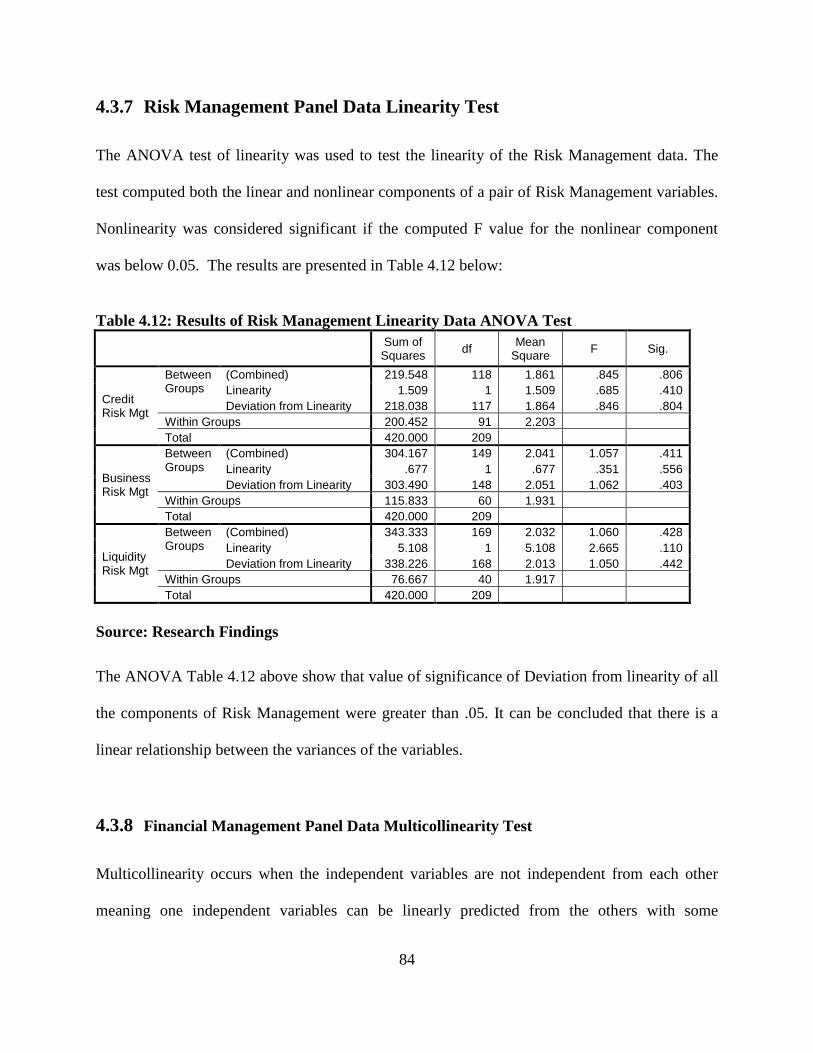
84
4.3.7 Risk Management Panel Data Linearity Test
The ANOVA test of linearity was used to test the linearity of the Risk Management data. The
test computed both the linear and nonlinear components of a pair of Risk Management variables.
Nonlinearity was considered significant if the computed F value for the nonlinear component
was below 0.05. The results are presented in Table 4.12 below:
Table 4.12: Results of Risk Management Linearity Data ANOVA Test
Sum of
Squares df
Mean Square
F Sig.
Credit Risk Mgt
Between Groups
(Combined) 219.548 118 1.861 .845 .806
Linearity 1.509 1 1.509 .685 .410
Deviation from Linearity 218.038 117 1.864 .846 .804
Within Groups 200.452 91 2.203
Total 420.000 209
Business Risk Mgt
Between Groups
(Combined) 304.167 149 2.041 1.057 .411
Linearity .677 1 .677 .351 .556
Deviation from Linearity 303.490 148 2.051 1.062 .403
Within Groups 115.833 60 1.931
Total 420.000 209
Liquidity Risk Mgt
Between Groups
(Combined) 343.333 169 2.032 1.060 .428
Linearity 5.108 1 5.108 2.665 .110
Deviation from Linearity 338.226 168 2.013 1.050 .442
Within Groups 76.667 40 1.917
Total 420.000 209
Source: Research Findings
The ANOVA Table 4.12 above show that value of significance of Deviation from linearity of all
the components of Risk Management were greater than .05. It can be concluded that there is a
linear relationship between the variances of the variables.
4.3.8 Financial Management Panel Data Multicollinearity Test
Multicollinearity occurs when the independent variables are not independent from each other
meaning one independent variables can be linearly predicted from the others with some
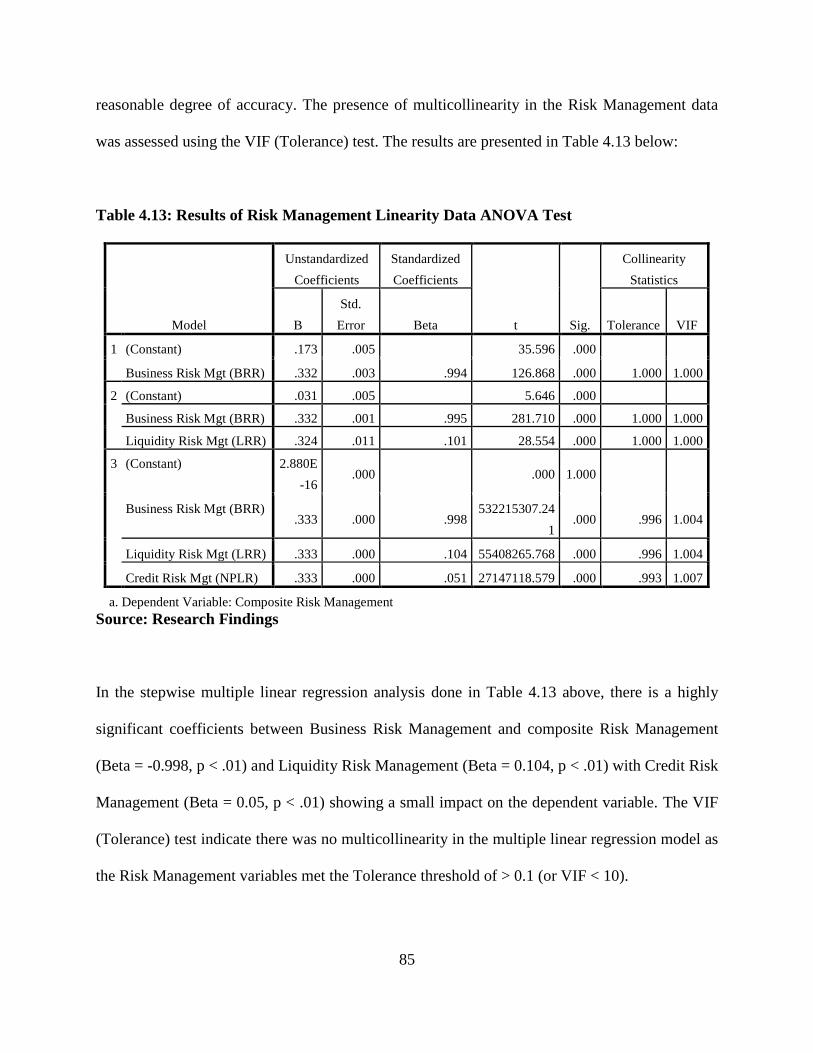
85
reasonable degree of accuracy. The presence of multicollinearity in the Risk Management data
was assessed using the VIF (Tolerance) test. The results are presented in Table 4.13 below:
Table 4.13: Results of Risk Management Linearity Data ANOVA Test
Model
Unstandardized
Coefficients
Standardized
Coefficients
t Sig.
Collinearity
Statistics
B
Std.
Error Beta Tolerance VIF
1 (Constant) .173 .005 35.596 .000
Business Risk Mgt (BRR) .332 .003 .994 126.868 .000 1.000 1.000
2 (Constant) .031 .005 5.646 .000
Business Risk Mgt (BRR) .332 .001 .995 281.710 .000 1.000 1.000
Liquidity Risk Mgt (LRR) .324 .011 .101 28.554 .000 1.000 1.000
3 (Constant) 2.880E
-16 .000 .000 1.000
Business Risk Mgt (BRR) .333 .000 .998
532215307.24
1 .000 .996 1.004
Liquidity Risk Mgt (LRR) .333 .000 .104 55408265.768 .000 .996 1.004
Credit Risk Mgt (NPLR) .333 .000 .051 27147118.579 .000 .993 1.007
a. Dependent Variable: Composite Risk Management
Source: Research Findings
In the stepwise multiple linear regression analysis done in Table 4.13 above, there is a highly
significant coefficients between Business Risk Management and composite Risk Management
(Beta = -0.998, p < .01) and Liquidity Risk Management (Beta = 0.104, p < .01) with Credit Risk
Management (Beta = 0.05, p < .01) showing a small impact on the dependent variable. The VIF
(Tolerance) test indicate there was no multicollinearity in the multiple linear regression model as
the Risk Management variables met the Tolerance threshold of > 0.1 (or VIF < 10).

86
4.3.10 Risk Management Panel Data Heteroscedasticity Test
The presence of Heteroscedasticity in the Risk Management was tested based on the histogram,
normal P-P plot of the standardized residuals, the scatter plot of residuals as well the Levene‟s
test. The results are shown in Figures 4.4 to 4.6 and Table 4.14 below:
Figure 4.4: Histogram of the Residuals of Risk Management Data
Source: Research Findings
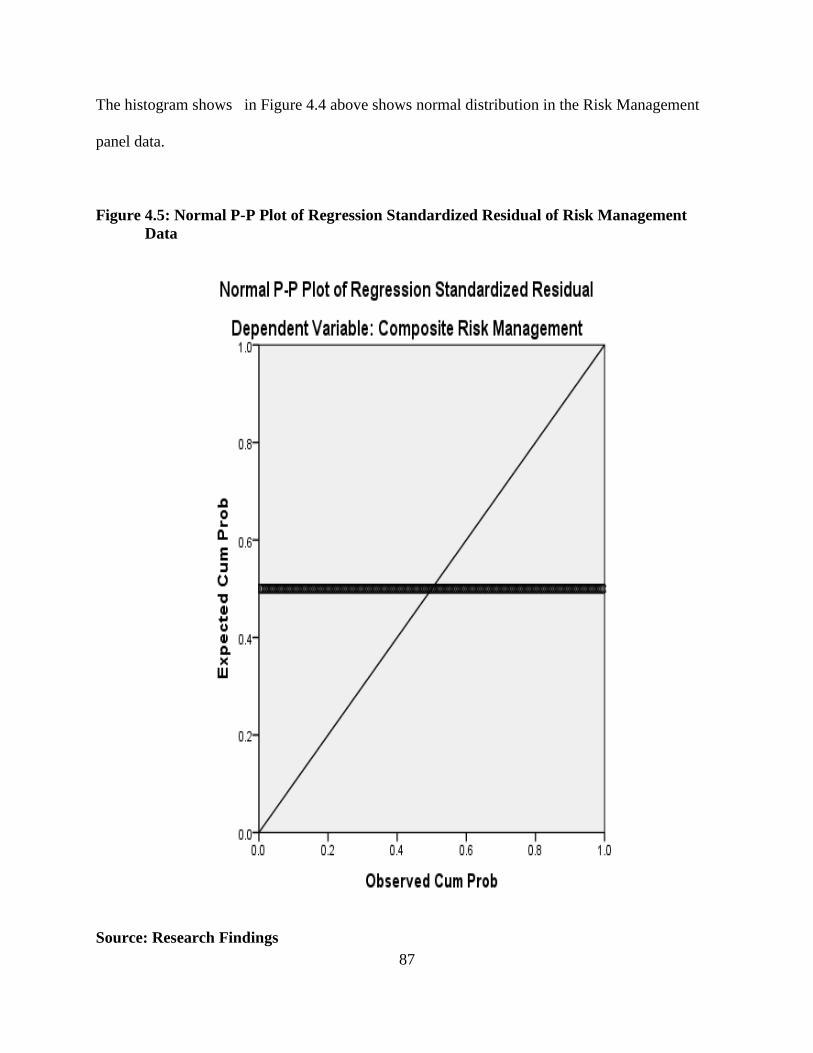
87
The histogram shows in Figure 4.4 above shows normal distribution in the Risk Management
panel data.
Figure 4.5: Normal P-P Plot of Regression Standardized Residual of Risk Management
Data
Source: Research Findings

88
The Normal P-P Plot in Figures 4.5 above shows there was no evidence of heteroscedasticity in
the Risk Management panel data
Figure 4.6: Scatterplot the Residuals of Financial Performance Data
No evidence of heteroscedasticity in the data
Source: Research Findings
Table 4.14: Test of Homogeneity of Variances for Risk Management data
Levene
Statistic df1 df2 Sig. F Sig.
Credit Risk Mgt 1.767 4 205 .137 .872 .482
Business Risk Mgt .085 4 205 .987 .606 .658
Liquidity Risk Mgt .396 4 205 .811 .867 .485
Source: Research Findings
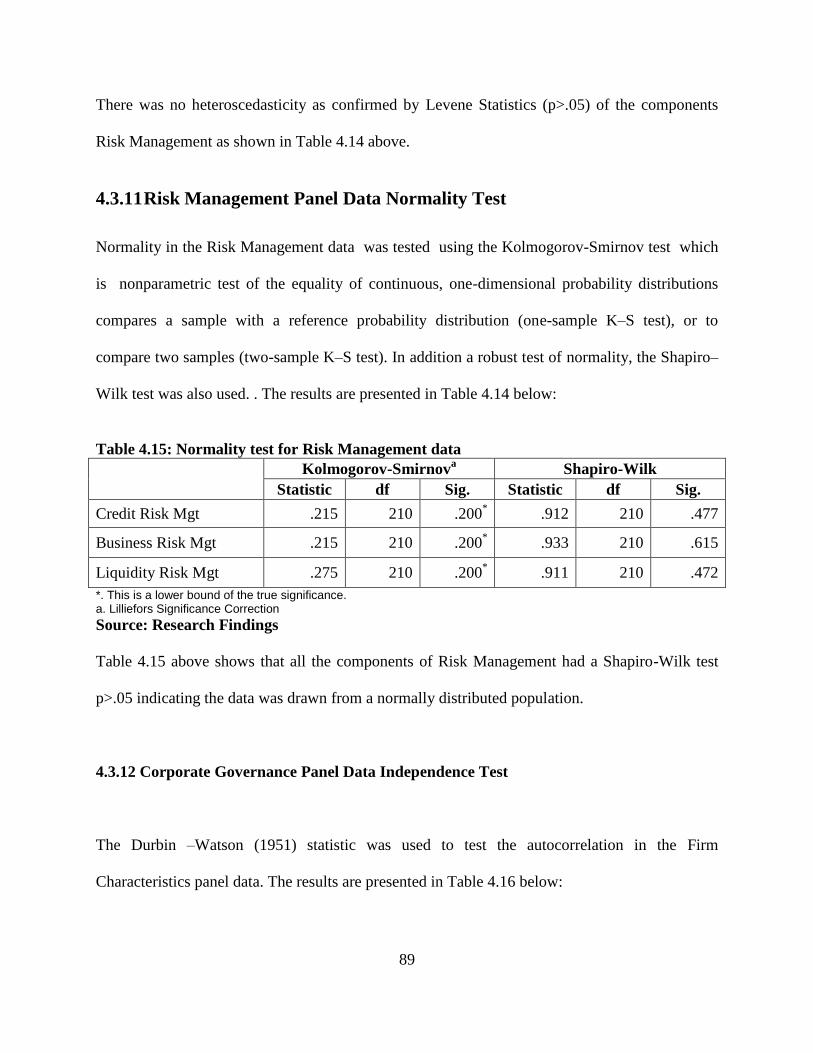
89
There was no heteroscedasticity as confirmed by Levene Statistics (p>.05) of the components
Risk Management as shown in Table 4.14 above.
4.3.11 Risk Management Panel Data Normality Test
Normality in the Risk Management data was tested using the Kolmogorov-Smirnov test which
is nonparametric test of the equality of continuous, one-dimensional probability distributions
compares a sample with a reference probability distribution (one-sample K–S test), or to
compare two samples (two-sample K–S test). In addition a robust test of normality, the Shapiro–
Wilk test was also used. . The results are presented in Table 4.14 below:
Table 4.15: Normality test for Risk Management data
Kolmogorov-Smirnov
a Shapiro-Wilk
Statistic df Sig. Statistic df Sig.
Credit Risk Mgt .215 210 .200* .912 210 .477
Business Risk Mgt .215 210 .200* .933 210 .615
Liquidity Risk Mgt .275 210 .200* .911 210 .472
*. This is a lower bound of the true significance. a. Lilliefors Significance Correction Source: Research Findings
Table 4.15 above shows that all the components of Risk Management had a Shapiro-Wilk test
p>.05 indicating the data was drawn from a normally distributed population.
4.3.12 Corporate Governance Panel Data Independence Test
The Durbin –Watson (1951) statistic was used to test the autocorrelation in the Firm
Characteristics panel data. The results are presented in Table 4.16 below:
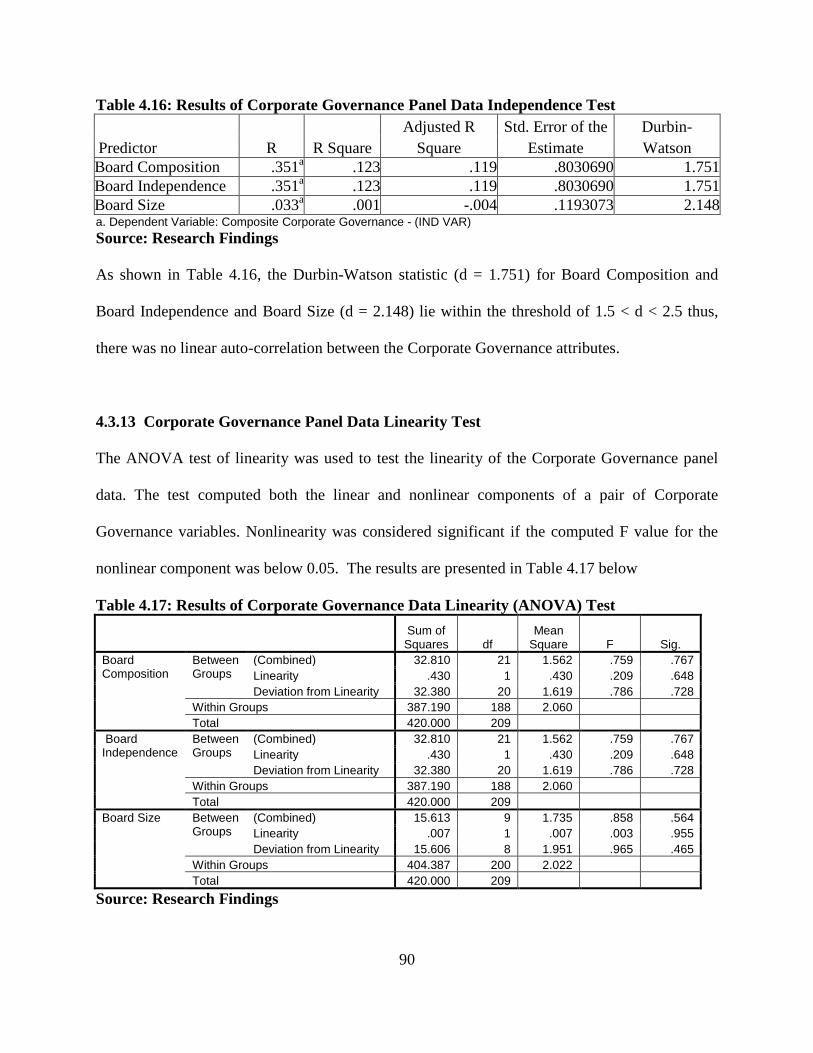
90
Table 4.16: Results of Corporate Governance Panel Data Independence Test
Predictor R R Square
Adjusted R
Square
Std. Error of the
Estimate
Durbin-
Watson
Board Composition .351a .123 .119 .8030690 1.751
Board Independence .351a .123 .119 .8030690 1.751
Board Size .033a .001 -.004 .1193073 2.148
a. Dependent Variable: Composite Corporate Governance - (IND VAR) Source: Research Findings
As shown in Table 4.16, the Durbin-Watson statistic (d = 1.751) for Board Composition and
Board Independence and Board Size (d = 2.148) lie within the threshold of 1.5 < d < 2.5 thus,
there was no linear auto-correlation between the Corporate Governance attributes.
4.3.13 Corporate Governance Panel Data Linearity Test
The ANOVA test of linearity was used to test the linearity of the Corporate Governance panel
data. The test computed both the linear and nonlinear components of a pair of Corporate
Governance variables. Nonlinearity was considered significant if the computed F value for the
nonlinear component was below 0.05. The results are presented in Table 4.17 below
Table 4.17: Results of Corporate Governance Data Linearity (ANOVA) Test
Sum of Squares df
Mean Square F Sig.
Board Composition
Between Groups
(Combined) 32.810 21 1.562 .759 .767
Linearity .430 1 .430 .209 .648
Deviation from Linearity 32.380 20 1.619 .786 .728
Within Groups 387.190 188 2.060
Total 420.000 209
Board Independence
Between Groups
(Combined) 32.810 21 1.562 .759 .767
Linearity .430 1 .430 .209 .648
Deviation from Linearity 32.380 20 1.619 .786 .728
Within Groups 387.190 188 2.060
Total 420.000 209
Board Size Between Groups
(Combined) 15.613 9 1.735 .858 .564
Linearity .007 1 .007 .003 .955
Deviation from Linearity 15.606 8 1.951 .965 .465
Within Groups 404.387 200 2.022
Total 420.000 209
Source: Research Findings
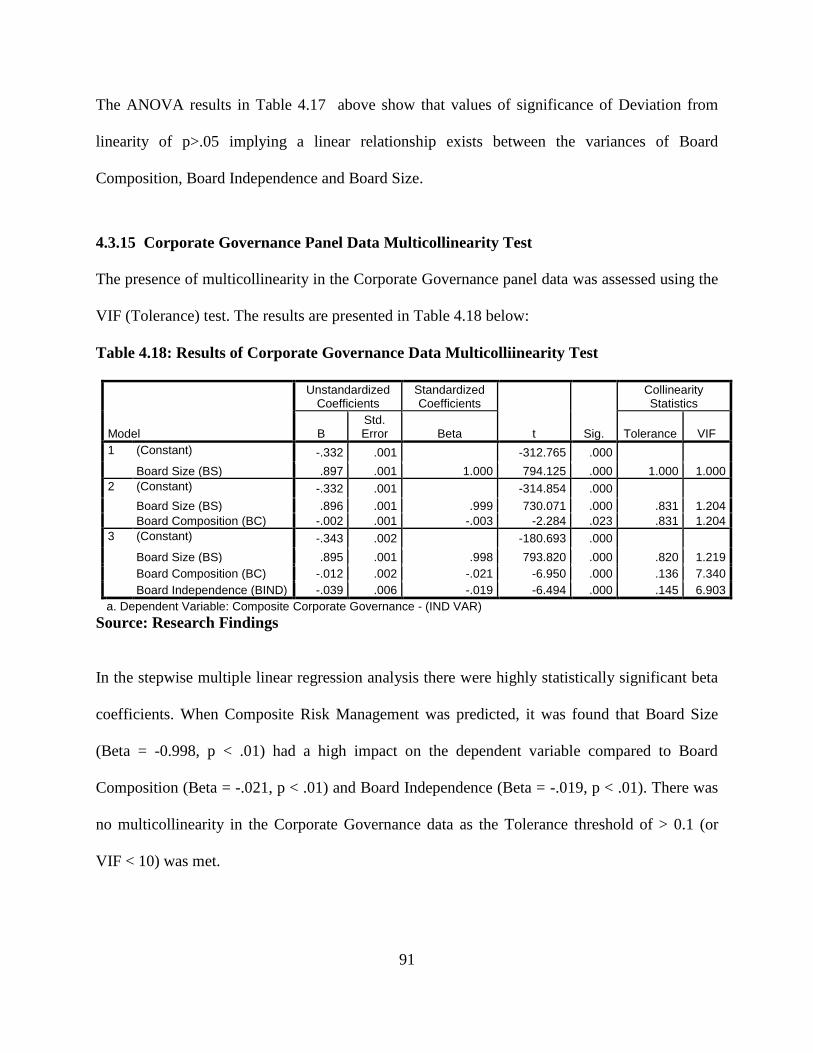
91
The ANOVA results in Table 4.17 above show that values of significance of Deviation from
linearity of p>.05 implying a linear relationship exists between the variances of Board
Composition, Board Independence and Board Size.
4.3.15 Corporate Governance Panel Data Multicollinearity Test
The presence of multicollinearity in the Corporate Governance panel data was assessed using the
VIF (Tolerance) test. The results are presented in Table 4.18 below:
Table 4.18: Results of Corporate Governance Data Multicolliinearity Test
Model
Unstandardized Coefficients
Standardized Coefficients
t Sig.
Collinearity Statistics
B Std. Error Beta Tolerance VIF
1 (Constant) -.332 .001 -312.765 .000 Board Size (BS) .897 .001 1.000 794.125 .000 1.000 1.000
2 (Constant) -.332 .001 -314.854 .000 Board Size (BS) .896 .001 .999 730.071 .000 .831 1.204
Board Composition (BC) -.002 .001 -.003 -2.284 .023 .831 1.204
3 (Constant) -.343 .002 -180.693 .000 Board Size (BS) .895 .001 .998 793.820 .000 .820 1.219
Board Composition (BC) -.012 .002 -.021 -6.950 .000 .136 7.340
Board Independence (BIND) -.039 .006 -.019 -6.494 .000 .145 6.903
a. Dependent Variable: Composite Corporate Governance - (IND VAR)
Source: Research Findings
In the stepwise multiple linear regression analysis there were highly statistically significant beta
coefficients. When Composite Risk Management was predicted, it was found that Board Size
(Beta = -0.998, p < .01) had a high impact on the dependent variable compared to Board
Composition (Beta = -.021, p < .01) and Board Independence (Beta = -.019, p < .01). There was
no multicollinearity in the Corporate Governance data as the Tolerance threshold of > 0.1 (or
VIF < 10) was met.

92
4.3.16 Corporate Governance Panel Data Heteroscedasticity Test
The presence of Heteroscedasticity in the Corporate Governance panel data was tested based on
the histogram, normal P-P plot of the standardized residuals, the scatter plot of residuals as well
the Levene‟s test. The results are shown in Figures 4.7 to 4.9 and Table 4.19 below
Figure 4.7: Histogram of the Residuals of Corporate Governance Data
Source: Research Findings
The histogram shows in Figure 4.7 above shows near normal distribution in the Corporate
Governance panel data.

93
Figure 4.8: Normal P-P Plot of Regression Standardized Residual of Corporate
Governance Data
Source: Research Findings
The Normal P-P Plot in Figures 4.5 above shows there was no evidence of heteroscedasticity in
the Corporate Governance panel data

94
Figure 4.9: Scatterplot the Residuals of Corporate Governance data
Source: Research Findings
No evidence of heteroscedasticity in the Corporate Governance data as shown in Figure 4.9
above.

95
Table 4.19: Test of Homogeneity of Variances for Corporate Governance Panel Data
Levene
Statistic df1 df2 Sig. F Sig.
Board Composition .194 4 205 .942 .073 .990
Board Independence .194 4 205 .942 .073 .990
Board Size .021 4 205 .999 .006 1.000
Source: Research Findings
There was no heteroscedasticity as confirmed by Levene Statistics (p>.05) of the components of
Corporate Governance as shown in Table 4.19 above.
4.3.16 Corporate Governance Panel Data Normality Test
Normality of the Corporate Governance data was assessed using the goodness of fit test, the
Kolmogorov-Smirnov test, as well as the more robust test of normality, Shapiro–Wilk test. A
non-linear transformation, log-transformation was used to fix data that was not normally
distributed. The results are presented in Table 4.20 below:
Table 4.20: Corporate Governance Panel Data Normality Test
Kolmogorov-Smirnov
g Shapiro-Wilk
Statistic df Sig. Statistic df Sig.
Board Composition .26 210 .200* .905 210 .404
Board Independence .203 210 .200* .877 210 .294
Board Size .254 210 .200* .914 210 .492
a. Lilliefors Significance Correction
Table 4.20 above shows that all the components of corporate governance had a Shapiro-Wilk test
p>.05 indicating the data was drawn from a normally distributed population.
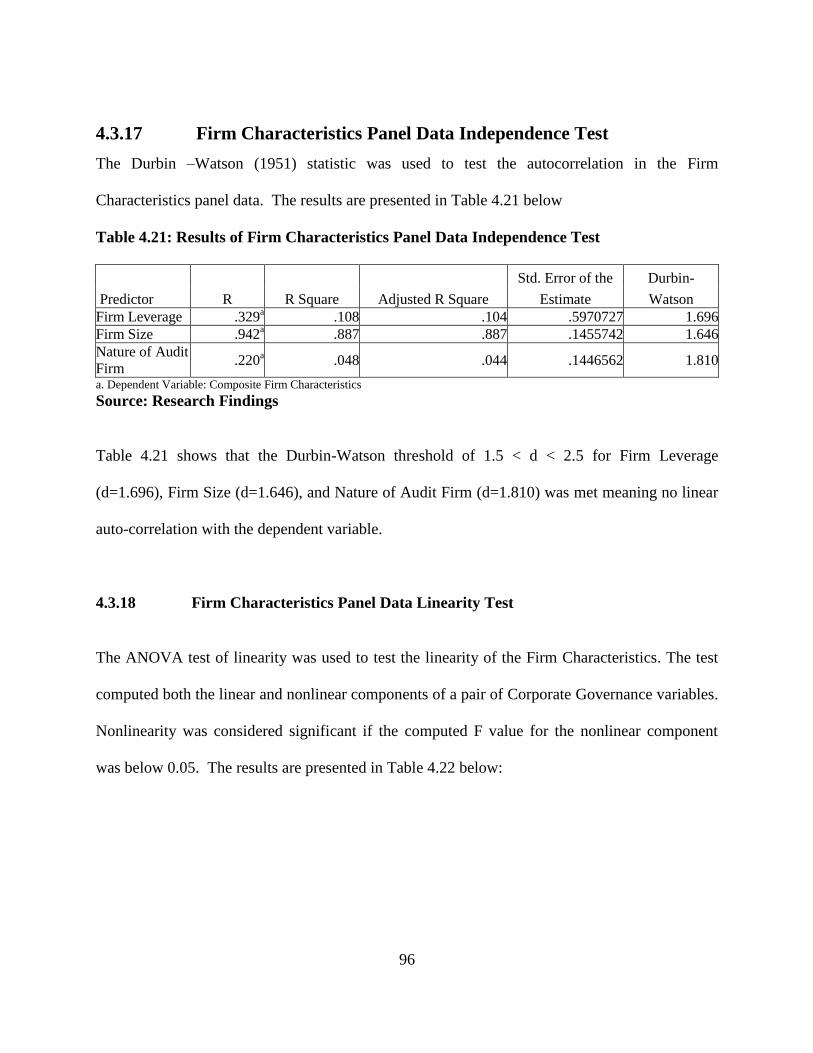
96
4.3.17 Firm Characteristics Panel Data Independence Test
The Durbin –Watson (1951) statistic was used to test the autocorrelation in the Firm
Characteristics panel data. The results are presented in Table 4.21 below
Table 4.21: Results of Firm Characteristics Panel Data Independence Test
Predictor R R Square Adjusted R Square
Std. Error of the
Estimate
Durbin-
Watson
Firm Leverage .329a .108 .104 .5970727 1.696
Firm Size .942a .887 .887 .1455742 1.646
Nature of Audit
Firm .220
a .048 .044 .1446562 1.810
a. Dependent Variable: Composite Firm Characteristics
Source: Research Findings
Table 4.21 shows that the Durbin-Watson threshold of 1.5 < d < 2.5 for Firm Leverage
(d=1.696), Firm Size (d=1.646), and Nature of Audit Firm (d=1.810) was met meaning no linear
auto-correlation with the dependent variable.
4.3.18 Firm Characteristics Panel Data Linearity Test
The ANOVA test of linearity was used to test the linearity of the Firm Characteristics. The test
computed both the linear and nonlinear components of a pair of Corporate Governance variables.
Nonlinearity was considered significant if the computed F value for the nonlinear component
was below 0.05. The results are presented in Table 4.22 below:

97
Table 4.22: Results of Firm Characteristics Panel Data Linearity Test
Sum of
Squares df
Mean
Square F Sig.
Leverage Between
Groups
(Combined) 313.000 158 1.981 .944 .615
Linearity 1.399 1 1.399 .667 .418
Deviation from
Linearity 311.601 157 1.985 .946 .611
Within Groups 107.000 51 2.098
Total 420.000 209
Firm Size Between
Groups
(Combined) 12.956 4 3.239 1.913 .110
Linearity 12.928 1 12.928 7.634 .006
Deviation from
Linearity .028 3 .009 .006 .999
Within Groups 345.484 204 1.694
Total 358.440 208
Nature of
Audit
Firm
Between
Groups
(Combined) 16.277 188 .087 1.000 .535
Linearity 11.271 1 11.271 130.177 .000
Deviation from
Linearity 5.006 187 .027 .309 1.000
Within Groups 1.818 21 .087
Total 18.095 209
Source: Research Findings
Based on the ANOVA tables above, the significance of the deviation from Linearity (p>.05)
shows that there is a linear relationship between the variances of Leverage, Firm Size and Nature
of Audit Firm with composite Firm Characteristics.
4.3.19 Firm Characteristics Panel Data Multicollinearity Test
The presence of multicollinearity in the Firm Characteristics panel data was evaluated using the
VIF (Tolerance) test. The results are presented in Table 4.23 below:

98
Table 4.23: Results of Firm Characteristics Panel Data Multicollinearity Test
Model
Unstandardized
Coefficients
Standardized
Coefficients
t Sig.
Collinearity
Statistics
B Std. Error Beta Tolerance VIF
1 (Constant) -.273 .024 -11.497 .000
Total Asset .868 .017 .965 50.372 .000 1.000 1.000
2 (Constant) -.349 .016 -22.291 .000
Total Asset .933 .012 1.037 80.951 .000 .889 1.125
Leverage .020 .001 .216 16.827 .000 .889 1.125
a. Dependent Variable: Composite Firm Characteristics
Source: Research Findings
When Firm Characteristics was predicted, it was found that Total Assets (Beta = 1.037, p < .01)
and Leverage (Beta = .216, p < .01) have a high impact on the dependent variable. There was no
multicollinearity in the multiple linear regression model as the Tolerance threshold of > 0.1 (or
VIF < 10) was met
4.3.20 Firm Characteristics Panel Data Heteroscedasticity Test
The presence of heteroscedasticity in the Corporate Governance panel data was tested based on
the histogram, normal P-P plot of the standardized residuals, the scatter plot of residuals as well
the Levene‟s test. The results are shown in Figures 4.10 to 4.12 and Table 4.24 below:

99
Figure 4.10: Histogram of the Residuals of Firm Characteristics Data
Source: Research Findings
The histogram shows in Figure 4.10 above shows normal distribution in the Firm
Characteristics panel data.

100
Figure 4.11: Normal P-P Plot of Regression Standardized Residual of Firm Characteristics
Data
Source: Research Findings
No evidence of heteroscedasticity in normal P-P plot of regression standardized residual of Firm
Characteristics panel data.
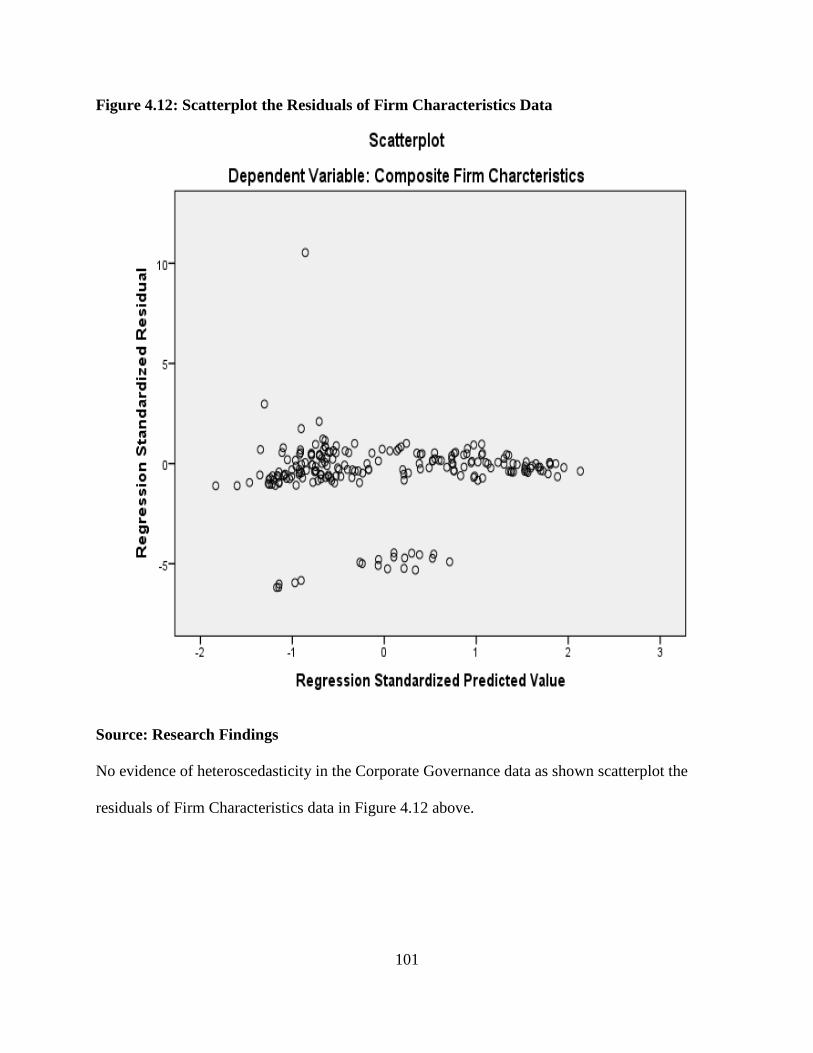
101
Figure 4.12: Scatterplot the Residuals of Firm Characteristics Data
Source: Research Findings
No evidence of heteroscedasticity in the Corporate Governance data as shown scatterplot the
residuals of Firm Characteristics data in Figure 4.12 above.

102
Table 4.24: Test of Homogeneity of Variances
Levene
Statistic df1 df2 Sig. F Sig.
Leverage 1.298 4 205 .272 .325 .861
Firm Size .035 4 204 .998 1.913 .110
Nature of Audit Firm .000 4 205 1.000 0.000 1.000
Source: Research Findings
The components of Firm Characteristics showed homogeneity of variances (p>.05) as shown in
Table 4.24 above.
4.3.21 Firm Characteristics Panel Data Normality Test
Normality of the Firm Characteristic data was tested using the Kolmogorov-Smirnov goodness
of fit test as well as the Shapiro–Wilk normality test. The results are presented in Table 4.24
below:
Table 4.25: Firm Characteristics Panel Data Normality Test
Kolmogorov-Smirnova Shapiro-Wilk
Statistic df Sig. Statistic df Sig.
Leverage .208 210 .200* .970 210 .875
Firm Size .229 210 .200* .955 210 .774
Nature of Audit Firm .179 210 .092 .910 210 .064 a. Lilliefors Significance Correction
Table 4.25 above shows that all the components of Firm Characteristics (p>.05) indicate the data
is normally distributed.
4.3.22 Summary Statistics of the Diagnostic Tests
The summary statistics of the diagnostics test of the five assumptions (Normality, Linearity,
Independence, Homogeneity and Collinearity), the thresholds and the values computed for all the
four variables of the study are presented in Table 4.26 below. A brief discussion then follows.
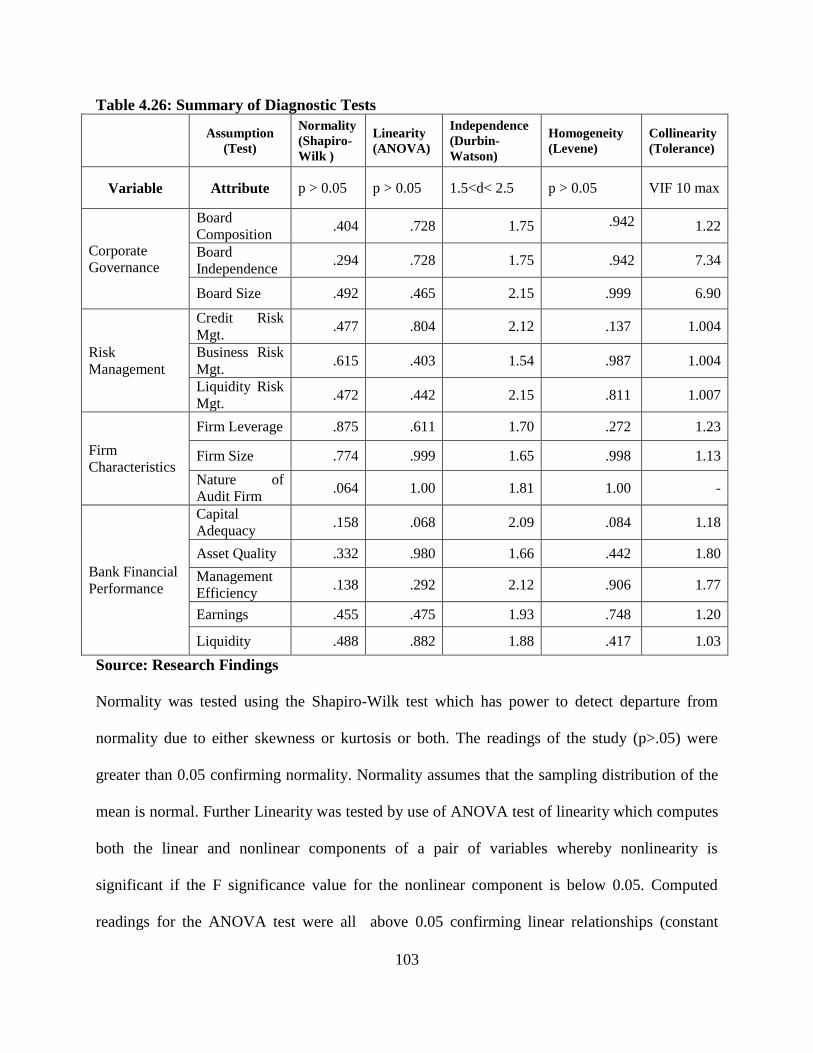
103
Table 4.26: Summary of Diagnostic Tests
Assumption
(Test)
Normality
(Shapiro-
Wilk )
Linearity
(ANOVA)
Independence
(Durbin-
Watson)
Homogeneity
(Levene)
Collinearity
(Tolerance)
Variable Attribute p > 0.05 p > 0.05 1.5<d< 2.5 p > 0.05 VIF 10 max
Corporate
Governance
Board
Composition .404 .728 1.75 .942 1.22
Board
Independence .294 .728 1.75 .942 7.34
Board Size .492 .465 2.15 .999 6.90
Risk
Management
Credit Risk
Mgt. .477 .804 2.12 .137 1.004
Business Risk
Mgt. .615 .403 1.54 .987 1.004
Liquidity Risk
Mgt. .472 .442 2.15 .811 1.007
Firm
Characteristics
Firm Leverage .875 .611 1.70 .272 1.23
Firm Size .774 .999 1.65 .998 1.13
Nature of
Audit Firm .064 1.00 1.81 1.00 -
Bank Financial
Performance
Capital
Adequacy .158 .068 2.09 .084 1.18
Asset Quality .332 .980 1.66 .442 1.80
Management
Efficiency .138 .292 2.12 .906 1.77
Earnings .455 .475 1.93 .748 1.20
Liquidity .488 .882 1.88 .417 1.03
Source: Research Findings
Normality was tested using the Shapiro-Wilk test which has power to detect departure from
normality due to either skewness or kurtosis or both. The readings of the study (p>.05) were
greater than 0.05 confirming normality. Normality assumes that the sampling distribution of the
mean is normal. Further Linearity was tested by use of ANOVA test of linearity which computes
both the linear and nonlinear components of a pair of variables whereby nonlinearity is
significant if the F significance value for the nonlinear component is below 0.05. Computed
readings for the ANOVA test were all above 0.05 confirming linear relationships (constant

104
slope) between the predictor variables and the dependent variable. The study further assessed
Independence of error terms, which implies that observations are independent through the
Durbin-Watson test whose statistic ranges from 1.5 to 2.5. The test results ranged between 1.54
and 2.15 supporting independence of error terms. Homoscedasticity was tested by use of
Levene‟s test of homogeneity of variances. The test was not significant at α= 0.05 confirming
homogeneity. Multicollinearity was tested by computing the Variance Inflation Factors (VIF)
and its reciprocal, the tolerance. Multicollinearity is a situation in which the predictor variables
in a multiple regression analysis are themselves highly correlated making it difficult to determine
the actual contribution of respective predictors to the variance in the dependent variable. The
multicollinearity assumption has a VIF threshold value of 10 maximum (Gatwirth et al., 2009).
The computed tolerance for all the variables were less than 1 and therefore it‟s reciprocal, the
VIF was between one and two, which falls within the threshold.
4.4. Correlation Analysis
Correlation analysis is used to measure the strength of a linear association between two
variables. The Pearson correlation coefficient, denoted as r, can take values ranging from -1 to
+1. According to Cooper and Schindler (2003), a value of -1 indicate perfect negative correlation
which implies that an increase in one variable is followed by a proportionate decrease in the
other variable while a value less than zero indicates a negative association between the two
variables implying that as the value of one variable increases, the value of the other variable
decreases and vice versa. A value of zero indicates no association exists between the two
variables. Any value of r greater than 0 indicates a positive association between the variables
implying that as the value of one variable increases, the value of the other variable equally
increases.

105
A value of the correlation coefficient of 1 designates perfect positive correlation which implies
that an increase/decrease one variable is followed by a proportionate increase/decrease in the
other variable. The value of the Pearson correlation Coefficient will be closer to either +1 or -1,
the stronger the association between the two variables. Sekaran (2006), states that the Pearson's
correlation is used if the variables of the study are measured using either interval or ratio scales.
In this study the correlation results are reported at a significance level of 0.05 and 0.01 consistent
with other studies such as Magutu (2012) and Munjuri (2012).
4.4.1 Correlation between Corporate Governance and Composite Financial
Performance
The strength of the relationship between composite bank Financial Performance (measured by
the CAMEL score) and Corporate Governance indicators (Board Composition, Board
Independence, Board Size) was investigated using Pearson product moment correlation. The
results were as shown in Table 4.27 below:
Table 4.27: Correlation between Corporate Governance and Financial Performance
Capital
Adequacy
Asset
Quality
Management
Capacity Earnings Liquidity
CAMEL
Ratio
Board Size r -.263**
-.164* .200
** .134 .002 .001
Board
Composition r .074 .160
* -.127 .114 -.013 -.031
Board
Independence r -.052 -.341
** -.051 -.101 .019 -.143
*
**. Correlation is significant at the 0.01 level (2-tailed).
*. Correlation is significant at the 0.05 level (2-tailed).
Source: Research Findings
Table 4.27 above shows a statistically significant negative correlation between Board Size and
Capital Adequacy (r =-.263, p<.01), meaning that the capital adequacy in a bank declines as the
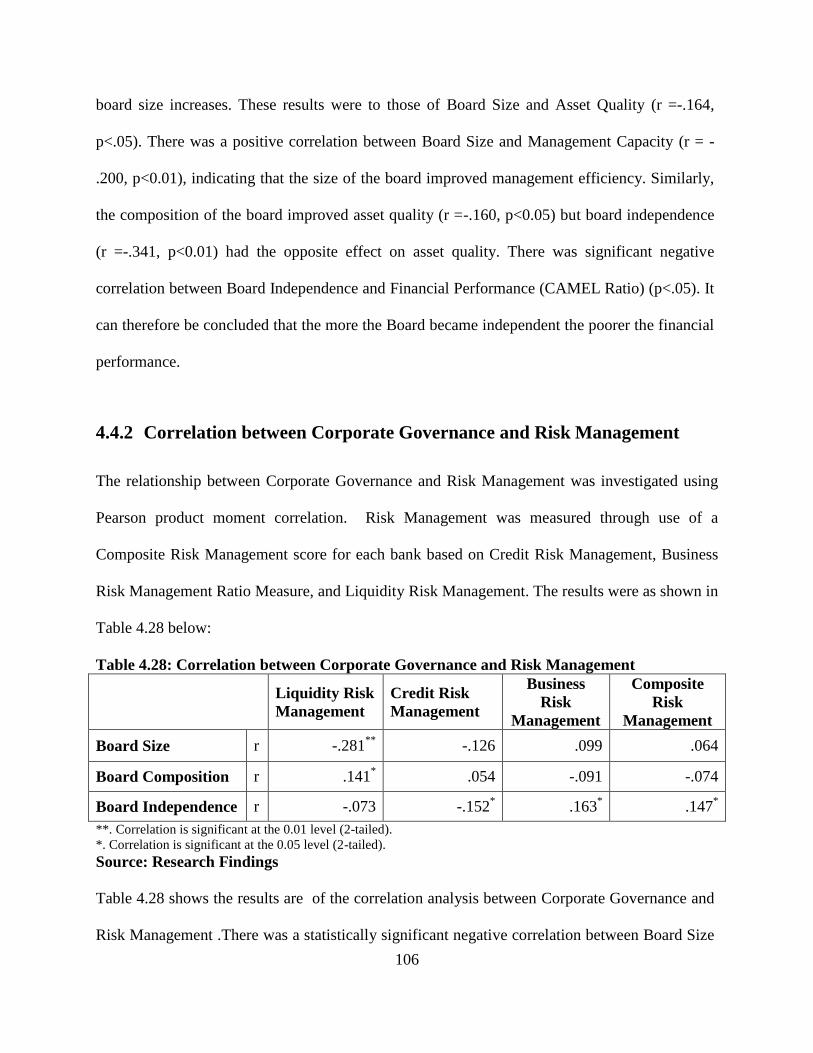
106
board size increases. These results were to those of Board Size and Asset Quality (r =-.164,
p<.05). There was a positive correlation between Board Size and Management Capacity (r = -
.200, p<0.01), indicating that the size of the board improved management efficiency. Similarly,
the composition of the board improved asset quality (r =-.160, p<0.05) but board independence
(r =-.341, p<0.01) had the opposite effect on asset quality. There was significant negative
correlation between Board Independence and Financial Performance (CAMEL Ratio) (p<.05). It
can therefore be concluded that the more the Board became independent the poorer the financial
performance.
4.4.2 Correlation between Corporate Governance and Risk Management
The relationship between Corporate Governance and Risk Management was investigated using
Pearson product moment correlation. Risk Management was measured through use of a
Composite Risk Management score for each bank based on Credit Risk Management, Business
Risk Management Ratio Measure, and Liquidity Risk Management. The results were as shown in
Table 4.28 below:
Table 4.28: Correlation between Corporate Governance and Risk Management
Liquidity Risk
Management
Credit Risk
Management
Business
Risk
Management
Composite
Risk
Management
Board Size r -.281**
-.126 .099 .064
Board Composition r .141* .054 -.091 -.074
Board Independence r -.073 -.152* .163
* .147
*
**. Correlation is significant at the 0.01 level (2-tailed).
*. Correlation is significant at the 0.05 level (2-tailed).
Source: Research Findings
Table 4.28 shows the results are of the correlation analysis between Corporate Governance and
Risk Management .There was a statistically significant negative correlation between Board Size
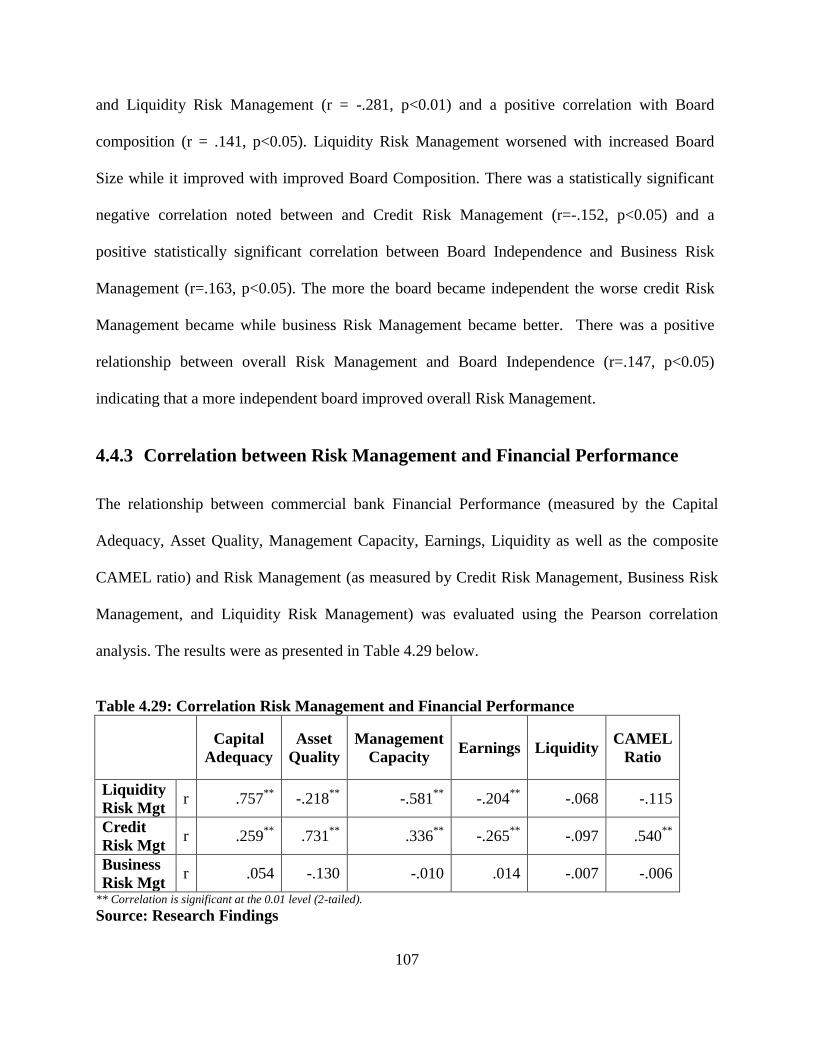
107
and Liquidity Risk Management (r = -.281, p<0.01) and a positive correlation with Board
composition (r = .141, p<0.05). Liquidity Risk Management worsened with increased Board
Size while it improved with improved Board Composition. There was a statistically significant
negative correlation noted between and Credit Risk Management (r=-.152, p<0.05) and a
positive statistically significant correlation between Board Independence and Business Risk
Management (r=.163, p<0.05). The more the board became independent the worse credit Risk
Management became while business Risk Management became better. There was a positive
relationship between overall Risk Management and Board Independence (r=.147, p<0.05)
indicating that a more independent board improved overall Risk Management.
4.4.3 Correlation between Risk Management and Financial Performance
The relationship between commercial bank Financial Performance (measured by the Capital
Adequacy, Asset Quality, Management Capacity, Earnings, Liquidity as well as the composite
CAMEL ratio) and Risk Management (as measured by Credit Risk Management, Business Risk
Management, and Liquidity Risk Management) was evaluated using the Pearson correlation
analysis. The results were as presented in Table 4.29 below.
Table 4.29: Correlation Risk Management and Financial Performance
Capital
Adequacy
Asset
Quality
Management
Capacity Earnings Liquidity
CAMEL
Ratio
Liquidity
Risk Mgt r .757
** -.218
** -.581
** -.204
** -.068 -.115
Credit
Risk Mgt r .259
** .731
** .336
** -.265
** -.097 .540
**
Business
Risk Mgt r .054 -.130 -.010 .014 -.007 -.006
** Correlation is significant at the 0.01 level (2-tailed).
Source: Research Findings

108
As shown in Table 4.29 above, there was correlation between Liquidity Risk Management and
Capital Adequacy, Asset Quality, Management Capacity and Earnings which was statistically
significant, (r =.757, p<.01), (r =-.218, p<.01), (r =-.581, p<.01) and (r =-.204, p<.01)
respectively. Similarly, there was statistically significant correlation between credit Risk
Management and Capital Adequacy, Asset Quality, Management Efficiency, Earnings and
CAMEL Ratio (r =.259, p<.01), (r =.731, p<.01), (r =.336, p<.01), (r =-.265, p<.01) and (r =.540,
p<.01) respectively. These results indicate that increased liquidity Risk Management increased
capital adequacy while it decreased asset quality, Management Capacity and earnings. Better
credit Risk Management increased capital adequacy, asset quality, Management Capacity and
overall CAMEL Ratio.
4.4.4 Correlation between Corporate Governance, Risk Management and
Firm Characteristics
The relationship between Risk Management, Corporate Governance and Firm Characteristics
was also investigated using Pearson product moment correlation. The results are presented in the
Table 4.30 below.
Table 4.30: Correlation between Composite CG, Risk Management and Firm
Characteristics Measures
Risk
Management
Corporate
Governance
Firm
Characteristics
Risk Management r 1
Corporate Governance r .064 1
Firm Characteristics r .016 .115 1
Source: Research Findings

109
Table 4.30 shows no statistically significant correlation between Corporate Governance, Risk
Management and Composite Firm Characteristics.
Table 4.31: Correlation Matrix for Individual Predictor Variables
L
iqu
idit
y
Ris
k
Man
agem
ent
Cre
dit
Ris
k
Man
agem
ent
Bu
sin
ess
Ris
k
Man
agem
ent
Board
Siz
e
Board
Com
posi
tion
Board
Ind
epen
den
ce
Natu
re o
f
Au
dit
Fir
m
Lev
erage
Tota
l A
sset
Ln
Liquidity Risk
Management r 1
Credit Risk
Management r -.059 1
Business Risk
Management r -.017 -.059 1
Board Size r -.281**
-.126 .099 1
Board
Composition r .141
* .054 -.091 -.412
** 1
Board
Independence r -.073 -.152
* .163
* .342
** -.924
** 1
Nature of Audit
Firm r -.134 .094 -.009 .295
** -.135 .145
* 1
Leverage r .317**
.409**
.131 .069 .029 -.047 .036 1
Total Asset r -.246**
-.428**
.021 .513**
-.032 .029 .041 -.315**
1 **. Correlation is significant at the 0.01 level (2-tailed).
*. Correlation is significant at the 0.05 level (2-tailed).
Source: Research Findings
As shown in Table 4.31, statistically significant positive correlations were noted between Board
independence and Business Risk Management (r =.163, p<.05), Board Independence and Board
Size (r = .342, p<.01), Nature of Audit Firm and Board Size (r=295, p<.01), Nature of Audit
Firm and Board Independence (r=.145, p<.05), Leverage and Liquidity Risk Management
(r=.317, p<.01), Leverage and Credit Risk Management (r=.409, p<.01) and, Total Assets and
Board Size (r=.513, p<.01).

110
CHAPTER FIVE
HYPOTHESIS TESTING AND DISCUSSION OF FINDINGS
5.1 Introduction
This chapter present results of the tests of the four null hypotheses in the study and their
interpretations. The first null hypothesis tested the effect of Corporate Governance and bank
Financial Performance (and its indicators). The second null hypothesis tested the intervening
effect of Risk Management on the relationship between Corporate Governance and bank
Financial Performance.
The third null hypothesis tested the moderating effect of Firm Characteristics on the relationship
between Corporate Governance and bank Financial Performance. The fourth null hypothesis
tested the combined effect of Corporate Governance, Risk Management and the bank Financial
Performance. Tests of goodness of fit including the adjusted coefficient of determination (𝑅 2), t-
tests, standard error of estimate (Se) and ANOVA are also presented. The chapter concludes with
a discussion of findings on each of the hypotheses tested.
5.2 The Effect of Corporate Governance on Bank Financial Performance
The first objective examined the effect of Corporate Governance on the bank Financial
Performance. The attributes of Corporate Governance Consisted of Board Composition, Board
Independence, and Board Size while the those of Financial Performance were based on the
CAMEL model (Capital Adequacy, Asset Quality, Management Efficiency, Earnings, Liquidity
and the CAMEL ratio). The indicators were based on data obtained from the published annual
111
accounts of the banks and CBK Bank Supervision and Banking Sector Annual Reports. The first
null hypothesis tested was stated as follows:
H1: The Relationship between Corporate Governance and Financial Performance of
Commercial Banks in Kenya is Not Significant.
The above hypothesis sought to establish the effect of Corporate Governance on Financial
Performance of commercial banks in Kenya. Three steps were used in carrying out the
hierarchical multiple regressions with the first step involving regressing the Financial
Performance against Board Composition; the second involving regressing Financial Performance
against Board Composition and Board Independence, while the third step involved regressing
Financial Performance against Board Composition, Board Independence and Board Size. The
first null sub hypothesis was:
H1a: The Relationship between Corporate Governance and Capital Adequacy of
Commercial Banks in Kenya is Not Significant.
The hypothesis was divided into six sub hypotheses to consider the individual (attributes) bank
Financial Performance measures (Capital Adequacy(C), Asset Quality (A), Management
Capacity (M), Earnings (E), and Liquidity (L)) and the composite measures of bank Financial
Performance measure (CAMEL ratio, FP). The hypothesis was tested by using a modified
multiple regression model as described in chapter three was as follows:
C=β0 + β1BC +β2 BS + β3 BI+ εi
The results were as presented in Table 5.1 below:
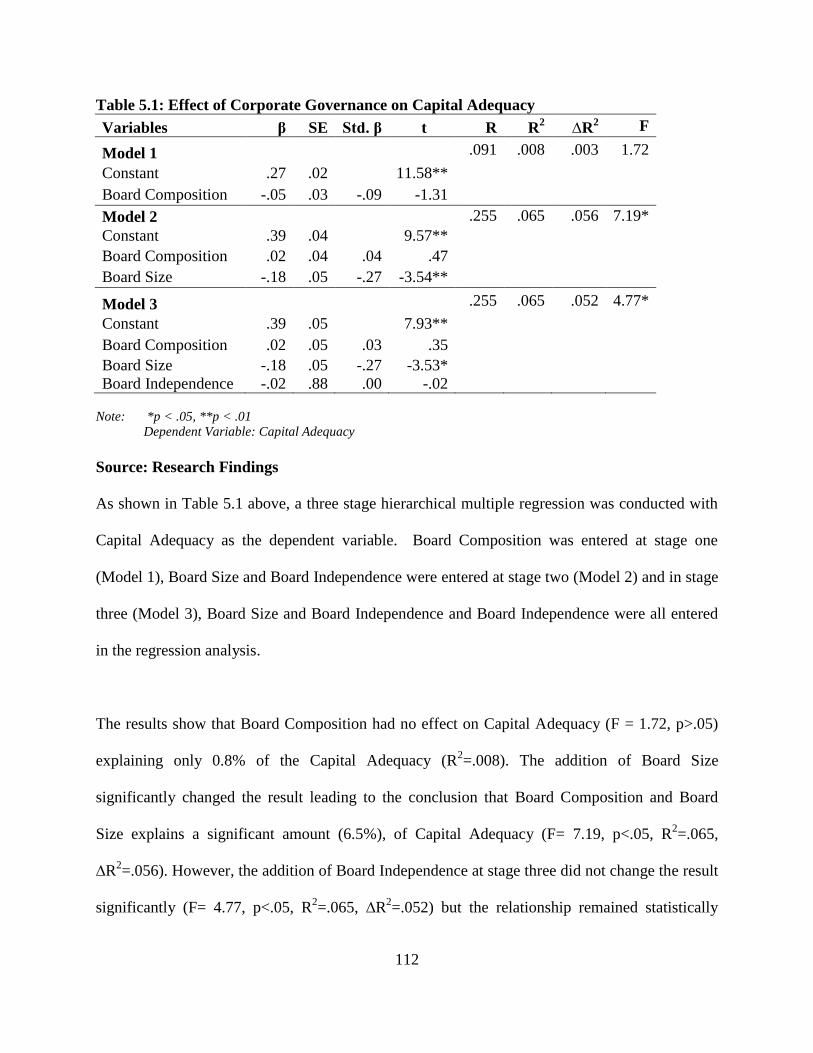
112
Table 5.1: Effect of Corporate Governance on Capital Adequacy
Variables β SE Std. β t R R2 ∆R
2 F
Model 1 .091 .008 .003 1.72
Constant .27 .02 11.58**
Board Composition -.05 .03 -.09 -1.31
Model 2 .255 .065 .056 7.19*
Constant .39 .04 9.57**
Board Composition .02 .04 .04 .47
Board Size -.18 .05 -.27 -3.54**
Model 3 .255 .065 .052 4.77*
Constant .39 .05 7.93**
Board Composition .02 .05 .03 .35
Board Size -.18 .05 -.27 -3.53*
Board Independence -.02 .88 .00 -.02
Note: *p < .05, **p < .01
Dependent Variable: Capital Adequacy
Source: Research Findings
As shown in Table 5.1 above, a three stage hierarchical multiple regression was conducted with
Capital Adequacy as the dependent variable. Board Composition was entered at stage one
(Model 1), Board Size and Board Independence were entered at stage two (Model 2) and in stage
three (Model 3), Board Size and Board Independence and Board Independence were all entered
in the regression analysis.
The results show that Board Composition had no effect on Capital Adequacy (F = 1.72, p>.05)
explaining only 0.8% of the Capital Adequacy (R2=.008). The addition of Board Size
significantly changed the result leading to the conclusion that Board Composition and Board
Size explains a significant amount (6.5%), of Capital Adequacy (F= 7.19, p<.05, R2=.065,
∆R2=.056). However, the addition of Board Independence at stage three did not change the result
significantly (F= 4.77, p<.05, R2=.065, ∆R
2=.052) but the relationship remained statistically

113
significant. The results show that the beta coefficient of the constant (β=0.39) the line of best fit
for the final model, was statistically significant. The beta coefficients for Board composition,
Board Size and Board Independence in model 3 were .02, -.18 and -.02 respectively. The t value
(slope coefficient / standard error) for Board Size was = -3.53 which was statistically significant
(p<.05). The results show that Corporate Governance significantly predicts Capital Adequacy.
The null sub hypothesis is therefore rejected.
The second null sub hypothesis was:
H1b: The Relationship between Corporate Governance and Asset Quality of Commercial
Banks in Kenya is Not Significant.
This hypothesis was tested by using a multiple regression model as described in chapter three
was as follows:
A= β0 + β1BC +β2 BS + β3 BI+ εi
The results were as presented in Table 5.2 below:
Table 5.2: Effect of Corporate Governance on Asset Quality
Variables β SE Std. β t R R2 ∆R
2 F
Model 1 .10 .01 .01 2.08
Constant .06 .01
6.61**
Board Composition -.02 .01 -.10 -1.44
Model 2 .17 .03 .02 2.87
Constant .08 .02
5.28**
Board Composition -.01 .01 -.03 -.39
Board Size -.04 .02 -.15 -1.91
Model 3 .61 .38 .37 41.10**
Constant -.01 .02
-.52
Board Composition .09 .02 .51 6.31**
Board Size -.04 .02 -.17 -2.73*
Board Independence 2.85 .27 .79 10.70** Note: *p < .05, **p < .01
Dependent Variable: Asset Quality
Source: Research Findings

114
In Table 5.2, a three stage hierarchical multiple regression was conducted with Asset Quality as
the dependent variable. Board Composition was entered at stage one, Board Size at stage two
and Board Independence stage three. The results show that Board Composition had no effect on
Asset Quality (F= 2.08, p>.05). The addition of Board size added an insignificant effect (F=
2.87, p>.05) while the inclusion of Board Independence at stage three changed the result
significantly (F= 41.10, p<.01, R2=.38, ∆R
2=.37). The results of the overall model show that
Corporate Governance (especially Board Independence attribute) significantly predicts Asset
Quality (38%).
The slope (Beta coefficients) for Board Composition and Board Independence in stage three
were positive, β=.09 and β=2.85 respectively while Board Size was negative, β= -.04. Similarly,
the t values for Board composition and Board Independence were highly significant (p<.01)
while Board Size was also statistically significant at p<.05. Thus the three variables
(collectively) were good predictors of Asset Quality The null hypothesis that the relationship
between Corporate Governance and Asset Quality of Commercial Banks in Kenya is not
significant is therefore rejected.
The third null sub hypothesis was:
H1c: The Relationship between Corporate Governance and Management Capacity of
Commercial Banks in Kenya is Not Significant.
This hypothesis was tested by using a multiple regression model as described in chapter three
was as follows:
M= β0 + β1BC +β2 BS + β3 BI+ εi
The results were as presented in Table 5.3 below:

115
Table 5.3: Effect of Corporate Governance on Management Efficiency
Variables β SE Std. β t R R2 ∆R
2 F
Model 1 .18 .03 .03 6.65*
Constant .68 .04
18.52**
Board Composition .14 .05 .18 2.58*
Model 2 .22 .05 .04 5.21*
Constant .58 .07
8.78**
Board Composition .09 .06 .11 1.40
Board Size .16 .08 .15 1.92
Model 3 .50 .25 .24 23.21**
Constant .28 .07
4.00**
Board Composition .41 .07 .52 5.93**
Board Size .14 .07 .13 1.91
Board Independence 9.41 1.26 .61 7.51** Note: *p < .05, **p < .01
Dependent Variable: Management Efficiency
Source: Research Findings
The Table 5.3 above shows the results of the three stage hierarchical multiple regression was
conducted with Management Capacity as the dependent variable where Board Composition was
entered at stage one, Board Composition and Board Size entered at stage two and finally Board
Composition, Board Size and Board Independence entered at stage three.
The results show that Board Composition had a statistically significant effect on Management
Capacity (F= 6.65, p<.05, R2=.03,
∆R
2=.03
). The addition of Board Size in step 2 increased the
significance of the model (F= 5.21, p<.05, R2=.05,
∆R
2=.04
) and inclusion of Board
Independence at stage three increased the significance of the overall model (F= 23.21, p<.01,
R2=.25, ∆R
2=.24). The results of the overall model show that Corporate Governance
significantly predicts Management Capacity (25%).

116
The slope for Board Composition, Board Size and Board Independence in stage three were
positive, β=.41, β=.14 and β=9.41 respectively making Board Independence the largest
contributor in the regression. The t values for Board composition and Board Independence were
highly significant (p<.01) while the t value for Board Size was not significant. The null
hypothesis which states that the relationship between Corporate Governance and Management
Capacity of Commercial Banks in Kenya is not significant is rejected.
The fourth null sub hypothesis was:
H1d: The Relationship between Corporate Governance and Earnings of Commercial
Banks in Kenya is Not Significant.
This hypothesis was tested by using a multiple regression model below:
E= β0 + β1BC +β2 BS + β3 BI+ εi
The results were as presented in table 5.4 below:
Table 5.4: Effect of Corporate Governance on Earnings
Variables β SE Std. β t R R2 ∆R
2 F
Model 1 .099 .010 .005 2.049
Constant .029 .004
7.905**
Board Composition -.008 .005 -.099 -1.431
Model 2 .235 .055 .046 6.043*
Constant .012 .006
1.872
Board Composition -.017 .006 -.212 -2.768*
Board Size .025 .008 .242 3.154*
Model 3 .238 .057 .043 4.098*
Constant .014 .008
1.830
Board Composition -.019 .008 -.243 -2.469*
Board Size .025 .008 .243 3.163*
Board Independence -.070 .139 -.046 -.502 Note: *p < .05, **p < .01
Dependent Variable: Earnings
Source: Research Findings
117
A three stage hierarchical multiple regression was conducted with Earnings as the dependent
variable. Board Composition was entered at stage one, Board Composition and Board Size at
stage two finally Board Composition, Board Size and Board Independence entered at stage three.
The results show that Board composition had no statistically significant effect on Earnings (F =
2.049, p>.05, R2=.010, ∆R
2=.005). The addition of Board size in step 1 (F= 6.043, p<.05,
R2=.055, ∆R
2=.046) and Board independence at stage three increased significance of the overall
model (F= 4.098, p<.05, R2=.057, ∆R
2=.043). The results of the overall model show that
Corporate Governance significantly predicts Earnings (5.7%).
The slope for Board Composition and Board Independence in stage three were negative, β=-.02
and β=-.07 respectively while that of Board Size was positive, β=.03. The t values for Board
composition and Board Size were statistically significant (p<.05) while the beta coefficient of
Board Independence was not significant. From the overall results in model 3, the null hypothesis
which stated that, the relationship between Corporate Governance and Earnings of Commercial
Banks in Kenya is not significant, is rejected. The fifth null sub hypothesis was:
H1e: The Relationship between Corporate Governance and Liquidity of Commercial
Banks in Kenya is Not Significant.
This hypothesis was tested by using a multiple regression model below:
L= β0 + β1BC +β2 BS + β3 BI+ εi
The results were as presented in Table 5.5 below:

118
Table 5.5: Effect of Corporate Governance on Liquidity
Variables β SE Std. β t R R2 ∆R
2 F
Model 1 .010 .00 -.01 .020
Constant .051 .000
107.9**
Board Composition 9.989 .001 .010 .143
Model 2 .010 .00 -.01 .011
Constant .051 .001
59.83**
Board Composition .000 .001 .011 .139
Board Size -2.818 .001 -.002 -.027
Model 3 .020 .00 -.01 .028
Constant .051 .001
49.64**
Board Composition -5.020 .001 -.005 -.049
Board Size -1.998 .001 -.001 -.019
Board Independence -.005 .018 -.023 -.252
Note: *p < .05, **p < .01
Dependent Variable: Liquidity
Source: Research Findings
A three stage hierarchical multiple regression (Table 5.5 above) was conducted with Liquidity as
the dependent variable. Board Composition was entered at stage one, Board Composition and
Board Size at stage two and Board Composition, Board Size Board Independence stage three.
The results show that Board Composition, Board Size and Board Independence did not
contribute significantly at any stage of the regression (p>.05). This is attributed to the fact that
Liquidity is generally a constant explaining the reason the intercept is highly statistically
significant (P<.01) in the three models. As none of the variables has significant t values, the
significance of the beta coefficient values cannot be analysed further. The null hypothesis: The
relationship between Corporate Governance and Liquidity of Commercial Banks in Kenya is not
significant is not rejected.

119
The sixth null sub hypothesis was:
H1f: The Relationship between Corporate Governance and Composite Financial
Performance of commercial Banks is Not Significant.
This hypothesis was tested by using a multiple regression model below:
FP= β0 + β1BC +β2 BS + β3 BI+ εi
The results were as presented in Table 5.6 below:
Table 5.6: Effect of Corporate Governance on Composite Financial
Performance (CAMEL ratio, FP)
Variables β SE Std. β t R R2 ∆R
2 F
Model 1 .078 .006 .001 1.273
Constant .216 .009
24.18**
Board Composition .015 .013 .078 1.13
Model 2 .085 .007 -.002 .761
Constant .223 .016
13.83**
Board Composition .018 .015 .096 1.23
Board Size -.010 .020 -.039 -.50
Model 3 .502 .252 .241 23.145**
Constant .145 .017
8.59**
Board Composition .104 .017 .544 6.24**
Board Size -.014 .017 -.057 -.83
Board Independence 2.477 .302 .662 8.21** Note: *p < .05, **p < .01
Dependent Variable: CAMEL Ratio
Source: Research Findings
A three stage hierarchical multiple regression was conducted with CAMEL Ratio as the
dependent variable. Board Composition was entered at stage one, Board Composition and Board
Size at stage two Board Composition, Board Size and Board Independence at stage three.
The results show that Board Composition and Board size, entered at stage one and two
respectively, had no statistically significant effect on CAMEL Ratio with the inferential statistics

120
for model 1 and model 2 as (F= 1.273, p>.05, R2=.060, ∆R
2=.001) and (F= .761, p>.05,
R2=.007, ∆R
2= -.002) respectively. The inclusion of Board independence in step 3 increased
significance of the overall model (F= 23.145, p<.01, R2=.252, ∆R
2=.241). The results of the
overall model show that Corporate Governance significantly predicts 25.2% of CAMEL Ratio
with Board Independence being the largest contributor.
The slope for Board Composition and Board Independence in stage three were positive, β=.104
and β=2.477 respectively while that of Board Size was negative (β= -.014). Similarly the t values
for Board composition and Board Independence were highly statistically significant (p<.01)
while Board Independence was not (p>.05). Thus the null hypothesis, which stated that the
relationship between Corporate Governance and Composite Financial Performance (CAMEL
Ratio) of Commercial Banks in Kenya is not significant, is rejected.
5. 3 Intervening Effect Risk Management on the Relationship between
Corporate Governance and Bank Financial Performance
The second objective was to assess the intervening effect of Risk Management on the
relationship between Corporate Governance and Financial Performance of commercial banks in
Kenya. According to Baron and Kenny (1986) approach, four steps are followed to test the
intervening effect of the intervening variable on the relationship between the independent and
dependent variables. These steps were adopted in the study. In step one of the intervention;
regression analysis was performed to assess the relationship between Financial Performance
(dependent variable) and Corporate Governance (independent variable) while ignoring the
intervening variable (Risk Management).
121
The second step of the intervening model involved performing a regression analysis to assess the
relationship between Risk Management (intervening variable) and Corporate Governance
(independent variable) ignoring the dependent variable (bank Financial Performance). The third
step of the intervention, involved performing a regression analysis to assess the relationship
between Risk Management (intervening variable) and Bank Performance (dependent variable)
ignoring the independent variable (Corporate Governance). The fourth step of the intervention
analysis was performed to assess the relationship between bank Financial Performance
(dependent variable), Risk Management (intervening variable) and Corporate Governance
(independent variable).
According to Baron and Kenny (1986) approach, for intervention effect to be considered
positive, the analysis must fulfil four conditions namely: there must be a significant relationship
between independent variable must the dependent variable in the absence of the intervening
variable; there must be a significant relationship between the independent variable and the
intervening variable; there must be a must be a significant relationship between the
intervening variable and the dependent variable and finally when controlling for the effects of
the intervening variable on the dependent variable, the effect of the independent variable on the
dependent variable is insignificant in the presence of the intervening variable.
The composite measures of risk Corporate Governance and Risk Management were used
whereas for bank Financial Performance five indicators and the composite CAMEL ratio were
used in the analysis. Six null hypotheses were developed and tested for the intervening effect of

122
Risk Management on the relationship between Corporate Governance and bank Financial
Performance indicators (Capital Adequacy, Asset Quality, Management Capacity, Earnings,
Liquidity and the CAMEL ratio). The following null hypothesis was tested:
H2: The Relationship between Corporate Governance and Financial Performance of
Commercial Banks in Kenya is Not Intervened by Risk Management.
To evaluate effect on each Financial Performance indicators six sub hypotheses were tested .The
first sub hypothesis was to assess the intervening effect of Risk Management on the relationship
between Corporate Governance and Capital Adequacy. The hypothesis was stated as follows:
H2a: The Relationship between Corporate Governance and Capital Adequacy (C) of
Commercial Banks in Kenya is Not Intervened by Risk Management.
The results are as shown in table 5.7 below;
Table 5.7: Regression Results of Corporate Governance (CG), Risk Management
(RM) and Capital Adequacy (C)
Variables β SE Std. β t R R2 ∆R
2 F
Step 1a .188 .036 .031 7.626*
Constant .337 .036
9.379**
CG -.190 .069 -.188 -2.762*
Step 2b .055 .003 -.002 .625
Constant .113 .152
.740
CG .231 .292 .055 .791
Step 3c .144 .021 .016 4.403*
Constant .234 .011
21.539**
RM .035 .016 .144 2.098*
Step 4d .244 .060 .050 6.518*
Constant .332 .036
9.344**
CG -.199 .068 -.197 -2.911*
RM .037 .016 .155 2.292* Note: *p < .05, **p < .01 a. Dependent variable: Financial Performance (Capital Adequacy) b. Dependent variable: Risk Management c. Dependent variable: Financial Performance (Capital Adequacy) d. Dependent variable: Financial Performance (Capital Adequacy)
Source: Research Findings
123
A multiple linear regression was computed to assess the relationship Between Corporate
Governance, Risk Management and Capital Adequacy of commercial banks in Kenya. As
shown in Table 5.7 above, in step one of the analysis (the main effect), there was significant
relationship between Corporate Governance and Capital Adequacy (F=7.626, p<.05, ∆R2=.031).
Tests of the slope show that the regression coefficient (β) value of Corporate Governance was -
.190 with a significant t-value. This indicates that Corporate Governance is a significant
predictor variable (p<.05) and therefore a significant relationship exist between Corporate
Governance and Capital Adequacy.
In step two there was no significant relationship between Corporate Governance and Risk
Management (F=.625, p>.05, ∆R2=-.002). Tests of the slope show that the regression coefficient
(β) value of Corporate Governance was .231 with an in significant t-value of .791. This indicates
that Corporate Governance is not a significant predictor variable (p>.05) and therefore no
significant relationship exist between Corporate Governance and Risk Management.
In step three there was a significant relationship between Risk Management and capital adequacy
(F=4.403, p<.05, ∆R2=.016). Tests of the slope show that the regression coefficient (β) value of
Risk Management was .035 with a significant t-value of 2.098. This indicate that Risk
Management is a significant predictor variable (p<.05) and therefore a significant relationship
exist between Risk Management and Capital Adequacy.
In the fourth step, there was no significant relationship between Corporate Governance, Risk
Management and Capital Adequacy (F=6.518, p<.05, ∆R2=.050). Tests of the slope show that
124
the regression coefficient (β) value of Corporate Governance was -.199 with a significant t-value
of -2.911 (p<.05). The regression coefficient (β) value For Risk Management was .037 with a
significant t-value of 2.292 (p<.05). This indicate that Risk Management is a significant predictor
variable and therefore a significant relationship exist between Risk Management and Capital
Adequacy. This indicates that both Corporate Governance and Risk Management are significant
predictor variables of capital adequacy (p < .05) and therefore a relationship exist among
Corporate Governance, Risk Management and Capital Adequacy. Since Risk Management
significantly Predict Capital Adequacy (C) even when Corporate Governance is controlled
(p<.05), Risk Management has an intervening effect on the relationship between Corporate
Governance and Capital Adequacy. These findings reject sub hypothesis one.
The second sub hypothesis was to assess the intervening effect of Risk Management on the
relationship between Corporate Governance and Asset Quality. The hypothesis was stated as
follows:
H2b: The Relationship between Corporate Governance (CG) and Asset Quality (A) of
Commercial Banks in Kenya is Not Intervened by Risk Management.
The results are as shown in table 5.8 below:
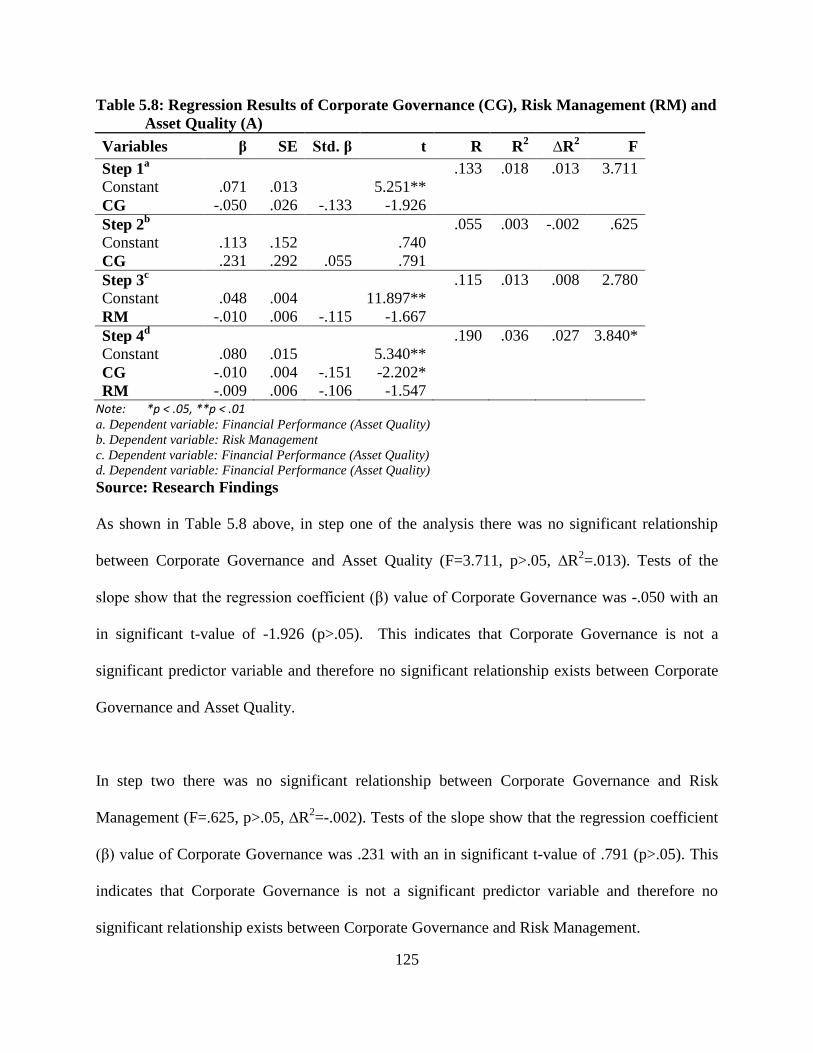
125
Table 5.8: Regression Results of Corporate Governance (CG), Risk Management (RM) and
Asset Quality (A)
Variables β SE Std. β t R R2 ∆R
2 F
Step 1a .133 .018 .013 3.711
Constant .071 .013
5.251**
CG -.050 .026 -.133 -1.926
Step 2b .055 .003 -.002 .625
Constant .113 .152
.740
CG .231 .292 .055 .791
Step 3c .115 .013 .008 2.780
Constant .048 .004
11.897**
RM -.010 .006 -.115 -1.667
Step 4d .190 .036 .027 3.840*
Constant .080 .015
5.340**
CG -.010 .004 -.151 -2.202*
RM -.009 .006 -.106 -1.547 Note: *p < .05, **p < .01 a. Dependent variable: Financial Performance (Asset Quality)
b. Dependent variable: Risk Management
c. Dependent variable: Financial Performance (Asset Quality)
d. Dependent variable: Financial Performance (Asset Quality)
Source: Research Findings
As shown in Table 5.8 above, in step one of the analysis there was no significant relationship
between Corporate Governance and Asset Quality (F=3.711, p>.05, ∆R2=.013). Tests of the
slope show that the regression coefficient (β) value of Corporate Governance was -.050 with an
in significant t-value of -1.926 (p>.05). This indicates that Corporate Governance is not a
significant predictor variable and therefore no significant relationship exists between Corporate
Governance and Asset Quality.
In step two there was no significant relationship between Corporate Governance and Risk
Management (F=.625, p>.05, ∆R2=-.002). Tests of the slope show that the regression coefficient
(β) value of Corporate Governance was .231 with an in significant t-value of .791 (p>.05). This
indicates that Corporate Governance is not a significant predictor variable and therefore no
significant relationship exists between Corporate Governance and Risk Management.

126
In step three there was no significant relationship between Risk Management and Asset Quality
(F=2.780, p>.05, ∆R2=.008). Tests of the slope show that the regression coefficient (β) value of
Risk Management was -.010 with an insignificant t-value of -1.667 (p>.05). This indicates that
Risk Management is not a significant predictor variable and therefore no significant relationship
exists between Risk Management and Asset Quality.
In the fourth step, there was a significant relationship between Corporate Governance, Risk
Management and Asset Quality (F=3.840, p<.05, ∆R2=.027). Tests of the slope show that the
regression coefficient (β) value of Corporate Governance was -.010 with a significant t-value of -
2.202 (p<.05). The regression coefficient (β) value for Risk Management was -.009 with an
insignificant t-value of -1.547 (p>.05). This indicates that Risk Management is not a significant
predictor variable and therefore no significant relationship exists between Risk Management and
Asset Quality. This indicates that Corporate Governance is a significant predictor whereas Risk
Management is not a significant predictor variable of Asset Quality. However, a relationship
exists among Corporate Governance, Risk Management and Asset Quality. Since Risk
Management significantly predict Asset Quality (A) when Corporate Governance is controlled
(p<0.05), Risk Management has an intervening effect on the relationship between Corporate
Governance and Asset Quality. The second sub hypothesis is therefore rejected.
The third sub hypothesis was to assess the intervening effect of Risk Management on the
relationship between Corporate Governance and Management Efficiency. The hypothesis was
stated as follows:

127
H2c: The Relationship between Corporate Governance and Management Capacity of
Commercial Banks in Kenya is Not Intervened by Risk Management.
The results are as shown in table 5.9 below:
Table 5.9: Regression Results of Corporate Governance (CG), Risk Management (RM) and
Management Capacity(M)
Variables β SE Std. β t R R2 ∆R
2 F
Step 1a .189 .036 .031 7.672*
Constant .593 .064
9.234**
CG .052 .019 .189 2.770*
Step 2b .060 .004 -.001 .753
Constant .085 .170
.501
CG .043 .050 .060 .868
Step 3c .052 .003 -.002 .568
Constant .770 .018
43.947**
RM -.020 .027 -.052 -.754
Step 4d .237 .056 .047 6.126*
Constant .584 .057
10.240**
CG .374 .109 .231 3.414*
RM -.025 .026 -.065 -.959
Note: *p < .05, **p < .01 a. Dependent variable: Financial Performance (Managements Efficiency)
b. Dependent variable: Risk Management
c. Dependent variable: Financial Performance (Managements Efficiency)
d. Dependent variable: Financial Performance (Managements Efficiency)
Source: Research Findings
Table 5.9 shows the results of the regression analysis. In step one of the analysis there was a
significant relationship between Corporate Governance and Management Capacity (F=7.672,
p<.05, ∆R2=.031). Tests of the slope show that the regression coefficient (β) value of Corporate
Governance was -.052 with a significant t-value of 2.770 (p<.05). This indicates that Corporate
Governance is a significant predictor variable and therefore a significant relationship exists
between Corporate Governance and Management Capacity (M).
128
In step two there was no significant relationship between Corporate Governance and Risk
Management (F=.753, p>.05, ∆R2=-.001). Tests of the slope show that the regression coefficient
(β) value of Corporate Governance was .043 with an in significant t-value of .868 (p>.05). This
indicates that Corporate Governance is not a significant predictor variable of Risk Management
and therefore no significant relationship exists between Corporate Governance and Risk
Management.
In step three there was a significant relationship between Risk Management and Management
Capacity (F=.568, p>.05, ∆R2=-.002). Tests of the slope show that the regression coefficient (β)
value of Risk Management was -.020 with an insignificant t-value of -.754 (p<.05). This
indicates that Risk Management is not a significant predictor variable and therefore no
significant relationship exists between Risk Management and Management Efficiency.
In the fourth step, there was a significant relationship between Corporate Governance, Risk
Management and Management Capacity (F=6.126, p<.05, ∆R2=.047). Tests of the slope show
that the regression coefficient (β) value of Corporate Governance was .374 with a significant t-
value of 3.414 (p<.05). The regression coefficient (β) value for Risk Management was -.025 with
an insignificant t-value of -.959 (p>.05). This indicates that Risk Management is not a significant
predictor variable and therefore no significant relationship exists between Risk Management and
Management Efficiency. This indicates that Corporate Governance is a significant predictor
whereas Risk Management is not significant predictor variables of Management Capacity(p >
.05) and even though a relationship exists among Corporate Governance, Risk Management and
Management Efficiency, Risk Management does not significantly predict Management Capacity

129
even when Corporate Governance is controlled (p>0.05). Risk Management has no intervening
effect on the relationship between Corporate Governance and Management Efficiency. The third
sub hypothesis is therefore not rejected.
The fourth sub hypothesis was to assess the intervening effect of Risk Management on the
relationship between Corporate Governance and Earnings. The hypothesis was stated as follows:
H2d: The Relationship between Corporate Governance and Earnings (E) of Commercial
Banks in Kenya is Not Intervened by Risk Management.
The results are as shown in table 5.10 below:
Table 5.10: Regression Results of Corporate Governance (CG), Risk Management (RM)
and Earnings (E)
Variables β SE Std. β t R R2 ∆R
2 F
Step 1a .007 .000 -.005 .010
Constant .024 .006
4.108**
CG .001 .011 .007 .098
Step 2b .055 .003 -.002 .625
Constant .113 .152
.740
CG .231 .292 .055 .791
Step 3c .020 .000 -.004 .083
Constant .024 .002
14.115**
RM -.001 .003 -.020 -.289
Step 4d .022 .000 -.009 .048
Constant .024 .006
4.109**
CG .001 .011 .008 .114
RM -.001 .003 -.020 -.294 Note: *p < .05, **p < .01 a. Dependent variable: Financial Performance (Earnings)
b. Dependent variable: Risk Management
c. Dependent variable: Financial Performance (Earnings)
d. Dependent variable: Financial Performance (Earnings)
Source: Research Findings
A multiple linear regression was computed to assess the relationship between Corporate
Governance, Risk Management and earnings of commercial banks. As shown in Table 5.10

130
above, in step one of the analysis there was no significant relationship between Corporate
Governance and Earnings (F=.010, p>.05, ∆R2=.-.005). Tests of the slope show that the
regression coefficient (β) value of Corporate Governance was .001 with an in significant t-value
of .098 (p>.05). This indicates that Corporate Governance is not a significant predictor variable
and therefore no significant relationship exists between Corporate Governance and Earnings.
In step two there was no significant relationship between Corporate Governance and Risk
Management (F=.625, p>.05, ∆R2=-.002). Tests of the slope show that the regression coefficient
(β) value of Corporate Governance was .231 with an in significant t-value of .791 (p>.05). This
indicates that Corporate Governance is not a significant predictor variable and therefore no
significant relationship exists between Corporate Governance and Risk Management.
In step three there was no significant relationship between Risk Management and Capital
Adequacy (F=.083, p>.05, ∆R2-.004). Tests of the slope show that the regression coefficient (β)
value of Risk Management was -.001 with an in significant p-value of -.289 (p>.05). This
indicate that Risk Management is not a significant predictor variable and therefore no significant
relationship exist between Risk Management and Earnings.
In the fourth step, there was no significant relationship between Corporate Governance, Risk
Management and Earnings (F=.048, p>.05, ∆R2=-.009). Tests of the slope show that the
regression coefficient (β) value of Corporate Governance was .001 with an in significant t-value
of .114 (p>.05). The regression coefficient (β) value for Risk Management was -.001 with an
insignificance level of p>.05. This indicates that Risk Management is not a significant predictor

131
variable and therefore no significant relationship exists between Risk Management and Earnings.
This indicates that neither Corporate Governance nor Risk Management are significant predictor
variables of Earnings (p>.05) and therefore no relationship exist among Corporate Governance,
Risk Management and Earnings. Since Risk Management does not significantly predict Earnings
even when Corporate Governance is controlled (p>0.05), Risk Management has no intervening
effect on the relationship between Corporate Governance and Earnings. These findings fail to
reject the sub hypothesis four.
The fifth sub hypothesis was to assess the intervening effect of Risk Management on the
relationship between Corporate Governance and Liquidity. The hypothesis was stated as follows:
H5e: The Relationship between Corporate Governance and Liquidity of Commercial
Banks in Kenya is Not Intervened by Risk Management.
The results are as shown in table 5.11 below:
Table 5.11: Regression Results of Corporate Governance (CG), Risk Management (RM)
and Liquidity (L)
Variables β SE Std. β t R R2 ∆R
2 F
Step 1a .008
a .000 -.005 .012
Constant .051 .001
68.713**
CG .000 .001 .008 .109
Step 2b .055
a .003 -.002 .625
Constant .113 .152
.740
CG .231 .292 .055 .791
Step 3c .019
a .000 -.004 .073
Constant .051 .000
230.086**
RM -9.09 .000 -.019 -.269
Step 4d .021
a .000 -.009 .044
Constant .051 .001
68.484**
CG .000 .001 .009 .124
RM -9.32 .000 -.019 -.275 Note: *p < .05, **p < .01 a. Dependent variable: Financial Performance (Liquidity)
b. Dependent variable: Risk Management
c. Dependent variable: Financial Performance (Liquidity)
d. Dependent variable: Financial Performance (Liquidity)
Source: Research Findings
132
A multiple linear regression was computed to assess the relationship Between Corporate
Governance, Risk Management and Liquidity of commercial banks. As shown in Table 5.11
above, in step one of the analysis there was no significant relationship between Corporate
Governance and Liquidity (F=.012, p>.05, ∆R2=.-.005). Tests of the slope show that the
regression coefficient (β) value of Corporate Governance was .000 with an in significant t-value
of .109 (p>.05). This indicates that Corporate Governance is not a significant predictor variable
and therefore no significant relationship exists between Corporate Governance and Liquidity.
In step two there was no significant relationship between Corporate Governance and Risk
Management (F=.625, p>.05, ∆R2=-.002). Tests of the slope show that the regression coefficient
(β) value of Corporate Governance was 231 with an in significant t-value of .791 (p>.05). This
indicates that Corporate Governance is not a significant predictor variable and therefore no
significant relationship exists between Corporate Governance and Risk Management.
In step three there was no significant relationship between Risk Management and Liquidity
(F=.073, p>.05, ∆R2
=-.004). Tests of the slope show that the regression coefficient (β) value of
Risk Management was -9.09 with an in significant t-value of -.269 (p>.05). This indicates that
Risk Management is not a significant predictor variable and therefore no significant relationship
exists between Risk Management and Liquidity.
In the fourth step, there was no significant relationship between Corporate Governance, Risk
Management and Liquidity (F=.044, p>.05, ∆R2=-.009). Tests of the slope show that the
regression coefficient (β) value of Corporate Governance was .000 with an in significant t-value

133
of .124 (p>.05). The regression coefficient (β) Value for Risk Management was -9.32 with an
insignificance level of -.275 (p>.05). This indicates that Risk Management is not a significant
predictor variable and therefore no significant relationship exists between Risk Management and
Liquidity. This indicates that neither Corporate Governance nor Risk Management are significant
predictor variables of Liquidity (p>.05) and therefore no relationship exist among Corporate
Governance, Risk Management and Liquidity. Since Risk Management does not significantly
predict Liquidity even when Corporate Governance is controlled (p>0.05), Risk Management has
no intervening effect on the relationship between Corporate Governance and Liquidity. These
findings fail to reject the sub hypothesis five.
The sixth sub hypothesis was to assess the intervening effect of Risk Management on the
relationship between Corporate Governance and Composite Financial Performance measure. The
hypothesis was stated as follows:
H2e: The Relationship between Corporate Governance and Composite Financial
Performance of commercial Banks in Kenya is Not Intervened by Risk
Management.
The results are as shown in table 5.12 below:
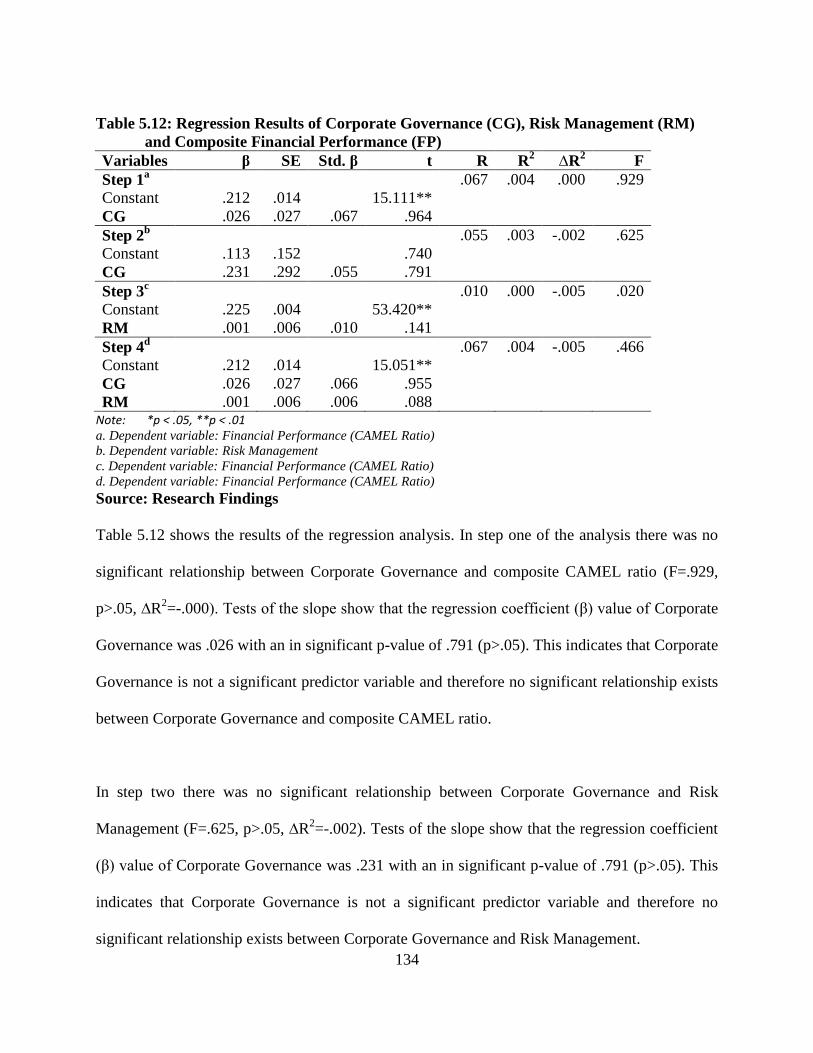
134
Table 5.12: Regression Results of Corporate Governance (CG), Risk Management (RM)
and Composite Financial Performance (FP)
Variables β SE Std. β t R R2 ∆R
2 F
Step 1a .067 .004 .000 .929
Constant .212 .014
15.111**
CG .026 .027 .067 .964
Step 2b .055 .003 -.002 .625
Constant .113 .152
.740
CG .231 .292 .055 .791
Step 3c .010 .000 -.005 .020
Constant .225 .004
53.420**
RM .001 .006 .010 .141
Step 4d .067 .004 -.005 .466
Constant .212 .014
15.051**
CG .026 .027 .066 .955
RM .001 .006 .006 .088 Note: *p < .05, **p < .01 a. Dependent variable: Financial Performance (CAMEL Ratio)
b. Dependent variable: Risk Management
c. Dependent variable: Financial Performance (CAMEL Ratio)
d. Dependent variable: Financial Performance (CAMEL Ratio)
Source: Research Findings
Table 5.12 shows the results of the regression analysis. In step one of the analysis there was no
significant relationship between Corporate Governance and composite CAMEL ratio (F=.929,
p>.05, ∆R2=-.000). Tests of the slope show that the regression coefficient (β) value of Corporate
Governance was .026 with an in significant p-value of .791 (p>.05). This indicates that Corporate
Governance is not a significant predictor variable and therefore no significant relationship exists
between Corporate Governance and composite CAMEL ratio.
In step two there was no significant relationship between Corporate Governance and Risk
Management (F=.625, p>.05, ∆R2=-.002). Tests of the slope show that the regression coefficient
(β) value of Corporate Governance was .231 with an in significant p-value of .791 (p>.05). This
indicates that Corporate Governance is not a significant predictor variable and therefore no
significant relationship exists between Corporate Governance and Risk Management.
135
In step three there was no significant relationship between Risk Management and Management
Capacity (F=020, p>.05, ∆R2=-.005). Tests of the slope show that the regression coefficient (β)
value of Risk Management was -.001 with a significant p-value of .141 (p>.05). This indicates
that Risk Management is not a significant predictor variable and therefore no significant
relationship exists between Risk Management and composite CAMEL ratio.
In the fourth step, there was a significant relationship between Corporate Governance, Risk
Management and Management Capacity (F=466, p>.05, ∆R2=-.005). Tests of the slope show that
the regression coefficient (β) value of Corporate Governance was .026 with an in significant t-
value of .955 (p>.05). The regression coefficient (β) value For Risk Management was .001 with a
significance level of p>.05. This indicates that Risk Management is not a significant predictor
variable and therefore no significant relationship exists between Corporate Governance, Risk
Management and CAMEL Ratio. This indicates that Corporate Governance and Risk
Management are not significant predictors of the composite CAMEL ratio (p > .05) and therefore
no relationship exist among Corporate Governance, Risk Management and the Composite
CAMEL Ratio. Since Risk Management did not significantly predict CAMEL ratio even when
Corporate Governance is controlled (p>0.05), Risk Management has no intervening effect on the
relationship between Corporate Governance and the composite CAMEL ratio. The sixth sub
hypothesis is therefore not rejected.
136
5.4 Moderating Effect of Firm Characteristics on the Relationship between
Corporate Governance and Bank Financial Performance
The fourth objective of the study was to assess the moderating effect of Firm Characteristics on
the relationship between Corporate Governance and Bank Financial Performance. The study
hypothesized that the relationship between Corporate Governance and Bank Financial
Performance was not moderated by Firm Characteristics of commercial banks in Kenya. The
following hypothesis was tested:
H3: The Relationship between Corporate Governance and Bank Financial Performance
is Not Moderated by Firm Characteristics.
The moderation effect was evaluated using the method proposed by Baron and Kenny (1986).
The method involved testing the main effects of the independent variable (Corporate
Governance, CG) on the dependent variable (bank Financial Performance), the effect of the
moderating variable (Firm Characteristics, FC) on the dependent variable (bank Financial
Performance) and finally the effect of the interaction term between Corporate Governance and
Firm Characteristics (CG*FC) on the dependent variable (bank financial performance, FP).
To create an interaction term, CG and FC ratios were first centred and a single item indicator
representing the product of the two measures calculated (CG*FC). The creation of a new
variable by multiplying the scores of CG and FC risked the creation a multicollinearity problem.
To solve the possible multicollinearity problem, which could have an effect on the estimation of
the regression coefficients for the main effects, the two factors were converted to standardized
(Z) scores that have mean zero and standard deviation one.

137
The two standardized variables (CG and FC) were then multiplied to obtain the interaction
variable. Since there were six measures of Financial Performance sub hypotheses were tested for
the intervening effect of Firm Characteristics on corresponding measures of Financial
Performance and thereafter the composite measures. The sub hypotheses and results of the
hierarchical multiple regression predicting bank Financial Performance from Corporate
Governance, Firm Characteristics and the interaction between Corporate Governance and Firm
Characteristics (CG*FC) are reported below. The moderation hypothesis would be supported if
the interaction (CG*FC) in predicting bank Financial Performance yields a statistically
significant coefficient. The first sub hypothesis was to test the moderating effect of Firm
Characteristics on the relationship between Corporate Governance and Capital Adequacy. The
null hypothesis tested was as follows:
H3a: The Relationship between Corporate Governance and Capital Adequacy is Not
Moderated by Firm Characteristics
The results follow in the table below:
Table 5.13: Regression Results of Capital Adequacy, Corporate Governance, Firm
Characteristics and Interaction Term (CG*FC)
Variables β SE Std. β t R R2 ∆R
2 F
Model 1a .362 .131 .123 15.532**
Constant 1.226 .190
6.451**
CG -.068 .070 -.068 -.974
FC -.114 .024 -.332 -4.758**
Model 2b .372 .139 .126 11.000**
Constant 2.096 .673
3.113*
CG -3.705 2.701 -3.674 -1.372
FC -.215 .079 -.628 -2.723
CG*FC 3.886 2.885 3.725 1.347
Note: *p < .05, **p < .01
a. Predictors: (Constant), Corporate Governance, Firm Characteristics
b. Predictors: (Constant), Corporate Governance, Firm Characteristics, CG*FC
c. Dependent Variable: Capital Adequacy Source: Research Findings

138
Table 5.13 shows the results of the hierarchical regression conducted to assess the moderating
effect of Composite Firm Characteristics on the relationship between Corporate Governance and
Capital Adequacy. Model 1 shows that there was a statistically significant relationship between
Corporate Governance, Composite Firm Characteristics and Capital Adequacy (F=15.532, p<.01,
∆R2
= .123). Further, model 1 shows that Corporate Governance and Composite Firm
Characteristics explain 12.3% of Capital Adequacy. The introduction of the interaction variable
(CG*FC) in model 2 increased the ∆R2 by 0.3% and reduced the F values by 4.532. The full
model (model 2) shows that Corporate Governance, Composite Firm Characteristics and the
interaction variable (CG*FC) significantly predict Capital Adequacy (F =11.000 p<.01, ∆R2
=
.126). Model 2 further shows that the variation in Capital Adequacy explained by Corporate
Governance and Composite Firm Characteristics is 12.6% with the inclusion of the interaction
term (CG*FC). Model 1 is useful for prediction but model 2 is not acceptable for prediction.
Tests of the regression coefficients (β) shows that the Composite Firm Characteristics (p<.01) in
model 1 is statistically significant. In model 2 the (β) of Corporate Governance, Composite Firm
Characteristics and the interaction term (CG*FC) were all not statistically significant (p>0.05).
Given the fact that the interaction term was not statistically significant (p>0.05), the study find
that Composite Firm Characteristics has no moderation effect on the relationship between
Corporate Governance and Capital Adequacy. The findings fail to reject the null sub hypothesis.
The second sub hypothesis was to tests the moderating effect of Firm Characteristics on the
relationship between Corporate Governance and Asset Quality. The null hypothesis tested was as
follows:
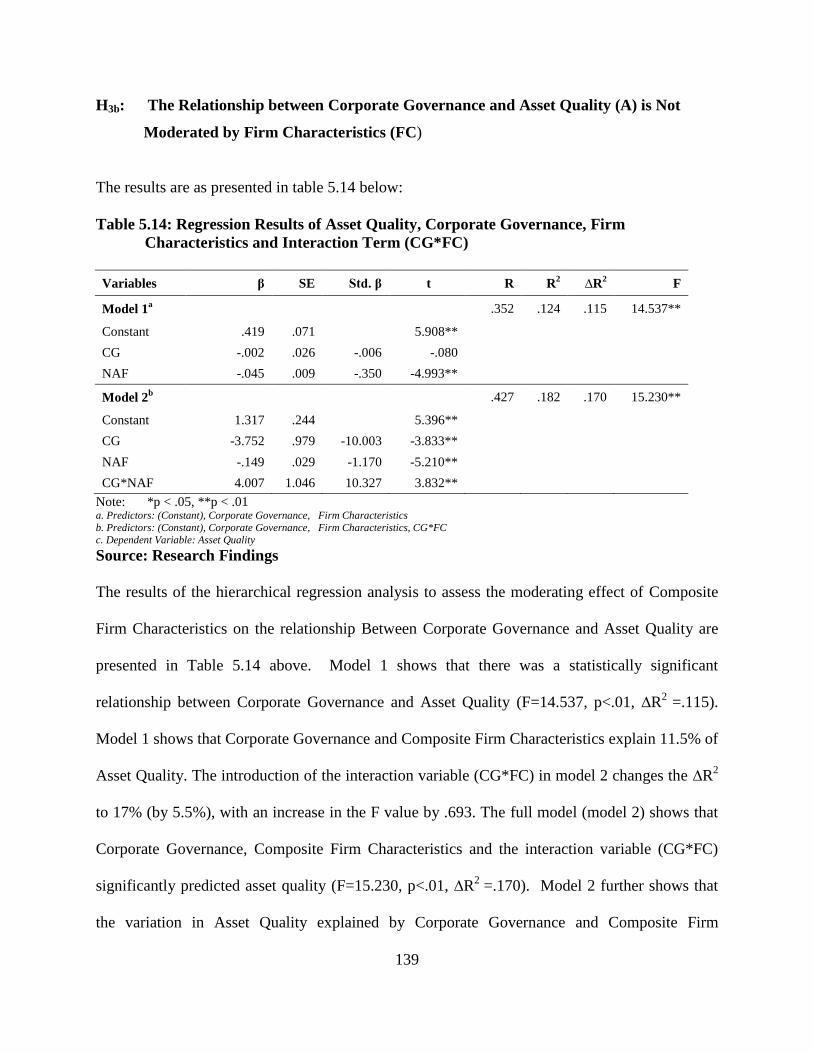
139
H3b: The Relationship between Corporate Governance and Asset Quality (A) is Not
Moderated by Firm Characteristics (FC)
The results are as presented in table 5.14 below:
Table 5.14: Regression Results of Asset Quality, Corporate Governance, Firm
Characteristics and Interaction Term (CG*FC)
Variables β SE Std. β t R R2 ∆R
2 F
Model 1a .352 .124 .115 14.537**
Constant .419 .071
5.908**
CG -.002 .026 -.006 -.080
NAF -.045 .009 -.350 -4.993**
Model 2b .427 .182 .170 15.230**
Constant 1.317 .244
5.396**
CG -3.752 .979 -10.003 -3.833**
NAF -.149 .029 -1.170 -5.210**
CG*NAF 4.007 1.046 10.327 3.832**
Note: *p < .05, **p < .01 a. Predictors: (Constant), Corporate Governance, Firm Characteristics
b. Predictors: (Constant), Corporate Governance, Firm Characteristics, CG*FC
c. Dependent Variable: Asset Quality
Source: Research Findings
The results of the hierarchical regression analysis to assess the moderating effect of Composite
Firm Characteristics on the relationship Between Corporate Governance and Asset Quality are
presented in Table 5.14 above. Model 1 shows that there was a statistically significant
relationship between Corporate Governance and Asset Quality (F=14.537, p<.01, ∆R2
=.115).
Model 1 shows that Corporate Governance and Composite Firm Characteristics explain 11.5% of
Asset Quality. The introduction of the interaction variable (CG*FC) in model 2 changes the ∆R2
to 17% (by 5.5%), with an increase in the F value by .693. The full model (model 2) shows that
Corporate Governance, Composite Firm Characteristics and the interaction variable (CG*FC)
significantly predicted asset quality (F=15.230, p<.01, ∆R2
=.170). Model 2 further shows that
the variation in Asset Quality explained by Corporate Governance and Composite Firm

140
Characteristics is 17% with the inclusion of the interaction term (CG*FL). Both model 1 and 2
are acceptable for prediction subject to tests of the slope.
Tests of the regression coefficients in the full model (model 2) show that the beta of Corporate
Governance, Composite Firm Characteristics and the interaction term (CG*FC) are all
statistically significant (p<.01). Given that there was an increase in the coefficient of
determination (∆R2) with the introduction of the interaction term (CG*FC), and further the fact
that beta of the interaction term was statistically significant (p<0.01), the study find that
Composite Firm Characteristics has a moderation effect on the relationship between Corporate
Governance and Asset Quality The sub hypothesis is therefore rejected
The third sub hypothesis was to tests the moderating effect of Firm Characteristics on the
relationship between Corporate Governance and Management Efficiency. The null hypothesis
tested was as follows:
H3c: The Relationship between Corporate Governance and Management Capacity is
Not Moderated by Firm Characteristics
The results are as presented in table 5.15 below:
Table 5.15: Regression Results of Management Capacity (M), Corporate Governance,
Firm Characteristics and Interaction Term (CG*FC)
Variables β SE Std. β t R R2 ∆R
2 F
Model 1a .228 .052 .043 5.662*
Constant .520 .318
1.636
CG .360 .118 .223 3.058*
FC .008 .040 .014 .196
Model 2b .239 .057 .043 4.122*
Constant 1.626 1.129
1.440
CG -4.259 4.527 -2.637 -.941
FC -.121 .132 -.220 -.914
CG*FC 4.935 4.835 2.954 1.021
Note: *p < .05, **p < .01
a. Predictors: (Constant), Corporate Governance, Firm Characteristics
b. Predictors: (Constant), Corporate Governance, Firm Characteristics, CG*FC c. Dependent Variable: Management Efficiency
Source: Research Findings

141
Table 5.15 shows the results of the hierarchical regression computed to assess the moderating
effect of Composite Firm Characteristics on the Relationship between Corporate Governance and
Management Efficiency. Model 1 shows that there was a statistically significant relationship
between Corporate Governance, Firm Characteristics and Management Capacity (F= 5.662,
p<.05, ∆R2
=.043). Further, model 1 shows that Corporate Governance and Firm Characteristics
explain 4.3% of Management Efficiency. The introduction of the interaction variable (CG*FC) in
model 2 did not change the ∆R2
, and the F value reduced by 1.54. The full model (model 2)
shows that Corporate Governance, Firm Characteristics and the interaction variable (CG*FC)
significantly predict Management Capacity (F =4.122, p<.05, ∆R2
=.043). Model 2 further shows
that the variation in Management Capacity Explained by Corporate Governance and Composite
Firm Characteristic 4.3% with the inclusion of the interaction term (CG*FC). Both models (1 and
2) are not acceptable for prediction.
Tests of the regression coefficients (β) of Corporate Governance, Composite Firm Characteristics
and the interaction term (CG*FC) shows that all the regression coefficients were not statistically
significant (p>0.05). Given that there was no change in the coefficient of determination (∆R2)
with the introduction of the interaction term (CG*FC), and further the fact that the interaction
term was not statistically significant (p>0.05), the study finds that Composite Firm
Characteristics has no moderation effect on the relationship between Corporate Governance and
Management Efficiency. The findings fail to reject the null sub hypothesis.
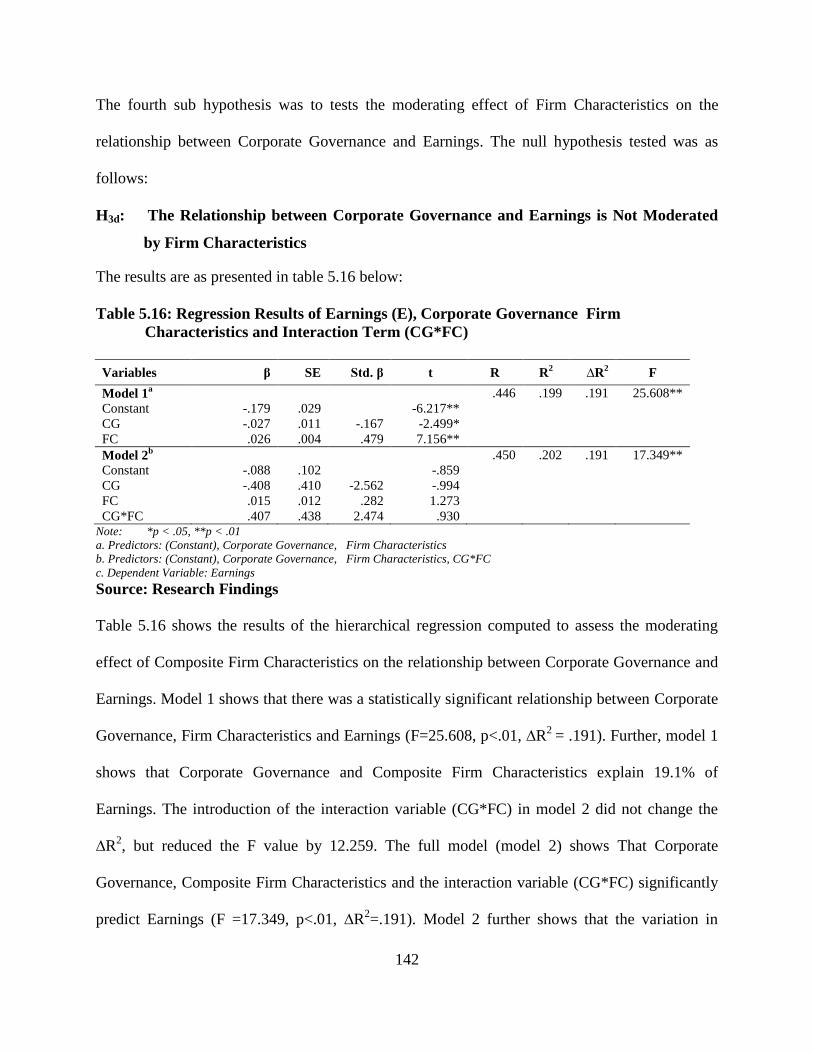
142
The fourth sub hypothesis was to tests the moderating effect of Firm Characteristics on the
relationship between Corporate Governance and Earnings. The null hypothesis tested was as
follows:
H3d: The Relationship between Corporate Governance and Earnings is Not Moderated
by Firm Characteristics
The results are as presented in table 5.16 below:
Table 5.16: Regression Results of Earnings (E), Corporate Governance Firm
Characteristics and Interaction Term (CG*FC)
Variables β SE Std. β t R R2 ∆R
2 F
Model 1a .446 .199 .191 25.608**
Constant -.179 .029
-6.217**
CG -.027 .011 -.167 -2.499*
FC .026 .004 .479 7.156**
Model 2b .450 .202 .191 17.349**
Constant -.088 .102
-.859
CG -.408 .410 -2.562 -.994
FC .015 .012 .282 1.273
CG*FC .407 .438 2.474 .930 Note: *p < .05, **p < .01
a. Predictors: (Constant), Corporate Governance, Firm Characteristics
b. Predictors: (Constant), Corporate Governance, Firm Characteristics, CG*FC
c. Dependent Variable: Earnings
Source: Research Findings
Table 5.16 shows the results of the hierarchical regression computed to assess the moderating
effect of Composite Firm Characteristics on the relationship between Corporate Governance and
Earnings. Model 1 shows that there was a statistically significant relationship between Corporate
Governance, Firm Characteristics and Earnings (F=25.608, p<.01, ∆R2
= .191). Further, model 1
shows that Corporate Governance and Composite Firm Characteristics explain 19.1% of
Earnings. The introduction of the interaction variable (CG*FC) in model 2 did not change the
∆R2, but reduced the F value by 12.259. The full model (model 2) shows That Corporate
Governance, Composite Firm Characteristics and the interaction variable (CG*FC) significantly
predict Earnings (F =17.349, p<.01, ∆R2=.191). Model 2 further shows that the variation in
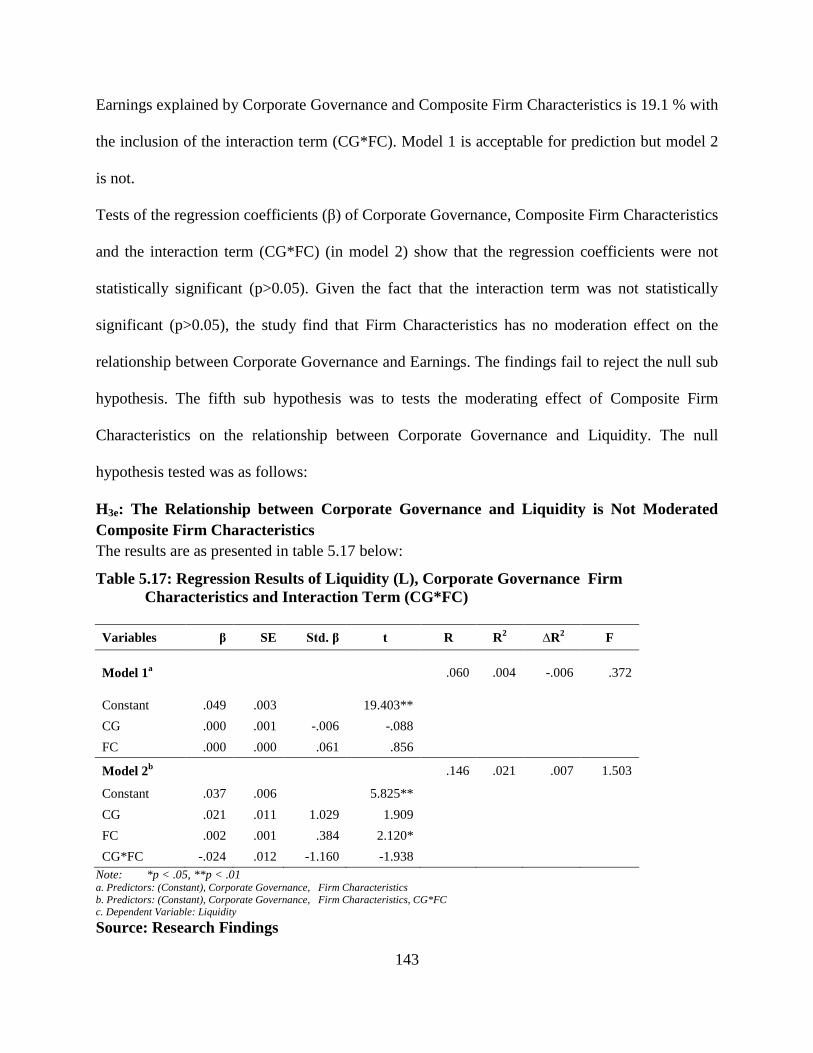
143
Earnings explained by Corporate Governance and Composite Firm Characteristics is 19.1 % with
the inclusion of the interaction term (CG*FC). Model 1 is acceptable for prediction but model 2
is not.
Tests of the regression coefficients (β) of Corporate Governance, Composite Firm Characteristics
and the interaction term (CG*FC) (in model 2) show that the regression coefficients were not
statistically significant (p>0.05). Given the fact that the interaction term was not statistically
significant (p>0.05), the study find that Firm Characteristics has no moderation effect on the
relationship between Corporate Governance and Earnings. The findings fail to reject the null sub
hypothesis. The fifth sub hypothesis was to tests the moderating effect of Composite Firm
Characteristics on the relationship between Corporate Governance and Liquidity. The null
hypothesis tested was as follows:
H3e: The Relationship between Corporate Governance and Liquidity is Not Moderated
Composite Firm Characteristics
The results are as presented in table 5.17 below:
Table 5.17: Regression Results of Liquidity (L), Corporate Governance Firm
Characteristics and Interaction Term (CG*FC)
Variables β SE Std. β t R R2 ∆R
2 F
Model 1a .060 .004 -.006 .372
Constant .049 .003
19.403**
CG .000 .001 -.006 -.088
FC .000 .000 .061 .856
Model 2b .146 .021 .007 1.503
Constant .037 .006
5.825**
CG .021 .011 1.029 1.909
FC .002 .001 .384 2.120*
CG*FC -.024 .012 -1.160 -1.938
Note: *p < .05, **p < .01 a. Predictors: (Constant), Corporate Governance, Firm Characteristics
b. Predictors: (Constant), Corporate Governance, Firm Characteristics, CG*FC c. Dependent Variable: Liquidity
Source: Research Findings

144
Table 5.17 shows the results of the hierarchical regression computed to assess the moderating
effect of Composite Firm Characteristics on the relationship between Corporate Governance and
Liquidity. Model 1 shows that there was no statistically significant relationship between
Liquidity, Composite Firm Characteristics and Corporate Governance (F=.372, p>.05, ∆R2
= -
.006). Further, model 1 shows that Corporate Governance and Firm Characteristics explain -
0.6% of liquidity. The introduction of the interaction variable (CG*FC) in model 2 increases the
∆R2 and the F value by 1.3% and by 1.131 respectively. The full model (model 2) shows that
Corporate Governance, Composite Firm Characteristics and the interaction variable (CG*FC)
did not significantly predict liquidity (F =1.503, p>.05, ∆R2
=.007). Model 2 further shows that
the variation in Liquidity explained by Corporate Governance and Composite Firm
Characteristics is 0.7% with the inclusion of the interaction term (CG*FC). Both models (1 and
2) are not acceptable for prediction.
Tests of the regression coefficients (β) of Corporate Governance, Composite Firm Characteristics
and the interaction term (CG*FC) show that the regression coefficients were not statistically
significant (p>0.05). Given the fact that the interaction term was not statistically significant
(p>0.05), the study finds that Composite Firm Characteristics has no moderation effect on the
relationship between Corporate Governance and Liquidity. The findings fail to reject the null sub
hypothesis.
The sixth sub hypothesis was to tests the moderating effect of Firm Characteristics on the
relationship between Corporate Governance and Composite Financial Performance (CAMEL
ratio). The null hypothesis tested was as follows:

145
H3f: The Relationship between Corporate Governance and Financial Performance is
Not Moderated by Firm Characteristics
The results are as presented in table 5.18 below
Table 5.18: Regression Results of Composite Financial Performance (FP), Corporate
Governance (CG), Firm Characteristics (FC) and Interaction Term (CG*FC) Variables β SE Std. β t R R
2 ∆R
2 F
Model 1a .093
a .009 -.001 .902
Constant .169 .048
3.554**
CG .020 .028 .052 .726
FC .005 .006 .066 .936
Model 2b .304
b .092 .079 6.999**
Constant .640 .117
5.462**
CG -.852 .202 -2.192 -4.226**
FC -.052 .014 -.635 -3.636**
CG*FC .969 .222 2.515 4.363** Note: *p < .05, **p < .01
a. Predictors: (Constant), Corporate Governance, Firm Characteristics b. Predictors: (Constant), Corporate Governance, Firm Characteristics, CG*FC
c. Dependent Variable: CAMEL Ratio
Source: Research Findings
The results of the hierarchical regression analysis to assess the moderating effect of Composite
Firm Characteristics on the relationship between Corporate Governance and CAMEL ratio are
presented in Table 5.18 above, Model 1 shows that there was no statistically significant
relationship between Corporate Governance Composite, Composite Firm Characteristics and
CAMEL ratio (F=.902, p>.05, ∆R2
= -.001). Model 1 shows that Corporate Governance and
Composite Firm Characteristics explain -0.1% of CAMEL ratio. The introduction of the
interaction variable (CG*FC) in model 2 increases the ∆R2
and the F value by 8.0%, and 6.097
respectively. The full model (model 2) shows that Corporate Governance, Composite Firm
Characteristics and the interaction variable (CG*FC) significantly predict CAMEL ratio
(F=6.999, p<.01, ∆R2
=.079). Model 2 further shows that the variation in CAMEL ratio
explained by Corporate Governance and Composite Firm Characteristics is 7.9% with the
inclusion of the interaction term (CG*FC). Model 1 is not acceptable for prediction but model 2
is acceptable, subject to tests of the slopes.
146
Tests of the regression coefficients (β) show that the beta of Corporate Governance, Composite
Firm Characteristics and interaction term (CG*FC) were all statistically significant (p<.01).
Given that model 2 was acceptable for prediction and the (β) of the interaction term was
statistically significant (p<0.01), the study find that Composite Firm Characteristics has a
moderation effect on the relationship between Composite Firm Characteristics and CAMEL
ratio; the findings reject the sub hypothesis.
5.5 Joint Effect of Corporate Governance, Risk Management and Firm
Characteristics on Bank Financial Performance
The fourth objective of the study was to determine joint effect of Corporate Governance, Firm
Characteristics and Risk Management on Financial Performance of commercial banks in Kenya.
The study hypothesized that the joint effect of Corporate Governance, Risk Management and
Firm Characteristics on the Financial Performance of commercial banks in Kenya was not
significant. The following null hypothesis was tested:
H4: The Joint Effect of Corporate Governance, Risk Management and Firm
Characteristics on the Financial Performance of commercial Banks in Kenya is Not
Significant
To evaluate effect on each Financial Performance indicators six sub hypotheses were tested. The
first sub hypothesis was to evaluate the combined effect of Corporate Governance, Risk
Management and Firm Characteristics on capital adequacy.
The hypothesis was stated as follows:
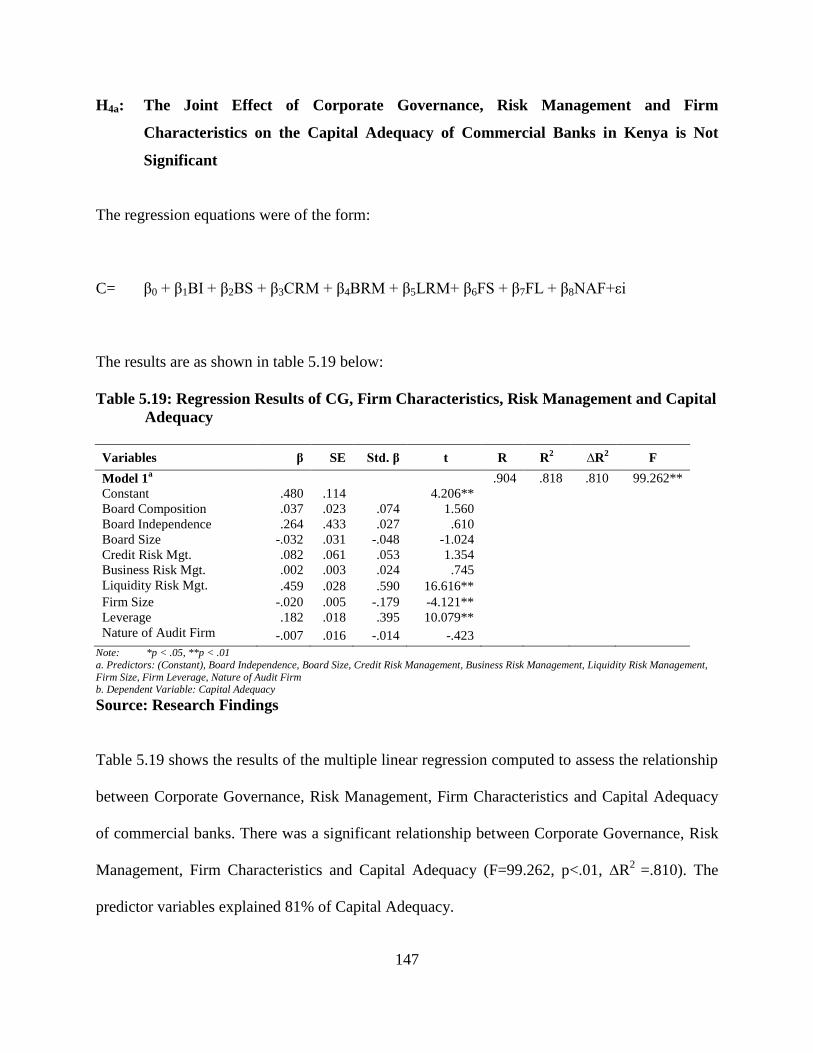
147
H4a: The Joint Effect of Corporate Governance, Risk Management and Firm
Characteristics on the Capital Adequacy of Commercial Banks in Kenya is Not
Significant
The regression equations were of the form:
C= β0 + β1BI + β2BS + β3CRM + β4BRM + β5LRM+ β6FS + β7FL + β8NAF+εi
The results are as shown in table 5.19 below:
Table 5.19: Regression Results of CG, Firm Characteristics, Risk Management and Capital
Adequacy
Variables β SE Std. β t R R2 ∆R
2 F
Model 1a .904 .818 .810 99.262**
Constant .480 .114
4.206**
Board Composition .037 .023 .074 1.560
Board Independence .264 .433 .027 .610
Board Size -.032 .031 -.048 -1.024
Credit Risk Mgt. .082 .061 .053 1.354
Business Risk Mgt. .002 .003 .024 .745
Liquidity Risk Mgt. .459 .028 .590 16.616**
Firm Size -.020 .005 -.179 -4.121**
Leverage .182 .018 .395 10.079**
Nature of Audit Firm -.007 .016 -.014 -.423 Note: *p < .05, **p < .01
a. Predictors: (Constant), Board Independence, Board Size, Credit Risk Management, Business Risk Management, Liquidity Risk Management,
Firm Size, Firm Leverage, Nature of Audit Firm b. Dependent Variable: Capital Adequacy
Source: Research Findings
Table 5.19 shows the results of the multiple linear regression computed to assess the relationship
between Corporate Governance, Risk Management, Firm Characteristics and Capital Adequacy
of commercial banks. There was a significant relationship between Corporate Governance, Risk
Management, Firm Characteristics and Capital Adequacy (F=99.262, p<.01, ∆R2
=.810). The
predictor variables explained 81% of Capital Adequacy.
148
The regression coefficients (β) of the Corporate Governance Indicators of Board Composition,
Board Independence and Board Size were not statistically significant (p>.05). The β and p values
of the other explanatory variables as presented in Table 5.19 were Credit Risk Management
(β=.082, p>.05), Business Risk Management (β=-.002, p>.05), Liquidity Risk Management
(β=.459, p<.01), Firm Size (β=-.020, p<.01), Firm Leverage (β=.182, p<.01) and Nature of Audit
Firm (β=-.007, p>.05).
From the findings the relationship between Capital Adequacy and Board Composition, Board
Independence, Board Size, Credit Risk Management, Business Risk Management as well as
Nature of Audit Firm were not statistically significant (p>.05). The relationship between Capital
Adequacy and Liquidity Risk Management, Firm Size and Leverage were however statistically
significant (p<.01). Since the overall model was statistically significant (p<0.01), Corporate
Governance, Risk Management and Firm Characteristics jointly have a significant relationship
with Capital Adequacy of commercial banks. The sub hypothesis was rejected.
The second sub hypothesis was to evaluate the combined effect of Corporate Governance, Risk
Management and Firm Characteristics on Asset Quality. The hypothesis was stated as follows:
H4b: The Joint Effect of Corporate Governance, Risk Management and Firm
Characteristics on the Asset Quality of Commercial Banks in Kenya is Not
Significant.
The regression equations were of the form:
A= β0 + β1BI + β2BS + β3CRM + β4BRM + β5LRM+ β6FS + β7FL + β8NAF+εi
The results were as presented in table 5.20 below:
Table 5.20: Regression Results of CG, Firm Characteristics, Risk Management and
Asset Quality

149
Variables β SE Std. β t R R2 ∆R
2 F
Model 1a .865 .749 .737 65.859**
Constant .212 .050
4.246**
Board Composition .044 .010 .239 4.293**
Board Independence 1.919 .189 .531 10.138**
Board Size .004 .014 .016 .286
Credit Risk Mgt. .320 .027 .549 12.018**
Business Risk Mgt. .001 .001 .020 .536
Liquidity Risk Mgt. -.042 .012 -.145 -3.481*
Firm Size -.010 .002 -.229 -4.493**
Leverage -.024 .008 -.137 -2.983*
Nature of Audit Firm .011 .007 .060 1.572
Note: *p < .05, **p < .01
a. Predictors: (Constant), Board Independence, Board Size, Credit Risk Management, Business Risk Management,
Liquidity Risk Management, Firm Size, Firm Leverage, Nature of Audit Firm
b. Dependent Variable: Asset Quality
Source: Research Findings
Table 5.20 shows the results of the multiple linear regression computed to assess the relationship
between Corporate Governance, Risk Management, Firm Characteristics and Asset Quality of
commercial banks. There was a significant relationship between Corporate Governance, Risk
Management, Firm Characteristics and Asset Quality capital adequacy (F=65.859, p<.01, ∆R2
=.737). The predictor variables explained 73.7% of Asset Quality.
The regression coefficients (β) of Board Composition (β=.044, p<.01), Board Independence
(β=1.919, p<.01), Credit Risk Management (β=.320, p<.01), Liquidity Risk Management (β=-
.042, p<.05), Firm Size (β=-010, p<.01) and Leverage (β=-.024, p<.05) were all statistically
significant. The β and p values of the other explanatory variables as presented in Table 5.38 were
as follows: Board Size (β=.004, p>.05), Business Risk Management (β=.001, p>.05) and Nature
of Audit Firm (β=.011, p>.05).
From the findings the relationship between Asset Quality and Board Size, Business Risk
Management as well as Nature of Audit Firm were not statistically significant (p>.05). The

150
relationship between Asset Quality and Board Composition, Board Independence, Credit Risk
Management, Liquidity Risk Management, Firm Size And Leverage were however statistically
significant (p<.05). Since the overall model was statistically significant (p<0.01), Corporate
Governance, Risk Management Firm Characteristics jointly have a significant relationship with
Asset Quality of commercial banks. The sub hypothesis was rejected.
The third sub hypothesis was to evaluate the combined effect of Corporate Governance, Risk
Management and Firm Characteristics on Management Efficiency. The hypothesis was stated as
follows:
H4c: The Joint Effect of Corporate Governance, Risk Management and Firm
Characteristics on the Management Capacity of Commercial Banks in Kenya is Not
Significant.
The regression equations were of the form:
M= β0 + β1BI + β2BS + β3CRM + β4BRM + β5LRM+ β6FS + β7FL + β8NAF+εi
The results were as presented in table 5.21 below:
Table 5.21: Regression Results of CG, Firm Characteristics, Risk Management and
Management Efficiency Variables β SE Std. β t R R
2 ∆R
2 F
Model 1a .777 .604 .586 33.755**
Constant .479 .270
1.775
Board Composition .341 .055 .430 6.158**
Board Independence 7.133 1.023 .459 6.975**
Board Size -.127 .074 -.120 -1.731
Credit Risk Mgt. .160 .144 .064 1.110
Business Risk Mgt. .003 .006 .023 .492
Liquidity Risk Mgt. -.764 .065 -.613 -11.714**
Firm Size .012 .012 .069 1.076
Leverage .243 .043 .330 5.702**
Nature of Audit Firm .081 .038 .100 2.098* Note: *p < .05, **p < .01
a. Predictors: (Constant), Board Independence, Board Size, Credit Risk Management, Business Risk Management, Liquidity Risk
Management, Firm Size, Firm Leverage, Nature of Audit Firm
b. Dependent Variable: Management Efficiency
Source: Research Findings
The results the results of the multiple linear regression computed to assess the relationship
between Corporate Governance, Risk Management, Firm Characteristics And Management
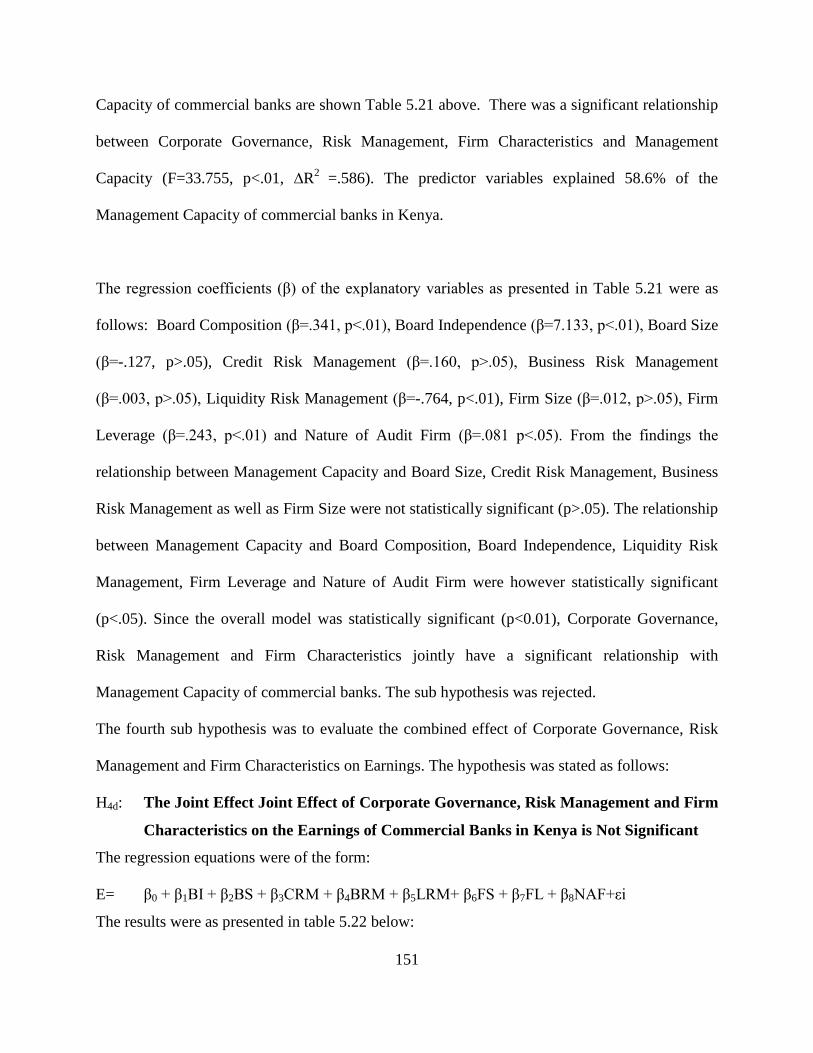
151
Capacity of commercial banks are shown Table 5.21 above. There was a significant relationship
between Corporate Governance, Risk Management, Firm Characteristics and Management
Capacity (F=33.755, p<.01, ∆R2
=.586). The predictor variables explained 58.6% of the
Management Capacity of commercial banks in Kenya.
The regression coefficients (β) of the explanatory variables as presented in Table 5.21 were as
follows: Board Composition (β=.341, p<.01), Board Independence (β=7.133, p<.01), Board Size
(β=-.127, p>.05), Credit Risk Management (β=.160, p>.05), Business Risk Management
(β=.003, p>.05), Liquidity Risk Management (β=-.764, p<.01), Firm Size (β=.012, p>.05), Firm
Leverage (β=.243, p<.01) and Nature of Audit Firm (β=.081 p<.05). From the findings the
relationship between Management Capacity and Board Size, Credit Risk Management, Business
Risk Management as well as Firm Size were not statistically significant (p>.05). The relationship
between Management Capacity and Board Composition, Board Independence, Liquidity Risk
Management, Firm Leverage and Nature of Audit Firm were however statistically significant
(p<.05). Since the overall model was statistically significant (p<0.01), Corporate Governance,
Risk Management and Firm Characteristics jointly have a significant relationship with
Management Capacity of commercial banks. The sub hypothesis was rejected.
The fourth sub hypothesis was to evaluate the combined effect of Corporate Governance, Risk
Management and Firm Characteristics on Earnings. The hypothesis was stated as follows:
H4d: The Joint Effect Joint Effect of Corporate Governance, Risk Management and Firm
Characteristics on the Earnings of Commercial Banks in Kenya is Not Significant
The regression equations were of the form:
E= β0 + β1BI + β2BS + β3CRM + β4BRM + β5LRM+ β6FS + β7FL + β8NAF+εi
The results were as presented in table 5.22 below:

152
Table 5.22: Regression Results of CG, Firm Characteristics, Risk Management and
Earnings
Variables β SE Std. β t R R2 ∆R
2 F
Model 1a .586 .343 .313 11.554**
Constant -.158 .034
-4.625**
Board Composition -.009 .007 -.115 -1.281
Board Independence -.005 .130 -.004 -.042
Board Size -.004 .009 -.042 -.468
Credit Risk Mgt -.003 .018 -.014 -.188
Business Risk Mgt .000 .001 .022 .365
Liquidity Risk Mgt -.013 .008 -.109 -1.610
Firm Size .009 .001 .496 6.025**
Leverage -.006 .005 -.087 -1.174
Nature of Audit Firm -.013 .005 -.170 -2.760* Note: *p < .05, **p < .01
a. Predictors: (Constant), Board Independence, Board Size, Credit Risk Management, Business Risk Management, Liquidity Risk Management,
Firm Size, Firm Leverage, Nature of Audit Firm
b. Dependent Variable: Earnings
Source: Research Findings
Table 5.22 above shows the results the results of the multiple linear regression computed to
assess the relationship between Corporate Governance, Risk Management, Firm Characteristics
and Earnings of commercial banks. There was a significant relationship between Corporate
Governance, Risk Management, Firm Characteristics and Earnings (F=11.554, p<.01, ∆R2
=.313). The predictor variables explained 31.3% of the Earnings of commercial banks in Kenya.
The regression coefficients (β) for Board Composition (β=,-.009 p>.05), Board Independence
(β= -.005, p>.05), Board Size (β= -.004, p>.05), Credit Management (β=-.003, p>.05), Business
Management (β=.000, p>.05), Liquidity Management (β=-.013, p>.05) and Firm Leverage (β= -
.006, p>.05) were all not statistically significant (p>.05). The β and p values of the other
explanatory variables as presented in Table 5.40 were as follows: firm size (β=.009, p<.01) and
nature of audit firm (β=-. 013 p<.05), both were statistically significant.
From the findings the relationship between Earnings and Board Composition, Board
Independence, Board Size, Credit Management, Business Management, Liquidity Management

153
and Firm Leverage were not statistically significant (p>.05). The relationship between Earnings
and Firm Size as well as Nature of Audit firm were statistically significant (p<.05). Since the
overall model was statistically significant (p<0.01), Corporate Governance, Risk Management
Firm Characteristics Jointly Have a Significant Relationship with Earnings of commercial banks.
The sub hypothesis was rejected.
The fifth sub hypothesis was to evaluate the combined effect of Corporate Governance, Risk
Management and Firm Characteristics on Liquidity. The hypothesis was stated as follows:
H4e: The Joint Effect of Corporate Governance, Risk Management and Firm
Characteristics on the Liquidity of Commercial Banks in Kenya is Not Significant.
The regression equation was of the form:
L= β0 + β1BI + β2BS + β3CRM + β4BRM + β5LRM+ β6FS + β7FL + β8NAF+εi
The results were as presented in table 5.23 below:
Table 5.23: Regression Results of CG, Firm Characteristics, Risk Management and
Liquidity
Variables β SE Std. β t R R2 ∆R
2 F
Model 1a .219 .048 .005 1.113
Constant .041 .005
7.711**
Board Composition .001 .001 .082 .754
Board Independence .001 .020 .005 .048
Board Size -.003 .001 -.212 -1.970*
Credit Risk Mgt -.003 .003 -.101 -1.137
Business Risk Mgt -3.858 .000 -.024 -.326
Liquidity Risk Mgt -.002 .001 -.106 -1.308
Firm Size .001 .000 .226 2.277*
Leverage .002 .001 .164 1.825
Nature of Audit Firm .000 .001 .031 .414 Note: *p < .05, **p < .01
a. Predictors: (Constant), Board Independence, Board Size, Credit Risk Management, Business Risk Management,
Liquidity Risk Management, Firm Size, Firm Leverage, Nature of Audit Firm

154
b. Dependent Variable: Liquidity
Source: Research Findings
Table 5.23 shows the results the results of the multiple linear regression computed to assess the
relationship between Corporate Governance, Risk Management, Firm Characteristics and
Liquidity of commercial banks. There was no significant relationship between Corporate
Governance, Risk Management, Firm Characteristics and Liquidity (F=1.113, p>.05, ∆R2
=.005).
The predictor variables explained only 0.5% of the Liquidity of commercial banks in Kenya.
The regression coefficients (β) of the explanatory variables as presented in Table 5.23 were as
follows: board Composition (β=.001, p>.05), Board Independence (β=.001, p>.05), Board Size
(β=-.003, p<.05), Credit Risk Management (β=-.003, p>.05), Business Risk Management (β=-
3.858, p>.05), Liquidity Risk Management (β=-.002, p>.05), Firm Size (β=.001, p<.05), Firm
Leverage (β= .002, p>.05) and Nature of Audit Firm (β=.000, p>.05).
From the findings the relationship between Earnings and Board Composition, Board
Independence, Credit Risk Management, Business Risk Management, Liquidity Risk
Management, Firm Leverage And Nature of Audit Firm were all not statistically significant
(p>.05). The relationship between Earnings, Board Size and Firm Size was all statistically
significant (p<.05). Since the overall model was not statistically significant (p>0.05), Corporate
Governance, Risk Management Firm Characteristics jointly have no significant relationship with
Liquidity of commercial banks. The findings fail to reject the sub hypothesis.
The sixth sub hypothesis was to evaluate the combined effect of Corporate Governance, Risk
Management and Firm Characteristics on the Composite Financial Performance (CAMEL ratio).
The hypothesis was stated as follows:

155
H4f: The Joint Effect of Corporate Governance, Risk Management and Firm
Characteristics on the Composite Financial Performance of commercial Banks in
Kenya is Not Significant
The regression equations were of the form:
FP= β0 + β1BI + β2BS + β3CRM + β4BRM + β5LRM+ β6FS + β7FL + β8NAF+εi
The results are as presented in table 5.24 below:
Table 5.24: Regression Results of CG, Firm Characteristics, Risk Management and
Composite Bank Financial Performance
(CAMEL Ratio)
Variables β SE Std. β t R R2 ∆R
2 F
Model 1a .760 .578 .559 30.315**
Constant .211 .066
3.216*
Board Composition .083 .013 .442 6.145**
Board Independence 1.862 .248 .509 7.495**
Board Size -.033 .018 -.130 -1.819
Credit Risk Mgt. .111 .035 .188 3.179*
Business Risk Mgt. .001 .001 .038 .780
Liquidity Risk Mgt. -.072 .016 -.247 -4.569**
Firm Size -.002 .003 -.038 -.569
Leverage .079 .010 .457 7.660**
Nature of Audit Firm .014 .009 .076 1.537 Note: *p < .05, **p < .01
a. Predictors: (Constant), Board Independence, Board Size, Credit Risk Management, Business Risk Management, Liquidity Risk Management,
Firm Size, Firm Leverage, Nature of Audit Firm b. Dependent Variable: CAMEL Ratio
Source: Research Findings
The results of the multiple regression analysis performed to assess the association between banks
Financial Performance (dependent variable), Firm Characteristics (moderating variable), Risk
Management (intervening variable) and Corporate Governance (independent variable) are
presented in Table 5.24 above. The findings were that there was a significant relationship
between Corporate Governance, Risk Management, Firm Characteristics and Financial

156
Performance (F=30.315, p<.01, ∆R2
=.559). The predictor variables explained 55.9% of
Financial Performance.
The regression coefficients (β) betas and p values of the explanatory variables as presented in
Table 5.24 were as follows: Board Composition (β=083, p<.01), Board Independence (β=1.862,
p<.01), Board Size (β=-.033, p>.05), Credit Risk Management (β=.111, p<.05), Business Risk
Management (β=.001, p>.05), Liquidity Risk Management (β=-.072, p<.01), Firm Size (β=-.002,
p>.05), Firm Leverage (β=.079, p<.01) and Nature Of Audit Firm(β=.014, p>.05).
From the findings the relationship between Financial Performance and Board Size, Business
Risk Management, Firm Size and Nature of Audit Firm were not statistically significant (p>.05).
The relationship between Financial Performance and Board Composition, Board Independence,
Credit Risk Management, Liquidity Risk Management as well as Firm Leverage were
statistically significant (p<.05). Since the overall model was statistically significant (p<0.01),
Corporate Governance, Risk Management and Firm Characteristics jointly have a significant
relationship with Financial Performance of commercial banks. The sub hypothesis was rejected.
5.6 Discussion of the Hypotheses Tests and Research Findings
The general objective of this study was to determine the relationships among Corporate
Governance, Risk Management, Firm Characteristics and Financial Performance of commercial
banks in Kenya. This section presents a discussion of the results the results and of test of the
hypotheses. A summary of the research findings is presented at the end.
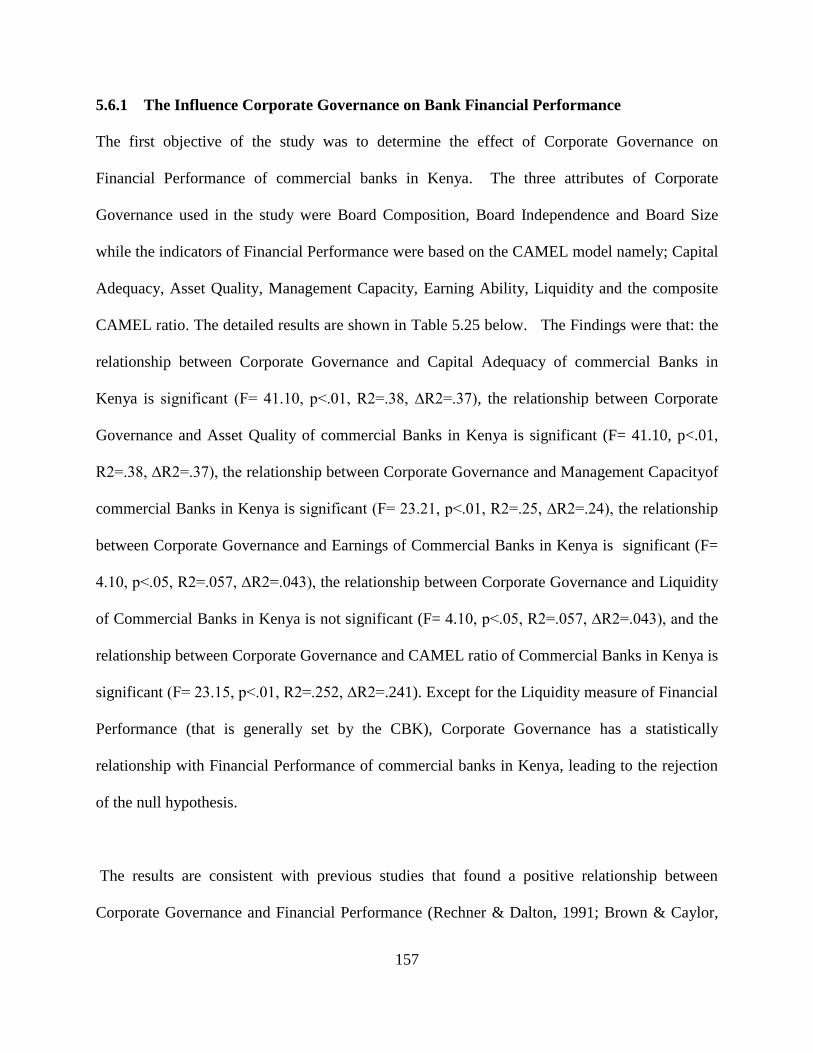
157
5.6.1 The Influence Corporate Governance on Bank Financial Performance
The first objective of the study was to determine the effect of Corporate Governance on
Financial Performance of commercial banks in Kenya. The three attributes of Corporate
Governance used in the study were Board Composition, Board Independence and Board Size
while the indicators of Financial Performance were based on the CAMEL model namely; Capital
Adequacy, Asset Quality, Management Capacity, Earning Ability, Liquidity and the composite
CAMEL ratio. The detailed results are shown in Table 5.25 below. The Findings were that: the
relationship between Corporate Governance and Capital Adequacy of commercial Banks in
Kenya is significant (F= 41.10, p<.01, R2=.38, ∆R2=.37), the relationship between Corporate
Governance and Asset Quality of commercial Banks in Kenya is significant (F= 41.10, p<.01,
R2=.38, ∆R2=.37), the relationship between Corporate Governance and Management Capacityof
commercial Banks in Kenya is significant (F= 23.21, p<.01, R2=.25, ∆R2=.24), the relationship
between Corporate Governance and Earnings of Commercial Banks in Kenya is significant (F=
4.10, p<.05, R2=.057, ∆R2=.043), the relationship between Corporate Governance and Liquidity
of Commercial Banks in Kenya is not significant (F= 4.10, p<.05, R2=.057, ∆R2=.043), and the
relationship between Corporate Governance and CAMEL ratio of Commercial Banks in Kenya is
significant (F= 23.15, p<.01, R2=.252, ∆R2=.241). Except for the Liquidity measure of Financial
Performance (that is generally set by the CBK), Corporate Governance has a statistically
relationship with Financial Performance of commercial banks in Kenya, leading to the rejection
of the null hypothesis.
The results are consistent with previous studies that found a positive relationship between
Corporate Governance and Financial Performance (Rechner & Dalton, 1991; Brown & Caylor,

158
2004; Naushad & Malik; 2015). However the results were inconsistent with past studies that
found no significant relationship between Corporate Governance and Financial Performance
(Aluchna, 2009; Klein et al., 2005) and those that found a negative relationship between
Corporate Governance and Financial Performance (Beltratti & Stulz, 2012; Erkens,et al., 2012).

159
Table 5.25: Summary of Results of Hypothesis Testing Relating to Objective One
Source: Research Findings
OBJECTIVE HYPOTHESIS SUB
HYPOTHESIS
RESULT TABLE CONCLUSION
/INTERPRETATION
To determine
the effect of
Corporate
Governance
on Financial
Performance
of
commercial
banks in
Kenya
The
Relationship
between
Corporate
Governance
and
Financial
Performance
of
commercial
Banks in
Kenya is
Not
Significant
The Relationship
between Corporate
Governance and
Capital Adequacy of
Commercial Banks in
Kenya is Not
Significant
Reject 5.1 The Relationship between
Corporate Governance
and Capital Adequacy of
Commercial Banks in
Kenya is significant
(F= 41.10, p<.01,
R2=.38, ∆R
2=.37).
The Relationship
between Corporate
Governance and Asset
Quality of
Commercial Banks in
Kenya is Not
Significant.
Reject 5.2 The Relationship between
Corporate Governance
and Asset Quality of
Commercial Banks in
Kenya is Significant
((F= 41.10, p<.01,
R2=.38, ∆R
2=.37).
The Relationship
between Corporate
Governance and
Management
Capacity of
Commercial Banks in
Kenya is Not
Significant.
Reject 5.3 The Relationship between
Corporate Governance
and Management
Capacity of Commercial
Banks in Kenya is
Significant.
(F= 23.21, p<.01, R2=.25,
∆R2=.24).
The Relationship
between Corporate
Governance and
Earnings of
Commercial Banks in
Kenya is Not
Significant.
Reject 5.4 The Relationship between
Corporate Governance
and Earnings of
Commercial Banks in
Kenya is significant
(F= 4.10, p<.05, R2=.057,
∆R2=.043).
The Relationship
between Corporate
Governance and
Liquidity of
Commercial Banks in
Kenya is Not
Significant.
Fail to
reject
5.5 The Relationship between
Corporate Governance
and Liquidity of
Commercial Banks in
Kenya is Not Significant
(F= 4.10, p<.05, R2=.057,
∆R2=.043).
The Relationship
between Corporate
Governance and
Composite Financial
Performance of
commercial Banks is
Not Significant.
Reject 5.6 The Relationship between
Corporate Governance
and CAMEL Ratio of
Commercial Banks in
Kenya is Significant.
(F= 23.15, p<.01,
R2=.252, ∆R
2=.241)

160
5.6.2 The Effect of Risk Management on the Relationship between
Corporate Governance and Bank Financial Performance
The second objective of the study was to investigate the intervening effect of Risk
Management on the relationship between Corporate Governance and bank Financial
Performance. The null hypothesis was that the relationship between Corporate
Governance and bank Financial Performance of commercial banks in Kenya was not
intervened by the Risk Management. Using the Baron and Kenny (1986) approach of
testing intervention.
The findings were as follows: the relationship between Corporate Governance and
Capital Adequacy (C) of Commercial Banks in Kenya is intervened by Risk
Management (F= 6.518, p <.05, R2=.60 , ∆R
2= .50 ); the relationship between Corporate
Governance and Asset Quality (A) of Commercial Banks in Kenya is intervened by Risk
Management (F=3.840, p <.05, R2=.036, ∆R
2= .027 ), the relationship between Corporate
Governance and Management Capacity(M) of Commercial Banks in Kenya is intervened
by Risk Management (F=6.126 ,p<.05 ,R2=.047,∆R
2=.056); the relationship between
Corporate Governance and Earnings (E) of Commercial Banks in Kenya is not Intervened
by Risk Management (F=.048 , p >.05, R2=.000, ∆R
2=-.009); the relationship between
Corporate Governance and Liquidity (L) of Commercial Banks in Kenya is not
Intervened by Risk Management (F=.044 , p>.05 , R2=.000 , ∆R
2= -.009) and finally,
the Relationship between Corporate Governance and Composite Financial Performance
(FP) of Commercial Banks in Kenya is not Intervened by Risk Management (F=.466, p
>.05, R2=. 004, ∆R
2=-.005).

161
Based on the Composite Financial Performance measure the findings were that Risk
Management did not intervene the relationship between Corporate Governance and bank
financial performance. The summary results relating to the third objective are presented
in table 5.26 below.

162
Table 5.26: Summary of Results of Hypothesis Testing Relating to Objective Two OBJECTIV
E
HYPOTHE
SIS
SUB HYPOTHESIS RESULT TABLE INTERPRETATION
To assess the
effect of
Risk
Management
on the
relationship
between
Corporate
Governance
and Financial
Performance
of
commercial
banks in
Kenya
The
Relationshi
p between
Corporate
Governance
and Capital
Adequacy
of
Commercia
l Banks in
Kenya is
Not
Intervened
by Risk
Manageme
nt.
The Relationship between
Corporate Governance and
Capital Adequacy of
Commercial Banks in
Kenya is Not Intervened by
Risk Management.
Reject 5.7 The Relationship between
Corporate Governance and
Capital Adequacy (C) of
Commercial Banks in Kenya is
Intervened by Risk Management
(F= 6.518, p <.05, R2=.60 , ∆R
2=
.50 )
The Relationship between
Corporate Governance and
Asset Quality of
Commercial Banks in
Kenya is Not Intervened by
Risk Management.
Reject 5.8 The Relationship between
Corporate Governance and Asset
Quality of Commercial Banks in
Kenya is Intervened by Risk
Management. (F=3.840, p <.05,
R2=.036, ∆R
2= .027 )
The Relationship between
Corporate Governance and
Management Capacity of
Commercial Banks in
Kenya is Not Intervened by
Risk Management.
Reject 5.9 The Relationship between
Corporate Governance and
Management Capacity (M) of
Commercial Banks in Kenya is
Intervened by Risk
Management. (F=6.126 ,p<.05
,R2=.047 , ∆R
2=.056)
The Relationship between
Corporate Governance and
Earnings (E) of Commercial
Banks in Kenya is Not
Intervened by Risk
Management.
Fail to
Reject
5.10 The Relationship between
Corporate Governance and
Earnings (E) of Commercial
Banks in Kenya is Not
Intervened by Risk
Management. (F= .048 , p >.05,
R2=.000,∆R
2=-.009)
The Relationship between
Corporate Governance and
Liquidity (L) of Commercial
Banks in Kenya is Not
Intervened by Risk
Management.
Fail to
Reject
5.11 The Relationship between
Corporate Governance and
Liquidity (L) of Commercial
Banks in Kenya is Not
Intervened by Risk
Management. (F=.044 , p>.05 ,
R2=.000 , ∆R
2= -.009)
The Relationship between
Corporate Governance and
Composite Financial
Performance (FP) of
Commercial Banks in
Kenya is Not Intervened by
Risk Management.
Fail to
Reject
5.12 The Relationship between
Corporate Governance and
Composite Financial
Performance (FP) of
Commercial Banks in Kenya is
Not Intervened by Risk
Management.
(F=.466, p >.05,R2=. 004,∆R
2=-
.005)
Source: Research Findings
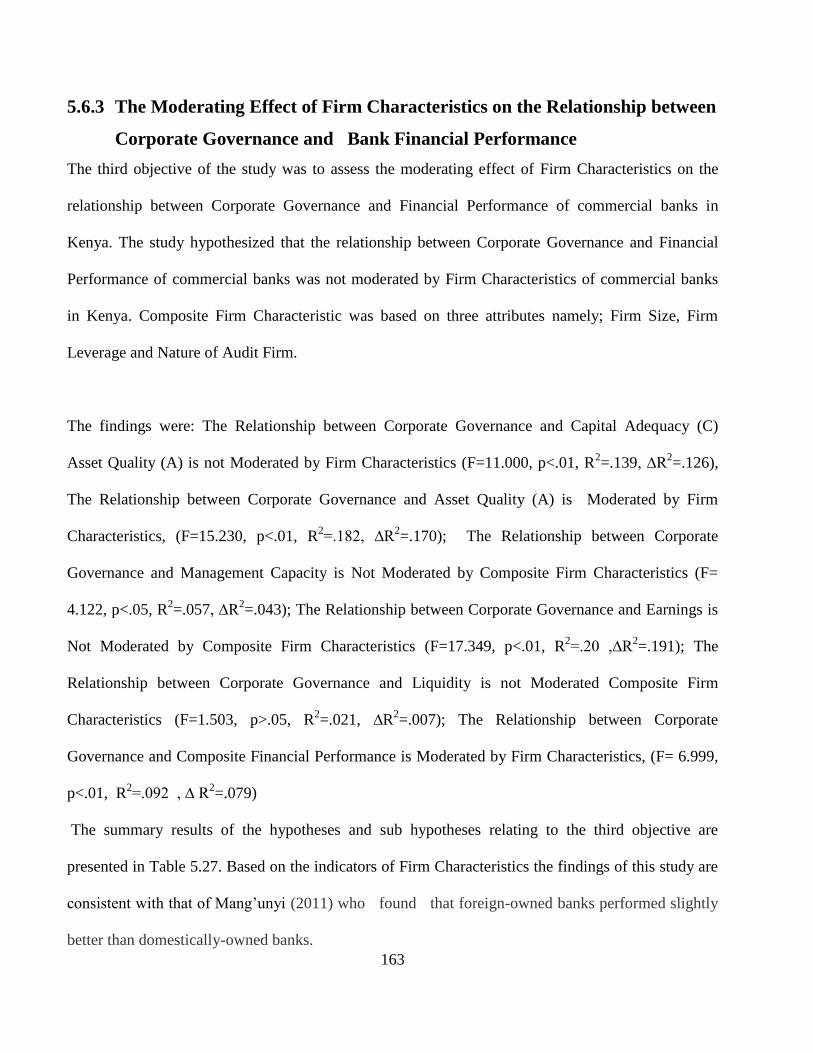
163
5.6.3 The Moderating Effect of Firm Characteristics on the Relationship between
Corporate Governance and Bank Financial Performance
The third objective of the study was to assess the moderating effect of Firm Characteristics on the
relationship between Corporate Governance and Financial Performance of commercial banks in
Kenya. The study hypothesized that the relationship between Corporate Governance and Financial
Performance of commercial banks was not moderated by Firm Characteristics of commercial banks
in Kenya. Composite Firm Characteristic was based on three attributes namely; Firm Size, Firm
Leverage and Nature of Audit Firm.
The findings were: The Relationship between Corporate Governance and Capital Adequacy (C)
Asset Quality (A) is not Moderated by Firm Characteristics (F=11.000, p<.01, R2=.139, ∆R
2=.126),
The Relationship between Corporate Governance and Asset Quality (A) is Moderated by Firm
Characteristics, (F=15.230, p<.01, R2=.182, ∆R
2=.170); The Relationship between Corporate
Governance and Management Capacity is Not Moderated by Composite Firm Characteristics (F=
4.122, p<.05, R2=.057, ∆R
2=.043); The Relationship between Corporate Governance and Earnings is
Not Moderated by Composite Firm Characteristics (F=17.349, p<.01, R2=.20 ,∆R
2=.191); The
Relationship between Corporate Governance and Liquidity is not Moderated Composite Firm
Characteristics (F=1.503, p>.05, R2=.021, ∆R
2=.007); The Relationship between Corporate
Governance and Composite Financial Performance is Moderated by Firm Characteristics, (F= 6.999,
p<.01, R2=.092 , ∆ R
2=.079)
The summary results of the hypotheses and sub hypotheses relating to the third objective are
presented in Table 5.27. Based on the indicators of Firm Characteristics the findings of this study are
consistent with that of Mang‟unyi (2011) who found that foreign-owned banks performed slightly
better than domestically-owned banks.

164
Table 5.27: Summary of Results of Hypothesis Testing Relating to Objective Three
Source: Research Findings
OBJECTIVE HYPOTHESIS SUB HYPOTHESIS RESULT TABLE INTERPRETATION
The investigate
the effect of
Firm
Characteristics
on the
relationship
between
Corporate
Governance and
Financial
Performance of
commercial
bank in Kenya
The Relationship
between
Corporate
Governance and
Bank Financial
Performance is
Not Moderated
by Firm
Characteristics.
The Relationship
between Corporate
Governance and
Capital Adequacy (C)
Asset Quality (A) is
Not Moderated by
Firm Characteristics
(FC)
Fail to
Reject
5.13 The Relationship between
Corporate Governance and
Capital Adequacy (C)
Asset Quality (A) is Not
Moderated by Firm
Characteristics (FC)
(F=11.000, p<.01, R2=.139
, ∆ R2=.126)
The Relationship
between Corporate
Governance and Asset
Quality is Not
Moderated by Firm
Characteristics (FC)
Reject 5.14 The Relationship between
Corporate Governance and
Asset Quality is Moderated
by Firm Characteristics
(FC)
(F=15.230, p<.01, R2=.182
, ∆ R2=.170)
The Relationship
between Corporate
Governance and
Management
Capacity is Not
Moderated by
Composite Firm
Characteristics
Fail to
Reject
5.15 The Relationship between
Corporate Governance and
Management Capacity is
Not Moderated by
Composite Firm
Characteristics
(F= 4.122, p<.05, R2=.057
, ∆ R2=.043)
The Relationship
between Corporate
Governance and
Earnings is Not
Moderated by
Composite Firm
Characteristics
Fail to
Reject
5.16 The Relationship between
Corporate Governance and
Earnings is Not Moderated
by Composite Firm
Characteristics
(F=17.349, p<.01 , R2=.20
,∆ R2=.191)
The Relationship
between Corporate
Governance and
Liquidity is Not
Moderated Composite
Firm Characteristics
Fail to
Reject
5.17 The Relationship between
Corporate Governance and
Liquidity is Not Moderated
Composite Firm
Characteristics
(F=1.503, p>.05, R2=.021 ,
∆ R2=.007)
The Relationship
between Corporate
Governance and
Composite Financial
Performance is Not
Moderated by Firm
Characteristics
Reject 5.18 The Relationship between
Corporate Governance and
Composite Financial
Performance is Moderated
by Firm Characteristics
(F= 6.999, p<.01, R2=.092 ,
∆ R2=.079)

165
5.6.4 Joint Effect of Corporate Governance, Risk Management and Firm
Characteristics on Bank Financial Performance
The last objective of the study was to establish the joint effect Corporate Governance,
Risk Management and Firm Characteristics on bank financial performance. The
prediction of the study was that the joint effect Corporate Governance, Risk Management
and Firm Characteristics on bank Financial Performance in Kenya was not significant.
The findings of the study were that except for the liquidity measure the joint effect of
Corporate Governance, Risk Management and firm characteristic on Financial
Performance measures as well as the composite measure were statistically significant.
The summary results of the hypotheses and sub hypotheses relating to the fourth
objective are presented in Table 5.28
The findings are consistent with that of Tandelilin et al. (2007) who investigated the
relationships among Corporate Governance, Risk Management, and bank performance in
Indonesian banking sector. The study examined whether the type of ownership had a
moderating effect on these relationships, and whether ownership structure was a key
determinant of Corporate Governance. The study found that the relationships between
Corporate Governance and Risk Management and between Corporate Governance and
bank performance were sensitive to the type of bank ownership. They also found that
state-owned banks underperformed the other types of bank ownership in implementing
good Corporate Governance. This study also found an interrelationship between Risk
Management and bank performance.

166
Table 5.28: Summary of Results of Hypothesis Testing Relating to Objective Four
Source: Research Findings
OBJECTIVE HYPOTHESIS SUB HYPOTHESIS RESULT TABLE INTERPRETATION
To evaluate
the joint effect
of Corporate
Governance,
Risk
Management
and Firm
Characteristics
on the
financial
performances
of commercial
bank in Kenya
The Joint Effect
of Corporate
Governance,
Risk
Management
and Firm
Characteristics
on the Financial
Performance of
commercial
Banks in Kenya
is Not
Significant
The Joint Effect of
Corporate Governance,
Risk Management and
Firm Characteristics on
the Capital Adequacy of
Commercial Banks in
Kenya is Not Significant.
Reject 5.19 The Joint Effect of Corporate Governance,
Risk Management and Firm Characteristics
on the Capital Adequacy of Commercial
Banks in Kenya is Significant.
(F=99.262, p<.01 , R2=.818 , ∆R2=.810 )
The Joint Effect of
Corporate Governance,
Risk Management and
Firm Characteristics on
the Asset Quality of
Commercial Banks in
Kenya is Not Significant.
Reject 5.20 The Joint Effect of Corporate Governance,
Risk Management and Firm Characteristics
on the Asset Quality of Commercial Banks
in Kenya is Significant.
(F=65.859 , p<.01 , R2=.749 , ∆R2=.737 )
The Joint Effect of
Corporate Governance,
Risk Management and
Firm Characteristics on
the Management
Capacity of Commercial
Banks in Kenya is Not
Significant.
Reject 5.21 The Joint Effect of Corporate Governance,
Risk Management and Firm Characteristics
on the Management Capacity of
Commercial Banks in Kenya is Significant.
(F=33.755 , p<.01 , R2=.604, ∆R2=.586 )
The Joint Effect Joint
Effect of Corporate
Governance, Risk
Management and Firm
Characteristics on the
Earnings of Commercial
Banks in Kenya is Not
Significant
Reject 5.22 The Joint Effect Joint Effect of Corporate
Governance, Risk Management and Firm
Characteristics on the Earnings of
Commercial Banks in Kenya is Significant
(F=11.554, p<.01 , R2=.343 , ∆R2=.313)
The Joint Effect of
Corporate Governance,
Risk Management and
Firm Characteristics on
the Liquidity of
Commercial Banks in
Kenya is Not Significant.
Failed to
Reject
5.23 The Joint Effect of Corporate Governance,
Risk Management and Firm Characteristics
on the Liquidity of Commercial Banks in
Kenya is Not Significant.
(F=1.113 , p>.05 , R2=.048 ,
∆R2=.005 )
The Joint Effect of
Corporate Governance,
Risk Management and
Firm Characteristics on
the Composite Financial
Performance of
commercial Banks in
Kenya is Not Significant
Reject 5..24 The Joint Effect of Corporate Governance,
Risk Management and Firm Characteristics
on the Composite Financial Performance
of commercial Banks in Kenya is
Significant
(F=30.315, p<.01 , R2=.578 , ∆R2=.559 )

166
5.7 Summary of Research Findings
This chapter has presented the testing of the four hypotheses of the study as well as discussion of
the findings. The null hypotheses were tested using the inferential statistics of both correlation as
well as regression analysis. Using the composite measures, the findings of the study failed to
reject hypothesis two, however it rejected null hypotheses one, three and four.
The first hypothesis (H1) investigated the relationship between Corporate Governance and
Financial Performance of commercial banks in Kenya. The results of hierarchical multiple
regression analysis were that there was a statistically significant relationship (p<.05) between
Corporate Governance and all the attributes Financial Performance except Liquidity. Further,
there was a statistically significant relationship (p<.05) between Corporate Governance and the
composite measures of Financial Performance (CAMEL ratio). In general it can be concluded
that there is a statistically significant relationship between Corporate Governance and bank
Financial Performance, thus null hypothesis one was rejected.
Hypothesis two (H2) investigated the intervening effect of Risk Management on the relationship
between Corporate Governance and Financial Performance of commercial banks in Kenya. The
findings were Risk Management intervened the relationship between Corporate Governance and
Capital Adequacy; Corporate Governance and Asset Quality as well Corporate Governance and
Management Efficiency. However, Risk Management did not moderate the relationships
between Corporate Governance and Earnings, Corporate Governance and Liquidity as well as
Corporate Governance and the Composite Financial Performance (CAMEL ratio). Given the
mixed findings between some of the attributes and the composite Financial Performance
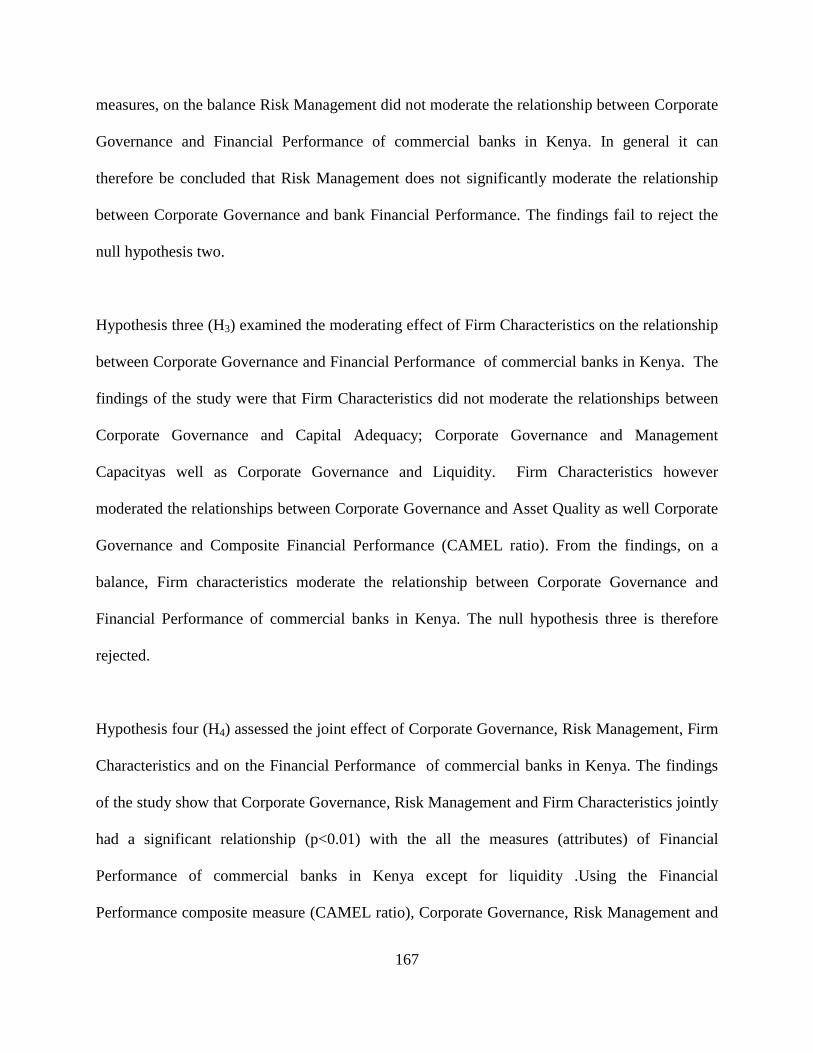
167
measures, on the balance Risk Management did not moderate the relationship between Corporate
Governance and Financial Performance of commercial banks in Kenya. In general it can
therefore be concluded that Risk Management does not significantly moderate the relationship
between Corporate Governance and bank Financial Performance. The findings fail to reject the
null hypothesis two.
Hypothesis three (H3) examined the moderating effect of Firm Characteristics on the relationship
between Corporate Governance and Financial Performance of commercial banks in Kenya. The
findings of the study were that Firm Characteristics did not moderate the relationships between
Corporate Governance and Capital Adequacy; Corporate Governance and Management
Capacityas well as Corporate Governance and Liquidity. Firm Characteristics however
moderated the relationships between Corporate Governance and Asset Quality as well Corporate
Governance and Composite Financial Performance (CAMEL ratio). From the findings, on a
balance, Firm characteristics moderate the relationship between Corporate Governance and
Financial Performance of commercial banks in Kenya. The null hypothesis three is therefore
rejected.
Hypothesis four (H4) assessed the joint effect of Corporate Governance, Risk Management, Firm
Characteristics and on the Financial Performance of commercial banks in Kenya. The findings
of the study show that Corporate Governance, Risk Management and Firm Characteristics jointly
had a significant relationship (p<0.01) with the all the measures (attributes) of Financial
Performance of commercial banks in Kenya except for liquidity .Using the Financial
Performance composite measure (CAMEL ratio), Corporate Governance, Risk Management and
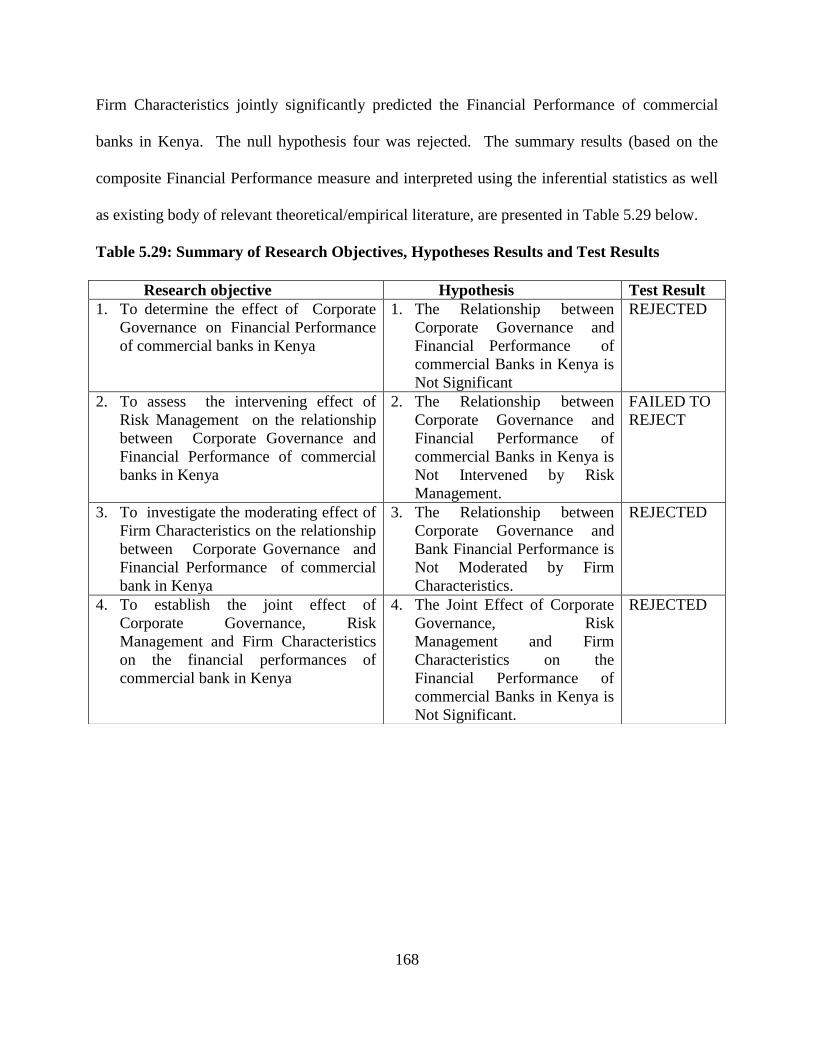
168
Firm Characteristics jointly significantly predicted the Financial Performance of commercial
banks in Kenya. The null hypothesis four was rejected. The summary results (based on the
composite Financial Performance measure and interpreted using the inferential statistics as well
as existing body of relevant theoretical/empirical literature, are presented in Table 5.29 below.
Table 5.29: Summary of Research Objectives, Hypotheses Results and Test Results
Research objective Hypothesis Test Result
1. To determine the effect of Corporate
Governance on Financial Performance
of commercial banks in Kenya
1. The Relationship between
Corporate Governance and
Financial Performance of
commercial Banks in Kenya is
Not Significant
REJECTED
2. To assess the intervening effect of
Risk Management on the relationship
between Corporate Governance and
Financial Performance of commercial
banks in Kenya
2. The Relationship between
Corporate Governance and
Financial Performance of
commercial Banks in Kenya is
Not Intervened by Risk
Management.
FAILED TO
REJECT
3. To investigate the moderating effect of
Firm Characteristics on the relationship
between Corporate Governance and
Financial Performance of commercial
bank in Kenya
3. The Relationship between
Corporate Governance and
Bank Financial Performance is
Not Moderated by Firm
Characteristics.
REJECTED
4. To establish the joint effect of
Corporate Governance, Risk
Management and Firm Characteristics
on the financial performances of
commercial bank in Kenya
4. The Joint Effect of Corporate
Governance, Risk
Management and Firm
Characteristics on the
Financial Performance of
commercial Banks in Kenya is
Not Significant.
REJECTED

166
CHAPTER SIX
SUMMARY, CONCLUSIONS AND RECOMMENDATIONS
6.1 Introduction
The objective of the study was to establish the relationship among Corporate
Governance, Risk Management, Firm Characteristics and Financial Performance of
commercial banks in Kenya. Four hypotheses were tested to achieve the objective. This
chapter presents a summary of findings from the hypothesis testing, conclusion from the
findings and the contribution of the study to knowledge, policy and practice. The
limitations of the study are presented and finally the suggestions for future research
recommended.
6.2 Summary
The main objective of the study was to investigate the relationships among Corporate
Governance, Risk Management, and Firm Characteristics on the Financial Performance
of commercial banks in Kenya. To discharge the objective, four categories of the study
variables were adopted. The variables were the independent (Corporate Governance), the
intervening (Risk Management), the moderating (Firm Characteristics) and the dependent
(bank Financial Performance). The independent variable had three attributes namely
board size, board composition and board independence, the mediating variable also three
attributes namely Credit Risk Management, Liquidity Risk Management and Business
Risk Management. The moderating variable had three attributes namely Size, Leverage
and Nature of Audit Firm while the dependent variable was based on the CAMEL model
with five attributes namely; Capital Adequacy, Asset Quality, Management Capacity,

167
Earnings and Leverage. Based on the attributes the CAMEL ratio was computed as a
geometric mean of the five variables to provide the composite Financial Performance
ratio.
The study was guided by the Agency Theory proposes that the separation of ownership
from control leads to an agency problem whereby management operates the firm aligning
with their own interests, not those of shareholders. Agency relationships in commercial
banks create opportunities for managers to spend firm resources maximizing their utilities
rather than maximizing the shareholders wealth. The study was based on the positivism
research philosophy since there was evidence of formal propositions, quantifiable
measures of variables, hypothesis testing, and the drawing of inferences about the
relationships among the study variables. The study adopted a longitudinal descriptive
design as there were clearly stated hypotheses and investigative questions. The
population of the study consisted of all the forty three (43) commercial banks registered
in Kenya as at December 31, 2014.
Secondary data was be collected from the annual reports and accounts of the commercial
banks as well as the CBK Bank Supervision and Banking Sector Reports, Descriptive
measures of the data involved mean, maximum, minimum, standard error of estimate,
skewness and kurtosis. The diagnostic tests done on the data included linearity,
multivariate normality, multicollinearity, independence and homoscedasticity. The
correlation analysis, multiple (hierarchical) regression analysis and the Baron and Kenny
168
(1986) approach for testing intervention and moderation were used in the hypothesis
testing.
The first objective was to determine the effect of Corporate Governance on Financial
Performance of commercial banks in Kenya. The study established that a statistically
significant relationship exist between Corporate Governance and bank Financial
Performance attributes except for Liquidity .The second objective was to assess the effect
of Risk Management on the relationship between Corporate Governance and Financial
Performance of commercial banks in Kenya. It was established that Risk Management
intervened the relationships between Corporate Governance and Capital Adequacy;
Corporate Governance and Asset Quality as well Corporate Governance and
Management Efficiency. However, Risk Management did not intervene the relationships
between Corporate Governance and Earnings, Corporate Governance and Liquidity as
well as Corporate Governance and the Composite Financial Performance (CAMEL ratio).
Based on the composite measures Risk Management did not intervene the relationship
between Corporate Governance and bank Financial Performance.
The third objective was to investigate the effect of Firm Characteristics on the
relationship between Corporate Governance and Financial Performance of commercial
bank in Kenya. The findings were that Firm Characteristics moderated the relationships
between Corporate Governance. The fourth objective was to evaluate the joint effect of
Corporate Governance, Risk Management and Firm Characteristics on the bank financial
performances of commercial bank in Kenya. The study found that Corporate Governance,

169
Risk Management, Firm Characteristics jointly significantly predicted bank financial
performance.
6.3 Conclusions
The study concludes that Corporate Governance affects bank Financial Performance;
Risk Management did not influence the relationship between Corporate Governance and
bank Financial; Firm Characteristics had an effect on the relationship between Corporate
Governance and bank Financial Performance and finally Corporate Governance, Risk
Management and Firm Characteristics jointly affected bank Financial Performance. The
study concludes that Corporate Governance significantly influences bank Financial
Performance of commercial banks. The implication is that Corporate Governance is a key
driver on bank Financial Performance.
The study concludes that Risk Management does not intervenes the relationship between
Corporate Governance and bank Financial Performance. Whereas Corporate Governance,
in isolation, significantly affect bank Financial Performance, when intervened by Risk
Management, there is an insignificant relationship. The implication of this conclusion is
that the Risk Management committees of the board may not be very effective in
influencing the corporate risk management practices adopted within the commercial
banks, however the overall board of directors appear to be effective in ensuring
commercial bank maximize shareholders wealth.

170
The study concludes that Firm Characteristics moderated the relationships between
Corporate Governance and Asset Quality as well Corporate Governance and Composite
Financial Performance (CAMEL ratio). Firm Characteristics however did not moderate
the relationships between Corporate Governance and Capital Adequacy; Corporate
Governance and Management Capacity as well as Corporate Governance and Liquidity.
The implication is that commercial banks need to seek optimal levels of the individual
Firm Characteristics like Size, Leverage and Audit Firms that that ensure effective and
efficient planning, investing, financing and operating activities that translate into
performance.
Finally Corporate Governance, Risk Management and Firm Characteristics jointly predict
bank Financial Performance. Commercial banks with good Corporate Governance,
efficient Risk Management and optimal Firm Characteristics perform well financially.
The implication of this is that when board of directors and corporate make optimal
decisions, corporate entities tend to perform better.
6.4.1 Contributions of the Study
The findings of this study makes several contributions to knowledge on Corporate
Governance, Risk Management, Firm Characteristics and bank Financial Performance.
Further it has several implications for board of directors, corporate management, bank
regulators and the investors. Finally it makes significant contribution to the Agency
theory by showing interaction mechanisms among the variables. The contribution of the
study to existing knowledge is discussed in the first section then contribution to policy

171
and practice articulated in the next section, finally contribution to theory in the last
section.
6.4.1 Contribution to Knowledge
The findings of this study adds to the existing body of knowledge on Corporate
Governance, Risk Management, Firm Characteristics and bank Financial Performance.
The major contribution of the study is that Corporate Governance, Risk Management,
Risk Management jointly predict bank financial performance. Some previous studies
have evaluated the relationships among Corporate Governance, Risk Management, Firm
Characteristics and Financial Performance (Rogers, 2006; Tandelilin et al., 2007).
However the attributes of the four variables used in these previous studies were different,
results contradictory and inconclusive.
A second major contribution of the study was the use of the CAMEL model to assess the
influence of the explanatory variables on the five attributes of bank Financial
Performance and the composite Financial Performance (CAMEL ratio). Previous studies
have used only one indicator of Financial Performance mainly profitability/earnings,
Tobins q and Sharpe ratio (Rechner & Dalton, 1991; Brown & Caylor, 2004; Aluchna
2009; Erkens et al., 2012, Naushad & Malik, 2015). The CAMEL model is the most
widely used Financial Performance tool for financial institutions including commercial
banks around the world. This study adopted the CAMEL model to evaluate the Financial
Performance of commercial banks in Kenya as opposed to conventional Financial
Performance measure of earnings/profitability.
172
A third contribution of the study was to evaluate the intervening effect of Risk
Management on the relationship between Corporate Governance and bank Financial
Performance. The direct effect of Risk Management on Financial Performance has been
evaluated by a number of past studies (Hakim & Neamie, 2001; Ellul & Yerramilli, 2013;
Ndung‟u, 2013; Adeusi et al., 2014). Other studies have assessed the direct effect of
Corporate Governance on Financial Performance (Rechner & Dalton, 1991; Brown &
Caylor, 2004; Aluchna, 2009; Beltratti & Stulz, 2012; Erkens et al., 2012, Naushad &
Malik, 2015; Love & Rachinsky, 2015). The findings of these previous studies have
been not only contradictory but also inconclusive. This study sheds light by evaluating
the intervening effect of Risk Management on the relationship between Corporate
Governance and financial performance. Given that the Baron and Kenny approach was
used in the analysis, both the direct intervening effects were evaluated.
A forth contribution of the study was to establish the moderating effect of Firm
Characteristics on the relationship between Corporate Governance and bank Financial
Performance. Some previous studies have evaluated the effect of institutional
characteristics on Financial Performance (Boateng, Huang & Kufuor, 2015; Phuong et
al., 2015; Olweny & Shipho, 2011). Others have evaluated the moderating effect of Firm
Characteristics on the relationship between Corporate Governance and firm performance
(Klein et al., 2005; Mang‟unyi, 2011). The findings were however contradictory and
inconclusive. This study provides additional contribution by assessing the moderating
effect of Firm Characteristics on different attributes of bank Financial Performance as
well as the composite measure (CAMEL ratio). Since the findings based on some of the

173
attributes and composite measure were contradictory, it may help resolve the findings of
the previous studies.
Finally the study has provided evidence to resolve the contradictory findings on the
previous studies done on the relationships between Corporate Governance and Financial
Performance. The relationship may not be direct but either intervened/moderated by Risk
Management depending on the attributes used in the study. These findings can help
resolve the contradictory findings from previous studies on the relationship between
Corporate Governance and Firm Performance. Whereas some studies found a positive
relationship (Rechner & Dalton, 1991; Brown & Caylor, 2004; Naushad & Malik; 2015)
others found a negative relationship (Beltratti & Stulz, 2012; Erkens et al., 2012) yet
another study found no significant relationship (Aluchna, 2009). The current study also
finds a statistically significant relationship between Corporate Governance and all
attributes of bank Financial Performance (except Liquidity). The current study finds that
the effect of Corporate Governance on bank Financial Performance can be understood by
evaluating the intervening and moderating effects of Risk Management and Firm
Characteristics respectively.
6.4.2 Contributions to Policy and Practice
The findings of this study has several contributions to board of directors, corporate
managers, regulators, depositors and investors in general. The effect of Corporate
Governance on bank Financial Performance as found in the current study has implication
to board of directors. The fact that a relationship exist between Corporate Governance

174
and bank Financial Performance shows that board oversight activities directly impact on
bank Financial Performance. There is the need for corporate Governance
principles/mechanisms to be improved to enhance bank Financial Performance. Bank
boards that are properly constituted translates into better bottom line, Financial
Performance. Effective Corporate Governance, through board committees, and efficient
corporate management aligned the interest of the agents with those of the principal
(shareholders).
The study assist corporate management to appreciate the linkages between board
activities, management function and bank Financial Performance. The fact that risk
management does not intervene the relationship between Corporate Governance and bank
Financial Performance could be an indicator that Risk Management committees of the
board do not have a significant impact of corporate Risk Management. There could
therefore be need to re-evaluate the composition, size and independence of the Risk
Management committees to align them with corporate risk management function.
Regulators like Central Bank of Kenya and Capital Market Authority (CMA) may use the
findings of this study when undertaking their supervisory role and issuance of prudential
guidelines on Corporate Governance. Prudential Corporate Governance guidelines and
bank supervision by the regulators should the tightened to ensure effective Risk
Management of banks and improved Financial Performance. Given the cases of reported
malpractices in banking institutions, the regulators should tighten the regulatory
framework to align all bank activities with better Financial Performance.

175
The findings of this study will be beneficial to investors in bank debt and equity
instruments who bear risks when banks fail to perform as per contractual obligations.
Depositors in banks face inconveniences and losses whenever weak Corporate
Governance and poor Risk Management leads to losses, statutory management and
finally bankruptcy. This study shows the linkage between Corporate Governance
mechanisms, Risk Management and proper Firm Characteristics translates to better bank
Financial Performance that benefits all stakeholders.
6.4.3 Contribution to Theory
The current study was guided by the positivism research philosophy intended to
empirically test hypotheses to either validate or falsify existing theories in the discipline.
The findings of the study makes contribution to theory by revealing the linkages among
the variables. Agency theory (Jensen and Mecling, 1976) used to understand the
relationships between agents and principals. The agent (in this case directors and
Managers) represents the principal (in this case shareholders) in a particular business
transaction (oversight and Management) and is expected to represent the best interests of
the principal (enhancing firm value through financial performance) without regard to
personal interests.
The Agency problem occurs when the interests of a principal and agent (Corporate
Governance and Risk Management) are in conflict. Banks must seek ways minimizing
situations of conflict between Corporate Governance and Risk Management as well as
Risk Management and Bank Financial Performance through solid corporate policy. Since
Risk Management does not intervene the relationship between Corporate Governance and
176
Bank Financial Performance, the study provides support to agency problems among
commercial banks in Kenya. As a theoretical contribution, incentives through regulation
and monitoring, should be provided to managers‟ redirect their behaviour (Risk
Management) to realign these interests with the principal‟s. Bank manager must have
incentives encouraging them to act in unison with the principal's interests. Further
Corporate Governance mechanisms in terms of board composition, board size and board
independence of commercial banks are aligned to shareholders interests.
6.5 Limitations of the Study
Precautions were taken to deal with limitations cited here below, as with every research it
is never possible to eliminate them. The study used secondary data sourced from the
CBK Bank Annual Supervisory Reports and annual reports of the commercial banks.
These are general purpose reports and any limitations in the reliability of the data
reported therein could affect the reliability of the results.
The study adopted a descriptive research design since it had clearly stated hypotheses or
investigative questions. The design however has the disadvantage that it cannot establish
causality among variables. Thus while the study could establish the direction and nature
of relationships among variables, it could not establish the causality effects among the
variables.
The study used three attributes of Corporate Governance and three attributes of Risk
Management due to sensitivity/confidentiality of information. The findings of this study
are limited to the attributes used in the study. There are other attributes of the variables
that could potentially have an influence on the relationships tested, but could not be
177
availed by the researcher due to sensitivity/confidentiality of such information by
commercial banks.
6.6 Suggestions for Future Research
Arising from the findings and limitations of this study a number of suggestions can be
made for future research. Further research could be conducted introduce more or different
variables for testing both moderation and intervening effect mediating effect of Corporate
Governance on bank Financial Performance. Secondly the current study used quantitative
measures of performance, bank Financial Performance. A similar study could be
conducted based both qualitative and quantitative measures performance. This could
further widen the scope of the current study.
The focus of the current study were commercial banks in Kenya. A similar study could be
replicated for other financial institutions in like insurance companies, housing finance
companies, microfinance institutions and foreign exchange bureaus. Finally the study
could be replicated in other countries regionally and internationally. This would further
validate the findings of the current and future studies

178
REFERENCES
Abate, S. (2014). The impact of Corporate Governance mechanisms on Risk
Management: Evidence from commercial banks in Ethiopia. Journal of Banking
and Financial Research, 1(2), 1-21.
Adams, G. R., & Schvaneveldt, J. D. (1991). Understanding Research Methods, 2e,
Longman Publishing Group.
Adeusi, S. O., Akeke, N. I., Adebisi, O. S., & Oladunjoye, O. (2014). Risk Management
and Financial Performance of Banks in Nigeria. European Journal of Business
and Management, 6(31), 336-342.
Aebi, V., Sabato, G., & Schmid, M. (2012). Risk Management, Corporate Governance,
and bank performance in the financial crisis. Journal of Banking & Finance,
36(12), 3213-3226.
Akhtaruddin, M., Hossain, M. A., Hossain, M., & Yao, L. (2009). Corporate Governance
and voluntary disclosure in corporate annual reports of Malaysian listed firms.
Journal of Applied Management Accounting Research, 7(1), 1-19.
Aluchna, M. (2009). Does good Corporate Governance matter? Best practice in Poland.
Management Research News, 32(2), 185-198.
Anderson, T.W. and Darling, D.A. (1954). A Test of Goodness of Fit. Journal of the
American Statistical Association, 49(268), 765-769.
Baron, R. M., & Kenny, D. A. (1986). The moderator–mediator variable distinction in
social psychological research: Conceptual, strategic, and statistical
considerations. Journal of Personality and Social Psychology, 51(6), 1173.
Barker, D., & Holdsworth, D. (1993). The causes of bank failures in the 1980s (No.
9325).
Bhagat, S., & Black, B. S. (2002). The non-correlation between board independence and
long-term firm performance. Journal of Corporation Law, 27, 231-273.
Bhaskar, R. (2014). The possibility of naturalism: A philosophical critique of the
contemporary human sciences. Routledge.

179
Bhattacherjee, A. (2012). Social science research: principles, methods, and practices
(retrieved from http://scholarcommons.usf.edu/cgi/viewcontent.cgi?article
=1002&context=oa_textbooks)
Bauwhede, H. V., & Willekens, M. (2008). Disclosure on corporate governance in the
European Union. Corporate Governance: An International Review, 16(2), 101-
115.
Black, B. S., Jang, H., & Kim, W. (2006). Does corporate governance predict firms'
market values? Evidence from Korea. Journal of Law, Economics, and
Organization, 22(2), 366-413.
Beasley, M. S., Clune, R., & Hermanson, D. R. (2005). Enterprise Risk Management: An
empirical analysis of factors associated with the extent of implementation.
Journal of Accounting and Public Policy, 24(6), 521-531.
Beltratti, A., & Stulz, R. M. (2012). The credit crisis around the globe: Why did some
banks perform better? Journal of Financial Economics, 105(1), 1-17.
Brinkmann, E. J., & Horvitz, P. M. (1995). Risk-based capital standards and the credit
crunch. Journal of Money, Credit and Banking, 848-863.
Brown, L. D., & Caylor, M. L. (2004). Corporate Governance study: the correlation
between Corporate Governance and company performance. Corporate
Governance Study, Institutional Shareholder Services.
Boateng, A., Huang, W., & Kufuor, N. K. (2015). Commercial bank ownership and
performance in China. Applied Economics, (ahead-of-print), 1-17.
Burns, N., & Grove, S. K. (2010). Understanding nursing research: Building an
evidence-based practice. Elsevier Health Sciences.
Chantapong, S. (2005). Comparative study of domestic and foreign bank performance in
Thailand: The regression analysis. Economic Change and Restructuring, 38(1),
63-83.
Central Bank of Kenya (CBK). 2011. Bank Supervision Annual Report 2010, Accessed
from www.cbk.co.ke.
Central Bank of Kenya (CBK). 2012. Bank Supervision Annual Report 2011, Accessed
from www.cbk.co.ke.
180
Central Bank of Kenya (CBK). 2013. Bank Supervision Annual Report 2012, Accessed
from www.cbk.co.ke.
Central Bank of Kenya (CBK). 2014. Bank Supervision Annual Report 2013, Accessed
from www.cbk.co.ke.
Central Bank of Kenya (CBK). 2015. Bank Supervision Annual Report 2014, Accessed
from www.cbk.co.ke.
Cherryholmes, C. H. (1992). Notes on pragmatism and scientific realism. Educational
researcher, 21(6), 13-17.
Cole, R. A., & Gunther, J. W. (1998). Predicting bank failures: A comparison of on-and
off-site monitoring systems. Journal of Financial Services Research, 13(2), 103-
117.
Collis, J. & Hussey, R. (2009) Business Research: A practical guide for undergraduate
and postgraduate students. (3rd
Ed.) Basingstoke: Palgrave Macmillan
Cornell, B., & Shapiro, A. C. (1987). Corporate stakeholders and corporate finance.
Financial Management, 5-14.
Cooper, R.D & Schindler P. (2003). Business Research Methods, Tata McGraw-Hill
Publishing Company, 8th
Edition.
Council, A. C. G. (2007). Corporate Governance principles and recommendations.
Creswell, J. W. (2013). Research design: Qualitative, quantitative, and mixed methods
approaches. Sage publications. (Retrieved from http://www.ceil-
conicet.gov.ar/wp-content/uploads/2015/10/Creswell-Cap-10.pdf))
Cumming, C., & Hirtle, B. (2001). The challenges of Risk Management in diversified
financial companies. Journal of Financial Transformation, 3, 89-95.
Cyert, R. M., & March, J. G. (1963). A behavioural theory of the firm. Englewood Cliffs,
NJ, 2.
Dao, B. T., & Giang, H. T. H. (2012). Corporate Governance and Performance in
Vietnamese Commercial Banks. Journal of Economics & Development, 14(2),
72-95.
Davis, J. H., Schoorman, F. D., & Donaldson, L. (1997). Toward a stewardship theory of
management. Academy of Management review, 22(1), 20-47.
181
Dobson, P. (2002). Critical realism and information systems research: why bother with
philosophy?
Donaldson, L. (1990). The ethereal hand: Organizational economics and management
theory. Academy of Management Review, 15(3), 369-381.
Donaldson, L., & Davis, J. H. (1991). Stewardship theory or agency theory: CEO
governance and shareholder returns. Australian Journal of Management, 16(1),
49-64.
Ellul, A., & Yerramilli, V. (2013). Stronger risk controls, lower risk: Evidence from US
bank holding companies. The Journal of Finance, 68(5), 1757-1803.
Eng, L. L., & Mak, Y. T. (2003). Corporate governance and voluntary disclosure. Journal
of accounting and public policy, 22(4), 325-345.
Erkens, D. H., Hung, M., & Matos, P., (2012).Corporate Governance in the 2007–2008
Financial crisis: Evidence from financial institutions worldwide. Journal of
Corporate Finance, 8(2), 389-411.
Fosberg, R. H. (1989). Outside directors and managerial monitoring. Akron Business and
Economic Review, 20(2), 24.
Freeman, R. E. (1989). Divergent stakeholder theory. Academy of Management Review,
24(2), 33-236.
Government of Kenya (2004). The Companies Act: Cap 486. Nairobi. CBK
Government of Kenya (2004). The Banking Act: Cap 488. Nairobi. CBK
Government of Kenya (2004). The Central Bank Act: Cap 489. Nairobi. CBK
Government of Kenya (2006). Prudential Guidelines. Nairobi. CBK
Hakim, S and Neami, S. (2001). Performance and Credit Risk in Banking: A
Comparative Study of Egypt and Lebanon, ERF Working Paper Series,
Working Paper 0137.
Heracleous, L. (2001). What is the impact of Corporate Governance on organizational
performance? Corporate Governance: An International Review, 9(3), 165-173.
Himmelberg, C. P., Hubbard, R. G., & Palia, D. (1999). Understanding the determinants
of managerial ownership and the link between ownership and performance.
Journal of financial economics, 53(3), 353-384.

182
Jiang, C., Feng, G., & Zhang, J. (2012). Corporate governance and bank performance in
China. Journal of Chinese Economic and Business Studies, 10(2), 131-146.
Jensen, M. C. (1993).The modern industrial revolution, exit, and the failure of internal
control systems. The Journal of Finance, 48(3), 831-880.
Jensen, M. C, & Meckling, W. (1976) Theory of the firm: Managerial behaviour, agency
costs, and ownership structure. Journal of Financial Economics, 3, 305-360.
Jorion, P. (2001). Financial Risk Manager Handbook 2001-2002 (Vol. 96). Wiley.
Kabir, M. A., & Dey, S. (2012). Performance Analysis through CAMEL Rating: A
Comparative Study of Selected Private Commercial Banks in Bangladesh.
Journal of Politics & Governance, 1(2/3), 16-25.
Kaplan, R. S., & Norton, D. P. (1996). The balanced scorecard: Translating strategy into
action. Harvard Business Press.
Khan, T., & Ahmed, H. (2001). Risk Management: an analysis of issues in Islamic
financial industry. Islamic Development Bank, Islamic Research and Training
Institute.
Khrawish, H. A. (2011). Determinants of commercial banks performance: evidence from
Jordan. International Research Journal of Finance and Economics, 81, 148-159.
Kleffner, A. E., Lee, R. B., & McGannon, B. (2003). The effect of Corporate Governance
on the use of enterprise Risk Management: Evidence from Canada. Risk
Management and Insurance Review, 6(1), 53-73.
Klein, P., Shapiro, D., & Young, J. (2005). Corporate Governance, family ownership and
firm value: the Canadian evidence. Corporate Governance: An International
Review, 13(6), 769-784.
Levene, H. (1960). In Contributions to Probability and Statistics: Essays in Honor of
Harold Hotelling, I. Olkin et al. eds., Stanford University Press, pp. 278-292.
Love, I., & Rachinsky, A. (2015). Corporate Governance and Bank Performance in
Emerging Markets: Evidence from Russia and Ukraine. Emerging Markets
Finance and Trade, 51(sup2), S101-S121.
Lukic, M. S. A. (2015). Types of Risks and Risk Management in the Contemporary
Banking Operations. International Journal, 3(3), 269-272.

183
Macey, J. R., & O'hara, M. (2003). The Corporate Governance of banks. Economic
Policy Review, 9(1).
Magutu, P. O. (2012). Supply chain information systems usage in inventory tracking
among logistics service providers in Kenya (Doctoral dissertation, University of
Nairobi).
Mang'unyi, E. E. (2011). Ownership Structure and Corporate Governance and Its Effects
on Performance: A Case of Selected Banks in Kenya. International Journal of
Business Administration, 2(3), 2.
Mayers, D., & Smith Jr, C. W. (1987). Corporate insurance and the underinvestment
problem. Journal of Risk and Insurance, 45-54.
Munjuri, M. G. (2012). Workforce Diversity Management and Employee Performance in
the banking sector in Kenya. DBA Africa Management Review, 3(1), 1-21.
Myers, M. D. (1997). Qualitative research in information systems. Management
Information Systems Quarterly, 21, 241-242.
Minton, B., Taillard, J., & Williamson, R. (2010). Do Independence and Financial
Expertise of the Board Matter for Risk Taking and Performance? Ohio State
University, Charles A. Dice Center for Research in Financial Economics
Morck, R., Shleifer, A., & Vishny, R. W. (1988). Management ownership and market
valuation: An empirical analysis. Journal of Financial Economics, 20, 293-315.
Nambiro, C. A. (2007). Relationship between levels of Implementation of CMA
Guidelines on Corporate Governance and Profitability of Companies Listed at
the Nairobi Stock Exchange (Doctoral dissertation, University of Nairobi).
Naushad, M., & Malik, S. A. (2015). Corporate Governance and Bank Performance: A
Study of Selected Banks in GCC Region. Asian Social Science, 11(9), p226.
Ndung‟u, A. W. (2013). Effect of Financial Risk Management on Financial Performance
of Oil Companies in Kenya (Doctoral dissertation, University of Nairobi).
Oldfield, G. S., & Santomero, A. M. (1995). The Place of Risk Management in Financial
Institutions. Wharton School, University of Pennsylvania.
184
Olweny, T., & Shipho, T. M. (2011). Effects of banking sectorial factors on the
profitability of commercial banks in Kenya. Economics and Finance Review,
1(5), 1-30.
Ongore, V. O., & Kusa, G. B. (2013). Determinants of Financial Performance of
Commercial Banks in Kenya. International Journal of Economics and Financial
Issues, 3(1), 237-252.
Orlikowski, W. J., & Baroudi, J. J. (1991). Studying information technology in
organizations: Research approaches and assumptions. Information systems
Research, 2(1), 1-28.
Parreñas, J. C. (2005). Bank‟s Risk Management Practices: A Survey of Four Asian
Emerging Markets. In second ADB Institute seminar on Corporate Governance
of Banks in Asia.
Patton, M. Q. (1990). Qualitative evaluation and research methods. SAGE Publications,
inc.
Peek, J., & Rosengren, E. (1995), Bank regulation and the credit crunch, Journal of
Banking &Finance, 19(3), 679-692.
Prowse, S., (1997), Corporate control in commercial banks, Journal of Financial
Research, 20(4), 509-27.
Phuong, L. T., Harvie, C., & Arjomandi, A. (2015). Does ownership affect bank
performance? An analysis of Vietnamese banks in the post-WTO entry period.
Rechner, P. L., & Dalton, D. R. (1991). CEO duality and organizational performance: A
longitudinal analysis. Strategic Management Journal, 12(2), 155-160.
Reddy, S. K. (2012). Relative Performance of commercial banks in India using CAMEL
approach. International Journal of Multidisciplinary Research, 2(3), 38-58.
Remenyi, D., & Williams, B. (1998). Doing research in business and management: an
introduction to process and method. Sage.
Robson, C., & McCartan, K. (2016). Real world research. John Wiley & Sons.

185
Rogers, M. (2006). Corporate Governance and Financial Performance of selected
commercial banks in Uganda. Makerere University Business School, Faculty of
Commerce. East Africa: Kampala Uganda.
Rosen, R. (2003). Risk Management and Corporate Governance: The case of Enron.
Connecticut Law Review, 35(1157).
Rosenstein, S., & Wyatt, J. G. (1990). Outside directors, board independence, and
shareholder wealth. Journal of Financial Economics, 26(2), 175-191.
Ross, S. A. (1973). “The Economic Theory of Agency: The Principal‟s Problem,”
American Economic Review, 63(2), 134-139
Rossman, G. B., & Wilson, B. L. (1985). Numbers and words combining quantitative and
qualitative methods in a single large-scale evaluation study. Evaluation review,
9(5), 627-643.
Saunders, M., Lewis, P., & Thornhill, A. (2009). Research methods for business students,
5th
Ed. Pearson Education India.
Sekaran, U. (2006). Research methods for business: A skill building approach. John
Wiley & Sons.
Shapiro, S.S. and Wilk, M.B. (1965). An Analysis of Variance Test for Normality
(Complete Samples). Biometrika, 52, (3/4), 591-611.
Siems, T. F., & Barr, R. S. (1998). Benchmarking the productive efficiency of US banks.
Financial Industry Studies, 11-24.
Simerly, R. L., & Li, M. (2000). Environmental dynamism, capital structure and
performance: a theoretical integration and an empirical test. Strategic
Management Journal, 21(1), 31-49.
Simpson, W. G., & Gleason, A. E. (1999). Board structure, ownership, and financial
distress in banking firms. International Review of Economics & Finance, 8(3),
281-292.
Smith Jr, C. W. (1995). Corporate Risk Management: theory and practice. The Journal of
Derivatives, 2(4), 21-30.
Smith, C. W., & Stulz, R. M. (1985). The determinants of firms' hedging policies.
Journal of Financial and Quantitative Analysis, 20(04), 391-405.

186
Tandelilin, E., Kaaro, H., & Mahadwartha, P. A. (2007). Corporate Governance, Risk
Management and bank performance: Does type of ownership matter. EADN
individual research grant project, (34).
Tashakkori, A., & Teddlie, C. (1998). Mixed methodology: Combining qualitative and
quantitative approaches (Vol. 46). Sage.
Trochim, W. M. (2005). Research methods: The concise knowledge base. Atomic Dog
Publishing.
Williamson, O. E. (1996). The mechanisms of governance. Oxford University Press.
Yermack, D. (1996). Higher market valuation of companies with a small board of
directors. Journal of Financial Economics, 40(2), 185-211.
Zikmund, W. G., Babin, B. J., Carr, J. C., & Griffin, M. (2013). Business research
methods. Cengage Learning.
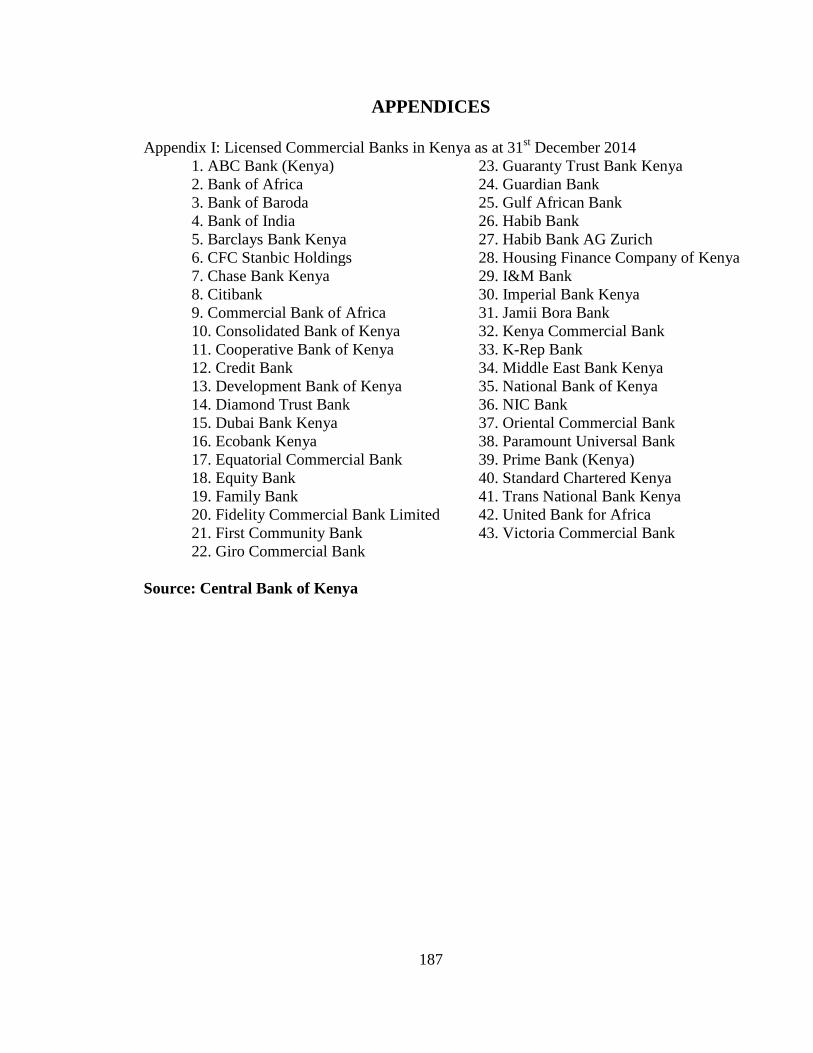
187
APPENDICES
Appendix I: Licensed Commercial Banks in Kenya as at 31st December 2014
1. ABC Bank (Kenya) 23. Guaranty Trust Bank Kenya
2. Bank of Africa 24. Guardian Bank
3. Bank of Baroda 25. Gulf African Bank
4. Bank of India 26. Habib Bank
5. Barclays Bank Kenya 27. Habib Bank AG Zurich
6. CFC Stanbic Holdings 28. Housing Finance Company of Kenya
7. Chase Bank Kenya 29. I&M Bank
8. Citibank 30. Imperial Bank Kenya
9. Commercial Bank of Africa 31. Jamii Bora Bank
10. Consolidated Bank of Kenya 32. Kenya Commercial Bank
11. Cooperative Bank of Kenya 33. K-Rep Bank
12. Credit Bank 34. Middle East Bank Kenya
13. Development Bank of Kenya 35. National Bank of Kenya
14. Diamond Trust Bank 36. NIC Bank
15. Dubai Bank Kenya 37. Oriental Commercial Bank
16. Ecobank Kenya 38. Paramount Universal Bank
17. Equatorial Commercial Bank 39. Prime Bank (Kenya)
18. Equity Bank 40. Standard Chartered Kenya
19. Family Bank 41. Trans National Bank Kenya
20. Fidelity Commercial Bank Limited 42. United Bank for Africa
21. First Community Bank 43. Victoria Commercial Bank
22. Giro Commercial Bank
Source: Central Bank of Kenya