CORPORATE GOVERNANCE AND RETURNS ON INFORMATION TECHNOLOGY
29
Strategic Management Journal Strat. Mgmt. J., 32: 595–623 (2011) Published online EarlyView in Wiley Online Library (wileyonlinelibrary.com) DOI: 10.1002/smj.886 Received 24 September 2008; Final revision received 6 August 2010 CORPORATE GOVERNANCE AND RETURNS ON INFORMATION TECHNOLOGY INVESTMENT: EVIDENCE FROM AN EMERGING MARKET † JOANNA L. Y. HO, 1 * ANNE WU, 2 and SEAN XIN XU 3 1 The Paul Merage School of Business, University of California, Irvine, California, U.S.A. 2 School of Accountancy, National Chengchi University, Taipei, Taiwan 3 School of Economics and Management, Tsinghua University, Beijing, China Prior studies have reported mixed findings on the impact of corporate information technology (IT) investment on firm performance. This study investigates the effect of corporate governance, an important management control mechanism, on the relation between IT investment and firm performance in the Taiwanese electronics industry. Specifically, we explore board independence and foreign ownership, which have increasingly become salient factors concerning corporate governance in emerging markets. We address their roles across firms of different sizes and in industries where degrees of competitiveness run a wide gamut. Our results show a positive mod- erating effect of board independence on the IT investment-firm performance relation, especially when competition intensifies. Furthermore, we find that the greater the foreign ownership in small firms, the more positive the IT investment-firm performance relation, suggesting that for- eign investors may bring IT expertise to help small firms reap the benefits of using IT. Copyright 2010 John Wiley & Sons, Ltd. INTRODUCTION Whether firms can improve performance by allo- cating financial resources for technology capital is an important question in strategic management (Porter, 2001; Teece, 2007). In practice, compa- nies have invested heavily in information technol- ogy (IT), and this trend is expected to continue (McAfee and Brynjolfsson, 2008). 1 However, the Keywords: IT investment; board independence; foreign ownership; firm performance; firm size; industry compet- itiveness *Correspondence to: Joanna L. Y. Ho, The Paul Merage School of Business, University of California, Irvine, CA 92697-3125, U.S.A. E-mail: [email protected] † Authors are listed in alphabetical order. 1 In the United States, corporate IT investment has tripled since the mid-1990s, representing 3.35 percent of gross domestic product or about half of the total capital spending in the private sector (McAfee and Brynjolfsson, 2008); worldwide IT spending is projected to increase at a compound annual growth rate of six percent to reach $1.5 trillion in 2010 (IDC, 2006). literature documents mixed evidence of IT value (Kohli and Devaraj, 2003). This paper exam- ines whether corporate governance moderates the impact of IT investment on firm performance. Two considerations motivate this question. First, corporate governance aims to assure that investors obtain an appropriate return on their investment (Shleifer and Vishny, 1997). Therefore, it should theoretically play a significant role in IT returns. The literature on corporate governance has developed an integrated view based on agency and resource-dependence perspectives; that is, corpo- rate governance helps firms mitigate agency prob- lems and obtain access to needed resources (Dalton et al., 1998; Zahra and Pearce, 1989). Specifically, corporate governance can exert a monitoring func- tion; in addition, governance mechanisms—such as corporate boards (e.g., Peng, 2004; Zahra and Pearce, 1989) and foreign ownership (e.g., Chib- ber and Majumdar, 1999; Douma, George, and Kabir, 2006)—can serve as a link to and provide Copyright 2010 John Wiley & Sons, Ltd.
Transcript of CORPORATE GOVERNANCE AND RETURNS ON INFORMATION TECHNOLOGY

Strategic Management JournalStrat. Mgmt. J., 32: 595–623 (2011)
Published online EarlyView in Wiley Online Library (wileyonlinelibrary.com) DOI: 10.1002/smj.886
Received 24 September 2008; Final revision received 6 August 2010
CORPORATE GOVERNANCE AND RETURNSON INFORMATION TECHNOLOGY INVESTMENT:EVIDENCE FROM AN EMERGING MARKET†
JOANNA L. Y. HO,1* ANNE WU,2 and SEAN XIN XU3
1 The Paul Merage School of Business, University of California, Irvine, California,U.S.A.2 School of Accountancy, National Chengchi University, Taipei, Taiwan3 School of Economics and Management, Tsinghua University, Beijing, China
Prior studies have reported mixed findings on the impact of corporate information technology(IT) investment on firm performance. This study investigates the effect of corporate governance,an important management control mechanism, on the relation between IT investment and firmperformance in the Taiwanese electronics industry. Specifically, we explore board independenceand foreign ownership, which have increasingly become salient factors concerning corporategovernance in emerging markets. We address their roles across firms of different sizes and inindustries where degrees of competitiveness run a wide gamut. Our results show a positive mod-erating effect of board independence on the IT investment-firm performance relation, especiallywhen competition intensifies. Furthermore, we find that the greater the foreign ownership insmall firms, the more positive the IT investment-firm performance relation, suggesting that for-eign investors may bring IT expertise to help small firms reap the benefits of using IT. Copyright 2010 John Wiley & Sons, Ltd.
INTRODUCTION
Whether firms can improve performance by allo-cating financial resources for technology capitalis an important question in strategic management(Porter, 2001; Teece, 2007). In practice, compa-nies have invested heavily in information technol-ogy (IT), and this trend is expected to continue(McAfee and Brynjolfsson, 2008).1 However, the
Keywords: IT investment; board independence; foreignownership; firm performance; firm size; industry compet-itiveness*Correspondence to: Joanna L. Y. Ho, The Paul Merage Schoolof Business, University of California, Irvine, CA 92697-3125,U.S.A. E-mail: [email protected]† Authors are listed in alphabetical order.1 In the United States, corporate IT investment has tripled sincethe mid-1990s, representing 3.35 percent of gross domesticproduct or about half of the total capital spending in the privatesector (McAfee and Brynjolfsson, 2008); worldwide IT spendingis projected to increase at a compound annual growth rate of sixpercent to reach $1.5 trillion in 2010 (IDC, 2006).
literature documents mixed evidence of IT value(Kohli and Devaraj, 2003). This paper exam-ines whether corporate governance moderates theimpact of IT investment on firm performance. Twoconsiderations motivate this question.
First, corporate governance aims to assure thatinvestors obtain an appropriate return on theirinvestment (Shleifer and Vishny, 1997). Therefore,it should theoretically play a significant role in ITreturns. The literature on corporate governance hasdeveloped an integrated view based on agency andresource-dependence perspectives; that is, corpo-rate governance helps firms mitigate agency prob-lems and obtain access to needed resources (Daltonet al., 1998; Zahra and Pearce, 1989). Specifically,corporate governance can exert a monitoring func-tion; in addition, governance mechanisms—suchas corporate boards (e.g., Peng, 2004; Zahra andPearce, 1989) and foreign ownership (e.g., Chib-ber and Majumdar, 1999; Douma, George, andKabir, 2006)—can serve as a link to and provide
Copyright 2010 John Wiley & Sons, Ltd.

596 J. L. Y. Ho, A. Wu, and S. X. Xu
resources from the external environment (e.g., Dal-ton et al., 1998: 273). Using this integrated lens,prior research examines whether corporate gover-nance can improve specific managerial decisions(Denis and McConnell, 2003). Our study buildson this strand of research in an effort to addressthe specific managerial activity of IT investment.Such study has been lacking in corporate gover-nance research.
Second, the resource-based view (RBV) alsomotivates us to examine the joint effect of cor-porate governance and IT investment. The RBVargues that ‘it is inappropriate to conclude thataccess to capital, per se, is a source of competitiveadvantage’ (Mata, Fuerst, and Barney, 1995: 496)and has long noted the critical role of resourcecomplementarity in improving firm performance(Barney, 1991; Peteraf, 1993). Rooted in RBV,recent research on IT returns emphasizes organi-zational resources complementary to IT, includingorganizational structures and policies in makingIT investment (Melville, Kraemer, and Gurgaxani,2004). Corporate governance represents organiza-tional structures at the governance level and deter-mines corporate policies and rules, which thereforemay stand out as a complementary resource for ITinvestment. But, to date, corporate governance hasreceived little attention in research on IT returns,as indicated by several reviews of that literature(Chan, 2000; Kohli and Devaraj, 2003; Melvilleet al., 2004).
This study focuses on the electronics indus-try in an emerging economy, Taiwan. We choosethis research setting for two theoretical reasons.First, according to agency theory, IT managersmay overinvest to accumulate excessive IT assetsfor their own interests (Fama and Jensen, 1983;Jensen and Meckling, 1976), and they may imi-tate each other even if imitation deviates fromoptimal investment decisions (e.g., Graham, 1999;Scharfstein and Stein, 1990). In a recent inter-view, Soumitra Dutta, dean of external relationsat INSEAD, stated: ‘We are finding the tech peo-ple tend to focus on the ‘new’—finding a businesscase for the ‘new.’ Very little thought goes intothe benefit’ (Stafford, 2007). Given that emerg-ing markets generally have weak judicial systemsto protect shareholders’ rights (Fan and Wong,2005; Klapper and Love, 2004; Lemmon and Lins,2003), internal corporate governance mechanisms(e.g., boards of directors) may play a significant
role in aligning managers’ and shareholders’ inter-ests (e.g., La Porta, Lopez-de-Silanes, and Shleifer,1999; Shleifer and Vishny, 1997).
Second, firms in emerging markets may lackknowledge and expertise in IT management, whichis a significant barrier to IT returns (Dewan andKraemer, 2000; Zhu, Kraemer, and Xu, 2006).This underscores the role of corporate governancein providing needed resources (e.g., Chibber andMajumdar, 1999; Douma et al., 2006; Peng, 2004).As such, the integrated view on corporate gover-nance—that is, agency issues and the notion ofresource dependence—is theoretically relevant toour research setting.
There are also three empirical reasons for select-ing this context. To date, most of the empiricalstudies on corporate governance are limited tothe U.S. context. The literature calls for moreresearch in an international setting (Denis andMcConnell, 2003). Second, the electronics indus-try in Taiwan plays an important role in the globalsupply chain (Einhorn, 2005); it is the largest pro-ducer in the worldwide market of desktop per-sonal computers (PCs), notebooks, displays, andmotherboards (Dedrick and Kraemer, 2005).2 Ourresearch thus can generate economically signifi-cant insights for both Taiwanese managers andinternational investors. Third, the Taiwan-basedresearch setting provides an opportunity to exam-ine salient factors concerning corporate gover-nance issues in emerging markets, such as foreignownership (Claessens, Djankov, and Lang, 2000;Douma et al., 2006) and excess control (Hoskissonet al., 2005).
Our research design follows Denis andMcConnell (2003) and classifies a firm’s inter-nal corporate governance mechanisms into twomajor categories: board composition and owner-ship structure. Accordingly, first we investigateboard independence —that is, the presence of out-side directors on the corporate board (Daltonet al., 1998). It is widely argued that indepen-dent boards can better play both advising (Zahraand Pearce, 1989; Dalton et al., 1998) and moni-toring roles (e.g., Daily and Dalton, 1994; Denisand McConnell, 2003; Klein, 1998, 2002a; Kor,2006). Furthermore, theoretical research implies
2 To illustrate, by 2004, Taiwan had accounted for over 70 per-cent of the world’s notebook PC market. It attracts an increasingamount of capital from the global financial market (Chiang andKuo, 2006), and high-tech stocks account for more than 60 per-cent of the daily trading volume in the Taiwanese stock market.
Copyright 2010 John Wiley & Sons, Ltd. Strat. Mgmt. J., 32: 595–623 (2011)DOI: 10.1002/smj

Corporate Governance and Information Technology Returns 597
that intense competition may make the monitor-ing role of corporate boards more desirable, orcompetition itself may serve as a bonding mech-anism to mitigate agency problems (e.g., Scharf-stein, 1988; Schmidt, 1997). Therefore, we extendthe line of research on board independence byinvestigating its role across industries. Second,we investigate foreign ownership —that is, theshare of foreign investment in a firm’s commonstock (Claessens et al., 2000; Douma et al., 2006).Foreign investors’ knowledge and experience indeploying IT may benefit companies in emerg-ing markets, which is the so-called ‘spillover’ ofIT management expertise (Aitken and Harrison,1999). We further compare the role of foreign own-ership between large and small firms, given differ-ent resource endowments across firms of differentsizes (Damanpour, 1996; Forman, 2005; Zhu et al.,2006). We empirically examine the above factorsbased on a sample of 719 Taiwanese companiesfrom 2001 to 2005.
Our study contributes to the literature in fourdifferent ways. First, our research offers a newinsight into why prior studies report mixed find-ings on the relation between IT and performance(e.g., Kohli and Devaraj, 2003). As evident in ourresults, the relation between IT and performance ismoderated by corporate governance. Specifically,the higher the board independence, the more pos-itive the relation, suggesting that internal advisingand monitoring mechanisms can help companiesachieve IT returns. Also, foreign ownership canmitigate resource disadvantages of small firms bycontributing IT expertise to help them manage ITmore effectively. Together these results reveal spe-cific conditions under which IT investment maylead to competitive advantage.
Second, this work has an important implicationfor research on board composition. The extant lit-erature has generated mixed findings about theimpact of board composition on firm performance,as indicated by several literature review papers.3
3 A review of empirical papers in the 1980s concludes: ‘In sum-mary, research on the potential impact of outside directors’representation on corporate performance yields mixed results’(Zahra and Pearce, 1989: 316). Meta-analyses in the 1990s alsoreport mixed findings about the link between board structuresand firm performance. For instance, Dalton et al. (1998: 278)show ‘results of the meta-analysis for board composition andfinancial performance. . . for all samples considered simultane-ously (159 samples, n = 40,160) indicate little support for asystematic relationship of this type.’ A more recent literaturereview (Hermalin and Weisbach, 2003: 20), again, finds that
Dalton et al. (1998: 284) suggest: ‘We are not opti-mistic that future research in the general areas ofboard composition/financial performance. . . wouldbe fruitful. Also, the evidence would not seem toprovide much confidence in further examinationsof possible moderating influences on those rela-tionships.’ Yet, we find that the interaction betweenboard independence and IT investment is signifi-cantly associated with better firm performance. Toour knowledge, this work is the first to examinethe role of board independence in IT investment.Our finding suggests that investigating the role ofboard composition in specific investment activitiescan be a promising direction for future research.
Third, we find that the moderation effect ofboard independence on IT returns is salient in morecompetitive rather than less competitive indus-tries. This finding suggests that controlling princi-pal/agent conflicts through board monitoring maybe more beneficial as competition intensifies. Therelation between competition and monitoring hasreceived attention in modeling papers (e.g., Scharf-stein, 1988; Schmidt, 1997), but the literature fallsshort of empirical evidence. Our work contributesto this burgeoning literature by relating the role ofcorporate governance to industry competition.
Fourth, our results shed light on corporate gov-ernance in an international setting. ‘For manycountries, there is only limited empirical evidenceregarding issues related to the effectiveness ofboards of directors. . .for some there is no evidenceat all’ (Denis and McConnell, 2003: 9). In additionto the board of directors, we have also examinedfactors specific to an emerging market. Foreignownership, according to our results, does not ben-efit all domestic firms. We find a positive relationof foreign ownership to IT returns for small firmsand those with low excess control. These findingshelp bridge the literature gap.
LITERATURE REVIEW
IT investment and firm performance
Prior studies relate firm performance to eitherannual IT investment or accumulated IT stock.Annual IT investment includes hardware, software,and costs related to maintenance, personnel, and
‘board composition is not related to corporate performance,’which is confirmed by another recent literature review (Denisand McConnell, 2003: 6).
Copyright 2010 John Wiley & Sons, Ltd. Strat. Mgmt. J., 32: 595–623 (2011)DOI: 10.1002/smj

598 J. L. Y. Ho, A. Wu, and S. X. Xu
training (Chari, Devaraj, and David, 2008; Kobel-sky et al., 2008). IT stock consists of accumu-lated hardware capital and the capitalized valueof IT labor spending (Dewan, Shi, and Gurbax-ani, 2007; Hitt and Brynjolfsson, 1996).4 In theliterature on IT returns, firm performance refersto accounting-based operating performance or thestock market-based assessment of firm value (e.g.,Anderson, Banker, and Ravindran, 2006; Chari atal., 2008). The accounting-based performance iseither the current period performance (e.g., Hittand Brynjolfsson, 1996; Tam, 1998) or future per-formance (e.g., Anderson et al., 2006; Kobelskyet al., 2008). Based on these various measures,the relation between IT investment and firm per-formance is found to be elusive (Kobelsky et al.,2008; Kohli and Devaraj, 2003).
There is little evidence on IT returns in emergingmarkets. Dewan and Kraemer (2000) use country-level statistics to estimate IT’s contribution tooutput and find insignificant IT returns in emerg-ing markets. Tam (1998) shows that IT invest-ments by firms in four Asian-Pacific economiesmay improve or reduce return on assets, whileconsistently having an insignificant relation toshareholder wealth. A possible explanation is thatthe market-based valuation depends on the ‘effi-cient market hypothesis’ but in less mature mar-kets, investors’ expectation may diverge from ITimpacts on firm performance (Tam, 1998). Follow-ing this argument, we investigate IT returns forTaiwanese firms.
Why is corporate governance important for ITreturns?
According to the principal/agent literature, man-agers may seek to maximize their own utilityby overconsuming company resources or select-ing suboptimal investments (e.g., Fama and Jensen,1983; Jensen and Meckling, 1976). From thisnotion, managers may make excessive IT invest-ments because a larger IT department brings higherpower and salaries. In addition, the literature of
4 IT investment differs from other capital investments in that IThas a fast depletion rate. In addition, although labor expensein general is not included in capital investment, spending onIT labor (e.g., personnel, developing software, templates, train-ing) creates an asset that lasts, on average, three years and iscommonly included in IT investment (e.g., Hitt and Brynjolf-sson, 1996; Dewan et al., 2007). We address these features ofIT investment by computing IT stock and relating it to firmperformance in the sensitivity analysis section.
career concerns suggests that managers may inten-tionally imitate others’ investment decisions toenhance their professional reputations, with littleor no regard to their firms’ IT needs (e.g., Gra-ham, 1999; Scharfstein and Stein, 1990). Institu-tional theory also argues that making a substantialIT investment may merely represent managers’attempt to comply with institutional pressures, andthus may not necessarily lead to improved firmperformance (Abrahamson and Rosenkopf, 1997).
These agency problems may occur because eval-uating managers’ IT investment decisions requirestechnology-related information that shareholdersoften lack. Shareholders may therefore evaluatemanagers’ IT decisions on the basis of industryconsensus (Kauffman and Li, 2003). Consequently,managers may take advantage of asymmetric infor-mation to support their investment decisions (e.g.,Fama and Jensen, 1983), and may tend to followothers in order to maintain their reputations andsecure their jobs, rather than assess the economicimpacts of such decisions on their companies (Gra-ham, 1999). Imitation may also happen if managerslack the information and skills to select optimalinvestments for their companies and simply fol-low others to reduce decision costs (Abrahamsonand Rosenkopf, 1997).
Agency problems are a particular concern inAsian Pacific countries and emerging markets(Gedajlovic and Shapiro, 1998; Hoskisson et al.,2005). Research on emerging markets (includingTaiwan) shows that companies tend to chase newtechnologies without learning how to use them(Zhu et al., 2006). Research on Singapore sug-gests that firms imitate competitors in IT adoptionto avoid being considered as technologically lessadvanced (Teo, Wei, and Benbasat, 2003). A recentstudy on China also shows that IT investmentmay be subject to imitation (Liang et al., 2007).Imitation may lead to excessive or uneconomicIT investments, resulting in an insignificant andeven negative IT-performance relation (Abraham-son and Rosenkopf, 1997).
Corporate governance can reduce the agencyproblems given its monitoring function; in addi-tion, governance mechanisms may be activelyinvolved in technology investments through coun-sel and advice (Dalton et al., 1998; Zahra andPearce, 1989). As such, corporate governance mayplay a significant role in bringing the needed infor-mation and skills in IT management. Following
Copyright 2010 John Wiley & Sons, Ltd. Strat. Mgmt. J., 32: 595–623 (2011)DOI: 10.1002/smj

Corporate Governance and Information Technology Returns 599
Denis and McConnell (2003), the specific gov-ernance mechanisms of interest are the board ofdirectors and ownership structure. The next sectionhypothesizes board independence across industriesand foreign ownership across firms of differentsizes.
HYPOTHESES DEVELOPMENT
Board independence
The corporate board of directors serves as animportant internal mechanism in making signifi-cant managerial decisions and in limiting manage-rial inefficiencies (e.g., Daily and Dalton, 1994; LaPorta et al., 1999; Young, Tsai, and Hsieh, 2008).The corporate board directly monitors IT invest-ment when the volume is large (Klein, 2002b; Kor,2006). The board also meets regularly with internaland external auditors to review the firm’s financialstatements, audit process, and internal controls,which creates an indirect monitoring function forIT investment (Bhagat and Black, 2002). Boardmembers also offer advice for IT investment asdescribed by the resource dependence perspec-tive that boards are important boundary spannersthat provide timely information to top management(Zahra and Pearce, 1989).
The corporate board consists of inside direc-tors (those employed by the company) and out-side directors (e.g., chief executive officers [CEOs]of other firms, investment bankers, former gov-ernmental officials, major suppliers). An outsidermajority board is associated with high indepen-dence, while an insider majority board is associ-ated with low independence (Dalton et al., 1998).A board with higher independence may be moreeffective because outside directors are more objec-tive and have access to external information that isless available to inside directors (e.g., Carpenter,Pollock, and Leary, 2003; Daily and Dalton, 1994).Outside directors also have the incentive to protecttheir reputation and avoid litigation (e.g., Beasleyet al., 2000; Klein, 2002b). These studies sup-port the notion of better monitoring and advisingby outsider majority boards. In contrast, ‘boardswhich are insider dominated may be less effectiveat meeting their control, resource dependence andcounseling/expertise roles’ (Dalton et al., 1998:275).
The literature, however, shows inconclusive evi-dence on how board independence relates to firm
performance. Klapper and Love (2004) and Durnevand Kim (2005) find a positive relation betweencorporate governance and firm value, with boardindependence being one of the governance compo-nents. While Black, Jang, and Kim (2006), Choi,Park, and Yoo (2007), and Young et al. (2008)report a positive effect of board independenceon firm value,5 Bhagat and Black (2002) reporta negative effect of board independence on firmvalue, and Mak and Li (2001), Carter, Simkins,and Simpson (2003), and Brown and Caylor (2006)report no effect of board independence on firmvalue. Denis and McConnell (2003) review stud-ies in an international setting and conclude thatboard independence is not conclusively associatedwith superior performance; however, the corpo-rate board may impact performance by influencingmanagerial decisions in specific activities. In thesame vein, we test the impact of board indepen-dence in the specific setting of IT investment. Theabove discussion leads to a positive moderationeffect of board independence as follows:
Hypothesis1: Board independence positivelymoderates the relation between IT investmentand firm performance.
Industry competitiveness and boardindependence
The above moderation effect (Hypothesis 1) maydiffer across industries with different degrees ofcompetitiveness. The industrial organization liter-ature commonly uses industry concentration as aproxy for industry competitiveness (e.g., Cohenand Levin, 1989; Porter, 2001). High industry con-centration (thus low competitiveness) increases afirm’s profitability because of insulation of com-petition, thus lowering the marginal value of newtechnology investment. On the contrary, industrycompetitiveness may increase the marginal gainsto the firm from new technology (e.g., Cohen andLevin, 1989). Melville et al. (2004) also arguethat firms in highly concentrated industries, byattaining monopoly rents, may achieve superiorperformance without IT-enhanced efficiency gains.Conversely, under competitive regimes, firms needto rely on other approaches to achieve greater
5 For instance, Choi et al. (2007) examine changes in the marketvalue of firms and use an event study methodology to show thepositive effect of board independence.
Copyright 2010 John Wiley & Sons, Ltd. Strat. Mgmt. J., 32: 595–623 (2011)DOI: 10.1002/smj

600 J. L. Y. Ho, A. Wu, and S. X. Xu
profitability, for example, using IT to increase effi-ciencies in business processes (e.g., Devaraj andKohli, 2003; Ray, Barney, and Muhanna, 2004;Dong, Xu, and Zhu, 2009).
As discussed earlier, agency problems must bealleviated in order to convert IT’s potential ben-efits to realized performance improvement. Thisis particularly important for firms facing intensecompetition (e.g., Hermalin, 1992; Schmidt, 1997).That is, the marginal value to the firm of reduc-ing agency problems is higher when the firm isoperating in more competitive industries than inless competitive industries. Consequently, boardmonitoring would benefit firms more as industrycompetitiveness becomes more intensive.
In another stream of research on managerialincentives, several theoretical papers imply thatincreased competition may work as a bondingmechanism to decrease agency problems by pro-viding more performance evaluation informationto stakeholders (e.g., Nalebuff and Stiglitz, 1983).This is because intense competition makes firmperformance more sensitive to uneconomic invest-ments. However, Scharfstein (1988) shows thatcompetition actually increases managerial actionsfor self-interest when the marginal utility gainedfrom self-interest seeking is strictly positive.Hence, the predicted relation between competi-tion and managerial incentives is not clear. Fur-thermore, it is difficult for shareholders to relatechanges in firm performance to IT investmentbecause, to date, there is no reporting standard forIT investment under the current accounting rules(Anderson et al., 2006). Consequently, the inabil-ity to obtain the IT investment information pub-licly may weaken the effect of competition, if any,to constrain principal/agent conflicts in IT invest-ment. Therefore, we expect the monitoring func-tion of independent boards in the IT-performancecontext to be more important in more competitiveindustries.
Hypothesis 2: The moderation effect of boardindependence in the IT investment-firm per-formance relation is more positive for morecompetitive industries than for less competitiveindustries.
Foreign ownership
Starting in 1991, the Taiwanese governmentapproved the Qualified Foreign Institutional
Investors program, allowing qualified foreigninvestors to participate in the Taiwanese securitiesmarket. Over the past decade, foreign ownershiphas gained increasing importance in the Taiwaneseeconomy (Chiang and Kuo, 2006). Theoretically,foreign investment is driven by foreign investors’proprietary knowledge, which serves as a leveragefor them to capture rents in the international mar-ket (Caves, 1996). For Taiwanese firms, ‘foreignaffiliation also gives domestic firms relatively easyaccess to superior technical, managerial, and finan-cial resources’ (Douma et al., 2006: 640). Studieson emerging markets, however, find that the rela-tion of firm performance to foreign ownership isgenerally not clear (e.g., Qi, Wu, and Zhang, 2000;Tan, 2002). One explanation is ‘liability of for-eignness’ (Vernon, 1966; Zaheer, 1995). That is,foreign investors are not familiar with local con-texts. Hence, when they provide input to generalmanagement, their involvement may not benefit adomestic firm due to their limited knowledge ofthe local environment, culture, and managementstyle. Given these different perspectives, the directrelation of firm performance to foreign ownershipis an empirical question.
Yet, in the specific context of IT value cre-ation, foreign ownership may play a positive role.The literature documents spillover of technologi-cal knowledge associated with foreign ownership,which can particularly benefit firms in emerg-ing markets (e.g., Braga and Willmore, 1991;Aitken and Harrison, 1999; Hu, Jefferson, andQian, 2005). For instance, foreign ownership isfound to facilitate technology transfer (Chibberand Majumdar, 1999). An implication for ourresearch is that foreign ownership may bring abouta positive moderation effect in IT investment byoffering expertise for deploying IT (i.e., spillover)(Aitken and Harrison, 1999). In the IT invest-ment context, foreign investors’ knowledge andexperience are technical in nature, and informa-tion technologies are becoming increasingly stan-dardized in the global market (Lyytinen and King,2006). These would position domestic firms tobenefit from the spillover of technological knowl-edge. Dedrick and Kraemer (2005) conduct casestudies and show that Taiwanese electronics firmsbridge their knowledge gap in using IT by learn-ing from foreign investors. This leads to a pos-itive moderating effect of foreign ownership asfollows:
Copyright 2010 John Wiley & Sons, Ltd. Strat. Mgmt. J., 32: 595–623 (2011)DOI: 10.1002/smj

Corporate Governance and Information Technology Returns 601
Hypothesis 3: Foreign ownership positivelymoderates the relation between IT investmentand firm performance.
Firm size and foreign ownership
Compared to small firms, large firms have moreexpertise in deploying technologies, because theycan afford to hire major consulting firms to pro-vide specialized services and offer expert advice(e.g., Forman, 2005; Zhu et al., 2006). Daman-pour (1996: 695) argues that ‘large organiza-tions employ more professional and skilled humanresources, and have high technical knowledge andtechnical potential and, thus, are in the forefrontof technological development.’ This may weakenthe importance of the technological knowledgespilled over from foreign investors. Indeed, empir-ical research shows that the spillover effect offoreign ownership is not significant for large firms(Aitken and Harrison, 1999).
In contrast, smaller firms are affiliated with‘resource poverty’ in deploying IT (e.g., Forman,2005; Zhu et al., 2006). Specifically, these smallfirms may lack IT knowledge and skills, which is asignificant barrier to IT returns. Also, unlike largefirms that can encourage and even require businesspartners to use IT in interfirm business processes,small firms may find it difficult to identify businesspartners using compatible technologies, a barrierto realizing IT value (Melville et al., 2004). Fur-thermore, CEOs and directors of small firms areusually less constrained by organizational systemsand structures and therefore may have more dis-cretion than large firms (e.g., Daily and Dalton,1994; Klein, 2002b; Zahra and Pearce, 1989). Therelatively weaker internal control systems and thelack of comprehensive audit systems in small firmsmay curtail the potential returns on IT investment.Research on corporate governance in emergingmarkets suggests that foreign investors may beendowed with good monitoring capabilities (e.g.,Douma et al., 2006). They may also act as a link tothe global supply chain, which features widespreaduse of IT (e.g., Kraemer et al., 2006). This is animportant business resource that enables domesticfirms to apply IT to digitize supply chain processesand thus derive IT value (Melville et al., 2004;Powell and Dent-Micallef, 1997).
In sum, foreign investors can contribute theirIT expertise, enhance board structure, and increaseaccess to the business resources needed for using
IT. Therefore, foreign ownership may strengthen asmall firm’s ability to generate value from deploy-ing IT. This leads us to expect small firms tobenefit more from foreign ownership in IT valuecreation than large firms.
Hypothesis 4: The moderation effect of for-eign ownership in the IT investment-firm perfor-mance relation is more positive for small firmsthan for large firms.
METHODOLOGY
Data
Our data is from three sources. First, we obtaindata concerning corporate IT investment from adatabase created by the Taiwanese Institute forInformation Industry, funded by the Taiwanesegovernment. Since 2001, the Taiwanese Institutefor Information Industry has authorized ChinaCredit Information Service Ltd (CCIS) to collectcorporate-level IT investment data through face-to-face interviews and then verify for accuracy. CCIShas been in the industry for more than 40 yearsand is well known for its high integrity and relia-bility in conducting large-scale surveys. As such,the Taiwanese government has used the CCIS ITsurvey data to set up various policies and reg-ulations (e.g., governmental fund allocation andindustry development policies). Second, we col-lect financial performance information from theFinancial Report Database compiled by the Tai-wan Economic Journal (TEJ ), which contains dataextracted from Taiwanese firms’ annual financialreports. Third, we obtain information about firms’ownership structures and board composition fromthe TEJ ’s Corporate Database. The two TEJ ’sdatabases cover only publicly listed companies onthe Taiwan Stock Exchange.6 These datasets pro-vide a unique opportunity to assess the role of
6 In this study, all sample companies are domestic Taiwanesecompanies. Regarding the definition of domestic companies, theTaiwanese Securities Law requires that more than half of thecompany’s capital is from Taiwanese nationals or Taiwanese-owned companies. By contrast, a company is labeled as aforeign company if more than 50 percent of its capital is fromforeign investors (either foreign nationals or foreign institutionalinvestors). Based on Taiwan government regulation, none of theforeign companies are publicly listed and traded in Taiwan.
Copyright 2010 John Wiley & Sons, Ltd. Strat. Mgmt. J., 32: 595–623 (2011)DOI: 10.1002/smj
602 J. L. Y. Ho, A. Wu, and S. X. Xu
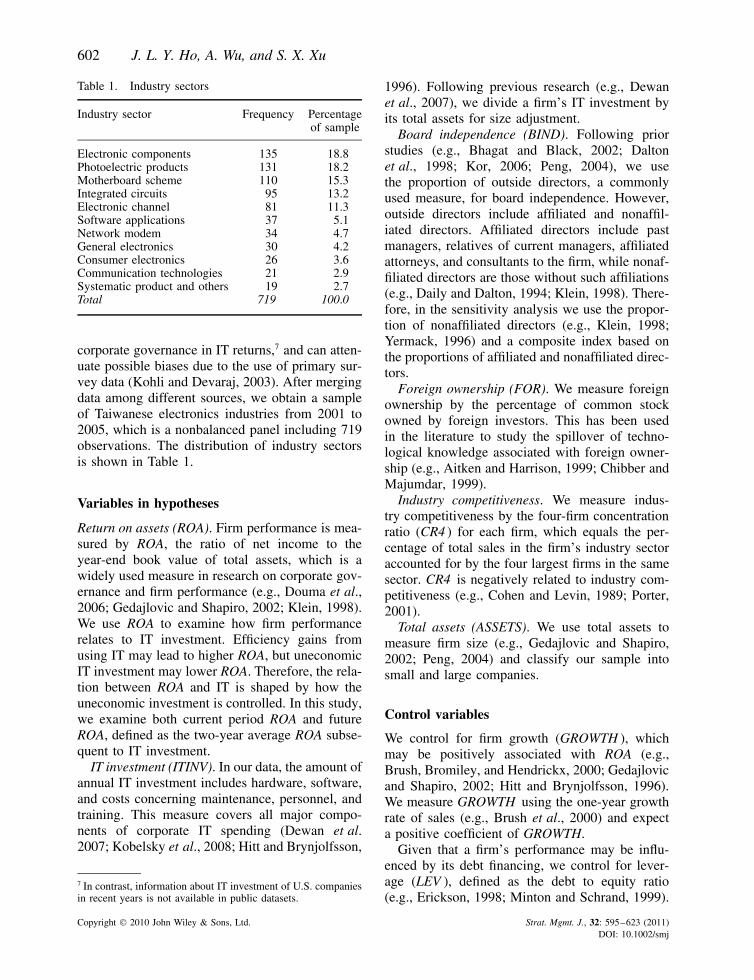
Table 1. Industry sectors
Industry sector Frequency Percentageof sample
Electronic components 135 18.8Photoelectric products 131 18.2Motherboard scheme 110 15.3Integrated circuits 95 13.2Electronic channel 81 11.3Software applications 37 5.1Network modem 34 4.7General electronics 30 4.2Consumer electronics 26 3.6Communication technologies 21 2.9Systematic product and others 19 2.7Total 719 100.0
corporate governance in IT returns,7 and can atten-uate possible biases due to the use of primary sur-vey data (Kohli and Devaraj, 2003). After mergingdata among different sources, we obtain a sampleof Taiwanese electronics industries from 2001 to2005, which is a nonbalanced panel including 719observations. The distribution of industry sectorsis shown in Table 1.
Variables in hypotheses
Return on assets (ROA). Firm performance is mea-sured by ROA, the ratio of net income to theyear-end book value of total assets, which is awidely used measure in research on corporate gov-ernance and firm performance (e.g., Douma et al.,2006; Gedajlovic and Shapiro, 2002; Klein, 1998).We use ROA to examine how firm performancerelates to IT investment. Efficiency gains fromusing IT may lead to higher ROA, but uneconomicIT investment may lower ROA. Therefore, the rela-tion between ROA and IT is shaped by how theuneconomic investment is controlled. In this study,we examine both current period ROA and futureROA, defined as the two-year average ROA subse-quent to IT investment.
IT investment (ITINV). In our data, the amount ofannual IT investment includes hardware, software,and costs concerning maintenance, personnel, andtraining. This measure covers all major compo-nents of corporate IT spending (Dewan et al.2007; Kobelsky et al., 2008; Hitt and Brynjolfsson,
7 In contrast, information about IT investment of U.S. companiesin recent years is not available in public datasets.
1996). Following previous research (e.g., Dewanet al., 2007), we divide a firm’s IT investment byits total assets for size adjustment.
Board independence (BIND). Following priorstudies (e.g., Bhagat and Black, 2002; Daltonet al., 1998; Kor, 2006; Peng, 2004), we usethe proportion of outside directors, a commonlyused measure, for board independence. However,outside directors include affiliated and nonaffil-iated directors. Affiliated directors include pastmanagers, relatives of current managers, affiliatedattorneys, and consultants to the firm, while nonaf-filiated directors are those without such affiliations(e.g., Daily and Dalton, 1994; Klein, 1998). There-fore, in the sensitivity analysis we use the propor-tion of nonaffiliated directors (e.g., Klein, 1998;Yermack, 1996) and a composite index based onthe proportions of affiliated and nonaffiliated direc-tors.
Foreign ownership (FOR). We measure foreignownership by the percentage of common stockowned by foreign investors. This has been usedin the literature to study the spillover of techno-logical knowledge associated with foreign owner-ship (e.g., Aitken and Harrison, 1999; Chibber andMajumdar, 1999).
Industry competitiveness. We measure indus-try competitiveness by the four-firm concentrationratio (CR4 ) for each firm, which equals the per-centage of total sales in the firm’s industry sectoraccounted for by the four largest firms in the samesector. CR4 is negatively related to industry com-petitiveness (e.g., Cohen and Levin, 1989; Porter,2001).
Total assets (ASSETS). We use total assets tomeasure firm size (e.g., Gedajlovic and Shapiro,2002; Peng, 2004) and classify our sample intosmall and large companies.
Control variables
We control for firm growth (GROWTH ), whichmay be positively associated with ROA (e.g.,Brush, Bromiley, and Hendrickx, 2000; Gedajlovicand Shapiro, 2002; Hitt and Brynjolfsson, 1996).We measure GROWTH using the one-year growthrate of sales (e.g., Brush et al., 2000) and expecta positive coefficient of GROWTH.
Given that a firm’s performance may be influ-enced by its debt financing, we control for lever-age (LEV ), defined as the debt to equity ratio(e.g., Erickson, 1998; Minton and Schrand, 1999).
Copyright 2010 John Wiley & Sons, Ltd. Strat. Mgmt. J., 32: 595–623 (2011)DOI: 10.1002/smj

Corporate Governance and Information Technology Returns 603
Shareholders may have incentives to expropriatebondholders’ wealth by investing in high risk,high return projects. As such, bondholders maydemand higher rents by increasing the costs of debt(Jensen and Meckling, 1976). On the other hand,debt financing may ‘urge’ managers to maintaintheir promises to pay out future cash flows. Thus,increased leverage may reduce cash flows availablefor spending at the discretion of managers (Jensen,1986). Since previous research on IT investmentreports a negative relation of leverage to ROA (e.g.,Hitt and Brynjolfsson, 1996), we expect a negativecoefficient of LEV.
Following prior studies, we also include mar-ket share (SHARE ), the ratio of a firm’s salesto the total industry sale (see a literature reviewby Szymanski, Bharadwaj, and Varadarajan, 1993).SHARE can proxy for a firm’s negotiation power,and thus may be positively correlated with firmperformance. The literature, however, containsmixed findings regarding both the sign and thestatistical significance of the market share-firm per-formance relation (Szymanski et al., 1993). Thismay be because of the inclusion of another proxyfor negotiation power (e.g., firm growth), whichweakens the statistical association between marketshare and firm performance (e.g., Hitt and Bryn-jolfsson, 1996; Szymanski et al., 1993). Hence, wedo not predict the sign of SHARE.
Another control variable is free cash flow (FCF ),which gauges the availability of slack resources(Tan and Peng, 2003). It provides one approach tocope with the problem of lacking knowledge andskills, for instance, obtaining services and advicefrom consulting firms. Controlling for FCF thushelps partial out the role of spillover associatedwith foreign ownership. We follow Bushee (1998)to measure FCF as cash flow from operations lesscapital expenditures.
In addition, we include equity-based executivecompensation (COMP), that is, the percentage ofequity to the total executive compensation (Makand Li, 2001; Yermack, 1996). Rediker and Seth(1995) find a negative relation between board inde-pendence and executives’ equity ownership, sug-gesting that COMP may help align managers’ andshareholders’ interests, thus reducing the monitor-ing potential of directors. COMP, however, mayalso result in an ‘entrenchment effect’ in thathigher equity ownership can provide managerswith freedom to pursue their own objectives with-out fear of reprisal (Denis and McConnell, 2003).
Its relation to firm performance is thus shaped bytwo conflicting effects—alignment vs. entrench-ment—which may explain why prior researchshows an inconclusive relation between COMPand firm value (Mak and Li, 2001).
We also control for research and developmentintensity (RD), which may enhance firm perfor-mance (e.g., Hitt and Brynjolfsson, 1996;McWilliams and Siegel, 2000). We measure RD asa firm’s R&D expenditures divided by sales (e.g.,McWilliams and Siegel, 2000) and expect the signof RD to be positive. We also control for firmage (AGE ). Firms may accumulate resources overyears, and thus we expect firm age to be positivelyrelated to firm performance. In addition, evidencein emerging markets suggests that older firms maybe more entrenched and less likely to appointoutside directors (Peng, 2004). Finally, followingprior research on board composition and firm per-formance (e.g., Klein, 1998: 292), we control forone-year lagged performance (ROA−1). We expecta positive coefficient of ROA−1 since performancemeasures are positively correlated over time (e.g.,Brush et al., 2000; Peng, 2004).
Regression model
To the best of our knowledge, there is no regressionmodel readily available in the extant literature thatlinks firm performance to corporate governanceand IT investment. We thus develop a regressionmodel based on prior studies, which uses thefollowing specification to examine the relation offirm performance to corporate governance:
ROA = f (corporate governance variables,lagged ROA, other control variables).
This model has been applied for investigatingthe board of directors (e.g., Klein, 1998) and own-ership structures (e.g., Brush et al., 2000; Doumaet al., 2006; Gedajlovic and Shapiro, 2002), and ithas been used to relate firm performance to cor-porate governance in emerging markets (e.g., Joh,2003; Qi et al., 2000). We expand the model byincluding IT investment, in line with the manage-ment literature that has long linked ROA to R&Dinvestment using cross-sectional regressions (e.g.,McWilliams and Siegel, 2000). This leads to ourregression model as follows:
ROA =13∑
k=1
βkxk + β0
Copyright 2010 John Wiley & Sons, Ltd. Strat. Mgmt. J., 32: 595–623 (2011)DOI: 10.1002/smj
604 J. L. Y. Ho, A. Wu, and S. X. Xu
= β1 IT INV + β2 BIND + β3 IT INV
× BIND + β4 FOR + β5 IT INV × FOR
+ β6GROWT H + β7LEV + β8SHARE
+ β9FCF + β10COMP + β11RD
+ β12AGE + β13ROA−1 + β0 (1)
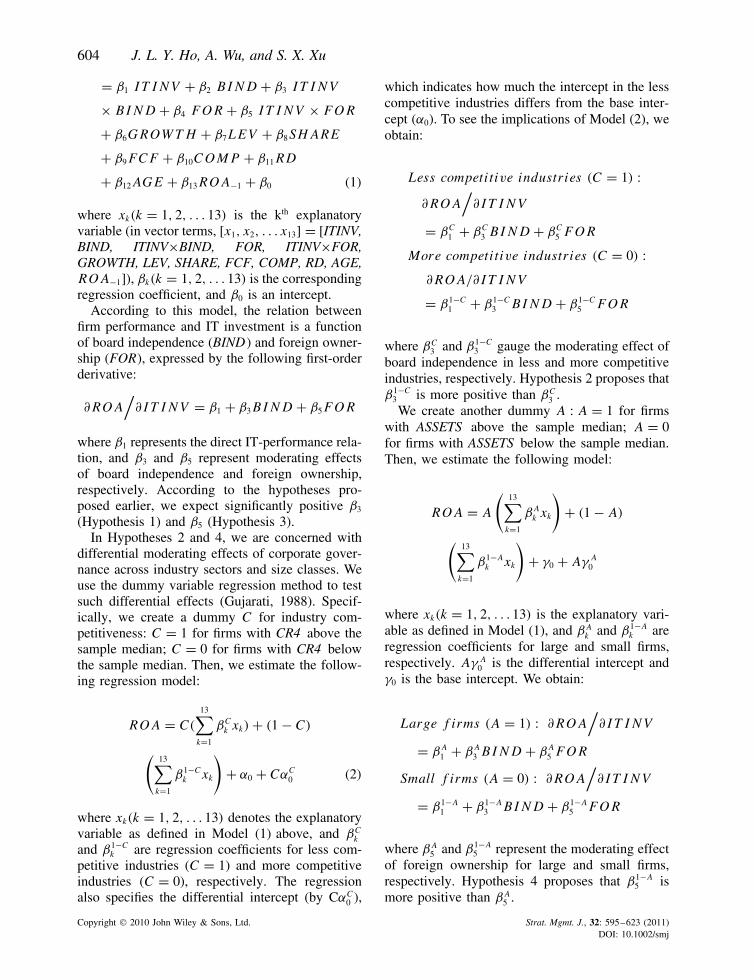
where xk(k = 1, 2, . . . 13) is the kth explanatoryvariable (in vector terms, [x1, x2, . . . x13] = [ITINV,BIND, ITINV×BIND, FOR, ITINV×FOR,GROWTH, LEV, SHARE, FCF, COMP, RD, AGE,ROA−1]), βk(k = 1, 2, . . . 13) is the correspondingregression coefficient, and β0 is an intercept.
According to this model, the relation betweenfirm performance and IT investment is a functionof board independence (BIND) and foreign owner-ship (FOR), expressed by the following first-orderderivative:
∂ROA/
∂IT INV = β1 + β3BIND + β5FOR
where β1 represents the direct IT-performance rela-tion, and β3 and β5 represent moderating effectsof board independence and foreign ownership,respectively. According to the hypotheses pro-posed earlier, we expect significantly positive β3
(Hypothesis 1) and β5 (Hypothesis 3).In Hypotheses 2 and 4, we are concerned with
differential moderating effects of corporate gover-nance across industry sectors and size classes. Weuse the dummy variable regression method to testsuch differential effects (Gujarati, 1988). Specif-ically, we create a dummy C for industry com-petitiveness: C = 1 for firms with CR4 above thesample median; C = 0 for firms with CR4 belowthe sample median. Then, we estimate the follow-ing regression model:
ROA = C(
13∑k=1
βCk xk) + (1 − C)
(13∑
k=1
β1−Ck xk
)+ α0 + CαC
0 (2)
where xk(k = 1, 2, . . . 13) denotes the explanatoryvariable as defined in Model (1) above, and βC
k
and β1−Ck are regression coefficients for less com-
petitive industries (C = 1) and more competitiveindustries (C = 0), respectively. The regressionalso specifies the differential intercept (by CαC
0 ),
which indicates how much the intercept in the lesscompetitive industries differs from the base inter-cept (α0). To see the implications of Model (2), weobtain:
Less competitive industries (C = 1) :
∂ROA/
∂IT INV
= βC1 + βC
3 BIND + βC5 FOR
More competitive industries (C = 0) :
∂ROA/∂IT INV
= β1−C1 + β1−C
3 BIND + β1−C5 FOR
where βC3 and β1−C
3 gauge the moderating effect ofboard independence in less and more competitiveindustries, respectively. Hypothesis 2 proposes thatβ1−C
3 is more positive than βC3 .
We create another dummy A : A = 1 for firmswith ASSETS above the sample median; A = 0for firms with ASSETS below the sample median.Then, we estimate the following model:
ROA = A
(13∑
k=1
βAk xk
)+ (1 − A)
(13∑
k=1
β1−Ak xk
)+ γ0 + Aγ A
0
where xk(k = 1, 2, . . . 13) is the explanatory vari-able as defined in Model (1), and βA
k and β1−Ak are
regression coefficients for large and small firms,respectively. Aγ A
0 is the differential intercept andγ0 is the base intercept. We obtain:
Large f irms (A = 1) : ∂ROA/
∂IT INV
= βA1 + βA
3 BIND + βA5 FOR
Small f irms (A = 0) : ∂ROA/
∂IT INV
= β1−A1 + β1−A
3 BIND + β1−A5 FOR
where βA5 and β1−A
5 represent the moderating effectof foreign ownership for large and small firms,respectively. Hypothesis 4 proposes that β1−A
5 ismore positive than βA
5 .
Copyright 2010 John Wiley & Sons, Ltd. Strat. Mgmt. J., 32: 595–623 (2011)DOI: 10.1002/smj

Corporate Governance and Information Technology Returns 605
RESULTS
Summary statistics
Table 2 summarizes the descriptive statistics of thekey variables on both the full sample and sub-samples. Table 3 shows Pearson correlations. TheANOVA results in Table 2 show that small firmsin our sample have greater ROA (both current andfuture), consistent with the nature of the electron-ics industries (Dedrick and Kraemer, 2005). Theproduction of commodity electronic products (e.g.,modems, motherboards, and flat-panel displays)is characterized by asset-intensive, high-volume,but low-return manufacturing. In contrast, applica-tions providers and firms focused on design andservices enjoy high profitability, while their oper-ations require relatively fewer assets.
The ANOVA also shows that foreign investorstarget firms in less competitive industries, possi-bly because investments in these firms are lessrisky. The mean board independence is also higherin less competitive industries. It may be becausefirms in these industries are more inclined to relyon board independence to immunize themselvesagainst managerial incentives for self-interest(Nalebuff and Stiglitz, 1983). Or, it may simplybe that BIND is positively correlated with FOR(see Table 3), and the mean FOR is higher inless competitive industries. Because our focus ison how BIND moderates IT value while the cor-porate governance variables are correlated withseveral control variables (Table 3), it is difficultto draw conclusions based solely on the univariateanalysis and we need to proceed to a multivariateregression.
Table 2 also shows that small firms have higherBIND, consistent with prior research showing anegative relation between firm size and audit com-mittee independence (Klein, 2002b: 440): ‘Largerfirms have stronger internal controls systems thansmaller firms. . . If the firms’ internal controls actas in-house monitoring mechanisms, then largerfirms require less alternative monitoring. . .’ A sim-ilar rationale can explain the observation in oursample. The ANOVA also indicates that firms inless competitive industries and larger firms havemore free cash flow, consistent with expectations(Forman, 2005; Zhu et al., 2006). Larger firms onaverage are older, possibly because firms accumu-late assets over time. Firms are younger in thesample with lower CR4, given that firm entry may
decrease both average firm age and industry con-centration. In sum, these observations about freecash flow, firm size, and age are similar to evi-dence in other emerging markets (Peng, 2004; Tanand Peng, 2003).
In Table 3, we note two high correlations. First,as expected, our dependent variable (ROA) ishighly correlated with a control variable ROA−1.Second, a control variable SHARE is highly cor-related (r = 0.724, p < 0.01) with CR4, which isused to divide the sample into less and more com-petitive industries. The high correlation is intuitive;on average, firms in more concentrated industrieshave higher market shares. Finally, it is worthnoting that the pair-wise correlations between theexplanatory variables in our regression model arenot high, with the largest absolute value equaling0.235 (between FOR and FCF ). Hence, multico-linearity is not likely to be a problem. We alsoexamine variance inflation factors, which in ourstudy are all below 1.5, suggesting no harmfulmulticolinearity.
Full-sample results
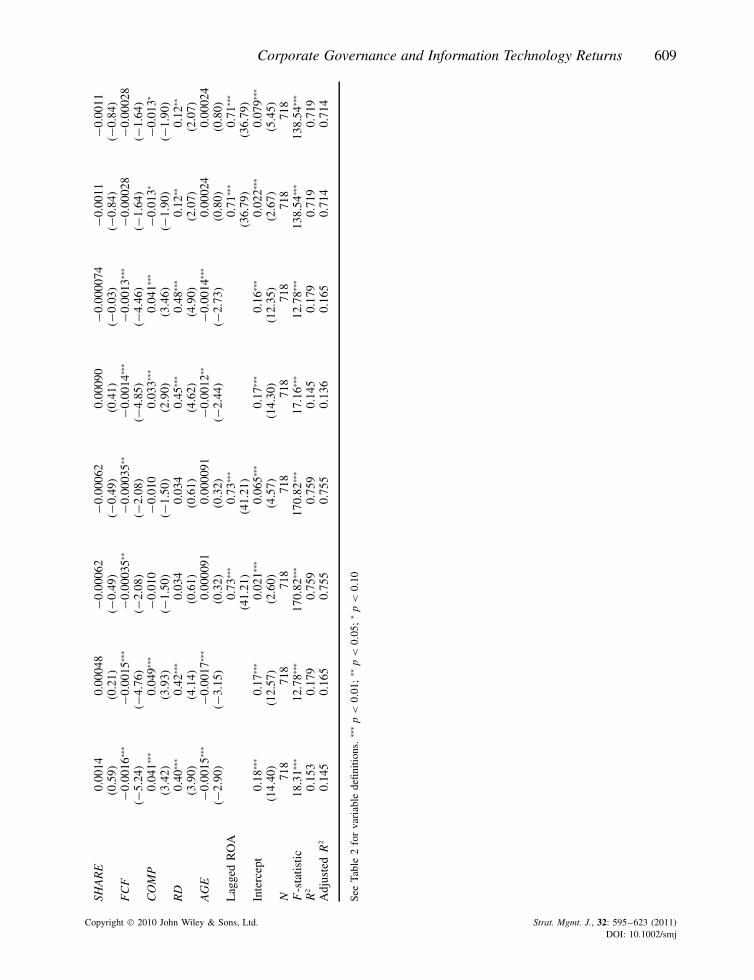
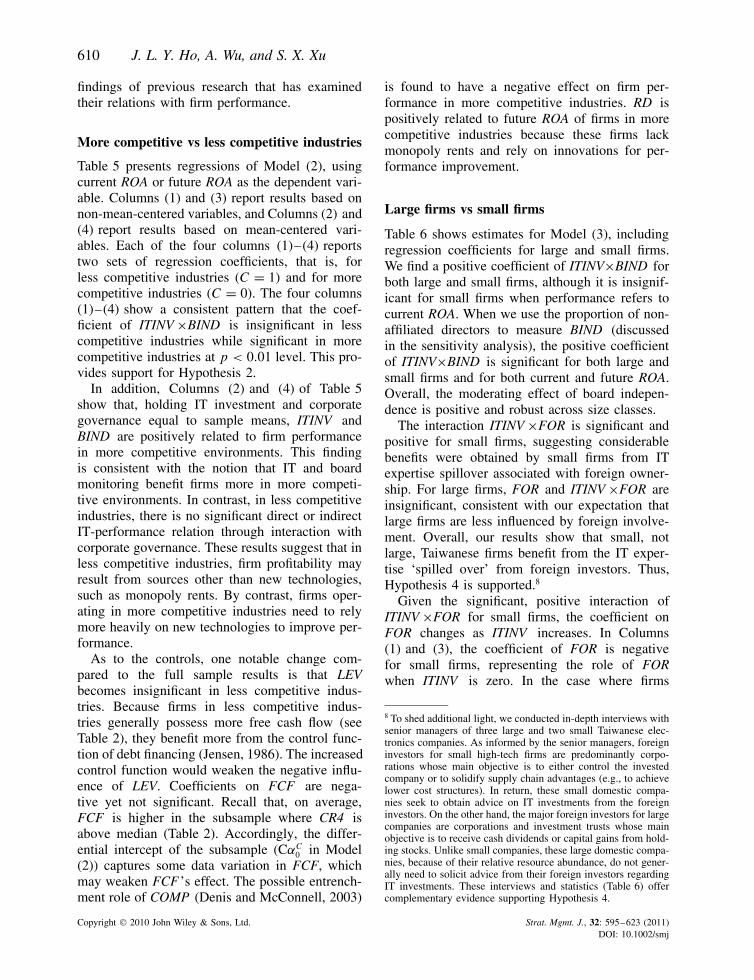
Table 4 presents estimates for Model (1), showingthe relations of ROA with explanatory variables inthe full sample. We find highly consistent resultsbetween regressions using current-period ROA(Columns (1)–(4)) and future ROA (Columns(5)–(8)). Next we discuss regression results basedon future ROA. A comparison of Columns (5) and(6) shows that including the theoretical variables(IT investment and corporate governance) yieldsan incremental R2 of 0.034 (0.179 − 0.145), sig-nificant at p < 0.001 level. Column (7) furtheradds the lagged ROA, and the regression resultsremain qualitatively unchanged.
The overall model in Column (7) of Table 4is significant (F = 138.54, p < 0.01). The coef-ficient of ITINV is insignificant (t = 0.25), indi-cating that the direct relation between IT invest-ment and firm performance is not clear (Kohliand Devaraj, 2003). The coefficient of BIND isinsignificant (t = −0.99), consistent with the non-correlation between board independence and firmperformance reported by previous studies (e.g.,Bhagat and Black, 2002; Brown and Caylor, 2006;Carter et al., 2003; Dalton et al., 1998; Denis andMcConnell, 2003; Mak and Li, 2001). Nonethe-less, we find a positive and significant interactionITINV ×BIND (t = 4.45), indicating that the IT
Copyright 2010 John Wiley & Sons, Ltd. Strat. Mgmt. J., 32: 595–623 (2011)DOI: 10.1002/smj

606 J. L. Y. Ho, A. Wu, and S. X. Xu
Tabl
e2.
Des
crip
tive
stat
istic
s
Les
sco
mpe
titiv
evs
.m
ore
com
petit
ive
indu
stri
esL
arge
firm
svs
.sm
all
firm
s
Full
sam
ple
CR
4ab
ove
med
ian
CR
4be
low
med
ian
AN
OV
AA
SSE
TS
abov
em
edia
nA
SSE
TS
belo
wm
edia
nA
NO
VA
Mea
nS.
D.
Mea
nS.
D.
Mea
nS.
D.
t-st
atis
ticM
ean
S.D
.M
ean
S.D
.t-
stat
isti
c
RO
A(c
urre
nt)
0.15
10.
114
0.15
80.
118
0.15
20.
120
0.66
0.13
20.
104
0.17
00.
121
−4.6
1∗∗∗
RO
A(f
utur
e)0.
149
0.10
90.
146
0.08
60.
159
0.12
6−1
.47
0.13
90.
101
0.17
20.
121
−3.5
8∗∗∗
ITIN
V0.
037
0.61
70.
004
0.00
50.
094
1.03
3−1
.39
0.00
30.
050.
070
0.87
1−1
.48
BIN
D0.
163
0.18
70.
281
0.17
50.
015
0.04
427
.48∗∗
∗0.
145
0.17
70.
182
0.19
6−2
.69∗∗
∗
FO
R0.
055
0.09
70.
070
0.10
70.
042
0.08
93.
56∗∗
∗0.
079
0.10
90.
031
0.07
66.
90∗∗
∗
CR
40.
208
0.06
90.
223
0.08
70.
188
0.00
17.
64∗∗
∗0.
202
0.40
60.
214
0.08
8−2
.47∗∗
ASS
ET
S9.
583
23.7
119.
493
18.8
4210
.773
32.4
34−0
.61
17.3
8031
.705
1.80
70.
812
9.30
∗∗∗
GR
OW
TH
0.11
10.
363
0.14
80.
299
0.06
30.
408
2.81
∗∗0.
150
0.38
00.
073
0.34
22.
84∗∗
∗
LE
V0.
673
0.61
80.
607
0.61
70.
737
0.63
1−2
.53∗∗
0.68
10.
561
0.66
50.
670
0.33
SHA
RE
0.32
21.
729
0.38
21.
888
0.20
10.
427
1.75
∗0.
346
1.60
70.
299
1.84
40.
36F
CF
3.49
813
.238
6.79
614
.418
1.20
63.
020
2.88
∗∗∗
4.91
415
.690
0.29
30.
440
6.57
∗∗∗
CO
MP
0.22
80.
331
0.24
80.
351
0.23
30.
331
0.53
0.28
20.
348
0.10
70.
252
7.59
∗∗∗
RD
0.02
80.
041
0.02
40.
042
0.04
00.
043
−4.4
4∗∗∗
0.02
50.
033
0.03
20.
047
−2.0
9∗∗
AG
E16
.870
7.72
919
.677
7.90
915
.104
7.31
67.
28∗∗
∗17
.341
7.81
215
.800
7.44
52.
47∗∗
RO
A−1
0.16
90.
122
0.16
60.
124
0.18
40.
128
−1.7
4∗0.
145
0.10
80.
193
0.13
1−5
.34∗∗
∗
∗∗∗
p<
0.01
;∗∗
p<
0.05
;∗p
<0.
10.
Dat
afr
omth
eTa
iwan
ese
Inst
itute
for
Info
rmat
ion
Indu
stry
:D
ata
from
TE
J’s
Fin
anci
alR
epor
tD
atab
ase:
ITIN
V=
annu
alIT
spen
ding
(har
dwar
e,so
ftw
are
and
cost
sco
ncer
ning
mai
nten
ance
,pe
rson
nel
and
trai
ning
)di
vide
dby
tota
las
sets
RO
A(c
urre
nt)
net
inco
me
÷ye
ar-e
ndbo
okva
lue
ofto
tal
asse
ts
RO
A(f
utur
e)=
2-ye
arav
erag
eR
OA
subs
eque
ntto
ITin
vest
men
tC
R4
=sa
les
ofth
efo
urla
rges
tfir
ms
inth
ein
dust
ry÷
tota
lin
dust
rysa
les
ASS
ET
S=
tota
las
sets
(Tai
wan
$bi
llion
)G
RO
WT
H=
one-
year
grow
thra
teof
sale
sL
EV
=bo
okva
lue
ofto
tal
debt
÷bo
okva
lue
ofto
tal
equi
tyD
ata
from
TE
J’s
Cor
pora
teD
atab
ase:
SHA
RE
=sa
les
÷to
tal
indu
stry
sale
s(i
ndus
try
sect
ors
show
nin
Tabl
e1)
BIN
D=
prop
ortio
nof
outs
ide
dire
ctor
sF
CF
=ca
shflo
wfr
omop
erat
ions
less
capi
tal
expe
nditu
res
(Tai
wan
$bi
llion
)F
OR
=pr
opor
tion
ofco
mm
onst
ock
owne
dby
fore
ign
CO
MP
=pr
opor
tion
ofeq
uity
base
dex
ecut
ive
com
pens
atio
nIn
vest
ors
RD
=re
sear
chan
dde
velo
pmen
tex
pens
es÷
sale
sA
GE
=fir
mag
eR
OA
−1=
RO
Ain
the
prev
ious
year
Copyright 2010 John Wiley & Sons, Ltd. Strat. Mgmt. J., 32: 595–623 (2011)DOI: 10.1002/smj

Corporate Governance and Information Technology Returns 607
Tabl
e3.
Pear
son
corr
elat
ions
RO
A(c
urre
nt)
RO
A(f
utur
e)IT
INV
BIN
DFO
RC
R4
ASS
ET
SG
RO
WT
HL
EV
SHA
RE
FCF
CO
MP
RD
AG
ER
OA
−1
RO
A(c
urre
nt)
1R
OA
(fut
ure)
0.97
3∗∗∗
1IT
INV
−0.0
02−0
.006
1B
IND
0.11
4∗∗∗
0.11
9∗∗∗
−0.0
471
FO
R−0
.010
0.00
6−0
.029
0.08
9∗∗1
CR
40.
008
0.01
8−0
.016
0.13
8∗∗∗
−0.0
121
ASS
ET
S−0
.149
∗∗∗
−0.1
37∗∗
∗−0
.018
−0.0
93∗∗
0.30
8∗∗∗
−0.0
431
GR
OW
TH
0.18
5∗∗∗
0.18
1∗∗∗
−0.0
370.
070∗
−0.0
07−0
.034
0.01
41
LE
V−0
.168
∗∗∗
−0.1
60∗∗
∗0.
003
−0.1
26∗∗
∗−0
.120
∗∗∗
−0.1
09∗∗
∗−0
.016
0.14
7∗∗∗
1SH
AR
E0.
017
0.01
8−0
.008
−0.0
530.
011
0.72
4∗∗∗
0.13
8∗∗∗
−0.0
020.
013
1F
CF
−0.1
48∗∗
∗−0
.135
∗∗∗
−0.0
13−0
.062
∗0.
235∗∗
∗−0
.021
0.85
3∗∗∗
−0.0
13−0
.047
0.09
7∗∗∗
1C
OM
P0.
147∗∗
∗0.
131∗∗
∗−0
.011
−0.2
11∗∗
∗0.
123∗∗
∗−0
.094
∗∗0.
158∗∗
∗0.
006
−0.1
01∗∗
∗0.
025
0.06
11
RD
0.17
8∗∗∗
0.19
9∗∗∗
−0.0
26−0
.202
∗∗∗
0.04
30.
046
0.09
3∗∗0.
017
−0.0
82∗∗
0.08
7∗∗0.
110∗∗
∗0.
110∗∗
∗1
AG
E−0
.130
∗∗∗
−0.1
21∗∗
∗0.
036
0.06
1∗0.
002
0.00
3−0
.016
−0.0
44−0
.057
−0.0
11−0
.044
−0.0
25−0
.227
∗∗∗
1R
OA
−10.
835∗∗
∗0.
809∗∗
∗−0
.009
0.02
1−0
.008
−0.0
06−0
.119
∗∗∗
−0.0
43−0
.159
∗∗∗
0.02
8−0
.124
∗∗∗
0.20
8∗∗∗
0.19
9∗∗∗
−0.1
58∗∗
∗1
∗∗∗p
<0.
01;
∗∗p
<0.
05;
∗p
<0.
10.
See
Tabl
e2
for
vari
able
defin
ition
s.
investment-ROA relation would be more positivefor firms with higher board independence. Thissupports Hypothesis 1.
The coefficient of FOR is insignificant (t =0.59), suggesting that the direct relation betweenforeign ownership and firm performance is notclear. The coefficient of ITINV ×FOR is alsoinsignificant (t = 0.41), thus showing no supportfor Hypothesis 3. A plausible explanation is thatlarge firms with resource advantages in IT man-agement benefit less from IT expertise spillover.This dilutes the influence of FOR on the full sam-ple. To further check this explanation, we need tolook into the sample split by firm size (discussedbelow).
Column (8) of Table 4 carries out a joint test(Friedrich, 1982) in order to better interpret theinteraction effect between IT investment and cor-porate governance. In Column (8), ITINV, BIND,and FOR are mean-centered. Accordingly, thecoefficient of ITINV represents its effect expectedat the mean values of BIND and FOR. The resultshows that IT investment has a significantly pos-itive contribution to firm performance (t = 4.55)conditioning on mean values of corporate gover-nance. This is in sharp contrast to the insignifi-cant ITINV in Column (7), which represents IT’simpact when BIND and FOR are zero. Together,Columns (7) and (8) clearly show that IT invest-ment pays off as board independence increases.
Among the controls, the coefficients ofGROWTH and ROA−1 are significant and posi-tive, consistent with our expectations. Debt financ-ing has both benefits and costs, and here we finda significantly negative coefficient of LEV, consis-tent with prior studies using different samples (e.g.,Hitt and Brynjolfsson, 1996; McWilliams andSiegel, 2000). SHARE is insignificant, possiblybecause GROWTH also taps increased negotiationpower. R&D spending contributes to future perfor-mance. FCF has a negative coefficient as expected.The sign of COMP changes after the lagged per-formance is included, possibly because COMP isaffected by the previous firm performance. Its neg-ative relation to future performance suggests thatagency problems may also arise with equity owner-ship (Denis and McConnell, 2003). AGE has eitheran insignificant or a negative coefficient, differ-ent from the earlier expectation. An explanationmay be attributed to the more entrenched structuresof older firms (Peng, 2004). Overall, the resultswith regard to the controls are consistent with the
Copyright 2010 John Wiley & Sons, Ltd. Strat. Mgmt. J., 32: 595–623 (2011)DOI: 10.1002/smj

608 J. L. Y. Ho, A. Wu, and S. X. Xu
Tabl
e4.
Reg
ress
ion
resu
ltson
the
full
sam
ple
RO
A=
13 ∑ k=1
βkx
k+
β0=
β1
IT
IN
V+
β2
BIN
D+
β3
IT
IN
V×
BIN
D+
β4
FO
R+
β5
IT
IN
V×
FO
R
+β6G
RO
WT
H+
β7
LE
V+
β8SH
AR
E+
β9
FC
F+
β10
CO
MP
+β
11R
D+
β12
AG
E+
β13
RO
A−1
+β
0
DV
=cu
rren
t-pe
riod
RO
AD
V=
futu
reR
OA
(1)
Con
trol
mod
el
(2)
Wit
hout
RO
A−1
(3)
Bas
em
odel
(4)
Join
tte
st
(5)
Con
trol
mod
el
(6)
Wit
hout
RO
A−1
(7)
Bas
em
odel
(8)
Join
tte
st
Coe
fβ
k
(t-s
tat)
Coe
fβ
k
(t-s
tat)
Coe
fβ
k
(t-s
tat)
Coe
fβ
k
(t-s
tat)
Coe
fβ
k
(t-s
tat)
Coe
fβ
k
(t-s
tat)
Coe
fβ
k
(t-s
tat)
Coe
fβ
k
(t-s
tat)
ITIN
V0.
0018
0.00
085
1.26
∗∗∗
0.00
190.
0010
1.58
∗∗∗
(0.2
3)(0
.21)
(3.7
1)(0
.26)
(0.2
5)(4
.55)
BIN
D0.
016
−0.0
220.
35∗∗
∗0.
015
−0.0
190.
46∗∗
∗
(0.4
5)(−
1.16
)(3
.60)
(0.4
6)(−
0.99
)(4
.62)
ITIN
V×B
IND
19.7
2∗∗∗
10.0
1∗∗∗
10.0
1∗∗∗
21.8
2∗∗∗
12.9
2∗∗∗
12.9
2∗∗∗
(3.7
9)(3
.54)
(3.5
4)(4
.41)
(4.4
5)(4
.45)
FO
R−0
.031
−0.0
035
0.03
4−0
.011
0.01
40.
034
(−0.
72)
(−0.
15)
(0.7
1)(−
0.27
)(0
.59)
(0.6
9)IT
INV×F
OR
0.75
1.01
1.01
0.30
0.54
0.54
(0.3
2)(0
.79)
(0.7
9)(0
.13)
(0.4
1)(0
.41)
Con
trol
sG
RO
WT
H0.
064∗∗
∗0.
062∗∗
∗0.
073∗∗
∗0.
073∗∗
∗0.
059∗∗
∗0.
057∗∗
∗0.
067∗∗
∗0.
067∗∗
∗
(5.7
9)(5
.64)
(12.
29)
(12.
29)
(5.6
0)(5
.42)
(10.
95)
(10.
95)
LE
V−0
.035
∗∗∗
−0.0
33∗∗
∗−0
.014
∗∗∗
−0.0
14∗∗
∗−0
.032
∗∗∗
−0.0
29∗∗
∗−0
.011
∗∗∗
−0.0
11∗∗
∗
(−5.
37)
(−5.
02)
(−3.
83)
(−3.
83)
(−5.
05)
(−4.
62)
(−3.
06)
(−3.
06)
Copyright 2010 John Wiley & Sons, Ltd. Strat. Mgmt. J., 32: 595–623 (2011)DOI: 10.1002/smj
Corporate Governance and Information Technology Returns 609
SHA
RE
0.00
140.
0004
8−0
.000
62−0
.000
620.
0009
0−0
.000
074
−0.0
011
−0.0
011
(0.5
9)(0
.21)
(−0.
49)
(−0.
49)
(0.4
1)(−
0.03
)(−
0.84
)(−
0.84
)F
CF
−0.0
016∗∗
∗−0
.001
5∗∗∗
−0.0
0035
∗∗−0
.000
35∗∗
−0.0
014∗∗
∗−0
.001
3∗∗∗
−0.0
0028
−0.0
0028
(−5.
24)
(−4.
76)
(−2.
08)
(−2.
08)
(−4.
85)
(−4.
46)
(−1.
64)
(−1.
64)
CO
MP
0.04
1∗∗∗
0.04
9∗∗∗
−0.0
10−0
.010
0.03
3∗∗∗
0.04
1∗∗∗
−0.0
13∗
−0.0
13∗
(3.4
2)(3
.93)
(−1.
50)
(−1.
50)
(2.9
0)(3
.46)
(−1.
90)
(−1.
90)
RD
0.40
∗∗∗
0.42
∗∗∗
0.03
40.
034
0.45
∗∗∗
0.48
∗∗∗
0.12
∗∗0.
12∗∗
(3.9
0)(4
.14)
(0.6
1)(0
.61)
(4.6
2)(4
.90)
(2.0
7)(2
.07)
AG
E−0
.001
5∗∗∗
−0.0
017∗∗
∗0.
0000
910.
0000
91−0
.001
2∗∗−0
.001
4∗∗∗
0.00
024
0.00
024
(−2.
90)
(−3.
15)
(0.3
2)(0
.32)
(−2.
44)
(−2.
73)
(0.8
0)(0
.80)
Lag
ged
RO
A0.
73∗∗
∗0.
73∗∗
∗0.
71∗∗
∗0.
71∗∗
∗
(41.
21)
(41.
21)
(36.
79)
(36.
79)
Inte
rcep
t0.
18∗∗
∗0.
17∗∗
∗0.
021∗∗
∗0.
065∗∗
∗0.
17∗∗
∗0.
16∗∗
∗0.
022∗∗
∗0.
079∗∗
∗
(14.
40)
(12.
57)
(2.6
0)(4
.57)
(14.
30)
(12.
35)
(2.6
7)(5
.45)
N71
871
871
871
871
871
871
871
8F
-sta
tistic
18.3
1∗∗∗
12.7
8∗∗∗
170.
82∗∗
∗17
0.82
∗∗∗
17.1
6∗∗∗
12.7
8∗∗∗
138.
54∗∗
∗13
8.54
∗∗∗
R2
0.15
30.
179
0.75
90.
759
0.14
50.
179
0.71
90.
719
Adj
uste
dR
20.
145
0.16
50.
755
0.75
50.
136
0.16
50.
714
0.71
4
See
Tabl
e2
for
vari
able
defin
ition
s.∗∗
∗p
<0.
01;
∗∗p
<0.
05;
∗p
<0.
10
Copyright 2010 John Wiley & Sons, Ltd. Strat. Mgmt. J., 32: 595–623 (2011)DOI: 10.1002/smj
610 J. L. Y. Ho, A. Wu, and S. X. Xu
findings of previous research that has examinedtheir relations with firm performance.
More competitive vs less competitive industries
Table 5 presents regressions of Model (2), usingcurrent ROA or future ROA as the dependent vari-able. Columns (1) and (3) report results based onnon-mean-centered variables, and Columns (2) and(4) report results based on mean-centered vari-ables. Each of the four columns (1)–(4) reportstwo sets of regression coefficients, that is, forless competitive industries (C = 1) and for morecompetitive industries (C = 0). The four columns(1)–(4) show a consistent pattern that the coef-ficient of ITINV ×BIND is insignificant in lesscompetitive industries while significant in morecompetitive industries at p < 0.01 level. This pro-vides support for Hypothesis 2.
In addition, Columns (2) and (4) of Table 5show that, holding IT investment and corporategovernance equal to sample means, ITINV andBIND are positively related to firm performancein more competitive environments. This findingis consistent with the notion that IT and boardmonitoring benefit firms more in more competi-tive environments. In contrast, in less competitiveindustries, there is no significant direct or indirectIT-performance relation through interaction withcorporate governance. These results suggest that inless competitive industries, firm profitability mayresult from sources other than new technologies,such as monopoly rents. By contrast, firms oper-ating in more competitive industries need to relymore heavily on new technologies to improve per-formance.
As to the controls, one notable change com-pared to the full sample results is that LEVbecomes insignificant in less competitive indus-tries. Because firms in less competitive indus-tries generally possess more free cash flow (seeTable 2), they benefit more from the control func-tion of debt financing (Jensen, 1986). The increasedcontrol function would weaken the negative influ-ence of LEV. Coefficients on FCF are nega-tive yet not significant. Recall that, on average,FCF is higher in the subsample where CR4 isabove median (Table 2). Accordingly, the differ-ential intercept of the subsample (CαC
0 in Model(2)) captures some data variation in FCF, whichmay weaken FCF ’s effect. The possible entrench-ment role of COMP (Denis and McConnell, 2003)
is found to have a negative effect on firm per-formance in more competitive industries. RD ispositively related to future ROA of firms in morecompetitive industries because these firms lackmonopoly rents and rely on innovations for per-formance improvement.
Large firms vs small firms
Table 6 shows estimates for Model (3), includingregression coefficients for large and small firms.We find a positive coefficient of ITINV×BIND forboth large and small firms, although it is insignif-icant for small firms when performance refers tocurrent ROA. When we use the proportion of non-affiliated directors to measure BIND (discussedin the sensitivity analysis), the positive coefficientof ITINV×BIND is significant for both large andsmall firms and for both current and future ROA.Overall, the moderating effect of board indepen-dence is positive and robust across size classes.
The interaction ITINV ×FOR is significant andpositive for small firms, suggesting considerablebenefits were obtained by small firms from ITexpertise spillover associated with foreign owner-ship. For large firms, FOR and ITINV ×FOR areinsignificant, consistent with our expectation thatlarge firms are less influenced by foreign involve-ment. Overall, our results show that small, notlarge, Taiwanese firms benefit from the IT exper-tise ‘spilled over’ from foreign investors. Thus,Hypothesis 4 is supported.8
Given the significant, positive interaction ofITINV ×FOR for small firms, the coefficient onFOR changes as ITINV increases. In Columns(1) and (3), the coefficient of FOR is negativefor small firms, representing the role of FORwhen ITINV is zero. In the case where firms
8 To shed additional light, we conducted in-depth interviews withsenior managers of three large and two small Taiwanese elec-tronics companies. As informed by the senior managers, foreigninvestors for small high-tech firms are predominantly corpo-rations whose main objective is to either control the investedcompany or to solidify supply chain advantages (e.g., to achievelower cost structures). In return, these small domestic compa-nies seek to obtain advice on IT investments from the foreigninvestors. On the other hand, the major foreign investors for largecompanies are corporations and investment trusts whose mainobjective is to receive cash dividends or capital gains from hold-ing stocks. Unlike small companies, these large domestic compa-nies, because of their relative resource abundance, do not gener-ally need to solicit advice from their foreign investors regardingIT investments. These interviews and statistics (Table 6) offercomplementary evidence supporting Hypothesis 4.
Copyright 2010 John Wiley & Sons, Ltd. Strat. Mgmt. J., 32: 595–623 (2011)DOI: 10.1002/smj

Corporate Governance and Information Technology Returns 611
Tabl
e5.
Mor
eco
mpe
titiv
ein
dust
ries
vs.
less
com
petit
ive
indu
stri
es
RO
A=
C(
13 ∑ k=1
βC kx
k)+
(1−
C)(
13 ∑ k=1
β1−
Ck
xk)+
α0+
Cα
C 0
DV
=cu
rren
t-pe
riod
RO
AD
V=
futu
reR
OA
(1)
Bas
em
odel
(2)
Join
tte
st(3
)B
ase
mod
el(4
)Jo
int
test
Les
sco
mpe
t.(C
=1)
†
Mor
eco
mpe
t.(C
=0)
†
Les
sco
mpe
t.(C
=1)
†
Mor
eco
mpe
t.(C
=0)
†
Les
sco
mpe
t.(C
=1)
†
Mor
eco
mpe
t.(C
=0)
†
Les
sco
mpe
t.(C
=1)
†
Mor
eco
mpe
t.(C
=0)
†
Coe
fβ
kC
(t-s
tat)
Coe
fβ
k1−C
(t-s
tat)
Coe
fβ
kC
(t-s
tat)
Coe
fβ
k1−C
(t-s
tat)
Coe
fβ
kC
(t-s
tat)
Coe
fβ
k1−C
(t-s
tat)
Coe
fβ
kC
(t-s
tat)
Coe
fβ
k1−C
(t-s
tat)
ITIN
V−0
.075
0.00
260.
672.
07∗∗
∗−0
.039
0.00
160.
752.
53∗∗
∗
(−0.
75)
(0.5
9)(0
.87)
(4.0
3)(−
0.38
)(0
.35)
(0.9
5)(4
.80)
BIN
D−0
.002
1−0
.027
0.02
80.
65∗∗
∗0.
034
−0.0
053∗
0.18
0.73
∗∗∗
(−0.
07)
(−0.
94)
(0.1
7)(3
.99)
(1.0
3)(−
1.82
)(1
.02)
(4.3
6)IT
INV×B
IND
0.82
18.1
8∗∗∗
0.82
18.1
8∗∗∗
3.80
20.9
8∗∗∗
3.80
20.9
8∗∗∗
(0.1
7)(3
.86)
(0.1
7)(3
.86)
(0.7
6)(4
.34)
(0.7
6)(4
.34)
FO
R−0
.078
0.02
40.
36−0
.054
−0.0
630.
039
0.16
0.04
4(−
1.46
)(0
.57)
(0.7
1)(−
0.31
)(−
1.14
)(0
.92)
(0.3
1)(0
.25)
ITIN
V×F
OR
11.8
1−2
.08
11.8
1−2
.08
6.05
0.15
6.05
0.15
(0.8
1)(−
0.39
)(0
.81)
(−0.
39)
(0.4
0)(0
.03)
(0.4
0)(0
.03)
Con
trol
sG
RO
WT
H0.
072∗∗
∗0.
096∗∗
∗0.
072∗∗
∗0.
096∗∗
∗0.
066∗∗
∗0.
086∗∗
∗0.
066∗∗
∗0.
086∗∗
∗
(6.8
3)(1
0.59
)(6
.83)
(10.
59)
(6.1
4)(9
.24)
(6.1
4)(9
.24)
LE
V−0
.014
−0.0
15∗∗
∗−0
.014
−0.0
15∗∗
∗−0
.013
−0.0
13∗∗
∗−0
.013
−0.0
13∗∗
∗
(−1.
61)
(−3.
19)
(−1.
61)
(−3.
19)
(−1.
44)
(−2.
77)
(−1.
44)
(−2.
77)
SHA
RE
0.00
057
−0.0
054
0.00
057
−0.0
054
0.00
13−0
.005
60.
0013
−0.0
056
(0.3
0)(−
1.49
)(0
.30)
(−1.
49)
(0.6
5)(−
1.50
)(0
.65)
(−1.
50)
Copyright 2010 John Wiley & Sons, Ltd. Strat. Mgmt. J., 32: 595–623 (2011)DOI: 10.1002/smj

612 J. L. Y. Ho, A. Wu, and S. X. Xu
Tabl
e5.
(Con
tinu
ed)
RO
A=
C(
13 ∑ k=1
βC kx
k)+
(1−
C)(
13 ∑ k=1
β1−
Ck
xk)+
α0+
Cα
C 0
DV
=cu
rren
t-pe
riod
RO
AD
V=
futu
reR
OA
(1)
Bas
em
odel
(2)
Join
tte
st(3
)B
ase
mod
el(4
)Jo
int
test
Les
sco
mpe
t.(C
=1)
†
Mor
eco
mpe
t.(C
=0)
†
Les
sco
mpe
t.(C
=1)
†
Mor
eco
mpe
t.(C
=0)
†
Les
sco
mpe
t.(C
=1)
†
Mor
eco
mpe
t.(C
=0)
†
Les
sco
mpe
t.(C
=1)
†
Mor
eco
mpe
t.(C
=0)
†
Coe
fβ
kC
(t-s
tat)
Coe
fβ
k1−C
(t-s
tat)
Coe
fβ
kC
(t-s
tat)
Coe
fβ
k1−C
(t-s
tat)
Coe
fβ
kC
(t-s
tat)
Coe
fβ
k1−C
(t-s
tat)
Coe
fβ
kC
(t-s
tat)
Coe
fβ
k1−C
(t-s
tat)
FC
F−0
.000
35−0
.000
21−0
.000
35−0
.000
21−0
.000
56−0
.000
19−0
.000
56−0
.000
19(−
0.35
)(−
1.13
)(−
0.35
)(−
1.13
)(−
0.55
)(−
0.95
)(−
0.55
)(−
0.95
)C
OM
P−0
.017
−0.0
13−0
.017
−0.0
13−0
.014
−0.0
17∗
−0.0
14−0
.017
∗
(−1.
49)
(−1.
28)
(−1.
49)
(−1.
28)
(−1.
24)
(−1.
70)
(−1.
24)
(−1.
70)
RD
−0.1
50.
047
−0.1
50.
047
−0.0
700.
11∗
−0.0
700.
11∗
(−0.
92)
(0.7
3)(−
0.92
)(0
.73)
(−0.
43)
(1.6
7)(−
0.43
)(1
.67)
AG
E−0
.000
300.
0004
8−0
.000
300.
0004
80.
0000
480.
0006
40.
0000
480.
0006
4(−
0.59
)(1
.12)
(−0.
59)
(1.1
2)(0
.09)
(1.4
7)(0
.09)
(1.4
7)L
agge
dR
OA
0.73
∗∗∗
0.80
∗∗∗
0.73
∗∗∗
0.80
∗∗∗
0.65
∗∗∗
0.74
∗∗∗
0.65
∗∗∗
0.74
∗∗∗
(17.
93)
(34.
58)
(17.
93)
(34.
58)
(15.
47)
(31.
20)
(15.
47)
(31.
20)
Bas
e0.
0039
0.00
390.
079∗∗
∗0.
079∗∗
∗0.
012
0.01
20.
10∗∗
∗0.
10∗∗
∗
inte
rcep
t(0
.36)
(0.3
6)(3
.88)
(3.8
8)(1
.05)
(1.0
5)(4
.87)
(4.8
7)D
iffe
rent
ial
0.04
4∗∗−0
.01
0.02
9−0
.032
Inte
rcep
t(2
.21)
(−0.
27)
(1.4
3)(−
0.82
)N
608
608
608
608
F-s
tatis
tic73
.69∗∗
∗73
.69∗∗
∗59
.90∗∗
∗59
.90∗∗
∗
R2
0.77
40.
774
0.73
60.
736
Adj
uste
dR
20.
764
0.76
40.
724
0.72
4
See
Tabl
e2
for
vari
able
defin
ition
s.∗∗
∗p
<0.
01;
∗∗p
<0.
05;
∗ p<
0.10
.†
C=
1fo
rfir
ms
with
abov
e-m
edia
nC
R4
;C
=0
for
firm
sw
ithbe
low
-med
ian
CR
4.
Copyright 2010 John Wiley & Sons, Ltd. Strat. Mgmt. J., 32: 595–623 (2011)DOI: 10.1002/smj

Corporate Governance and Information Technology Returns 613
Tabl
e6.
Lar
gefir
ms
vs.
smal
lfir
ms
RO
A=
A(
13 ∑ k=1
βA kx
k)+
(1−
A)(
13 ∑ k=1
β1−
Ak
xk)+
γ0+
Aγ
A 0
DV
=cu
rren
t-pe
riod
RO
AD
V=
futu
reR
OA
(1)
Bas
em
odel
(2)
Join
tte
st(3
)B
ase
mod
el(4
)Jo
int
test
Lar
gefir
ms
(A=
1)‡
Smal
lfir
ms
(A=
0)‡
Lar
gefir
ms
(A=
1)‡
Smal
lfir
ms
(A=
0)‡
Lar
gefir
ms
(A=
1)‡
Smal
lfir
ms
(A=
0)‡
Lar
gefir
ms
(A=
1)‡
Smal
lfir
ms
(A=
0)‡
Coe
fβ
kA
(t-s
tat)
Coe
fβ
k1−A
(t-s
tat)
Coe
fβ
kA
(t-s
tat)
Coe
fβ
k1−A
(t-s
tat)
Coe
fβ
kA
(t-s
tat)
Coe
fβ
k1−A
(t-s
tat)
Coe
fβ
kA
(t-s
tat)
Coe
fβ
k1−A
(t-s
tat)
ITIN
V−0
.028
−0.0
111.
26∗∗
∗2.
08∗∗
∗−0
.034
−0.0
14∗∗
1.51
∗∗∗
2.84
∗∗∗
(−0.
75)
(−1.
60)
(2.6
3)(2
.82)
(−0.
89)
(−1.
97)
(3.0
5)(3
.74)
BIN
D−0
.006
9−0
.039
0.31
∗∗0.
14−0
.012
−0.0
081
0.38
∗∗0.
26∗
(−0.
29)
(−1.
19)
(2.0
4)(0
.99)
(−0.
50)
(−0.
24)
(2.4
1)(1
.78)
ITIN
V×B
IND
8.50
∗4.
888.
50∗
4.88
10.4
6∗∗7.
33∗
10.4
6∗∗7.
33∗
(1.9
4)(1
.16)
(1.9
4)(1
.16)
(2.3
1)(1
.69)
(2.3
1)(1
.69)
FO
R−0
.002
4−0
.25∗∗
∗0.
180.
76∗
0.00
17−0
.26∗∗
0.19
1.07
∗∗
(−0.
08)
(−2.
33)
(0.9
9)(1
.85)
(0.0
5)(−
2.35
)(1
.04)
(2.5
3)IT
INV×F
OR
4.88
27.3
3∗∗4.
8827
.33∗∗
5.19
35.9
8∗∗5.
1935
.98∗∗
(0.9
2)(2
.00)
(0.9
2)(2
.00)
(0.9
5)(2
.55)
(0.9
5)(2
.55)
Con
trol
sG
RO
WT
H0.
061∗∗
∗0.
095∗∗
∗0.
061∗∗
∗0.
095∗∗
∗0.
058∗∗
∗0.
083∗∗
∗0.
058∗∗
∗0.
083∗∗
∗
(8.4
4)(2
2.84
)(8
.44)
(22.
84)
(7.7
0)(7
.87)
(7.7
0)(7
.87)
LE
V−0
.015
∗∗∗
−0.0
16∗∗
∗−0
.015
∗∗∗
−0.0
16∗∗
∗−0
.012
∗∗−0
.015
∗∗−0
.012
∗∗−0
.015
∗∗
(−3.
24)
(−2.
78)
(−3.
24)
(−2.
78)
(−2.
54)
(−2.
46)
(−2.
54)
(−2.
46)
SHA
RE
−0.0
0064
0.00
046
−0.0
0064
0.00
046
−0.0
019
0.00
076
−0.0
019
0.00
076
(−0.
34)
(0.2
7)(−
0.34
)(0
.27)
(−0.
97)
(0.4
4)(−
0.97
)(0
.44)
Copyright 2010 John Wiley & Sons, Ltd. Strat. Mgmt. J., 32: 595–623 (2011)DOI: 10.1002/smj

614 J. L. Y. Ho, A. Wu, and S. X. Xu
Tabl
e6.
(Con
tinu
ed)
RO
A=
A(
13 ∑ k=1
βA kx
k)+
(1−
A)(
13 ∑ k=1
β1−
Ak
xk)+
γ0+
Aγ
A 0
DV
=cu
rren
t-pe
riod
RO
AD
V=
futu
reR
OA
(1)
Bas
em
odel
(2)
Join
tte
st(3
)B
ase
mod
el(4
)Jo
int
test
Lar
gefir
ms
(A=
1)‡
Smal
lfir
ms
(A=
0)‡
Lar
gefir
ms
(A=
1)‡
Smal
lfir
ms
(A=
0)‡
Lar
gefir
ms
(A=
1)‡
Smal
lfir
ms
(A=
0)‡
Lar
gefir
ms
(A=
1)‡
Smal
lfir
ms
(A=
0)‡
Coe
fβ
kA
(t-s
tat)
Coe
fβ
k1−A
(t-s
tat)
Coe
fβ
kA
(t-s
tat)
Coe
fβ
k1−A
(t-s
tat)
Coe
fβ
kA
(t-s
tat)
Coe
fβ
k1−A
(t-s
tat)
Coe
fβ
kA
(t-s
tat)
Coe
fβ
k1−A
(t-s
tat)
FC
F−0
.000
38∗∗
−0.0
029∗∗
∗−0
.000
38∗∗
−0.0
029∗∗
∗−0
.000
30∗
−0.0
28∗∗
−0.0
0030
∗−0
.028
∗∗
(−2.
16)
(−3.
09)
(−2.
16)
(−3.
09)
(−1.
68)
(−2.
87)
(−1.
68)
(−2.
87)
CO
MP
−0.0
12−0
.028
∗−0
.012
−0.0
28∗
−0.0
18∗∗
−0.0
21−0
.018
−0.0
21(−
1.55
)(−
1.78
)(−
1.55
)(−
1.78
)(−
2.20
)(−
1.29
)(−
2.20
)(−
1.29
)R
D0.
038
−0.0
220.
038
−0.0
220.
14∗
0.05
10.
14∗
0.05
1(0
.48)
(−0.
27)
(0.4
8)(−
0.27
)(1
.71)
(0.6
1)(1
.71)
(0.6
1)A
GE
−0.0
0018
0.00
098∗
−0.0
0018
0.00
098∗
−0.0
0005
10.
0011
∗∗−0
.000
051
0.00
11∗∗
(−0.
53)
(1.8
7)(−
0.53
)(1
.87)
(−0.
14)
(2.1
0)(−
0.14
)(2
.10)
Lag
ged
RO
A0.
82∗∗
∗0.
68∗∗
∗0.
82∗∗
∗0.
68∗∗
∗0.
75∗∗
∗0.
63∗∗
∗0.
75∗∗
∗0.
63∗∗
∗
(32.
77)
(22.
84)
(32.
77)
(22.
84)
(29.
22)
(20.
36)
(29.
22)
(20.
36)
Bas
e0.
045∗∗
∗0.
045∗∗
∗0.
10∗∗
∗0.
10∗∗
∗0.
038∗∗
0.03
8∗∗0.
13∗∗
∗0.
13∗∗
∗
inte
rcep
t(2
.98)
(2.9
8)(3
.67)
(3.6
7)(2
.44)
(2.4
4)(4
.41)
(4.4
1)D
iffe
rent
ial
−0.0
25−0
.037
−0.0
14−0
.049
Inte
rcep
t(−
1.37
)(−
1.09
)(−
0.74
)(−
1.39
)N
718
718
718
718
F-s
tatis
tic86
.82∗∗
∗86
.82∗∗
∗69
.69∗∗
∗69
.69∗∗
∗
R2
0.77
30.
773
0.73
20.
732
Adj
uste
dR
20.
764
0.76
40.
721
0.72
1
See
Tabl
e2
for
vari
able
defin
ition
s.∗∗
∗p
<0.
01;
∗∗p
<0.
05;
∗ p<
0.10
‡A
=1
for
firm
sw
ithab
ove-
med
ian
ASS
ET
S;A
=0
for
firm
sw
ithbe
low
-med
ian
ASS
ET
S
Copyright 2010 John Wiley & Sons, Ltd. Strat. Mgmt. J., 32: 595–623 (2011)DOI: 10.1002/smj

Corporate Governance and Information Technology Returns 615
made no IT investment, foreign investors’ sug-gestions for general management might be unsuit-able for local environments, consistent with theargument about ‘liability of foreignness’ (Vernon,1966; Zaheer, 1995). In Columns (2) and (4), thecoefficient of FOR becomes positive for smallfirms, indicating the benefit of foreign ownershipexpected at the mean value of IT investment. Theseresults suggest that foreign investment does notalways benefit small firms, and we need to addressits involvement in a specific managerial activitylike IT management.
Results for the controls remain qualitatively sim-ilar to those based on the full sample, except thatRD is significantly positive for large firms andAGE is significantly positive for small firms. Thisresult supports the notion that larger firms have anadvantage in innovations due to economies of scaleand tolerance to risks in innovations (Damanpour,1996). The result for AGE suggests that smallinstead of large firms seem to benefit from resourcebuildup over time. The coefficients on COMP arenegative, but the varying significance levels resultin no conclusive evidence about its role across sizeclasses.
Sensitivity analysis
We conduct several tests to examine the robustnessof the regression results to alternative measuresand model specifications. Table 7 presents resultsof regressions using future ROA as the dependentvariable. Results based on current ROA are quali-tatively the same (and thus not tabulated). Resultsin Table 7 show that our results are robust.
Alternative measures for board independence
Affiliated and nonaffiliated directors may result indifferent degrees of board independence (Klein,1998). Panel A of Table 7 uses the proportionof nonaffiliated directors to measure BIND, whichis more conservative (e.g., Klein, 1998; Yermack,1996). We then conduct a factor analysis to cre-ate a composite index based on the proportionof affiliated directors (AFF ) and the proportionof nonaffiliated directors (NONAFF ): BIND =(1.14 × NONAFF + 0.65 × AFF). This indexassigns a higher weight to nonaffiliated directorsthan affiliated directors. Regressions using thismeasure are reported in Panel B. Results in PanelsA and B show significantly positive coefficients
on ITINV×BIND in more competitive industriesand for both large and small firms, and signif-icantly positive coefficients on ITINV×FOR forsmall firms.
IT stock
Another test shows that using annual IT spending(Tables 4–6) and IT stock (Panel C of Table 7)generate qualitatively similar results. This test usesIT stock (ITSTOCK ), aggregated based on annualIT expenditures,9 to test Hypotheses 1–4. Exceptfor the positive coefficient of ITSTOCK×BIND,which is marginally significant for small firms(p = 0.122), we observe highly consistent results:BIND moderates IT returns in more competitiveindustries, and FOR moderates IT returns for smallfirms.
Excess control right
We also examine the role of foreign ownership incompanies with excess control right, that is, con-trol right of the largest shareholder in excess ofits cash flow right (Fan and Wong, 2005; Joh,2003; Lemmon and Lins, 2003). This test notonly examines an important feature of emergingmarkets (Denis and McConnell, 2003; Hoskissonet al., 2005) but also provides additional support toour results. Recall that we predict foreign investorswill attempt to help improve firm performance.However, some factors may decrease the incen-tive for foreign investors to contribute expertise inIT management, which then limits the benefits thatcan be achieved. The excess control may be onesuch conflicting factor. We find that, in the sam-ple with high excess control, foreign ownershipplays an insignificant role. As the excess controlinduces the controlling shareholder to expropri-ate firm value (Dennis and McConnell, 2003; Fan
9 We follow the literature to compute IT stock (e.g., Dewanet al., 2007; Hitt and Brynjolfsson, 1996; Kudyba and Diwan,2002). There are two components of IT stock: hardware capitaland capitalized value of IT labor spending. Estimates from theliterature suggest that the value depletion period of computerhardware is three years (e.g., Hitt and Brynjolfsson, 1996;Lichtenberg, 1995). We thus use an annual depletion rate of 1
/3
and aggregate annual spending on hardware in years t-2, t-1, andt to form hardware capital in year t. If hardware expenditure inone year is missing in our dataset, we use the expenditure inthe subsequent year as an approximation (Hitt and Brynjolfsson,1996). The capitalized value of IT labor spending, according tothe literature, is estimated to be three times the annual IT laborspending (Dewan et al., 2007; Hitt and Brynjolfsson, 1996).
Copyright 2010 John Wiley & Sons, Ltd. Strat. Mgmt. J., 32: 595–623 (2011)DOI: 10.1002/smj

616 J. L. Y. Ho, A. Wu, and S. X. Xu
Table 7. Sensitivity analysis
Panel A: Alternative measure for BIND, proportion of non-affiliated directors
(2)Less competitive vs.
more competitive industries
(3)Large firms vs. small firms
(1)Full sample
(C = 1)† (C = 0)† (A = 1)‡ (A = 0)‡
Coef βk
(t-stat)Coef βk
C
(t-stat)Coef βk
1−C
(t-stat)Coef βk
A
(t-stat)Coef βk
1−A
(t-stat)
ITINV 1.31∗∗∗ 0.98 2.11∗∗∗ 1.24∗∗∗ 2.87∗∗∗
(3.95) (1.27) (4.22) (2.65) (3.82)BIND 0.63∗∗∗ 0.33 0.90∗∗∗ 0.43∗ 0.51∗∗
(3.92) (1.35) (3.66) (1.87) (2.11)ITINV×BIND 17.97∗∗∗ 8.56 26.46∗∗∗ 12.02∗ 14.97∗∗
(3.85) (1.20) (3.69) (1.81) (2.10)FOR 0.043 0.23 0.19 0.30∗ 0.99∗∗
(0.87) (0.45) (1.11) (1.70) (2.35)ITINV×FOR 0.75 7.79 4.57 8.23 33.37∗∗
(0.57) (0.52) (0.89) (1.60) (2.39)Controls in Tables 4–6 Included Included Included Included IncludedN 718 608 718F -statistic 136.89∗∗∗ 59.03∗∗∗ 69.51∗∗∗
R2 0.717 0.733 0.731Adjusted R2 0.711 0.721 0.721
Panel B: Alternative measure for BIND, a composite index
(2)Less competitive vs.
more competitive industries
(3)Large firms vs. small firms
(1)Full sample
(C = 1)† (C = 0)† (A = 1)‡ (A = 0)‡
Coef βk
(t-stat)Coef βk
C
(t-stat)Coef βk
1−C
(t-stat)Coef βk
A
(t-stat)Coef βk
1−A
(t-stat)
ITINV 1.73∗∗∗ 0.81 2.93∗∗∗ 1.70∗∗∗ 2.87∗∗∗
(4.70) (1.05) (5.16) (3.12) (3.79)BIND 0.37∗∗∗ 0.14 0.62∗∗∗ 0.32∗∗ 0.22∗∗
(4.78) (1.16) (4.73) (2.53) (1.98)ITINV×BIND 10.39∗∗∗ 2.96 18.03∗∗∗ 8.83∗∗ 6.17∗
(4.61) (0.83) (4.73) (2.43) (1.88)FOR 0.033 0.19 0.024 0.20 1.01∗∗
(0.68) (0.36) (0.14) (1.06) (2.37)ITINV×FOR 0.54 6.78 −0.34 5.27 34.06∗∗
(0.41) (0.45) (−0.06) (0.98) (2.40)Controls in Tables 4–6 Included Included Included Included IncludedN 718 608 718F -statistic 138.99∗∗∗ 60.46∗∗∗ 69.89∗∗∗
R2 0.720 0.738 0.732Adjusted R2 0.714 0.726 0.722
See Table 2 for variable definitions. ∗∗∗ p < 0.01; ∗∗ p < 0.05; ∗ p < 0.10.† C = 1 for firms with above-median CR4 ; C = 0 for firms with below-median CR4.‡ A = 1 for firms with above-median ASSETS ; A = 0 for firms with below-median ASSETS.
Copyright 2010 John Wiley & Sons, Ltd. Strat. Mgmt. J., 32: 595–623 (2011)DOI: 10.1002/smj

Corporate Governance and Information Technology Returns 617
Table 7. (Continued )
Panel C: IT stock§
(2)Less competitive vs.
more competitive industries
(3)Large firms vs. small firms
(1)Full sample
(C = 1)† (C = 0)† (A = 1)‡ (A = 0)‡
Coef βk
(t-stat)Coef βk
C
(t-stat)Coef βk
1−C
(t-stat)Coef βk
A
(t-stat)Coef βk
1−A
(t-stat)
ITSTOCK 0.81∗∗∗ 0.42 1.54∗∗∗ 0.69∗∗ 1.22∗∗∗
(4.63) (1.00) (5.54) (2.43) (3.53)BIND 0.38∗∗∗ 0.072 0.91∗∗∗ 0.35∗∗ 0.24
(3.90) (0.46) (5.20) (2.37) (1.64)ITSTOCK×BIND 5.71∗∗∗ 0.38 14.25∗∗∗ 5.33∗∗ 3.58
(3.71) (0.15) (5.18) (2.25) (1.55)FOR 0.15 0.062 −0.15 0.13 0.81∗∗
(1.07) (0.13) (−0.90) (0.76) (2.11)ITSTOCK×FOR 2.23 1.71 −3.17 1.85 14.55∗∗
(0.97) (0.24) (−1.12) (0.67) (2.14)Controls in Tables 4–6 Included Included Included Included IncludedN 718 608 718F -statistic 138.76∗∗∗ 60.97∗∗∗ 69.49∗∗∗
R2 0.719 0.740 0.731Adjusted R2 0.714 0.727 0.721
Panel D: Sample split based on excess control right�
Excess control right above median Excess control right below median
Coefficient(t-stat)
Coefficient(t-stat)
ITINV 0.90∗ 3.08∗∗∗
(1.93) (4.96)BIND 0.32∗∗ 0.53∗∗∗
(2.50) (2.81)ITINV×BIND 8.40∗∗ 15.11∗∗∗
(2.18) (2.77)FOR −0.023 0.89∗∗∗
(−0.13) (2.61)ITINV×FOR −1.94 26.16∗∗∗
(−0.34) (2.64)Controls in Tables 4–6 Included IncludedN 718F -statistic 68.40∗∗∗
R2 0.728Adjusted R2 0.717
See Table 2 for variable definitions. ∗∗∗ p < 0.01; ∗∗ p < 0.05; ∗ p < 0.10.† C = 1 for firms with above-median CR4 ;C = 0 for firms with below-median CR4.‡ A = 1 for firms with above-median ASSETS ; A = 0 for firms with below-median ASSETS.§ ITSTOCK = accumulated IT stock scaled by total assets. The accumulated IT stock is aggregated based on annual IT expendituresover three years.� Excess control right = control right of the largest shareholder in excess of (i.e., minus) its cash flow right.
Copyright 2010 John Wiley & Sons, Ltd. Strat. Mgmt. J., 32: 595–623 (2011)DOI: 10.1002/smj

618 J. L. Y. Ho, A. Wu, and S. X. Xu
and Wong, 2005; Joh, 2003), it results in conflictsbetween the controlling shareholder and foreignowners. Conversely, the absence of excess controlleads to an environment where foreign investorsare motivated to contribute expertise in IT manage-ment. Indeed, Panel D shows that foreign owner-ship plays a significant role in the sample featuringlow excess control. This result lends support to ourconceptual argument regarding the role of foreignownership.
Endogeneity issue
We follow Bascle’s (2008) suggestion to addresspossible endogeneity by the Heckman approachand the instrumental variable method. First, wedevelop a probit model to explain IT investmentbased on an ‘IT needs’ model in the literature(Mitra, 2005). The model uses a firm’s observ-able IT spending to proxy for its latent IT needs,and attributes IT spending to the firm’s free cashflow and growth options. We adopt this modeland further include the two governance factors(BIND and FOR), firm size (ASSETS ), and indus-try dummies (Mitra, 2005).10 We then create theinverse Mills ratio and use it to control for thepossible self-selection (Bharadwaj, Bharadwaj, andBendoly, 2007; Shaver, 1998). The results (untabu-lated) show that the coefficient on the inverse Millsratio is insignificant, and all coefficients on othervariables are qualitatively similar, suggesting thatthe possible endogeneity bias due to self-selectiondoes not harmfully affect our results (Heckman,1979). Second, our untabulated results using theinstrument variable (IV) method also confirm therobustness of our results.11
10 We find that IT spending is negatively related to growthoptions but positively related to the interaction between growthoptions and free cash flows. These results suggest that, condition-ing on substantial free cash flows, firms with high growth optionswould have high IT needs (Mitra, 2005). The coefficients onBIND and FOR are significantly negative and significantly pos-itive, respectively. Firms are likely to invest more in IT if theyfeature lower board independence and higher foreign ownership,because knowledge spillover associated with foreign ownershipmay encourage IT investment and independent directors helpcontrol the volume of investment.11 We use the industry median investment volume as an IV (Levand Sougiannis, 1996). We also add more IVs concerning capitalcosts and investment constraints (the leverage ratio, and thefirm’s beta, a measure of the volatility of the firm’s stock marketprice that is a driver of the cost of capital), which are used byprior research as IVs for IT investment (Brynjolfsson and Hitt,2003). These tests generate consistent results.
Alternative measure for industry competitiveness
Following the literature (e.g., Lambson and Jensen,1998), we measure industry competitiveness byanother variable—entry costs (ENTCOST )—defined as the weighted average gross value ofproperty, plant, and equipment for firms in oneindustry, weighted by each firm’s market sharein the industry. The higher the entry costs, thehigher the industry concentration and the lowerthe industry competitiveness (Porter, 2001). Werank all firms in our sample by ENTCOST anddivide them at the median. Firms with ENTCOSTabove the sample median form the less compet-itive industries, and firms with ENTCOST belowthe median form the more competitive industries.The untabulated results offer consistent support forour finding that board independence moderates ITvalue in more competitive industries.
CONCLUDING REMARKS
This section summarizes the above results andcontextualizes our findings in Taiwan relative toprior studies in similar research settings. Consis-tent with prior research in emerging markets (Tam,1998; Dewan and Kraemer, 2000), we find noconclusive evidence for IT’s contribution to firmperformance. IT contributes to firm performanceonly in the presence of complementary corporategovernance structures, supporting the notion thataddressing agency problems is an important under-taking in international research contexts (Geda-jlovic and Shapiro, 1998; Hoskisson et al., 2005).Specifically, we find moderating effects of boardindependence and foreign ownership on IT value,highlighting their roles as organizational resourcescomplementary to IT investment. These moderat-ing roles are new evidence added to the literatureon IT returns.
Regarding board independence, we find mixedresults about its relation to firm performance, andthe relation differs in significance across differentlevels of IT investment and competition. This is incontrast to the evidence of a positive value impli-cation of corporate governance in Durnev and Kim(2005) and Klapper and Love (2004), and that ofboard independence shown by Choi et al. (2007)and Young et al. (2008). One explanation couldbe the different variables and methods used, asdiscussed earlier in the hypotheses developmentsection. Overall, our result is consistent with the
Copyright 2010 John Wiley & Sons, Ltd. Strat. Mgmt. J., 32: 595–623 (2011)DOI: 10.1002/smj

Corporate Governance and Information Technology Returns 619
literature review by Denis and McConnell (2003)in an international setting, as well as more recentevidence that still suggests an inconclusive rela-tion of board independence with firm performance(Bai et al., 2004; Peng, 2004). Furthermore, ourresult shows new evidence, which prior studieslack, about how board independence moderatesIT returns and how the moderating effect differsacross industries.
Specifically, we find no moderating effect ofboard independence on the IT investment-firm per-formance relation in less competitive industries. Incontrast, in more competitive industries, there isa significant interaction effect between IT invest-ment and board independence, which is positivelyrelated to firm performance. Information technolo-gies help firms improve performance in compet-itive environments, while the economic returnsto IT investment are positively related to boardindependence. This supports the conjecture thatthe corporate board plays a monitoring role innew technology investment. Our findings showthat board monitoring benefits intensely compet-itive industries more than those that are less com-petitive. Clearly, the relations between IT returns,board independence, and industry competitivenessare rather complex. While we have not completelydisentangled the effects, our results offer insightsinto the role of corporate governance in achievingreturns on IT investment.
Moreover, the direct association between for-eign ownership and firm performance suggests thatforeign ownership may not always improve firmperformance. The Taiwanese stock market has ahigh quality of liquidity. Becht, Bolton, and Roell(2003) suggest that once the market has abundantliquidity, foreign investors have the option to sellthe stake rather than to intervene. The limitingmonitoring role might explain the insignificanceof foreign ownership. While the direct relationbetween foreign ownership and firm performanceis consistent with prior research (e.g., Qi et al.,2000; Tan, 2002), we contribute to the literatureby showing a significant and positive interactionbetween IT investment and foreign ownership forsmall firms. Foreign investors may inject IT exper-tise that is likely to be applicable across industri-alized and emerging markets. Hence, foreign own-ership may help small firms to more effectivelydeploy IT. As an implication for research on corpo-rate governance, our results suggest that analysis ofgovernance structures needs to be situated within
specific contexts such as firm size and industrycompetitiveness. Before discussing the managerialimplications of our results, we briefly point outsome limitations of our study.
First, we view our work as an initial attemptto analyze the moderation of two corporate gover-nance structures on IT value. One line of futureinquiry is to investigate other corporate gover-nance variables (e.g., number of board meetingsand directors’ industry expertise). Second, futurestudies can cross-validate our results about for-eign ownership using complementary methodolo-gies. For instance, field research can detail howforeign investors are involved in making IT invest-ment decisions and what knowledge and expe-rience are transferred with foreign ownership.Third, although we have examined both annual ITinvestment and accumulated IT stock, and bothcurrent and future firm performance, the cross-sectional nature of the dataset limits our abil-ity to draw conclusions about causality. Readersneed to be aware of this limitation when interpret-ing the results. Notwithstanding these limitations,our study makes significant contributions to bothresearch and practices.
As an important implication for firms consider-ing IT investment, our results suggest that compet-itive firms should be more proactive in using IT toimprove performance. Yet, IT alone does not holdthe answer to performance improvement and mustbe combined with better monitoring and advisingby independent boards to reap the benefits. Ourresults also imply that foreign ownership can helpsmaller firms transcend barriers to IT returns. Man-agers need to realize that with foreign investorsinvolved, their firms are more likely to attain per-formance improvement through IT. However, theevidence should not be interpreted as discourag-ing IT investment at firms with little or no foreignownership, because there are approaches other thanspillover that are considered in acquiring IT-relatedknowledge. Overall, an important message to man-agers is that management control systems play acrucial role in the impact of IT across differentstructures of markets and firms.
In conclusion, the contribution of this studylies in its evaluation of the moderation effectsof corporate governance on IT value creation.Our study provides one theoretical lens throughwhich different outcomes of IT are analyzed. Theevidence also shows the usefulness of studyingthe role of corporate governance in a specific
Copyright 2010 John Wiley & Sons, Ltd. Strat. Mgmt. J., 32: 595–623 (2011)DOI: 10.1002/smj

620 J. L. Y. Ho, A. Wu, and S. X. Xu
investment activity, rather than linking it directlyto overall firm performance. These directions maylead to fruitful areas of future inquiry.
ACKNOWLEDGMENTS
We thank Kevin Kobelsky, Saby Mitra, PaulTallon, workshop participants at University of Cal-ifornia, Irvine, Nanjing University, and TsinghuaUniversity, and participants at the AmericanAccounting Association Annual Meetings, theAsia-Pacific International Accounting Conference,and the China Summer Workshop on InformationManagement for their valuable comments. Also,we thank Daphne Chang and Zhi-hong Chen forresearch assistance. Sean Xin Xu acknowledgesfinancial support from the Program for New Cen-tury Excellent Talents in University (NCET-10-0508) and the National Natural Science Foundationof China (#70831003 and #70890080).
REFERENCES
Abrahamson E, Rosenkopf L. 1997. Social networkeffects on the extent of innovation diffusion: acomputer simulation. Organization Science 8(3):289–309.
Aitken BJ, Harrison G. 1999. Do domestic firmsbenefit from direct foreign investment? Evidencefrom Venezuela. American Economic Review 89(3):605–618.
Anderson MC, Banker RD, Ravindran S. 2006. Valueimplications of investments in information technology.Management Science 52(9): 1359–1376.
Bai CE, Liu Q, Lu J, Song FM, Zhang J. 2004. Corporategovernance and market valuation in China. Journal ofComparative Economics 32(4): 599–616.
Barney J. 1991. Firm resources and sustained competitiveadvantage. Journal of Management 17(1): 99–120.
Bascle G. 2008. Controlling for endogeneity withinstrumental variables in strategic managementresearch. Strategic Organization 6(3): 285–327.
Beasley MS, Carcello JV, Hermanson DR, Lapides PD.2000. Fraudulent financial reporting: consideration ofindustry traits and corporate governance mechanisms.Accounting Horizons 14(4): 441–454.
Becht M, Bolton P, Roell A. 2003. Corporate governanceand control. In Handbook of the Economics of Finance(Volume 1A) Corporate Finance, Constantinides GM,Harris M, Stulz RM (eds). Elsevier: Amsterdam,TheNetherlands; Chap. 1.
Bhagat S, Black B. 2002. The non-correlation betweenboard independence and long-term firm performance.Journal of Corporation Law 27(2): 231–273.
Bharadwaj AS, Bharadwaj SG, Bendoly E. 2007. Theperformance effects of complementarities between
information systems, marketing, manufacturing, andsupply chain processes. Information Systems Research18(4): 437–453.
Black BS, Jang H, Kim W. 2006. Does corporate gover-nance predict firms’ market values? Evidence fromKorea. Journal of Law Economics & Organization22(2): 366–413.
Braga H, Willmore L. 1991. Technological imports andtechnological effort: an analysis of their determinantsin Brazilian firms. Journal of Industrial Economics39(4): 421–432.
Brown LD, Caylor ML. 2006. Corporate governance andfirm valuation. Journal of Accounting and PublicPolicy 25(4): 409–434.
Brush TH, Bromiley P, Hendrickx M. 2000. The freecash flow hypothesis for sales growth and firmperformance. Strategic Management Journal 21(4):455–472.
Brynjolfsson E, Hitt LM. 2003. Computing productivity:firm-level evidence. Review of Economics andStatistics 85(4): 793–808.
Bushee BJ. 1998. The influence of institutional investorson myopic R&D investment behavior. AccountingReview 73(3): 305–333.
Carpenter MA, Pollock TG, Leary MM. 2003. Testinga model of reasoned risk-taking: governance, theexperience of principals and agents, and globalstrategy in high-technology IPO firms. StrategicManagement Journal 24(9): 803–820.
Carter DA, Simkins BJ, Simpson WG. 2003. Corporategovernance, board diversity, and firm value. FinancialReview 38(1): 33–53.
Caves RE. 1996. Multinational Enterprise and EconomicAnalysis (2nd edn). Cambridge University Press: NewYork.
Chan YE. 2000. IT value: the great divide betweenqualitative and quantitative and individual andorganizational measures. Journal of ManagementInformation Systems 16(4): 225–261.
Chari MDR, Devaraj S, David P. 2008. The impact ofinformation technology investments and diversifica-tion strategies on firm performance. Management Sci-ence 54(1): 224–234.
Chiang Y, Kuo C. 2006. Characteristics of firms ownedby foreigners on the Taiwanese stock market: ananalysis. International Journal of Management 23(3):721–728.
Chibber PK, Majumdar SK. 1999. Foreign ownershipand profitability: property rights, control and theperformance of firms in Indian industry. Journal ofLaw and Economics 42(1): 209–238.
Choi JJ, Park SW, Yoo SS. 2007. The value of outsidedirectors: evidence from corporate governance reformin Korea. Journal of Financial and QuantitativeAnalysis 42(4): 941–962.
Claessens S, Djankov S, Lang LHP. 2000. The separationof ownership and control in East Asian corporations.Journal of Financial Economics 58(1/2): 81–112.
Cohen WM, Levin RC. 1989. Empirical studies of inno-vation and market structure. In Handbook of IndustrialOrganization , Schmalensee R, Willig R (eds). Else-vier: Amsterdam, The Netherlands; 1059–1107.
Copyright 2010 John Wiley & Sons, Ltd. Strat. Mgmt. J., 32: 595–623 (2011)DOI: 10.1002/smj

Corporate Governance and Information Technology Returns 621
Daily CM, Dalton DR. 1994. Bankruptcy and corporategovernance: the impact of board composition andstructure. Academy of Management Journal 37(6):1603–1617.
Dalton DR, Daily CM, Ellstrand AE, Johnson JL. 1998.Meta-analytic reviews of board composition, leader-ship structure, and financial performance. StrategicManagement Journal 19(3): 269–290.
Damanpour F. 1996. Organizational complexity and inno-vation: developing and testing multiple contingencymodels. Management Science 42(5): 693–716.
Dedrick J, Kraemer KL. 2005. The impacts of IT on firmand industry structure: the personal computer industry.California Management Review 47(3): 122–142.
Denis DK, McConnell JJ. 2003. International corporategovernance. Journal of Financial and QuantitativeAnalysis 38(1): 1–36.
Devaraj S, Kohli R. 2003. Performance impacts ofinformation technology: is actual usage the missinglink? Management Science 49(3): 273–289.
Dewan S, Kraemer KL. 2000. Information technologyand productivity: evidence from country-level data.Management Science 46(4): 548–562.
Dewan S, Shi C, Gurbaxani V. 2007. Investigating therisk-return relationship of information technologyinvestment: firm-level empirical analysis. Manage-ment Science 53(12): 1829–1842.
Dong S, Xu SX, Zhu KX. 2009. Information technologyin supply chains: the value of IT-enabled resourcesunder competition. Information Systems Research20(1): 18–32.
Douma S, George R, Kabir R. 2006. Foreign anddomestic ownership, business groups, and firmperformance: evidence from a large emerging market.Strategic Management Journal 27(7): 637–657.
Durnev A, Kim EH. 2005. To steal or not to steal: firmattributes, legal environment, and valuation. Journalof Finance 60(3): 1461–1493.
Einhorn B. 2005. Why Taiwan matters: the globaleconomy couldn’t function without it. Business Week16 May: 76–81.
Erickson M. 1998. The effect of taxes on the structureof corporate acquisitions. Journal of AccountingResearch 36(2): 279–298.
Fama EF, Jensen MC. 1983. Agency problems andresidual claims. Journal of Labor Economics 26(2):327–349.
Fan JPH, Wong TJ. 2005. Do external auditors performa corporate governance role in emerging markets?Evidence from East Asia. Journal of AccountingResearch 43(1): 35–72.
Forman C. 2005. The corporate digital divide: determi-nants of Internet adoption. Management Science 51(4):641–654.
Friedrich RJ. 1982. In defense of multiplicative termsin multiple regression equations. American Journal ofPolitical Science 26(4): 797–833.
Gedajlovic E, Shapiro DM. 1998. Management andownership effects: evidence from five countries.Strategic Management Journal 19(6): 533–553.
Gedajlovic E, Shapiro DM. 2002. Ownership structureand firm profitability in Japan. Academy of Manage-ment Journal 45(2): 565–575.
Graham J. 1999. Herding among investment newsletters:theory and evidence. Journal of Finance 54(1):237–269.
Gujarati DN. 1988. Basic Econometrics (2nd edn).McGraw-Hill: New York.
Heckman J. 1979. Sample selection bias as a specificationerror. Econometrica 47(1): 153–161.
Hermalin BE. 1992. The effects of competition onexecutive behavior. Rand Journal of Economics 23(3):350–365.
Hermalin BE, Weisbach MS. 2003. Boards of directorsas an endogenously determined institution: a surveyof the economic literature. Economic Policy Review9(1): 7–26.
Hitt LM, Brynjolfsson E. 1996. Productivity, businessprofitability, and consumer surplus: three differentmeasures of information technology value. MISQuarterly 20(2): 121–142.
Hoskisson RE, Johnson RA, Tihanyi L, White RE. 2005.Diversified business groups and corporate refocusingin emerging economies. Journal of Management31(6): 941–965.
Hu AGZ, Jefferson GH, Qian J. 2005. R&D andtechnology transfer: firm-level evidence from Chineseindustry. Review of Economics and Statistics 87(4):780–786.
IDC. 2006. Worldwide IT spending 2006–2010 forecastby vertical market. International Data Corporation:Framingham, MA.
Jensen MC. 1986. Agency costs of free cash flow,corporate finance, and takeovers. American EconomicReview 76(2): 323–329.
Jensen MC, Meckling WH. 1976. Theory of the firm:managerial behavior, agency costs and ownershipstructure. Journal of Financial Economics 3(4):305–360.
Joh SW. 2003. Corporate governance and firm profitabil-ity: evidence from Korea before the economic crisis.Journal of Financial Economics 68(2): 287–322.
Kauffman RJ, Li X. 2003. Payoff externalities, informa-tional cascades and managerial incentives: a theoreti-cal framework for IT adoption herding. In Proceedingsof the 2003 INFORMS Conference on IS and Technol-ogy : Atlanta, GA.
Klapper LF, Love I. 2004. Corporate governance,investor protection, and performance in emergingmarkets. Journal of Corporate Finance 10(5):703–728.
Klein A. 1998. Firm performance and board committeestructure. Journal of Law and Economics 41(1):275–303.
Klein A. 2002a. Audit committee, board of directorcharacteristics, and earnings management. Journal ofAccounting and Economics 33(3): 375–400.
Klein A. 2002b. Economic determinants of auditcommittee independence. Accounting Review 77(2):435–452.
Kobelsky KW, Richardson JV, Smith RE, Zmud RW.2008. Determinants and consequences of firm
Copyright 2010 John Wiley & Sons, Ltd. Strat. Mgmt. J., 32: 595–623 (2011)DOI: 10.1002/smj

622 J. L. Y. Ho, A. Wu, and S. X. Xu
information technology budgets. Accounting Review83(4): 957–995.
Kohli R, Devaraj S. 2003. Measuring informationtechnology payoff: a meta-analysis of structuralvariables in firm-level empirical research. InformationSystems Research 14(2): 127–145.
Kor YK. 2006. Direct and interaction effects of topmanagement team and board compositions on R&Dinvestment strategy. Strategic Management Journal27(11): 1081–1099.
Kraemer KL, Dedrick J, Melville NP, Zhu K. 2006.Global E-Commerce: Impacts of National Environmentand Policy . Cambridge University Press: Cambridge,UK.
Kudyba S, Diwan R. 2002. Increasing returns toinformation technology. Information Systems Research13(1): 104–111.
Lambson VE, Jensen FE. 1998. Sunk costs and firm valuevariability: theory and evidence. American EconomicReview 88(1): 307–313.
La Porta R, Lopez-de-Silanes F, Shleifer A. 1999.Corporate ownership around the world. Journal ofFinance 54(2): 471–517.
Lemmon ML, Lins KV. 2003. Ownership structure,corporate governance, and firm value: evidence fromthe East Asian financial crisis. Journal of Finance58(4): 1445–1468.
Lev B, Sougiannis T. 1996. The capitalization, amortiza-tion, and value-relevance of R&D. Journal of Account-ing and Economics 21(1): 107–138.
Liang H, Saraf N, Hu Q, Xue Y. 2007. Assimilation ofenterprise systems: the effect of institutional pressuresand the mediating role of top management. MISQuarterly 31(1): 59–87.
Lichtenberg FR. 1995. The output contributions of com-puter equipment and personnel: a firm-level analy-sis. Economics of Innovation and New Technology 3:201–218.
Lyytinen K, King JL. 2006. Standard making: a criticalresearch frontier for information systems research.MIS Quarterly 30: 405–412.
Mak YT, Li Y. 2001. Determinants of corporateownership and board structure: evidence fromSingapore. Journal of Corporate Finance 7(3):235–256.
Mata FJ, Fuerst WL, Barney JB. 1995. Informationtechnology and sustained competitive advantage:a resource-based analysis. MIS Quarterly 19(4):487–505.
McAfee A, Brynjolfsson E. 2008. Investing in the ITthat makes a competitive difference. Harvard BusinessReview 86(7/8): 98–107.
McWilliams A, Siegel D. 2000. Corporate social respon-sibility and financial performance: correlation or mis-specification? Strategic Management Journal 21(5):603–609.
Melville N, Kraemer KL, Gurbaxani V. 2004. Informa-tion technology and organizational performance: anintegrative model of IT business value. MIS Quarterly28(2): 283–322.
Minton BA, Schrand C. 1999. The impact of cash flowvolatility on discretionary investment and the costs
of debt and equity financing. Journal of FinancialEconomics 54: 423–460.
Mitra S. 2005. Information technology as an enabler ofgrowth in firms: an empirical assessment. Journal ofManagement Information Systems 22(2): 279–300.
Nalebuff B, Stiglitz J. 1983. Information, competition,and markets. American Economic Review 73(2):278–283.
Peng MW. 2004. Outside directors and firm performanceduring institutional transitions. Strategic ManagementJournal 25(5): 453–471.
Peteraf MA. 1993. The cornerstones of competitiveadvantage: a resource-based view. Strategic Manage-ment Journal 14(3): 179–191.
Porter ME. 2001. Strategy and the Internet. HarvardBusiness Review 79(3): 63–78.
Powell TC, Dent-Micallef A. 1997. Information technol-ogy as competitive advantage: the role of human, busi-ness, and technology resources. Strategic ManagementJournal 18(5): 375–405.
Qi D, Wu W, Zhang H. 2000. Shareholding structure andcorporate performance of partially privatized firms:evidence from listed Chinese companies. Pacific-BasinFinance Journal 8(5): 587–610.
Ray G, Barney JB, Muhanna WA. 2004. Capabilities,business processes, and competitive advantage:choosing the dependent variable in empirical testsof the resource-based view. Strategic ManagementJournal 25(1): 23–37.
Rediker KJ, Seth A. 1995. Boards of directors and sub-stitution effects of alternative governance mechanisms.Strategic Management Journal 16(2): 85–99.
Scharfstein D. 1988. Product market competition andmanagerial slack. Rand Journal of Economics 19(1):147–155.
Scharfstein D, Stein J. 1990. Herd behavior andinvestment. American Economic Review 80(3):465–479.
Schmidt K. 1997. Managerial incentives and productmarket competition. Review of Economic Studies64(2): 191–213.
Shaver JM. 1998. Accounting for endogeneity whenassessing strategy performance: does entry modechoice affect FDI survival? Management Science44(4): 571–585.
Shleifer A, Vishny RW. 1997. A survey of corporategovernance. Journal of Finance 52(2): 737–783.
Stafford P. 2007. Big spenders reveal they know littleabout the value of IT assets. Financial Times 1October, 1.
Szymanski DM, Bharadwaj SG, Varadarajan PR. 1993.An analysis of the market share-profitability relation-ship. Journal of Marketing 57(3): 1–18.
Tam KY. 1998. The impact of information technologyinvestments on firm performance and evaluation:evidence from newly industrialized economies.Information Systems Research 9(1): 85–98.
Tan J. 2002. Impact of ownership type on environment-strategy linkage and performance: evidence from atransitional economy. Journal of Management Studies39(3): 333–354.
Copyright 2010 John Wiley & Sons, Ltd. Strat. Mgmt. J., 32: 595–623 (2011)DOI: 10.1002/smj

Corporate Governance and Information Technology Returns 623
Tan J, Peng MW. 2003. Organizational slack and firmperformance during economic transitions: two studiesfrom an emerging economy. Strategic ManagementJournal 24(13): 1249–1263.
Teece DJ. 2007. Explicating dynamic capabilities: thenature and microfoundations of (sustainable) enter-prise performance. Strategic Management Journal28(13): 1319–1350.
Teo HH, Wei KK, Benbasat I. 2003. Predicting intentionto adopt interorganizational linkages: an institutionalperspective. MIS Quarterly 27(1): 19–49.
Vernon R. 1966. International investment and interna-tional trade in the product life cycle. Quarterly Journalof Economics 80(2): 190–207.
Yermack D. 1996. Higher market valuation of companieswith a small board of directors. Journal of FinancialEconomics 40(2): 185–211.
Young C, Tsai LC, Hsieh PG. 2008. Voluntary appoint-ment of independent directors in Taiwan: motivesand consequences. Journal of Business, Finance &Accounting 35(9): 1103–1137.
Zaheer S. 1995. Overcoming the liability of foreignness.Academy of Management Journal 38(2): 341–363.
Zahra SA, Pearce JA II. 1989. Boards of directorsand corporate financial performance: a review andintegrative model. Journal of Management 15(2):291–334.
Zhu K, Kraemer KL, Xu SX. 2006. The process ofinnovation assimilation by firms in different countries:a technology diffusion perspective on e-business.Management Science 52(10): 1557–1576.
Copyright 2010 John Wiley & Sons, Ltd. Strat. Mgmt. J., 32: 595–623 (2011)DOI: 10.1002/smj