
ACTION PLAN: ENGLISH SYNDICATE: II SYNDICATE LEADER: Mrs. SHAMIM DADI

Corporate Governance and Loan SyndicateStructure
Sreedhar T. Bharath1, Sandeep Dahiya2 and Issam Hallak3
1Arizona State University
2Georgetown University
3European Joint Research Centre
2018 Chicago Financial Institutions Conference

Motivation
I Traditional View: For a borrower meeting debt obligations,creditors should have little say on operations and governance.
I Creditors matter for governance only in bankruptcy - Gale andHellwig (1985), Hart and Moore (1998)
I But, creditors play an active role in the governance of firmseven in non-default states - Nini, Smith and Sufi (2012),Roberts and Sufi (2009)
I Does firm governance impact credit contracts?
I Goal: develop causal evidence on the effect of corporategovernance mechanisms on creditor contracting.
I Hope: richer theory of the two way interaction betweencorporate governance and creditor control in firms
I What do we mean by “firm governance” and “creditcontracts”?
I Shareholder rights ⇒ Syndicate structure

Literature
I Shareholder Rights - Cottage industry of corporate governance
I Gompers, Ishi and Metricks (2003) - Equity PricesI Cremers, Nair, and Wei (2007) - Bond Prices
I Syndicate Structure is an important contracting deviceI Sufi (2007) - more concentrated syndicates for informationally
opaque and riskier firmsI Ivashina (2009) - information asymmetry between lead and
participants affects the cost of credit

Hypotheses
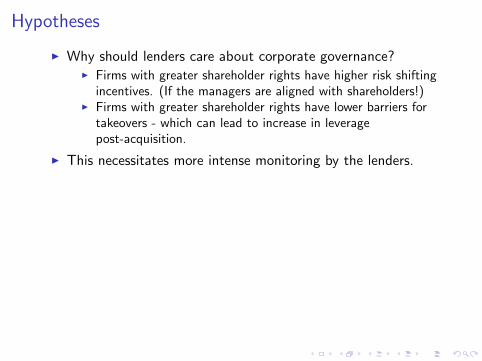
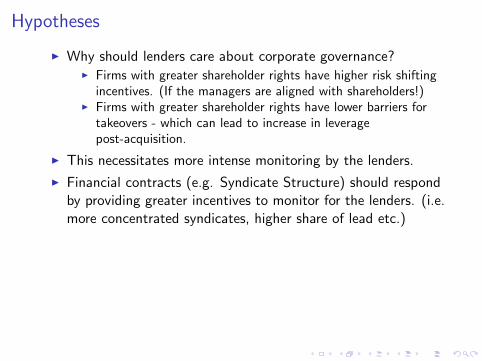
I Why should lenders care about corporate governance?
I Firms with greater shareholder rights have higher risk shiftingincentives. (If the managers are aligned with shareholders!)
I Firms with greater shareholder rights have lower barriers fortakeovers - which can lead to increase in leveragepost-acquisition.
I This necessitates more intense monitoring by the lenders.
I Financial contracts (e.g. Syndicate Structure) should respondby providing greater incentives to monitor for the lenders. (i.e.more concentrated syndicates, higher share of lead etc.)
Hypotheses
I Why should lenders care about corporate governance?I Firms with greater shareholder rights have higher risk shifting
incentives. (If the managers are aligned with shareholders!)I Firms with greater shareholder rights have lower barriers for
takeovers - which can lead to increase in leveragepost-acquisition.
I This necessitates more intense monitoring by the lenders.
I Financial contracts (e.g. Syndicate Structure) should respondby providing greater incentives to monitor for the lenders. (i.e.more concentrated syndicates, higher share of lead etc.)

Main Results
Do Shareholder Rights affect Syndicate Structure?
Yes they do!
I Natural experiment results - after the passage of anti- takeoverstatutes (ATS), the firms incorporated in those states have
I Significantly larger more diffused syndicatesI More likely to have a syndicated vis-a-vis sole lender loanI Results robust to recommendations by Karpoff and Wittry
(2015)
I Traditional regression resultsI Same results when using G-IndexI Robust to using specific anti-takover provisions (classified
board, poison pill etc.)
Main Results
Do Shareholder Rights affect Syndicate Structure?Yes they do!
I Natural experiment results - after the passage of anti- takeoverstatutes (ATS), the firms incorporated in those states have
I Significantly larger more diffused syndicatesI More likely to have a syndicated vis-a-vis sole lender loanI Results robust to recommendations by Karpoff and Wittry
(2015)
I Traditional regression resultsI Same results when using G-IndexI Robust to using specific anti-takover provisions (classified
board, poison pill etc.)

Empirical Setting
I Financial contracts (e.g. Syndicate Structure) should respondby providing greater incentives to monitor for the lenders.
I Syndicate Structure is proxied 3 different ways
1. Fraction retained by the “Lead Lender”2. Herfindhal Index (HHI) of the syndicate share3. Number of lenders in the syndicate
I Shareholder rights - Tricky - very factors that drive syndicatestructure could be driving choice of governance.
I Natural Experiment - Exogenous decrease in shareholder rightsof firms. Passage of second generation anti takeover laws.
I Prediction - After adoption of these ATS, need for monitoringdeclines syndicates should become more diffused.

Identification via exogeneous shock to the firm governance
I Based on the adoption of anti-takeover statutes (ATS) bydifferent states, most U.S. states adopted these in the late1980’s
I Used in several studies includingI Bertrand and Mullainathan 2003; Cheng, Nagar, and Rajan
2005
I Key variable “AfterATS” based on 3 types of ATS as outlinedby Cheng, Nagar, and Rajan 2005
1. control share acquisition (CS),2. fair price (FP),3. business combinations (BC)
I Define year 0 as year in which a state adopts the first of threelaws described above
I AfterATS takes value of 1 for all subsequent years and 0otherwise

Sample Details
I Now we have the main dependent variable (syndicatestructure) and the key variable of interest (AfterATS), we canstart estimation!
I Our sample is NOT a panel - consists of loans originating atdifferent points in time. We follow two different sampleconstruction methodologies and estimate our results on eachof them
I CALENDAR TIME SAMPLE: Focus on 1986-1991 periodI EVENT TIME SAMPLE: 7-year window for each state [+3,-3],
only those firms that had “syndicated” loan both before andafter the adoption of ATS

Time Line
Calendar year: 1986 1987 1988 1989 1990 1991 1992
Before After
Sample year: -1 0 +1 +2 +3 +4
Example : Law was passed in November 1987.
CALENDAR TIME SAMPLE: All loans in period 01/1986 to 12/1991.
Calendar year: 1986 1987 1988 1989 1990 1991 1992 1993
Before After
Sample year: -3 -2 -1 0 +1 +2 +3
Example 1: Law passed in September 1990.
EVENT TIME SAMPLE: Select treated firms in [-3,+3]

Univariate Analysis

Descriptive StatisticsPanel A: Calendar Time Sample, 1986 – 1991.
Variable Mean SD 25% 50% 75% N
% Held by Lead Bank 32.17 20.14 15.22 29.76 50.00 1,748Herfindahl 2,747 1,760 1,220 2,247 4,158 1,748# Lenders 8.17 8.25 3 5 10 1,748
Opaque 0.83 0.3772 1 1 1 1,748Assets (Million $) 1,928 4,103 209.9 568.6 1,932 1,748Facility Amount (Million $) 272.6 460.5 42.5 103.3 274.2 1,748Maturity 53.4 31.8 27 53 78 1,748
Panel B: Event Time Sample.
Variable Mean SD 25% 50% 75% N
% Held by Lead Bank 29.09 19.34 13.33 25.00 45.00 557Herfindahl 2,408 1,691 1,048 1,820 3,560 557# Lenders 9.52 9.14 3 7 12 557
Opaque 0.74 0.44 0 1 1 557Assets (Million $) 2,655 5,170 241.9 746.6 2,662 557Facility Amount (Million $) 304.6 472.0 45.6 118.9 360.0 557Maturity 53.4 32.7 25 55 79 557

Baseline Results
(Syndicate Structure)itf = αi + αt + αf + β(AfterATS) + Xitf Γ + εitf
Calendar Event(1) (2) (3) (4) (5) (6)
% Held Herfindahl ln(1+#) % Held Herfindahl ln(1+#)
AfterATS -0.0627∗∗ -0.0641∗∗ 0.0603∗ -0.0960∗∗∗ -0.1065∗∗∗ 0.1226∗∗∗
(-2.03) (-2.26) (1.75) (-3.79) (-3.99) (3.24)Opaque Firm 0.0072 0.0247 -0.0504∗∗∗ 0.0131 0.0327 -0.0530∗
(0.36) (1.66) (-3.35) (0.57) (1.39) (-2.00)Assets -0.0449∗∗∗ -0.0242 0.0503∗∗ -0.0505∗∗ -0.0456∗∗∗ 0.0711∗∗∗
(-2.87) (-1.17) (2.51) (-2.64) (-3.84) (5.83)Facility Amount -0.0061 -0.0134 0.0107 0.0030 -0.0251 0.0228
(-0.61) (-1.39) (0.92) (0.26) (-1.14) (1.00)Facility Amount × Middle -0.0154 -0.0582∗∗ 0.1847∗∗ 0.0057 -0.0171 0.0147
(-0.63) (-2.29) (2.29) (0.25) (-0.72) (0.69)Facility Amount × Large -0.0190 0.0392∗ 0.1523∗∗ -0.0131 0.0194 0.0335
(-1.55) (0.02) (1.69) (-0.57) (1.09) (1.11)Maturity -0.0222∗∗∗ -0.0096∗∗ 0.0230∗ -0.0195∗ -0.0098∗ 0.0143∗
(-4.01) (-2.28) (1.92) (-2.06) (-1.89) (1.84)Term Loan 0.0111 -0.0010 -0.0029 0.0107 -0.0029 -0.0034
(1.62) (-0.25) (-0.54) (0.84) (-0.35) (-0.23)Loan Purpose Indicators Yes Yes Yes Yes Yes YesIndustry Fixed Effects Yes Yes Yes Yes Yes YesYear Fixed Effects Yes Yes Yes Yes Yes YesFirm Fixed Effects Yes Yes Yes Yes Yes Yes
Observations 1,748 1,748 1,748 557 557 557Adjusted R2 0.742 0.765 0.769 0.664 0.699 0.725

Robustness - Generalized Linear Model and PoissonEstimates
Calendar Event(1) (2) (3) (4) (5) (6)
% Held Herfindahl ln(1+#) % Held Herfindahl ln(1+#)
AfterATS -0.3445∗∗∗ -0.3888∗∗∗ 0.0871∗∗∗ -0.4812∗∗∗ -0.5694∗∗∗ 0.1795∗∗∗
(-2.73) (-3.03) (2.65) (-4.22) (-4.55) (3.47)Opaque 0.0695 0.2273∗∗∗ -0.0602∗∗∗ 0.1184 0.2783∗ -0.0694∗∗∗
(0.78) (2.65) (-4.24) (1.03) (1.89) (-2.73)Assets -0.2094∗∗∗ -0.1055 0.0846∗∗∗ -0.2505∗∗∗ -0.2410∗∗∗ 0.1150∗∗∗
(-3.51) (-1.28) (4.07) (-3.31) (-4.65) (7.53)Facility Amount -0.0229 -0.0553∗ 0.0235 0.0244 -0.1179 0.0413
(-0.67) (-1.65) (1.64) (0.58) (-1.36) (1.42)Facility Amount × Middle -0.1031 -0.2437∗∗∗ 0.0813∗∗∗ 0.0492 -0.1267 0.0170
(-1.17) (-3.78) (3.09) (0.65) (-1.59) (0.64)Facility Amount × Large -0.1598∗∗∗ -0.0776 0.0451∗ -0.1718∗ -0.0421 0.0319
(-3.27) (-1.52) (1.82) (-1.93) (-0.43) (0.92)Maturity -0.1252∗∗∗ -0.0598∗∗∗ 0.0320∗∗ -0.1263∗∗∗ -0.0748∗∗∗ 0.0147∗
(-5.79) (-3.22) (2.47) (-2.70) (-2.60) (1.81)Term Loan 0.0648∗∗ 0.0014 -0.0015 0.0858 0.0202 0.0015
(2.35) (0.08) (-0.27) (1.48) (0.40) (0.10)Loan Purpose Indicators Yes Yes Yes Yes Yes YesIndustry Fixed Effects Yes Yes Yes Yes Yes YesYear Fixed Effects Yes Yes Yes Yes Yes YesFirm Fixed Effects Yes Yes Yes Yes Yes Yes
After, marginal effect -0.0630 -0.0668 0.1690 -0.0851 -0.0909 0.3708Observations 1,748 1,748 1,748 557 557 557McFadden pseudo-R2 0.190 0.168 0.079 0.167 0.159 0.075

Criticism of ATS natural experiment
I Catan and Kahan (2014) Blistering attack - With properspecification the effect of ATS goes away in many papers
I Karpoff and Wittry (2015) - Take into account the criticismof Catan and Kahan and show that ATS still have explanatorypower and suggest a number remedies to address various issue
I Pre -1982 “First-Generation” anti-takeover laws confoundinterpretation Not relevant for us our sample period starts in1986
I “Firm-level” AT protection We use firm fixed effectsI ATS adoption is not exogenous for some firms We exclude
“motivating firms”; drop GA and TN based firmsI Look beyond just the BC laws We broaden the ATS to include
Poison Pill as well as Director Duties lawsI Legal Regime - Take into account important Supreme court
decisions that resolved uncertainty We implement this

Implementing KW suggestionsPanel A: Exclusion of borrowing firms incorporated in states with opting-in antitakeover laws
Calendar Event(1) (2) (3) (4) (5) (6)
% Held by Lead Bank Herfindahl log(1+#Lenders) % Held by Lead Bank Herfindahl log(1+#Lenders)
After -0.0669∗∗ -0.0658∗∗ 0.0616∗ -0.0950∗∗∗ -0.1066∗∗∗ 0.1242∗∗∗
(-2.11) (-2.22) (1.75) (-3.73) (-3.96) (3.27)
Observations 1,707 1,707 1,707 548 548 548Adjusted R2 0.745 0.766 0.768 0.663 0.698 0.723
Panel B: Exclusion of motivating companies
After -0.0634∗∗ -0.0642∗∗ 0.0609∗ -0.0953∗∗∗ -0.1062∗∗∗ 0.1220∗∗∗
(-2.05) (-2.23) (1.77) (-3.80) (-4.00) (3.25)
Observations 1,729 1,729 1,729 550 550 550Adjusted R2 0.740 0.763 0.767 0.663 0.698 0.724
Panel C: Controlling for five antitakeover laws
After -0.0736∗∗ -0.0666∗∗ 0.0574∗ -0.1225∗∗∗ -0.1229∗∗∗ 0.1315∗∗∗
(-2.27) (-2.43) (1.69) (-3.08) (-3.31) (3.15)
Observations 1,748 1,748 1,748 487 487 487Adjusted R2 0.743 0.765 0.769 0.675 0.716 0.729

Implementing KW suggestions - Court Decisions
NOTE: Sample Period 1986-1998 since Unitrin decision was in1995!
(1) (2) (3) (4) (5) (6)Lead % Herfindahl ln(1+#lenders) Lead % Herfindahl ln(1+#lenders)
AfterATS -0.0710∗∗ -0.0486∗∗ 0.0620∗∗ -0.0704∗∗ -0.0536∗∗ 0.0606∗∗
(-2.64) (-2.53) (2.32) (-2.38) (-2.39) (2.06)Control Share X CTS 0.0087 -0.0100 0.0044
(0.21) (-0.38) (0.15)Business Combination X Amanda 0.0013 0.0115 0.0092
(0.04) (0.42) (0.37)Poison Pill X Unitrin -0.0015 -0.0066 0.0056
(-0.08) (-0.42) (0.32)Opaque Firm 0.0124∗ 0.0120∗∗ -0.0169∗∗∗ 0.0125∗ 0.0121∗∗ -0.0167∗∗∗
(1.80) (2.27) (-3.07) (1.76) (2.22) (-3.12)Assets -0.0414∗∗∗ -0.0347∗∗∗ 0.0439∗∗∗ -0.0414∗∗∗ -0.0348∗∗∗ 0.0440∗∗∗
(-2.80) (-3.45) (4.20) (-2.82) (-3.45) (4.17)Amount -0.0066 -0.0150∗∗∗ 0.0173∗∗∗ -0.0066 -0.0149∗∗∗ 0.0172∗∗∗
(-0.96) (-3.24) (3.39) (-0.97) (-3.23) (3.40)Amount × Middle -0.0406∗∗ -0.0453∗∗∗ 0.0728∗∗∗ -0.0405∗∗ -0.0452∗∗∗ 0.0728∗∗∗
(-2.17) (-3.03) (4.40) (-2.15) (-3.02) (4.36)Amount × Large -0.0212∗∗∗ -0.0078 0.0569∗∗∗ -0.0212∗∗∗ -0.0080 0.0570∗∗∗
(-3.69) (-1.61) (5.55) (-3.74) (-1.65) (5.54)Maturity -0.0187∗∗∗ -0.0107∗∗∗ 0.0189∗∗∗ -0.0187∗∗∗ -0.0108∗∗∗ 0.0190∗∗∗
(-6.34) (-3.88) (4.05) (-6.19) (-3.83) (4.01)Term Loan 0.0133∗∗∗ 0.0011 0.0026 0.0134∗∗∗ 0.0011 0.0026
(5.55) (0.47) (0.61) (5.37) (0.48) (0.61)Loan Purpose Indicators Yes Yes Yes Yes Yes YesIndustry Fixed Effects Yes Yes Yes Yes Yes YesFirm Fixed Effects Yes Yes Yes Yes Yes Yes
Observations 5,824 5,824 5,824 5,824 5,824 5,824Adjusted R2 0.685 0.728 0.766 0.685 0.728 0.766
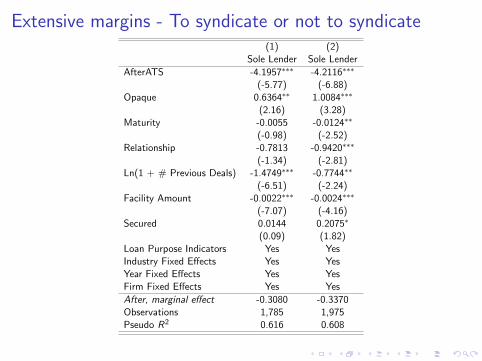
Extensive margins - To syndicate or not to syndicate(1) (2)
Sole Lender Sole Lender
AfterATS -4.1957∗∗∗ -4.2116∗∗∗
(-5.77) (-6.88)Opaque 0.6364∗∗ 1.0084∗∗∗
(2.16) (3.28)Maturity -0.0055 -0.0124∗∗
(-0.98) (-2.52)Relationship -0.7813 -0.9420∗∗∗
(-1.34) (-2.81)Ln(1 + # Previous Deals) -1.4749∗∗∗ -0.7744∗∗
(-6.51) (-2.24)Facility Amount -0.0022∗∗∗ -0.0024∗∗∗
(-7.07) (-4.16)Secured 0.0144 0.2075∗
(0.09) (1.82)Loan Purpose Indicators Yes YesIndustry Fixed Effects Yes YesYear Fixed Effects Yes YesFirm Fixed Effects Yes Yes
After, marginal effect -0.3080 -0.3370Observations 1,785 1,975Pseudo R2 0.616 0.608

Alternative Specification
We use a different approach based on Chava et al. (2009)
I G-Index of Gompers et al.(2003) counts the number ofanti-takeover provisions of the firm (up to 24)
I Narrower provisions e.g. classified board+poison pill
We estimate the following specification
(Syndicate Structure)i = α + (Shareholder Rights)iλ + XiΓ + εi

Alternative Specification(1) (2) (3) (4) (5) (6) (7) (8) (9)
Lead % Herfindahl ln(1+#Lenders) Lead % Herfindahl ln(1+#Lenders) Lead % Herfindahl ln(1+#Lenders)
GIndex -0.0031∗∗∗ -0.0022∗∗ 0.0077∗
(-3.09) (-2.33) (1.75)Classified board combined with -0.0127∗∗ -0.0118∗∗ 0.0496∗∗
Prohibitions on voting (-2.41) (-2.46) (2.11)Classified Board combined with -0.0126∗∗ -0.0091∗ 0.0243
Poison Pill and Blank Check (-2.31) (-1.85) (1.02)Opaque Firm 0.0627∗∗∗ 0.0542∗∗∗ -0.1681∗∗∗ 0.0629∗∗∗ 0.0544∗∗∗ -0.1688∗∗∗ 0.0621∗∗∗ 0.0538∗∗∗ -0.1670∗∗∗
(4.01) (3.93) (-3.13) (4.00) (3.93) (-3.14) (3.94) (3.88) (-3.10)Relationship -0.0157∗∗ -0.0147∗∗ 0.1078∗∗∗ -0.0159∗∗ -0.0150∗∗ 0.1090∗∗∗ -0.0152∗∗ -0.0143∗∗ 0.1065∗∗∗
(-2.22) (-2.36) (3.34) (-2.25) (-2.42) (3.39) (-2.14) (-2.30) (3.30)Opaque × Relationship -0.0107 -0.0126 -0.0557 -0.0098 -0.0120 -0.0578 -0.0106 -0.0126 -0.0563
(-0.84) (-1.10) (-1.13) (-0.77) (-1.05) (-1.18) (-0.83) (-1.10) (-1.14)Log(1 + # Previous Deals) -0.0000 0.0015 0.0157 0.0005 0.0018 0.0144 0.0001 0.0016 0.0152
(-0.01) (0.33) (0.70) (0.09) (0.40) (0.64) (0.01) (0.34) (0.67)Opaque × Log(1 + # Previous Deals) -0.0281∗∗∗ -0.0241∗∗∗ 0.0897∗∗∗ -0.0280∗∗∗ -0.0241∗∗∗ 0.0900∗∗∗ -0.0271∗∗∗ -0.0234∗∗∗ 0.0875∗∗∗
(-3.31) (-3.09) (2.83) (-3.30) (-3.10) (2.85) (-3.20) (-3.01) (2.76)Log(Assets) -0.0191∗∗∗ -0.0119∗∗∗ 0.0948∗∗∗ -0.0190∗∗∗ -0.0117∗∗∗ 0.0940∗∗∗ -0.0197∗∗∗ -0.0123∗∗∗ 0.0959∗∗∗
(-4.80) (-3.15) (5.34) (-4.79) (-3.14) (5.40) (-4.91) (-3.24) (5.39)Amount -0.0788∗∗∗ -0.0822∗∗∗ 0.2496∗∗∗ -0.0786∗∗∗ -0.0820∗∗∗ 0.2489∗∗∗ -0.0781∗∗∗ -0.0816∗∗∗ 0.2482∗∗∗
(-8.05) (-8.63) (7.96) (-8.02) (-8.63) (7.98) (-7.94) (-8.55) (7.90)Amount × Middle 0.0164 0.0255∗∗ 0.1495∗∗∗ 0.0152 0.0247∗∗ 0.1522∗∗∗ 0.0148 0.0244∗ 0.1533∗∗∗
(1.18) (2.02) (3.00) (1.10) (1.97) (3.08) (1.06) (1.93) (3.10)Amount × Large 0.0716∗∗∗ 0.0697∗∗∗ -0.0063 0.0712∗∗∗ 0.0693∗∗∗ -0.0045 0.0712∗∗∗ 0.0694∗∗∗ -0.0055
(6.36) (6.76) (-0.15) (6.32) (6.73) (-0.11) (6.28) (6.70) (-0.13)Maturity -0.0260∗∗∗ -0.0241∗∗∗ 0.1284∗∗∗ -0.0260∗∗∗ -0.0241∗∗∗ 0.1284∗∗∗ -0.0259∗∗∗ -0.0240∗∗∗ 0.1282∗∗∗
(-6.21) (-6.01) (6.68) (-6.22) (-6.04) (6.72) (-6.14) (-5.95) (6.66)Term Loan 0.0268∗∗∗ 0.0144 0.1328∗∗∗ 0.0272∗∗∗ 0.0147 0.1320∗∗∗ 0.0272∗∗∗ 0.0146 0.1318∗∗∗
(2.61) (1.52) (3.86) (2.66) (1.55) (3.83) (2.65) (1.55) (3.83)
Observations 3223 3223 3223 3223 3223 3223 3223 3223 3223R2 0.428 0.429 0.585 0.427 0.429 0.585 0.426 0.429 0.584
NOTE: Higher G-Index implies lower Shareholder rights

Changes Regression - Gindex is stickyThis table provides the OLS estimates of the following model.
∆(Syndicate Structure)i = α + ∆(G Index)iλ
+∆Assetsiγ + ∆Amountiδ + ∆Maturityiβ + εi
(1) (2) (3) (4) (5) (6)∆ Lead % ∆ HHI ∆ # Lenders ∆ Lead % ∆ HHI ∆ # Lenders
∆ G -0.0149∗∗ -0.0140∗∗ 0.6491∗∗
(-2.29) (-2.46) (2.29)∆ G ≥ +1 -0.0394∗∗ -0.0421∗∗∗ 1.7553∗∗
(-2.38) (-2.78) (2.05)∆ Assets -0.0000 -0.0000 -0.0000 -0.0000 -0.0000 -0.0000
(-1.54) (-0.94) (-0.43) (-1.39) (-0.89) (-0.54)∆ Amount -0.0001∗∗∗ -0.0001∗∗∗ 0.0074∗∗∗ -0.0001∗∗∗ -0.0001∗∗∗ 0.0075∗∗∗
(-4.10) (-4.00) (5.20) (-4.04) (-3.99) (5.19)∆ Maturity -0.0000∗∗∗ -0.0000∗∗∗ 0.0014∗∗ -0.0000∗∗∗ -0.0000∗∗∗ 0.0014∗∗
(-3.01) (-2.79) (2.37) (-2.90) (-2.75) (2.26)
Observations 280 280 280 280 280 280R2 0.091 0.092 0.204 0.087 0.092 0.201

What could be driving the need for monitoring(1) (2) (3) (4) (5) (6)
Lead % Herfindahl ln(1+#Lenders) Lead % Herfindahl ln(1+#Lenders)
GIndex -0.0015 -0.0006 0.0033 -0.0031∗∗∗ -0.0024∗∗ 0.0062(-1.30) (-0.59) (0.71) (-2.60) (-2.17) (1.18)
G x Distressed -0.0067∗∗∗ -0.0062∗∗∗ 0.0185∗
(-3.03) (-2.75) (1.71)Distressed Firm 0.0870∗∗∗ 0.0800∗∗∗ -0.1471
(3.52) (3.26) (-1.50)G × Low Leverage 1/4 -0.0003 0.0008 0.0054
(-0.13) (0.41) (0.63)Low Leverage 1/4 0.0031 -0.0071 -0.1218
(0.15) (-0.38) (-1.52)Opaque Firm 0.0614∗∗∗ 0.0530∗∗∗ -0.1637∗∗∗ 0.0625∗∗∗ 0.0542∗∗∗ -0.1371∗∗
(3.98) (3.91) (-3.07) (3.94) (3.88) (-2.53)Relationship -0.0162∗∗ -0.0152∗∗ 0.1105∗∗∗ -0.0157∗∗ -0.0147∗∗ 0.1070∗∗∗
(-2.29) (-2.43) (3.42) (-2.22) (-2.37) (3.34)Opaque × Relationship -0.0094 -0.0115 -0.0581 -0.0107 -0.0127 -0.0601
(-0.74) (-1.02) (-1.19) (-0.83) (-1.10) (-1.23)Log(1 + # Previous Deals) -0.0010 0.0006 0.0152 -0.0000 0.0015 0.0136
(-0.21) (0.13) (0.68) (-0.01) (0.32) (0.61)Opaque × Log(1 + # Previous Deals) -0.0275∗∗∗ -0.0235∗∗∗ 0.0888∗∗∗ -0.0281∗∗∗ -0.0241∗∗∗ 0.0811∗∗∗
(-3.24) (-3.03) (2.84) (-3.31) (-3.10) (2.59)Log(Assets) -0.0204∗∗∗ -0.0130∗∗∗ 0.0937∗∗∗ -0.0192∗∗∗ -0.0118∗∗∗ 0.0941∗∗∗
(-5.10) (-3.41) (5.26) (-4.80) (-3.14) (5.34)Amount -0.0768∗∗∗ -0.0803∗∗∗ 0.2493∗∗∗ -0.0788∗∗∗ -0.0822∗∗∗ 0.2519∗∗∗
(-7.97) (-8.49) (7.87) (-8.05) (-8.63) (8.08)Amount × Middle 0.0131 0.0224∗ 0.1528∗∗∗ 0.0165 0.0254∗∗ 0.1473∗∗∗
(0.95) (1.79) (3.06) (1.18) (2.01) (2.97)Amount × Large 0.0710∗∗∗ 0.0691∗∗∗ -0.0042 0.0716∗∗∗ 0.0698∗∗∗ -0.0071
(6.39) (6.77) (-0.10) (6.35) (6.75) (-0.17)Maturity -0.0265∗∗∗ -0.0245∗∗∗ 0.1290∗∗∗ -0.0260∗∗∗ -0.0241∗∗∗ 0.1279∗∗∗
(-6.35) (-6.16) (6.74) (-6.20) (-6.01) (6.65)Term Loan 0.0267∗∗∗ 0.0143 0.1328∗∗∗ 0.0269∗∗∗ 0.0143 0.1298∗∗∗
(2.62) (1.53) (3.88) (2.63) (1.52) (3.80)
Observations 3223 3223 3223 3223 3223 3223R2 0.432 0.434 0.586 0.428 0.429 0.586

Conclusion
I Changes in corporate governance affect financial contracting
I Causal evidence from natural experimentI After the adoption of ATS firms borrow from larger less
concentrated syndicatesI Firms are less likely to borrow from a sole lender (more likely
to have a syndicated loan)
I Additional evidence from G-Index and Other Entrenchmentindexes
I Firms with greater shareholder rights have larger lessconcentrated syndicates
I Need for more concentrated syndicated (i.e. more monitoring)appears to be driven by risk-shifting incentives of distressedfirms rather than concerns about M&A


