CORPORATE BRAND EQUITY VALUATION IN THE … BRAND EQUITY VALUATION IN THE FOOD AND BEVERAGE INDUSTRY...
110
UNIVERSITY OF LJUBLJANA FACULTY OF ECONOMICS MASTER THESIS CORPORATE BRAND EQUITY VALUATION IN THE FOOD AND BEVERAGE INDUSTRY IN SLOVENIA LJUBLJANA, JANUARY 2005 JELENA JOKANOVIĆ
Transcript of CORPORATE BRAND EQUITY VALUATION IN THE … BRAND EQUITY VALUATION IN THE FOOD AND BEVERAGE INDUSTRY...

UNIVERSITY OF LJUBLJANA FACULTY OF ECONOMICS
MASTER THESIS
CORPORATE BRAND EQUITY VALUATION IN THE
FOOD AND BEVERAGE INDUSTRY IN SLOVENIA LJUBLJANA, JANUARY 2005 JELENA JOKANOVIĆ
i

I, Jelena Jokanović, hereby declare that I am the author of this Master thesis that was written under the mentorship of prof. Irena Vida, Ph.D. In compliance with Paragraph 1 of Article 21 of the Act on Copyright and Related Right I hereby agree to this thesis being published on the website of the Faculty of Economics. Ljubljana, January 2005 Jelena Jokanović ______________
ii

CONTENTS
1 INTRODUCTION...................................................................................................... 1
2 THEORETICAL BACKGROUND OF THE BRAND EQUITY AND BRAND VALUATION................................................................................................................... 3
2.1 Brand and its equity............................................................................................. 3
2.1.1 Brand equity valuation.................................................................................. 5
2.2 Brand equity’s life and brand dilution................................................................. 6
2.3 Brand Due Diligence ........................................................................................... 7
2.4 Strategic brand management and brand equity valuation.................................... 9
2.5 Importance of advertising in branding .............................................................. 10
2.6 Perspectives of brand equity.............................................................................. 11
2.6.1 Customer based brand equity...................................................................... 11
2.6.2 Firms’ perspective (company based brand equity) ..................................... 13
2.6.3 Trade’s perspective ..................................................................................... 13
2.7 Brand equity valuation situations ...................................................................... 14
2.8 Corporate brand equity ...................................................................................... 16
2.8.1 Corporate brand .......................................................................................... 16
2.8.2 Accounting role in the brand valuation....................................................... 20
2.9 An overview of the brand equity models .......................................................... 22
2.9.1 Model classification.................................................................................... 23
2.9.2 BBDO classification of brand valuation models ........................................ 24
2.9.3 BBDO’s Brand Equity Evaluation System (BEES) ranking ...................... 26
2.9.4 Brand Equity Value for Accounting (BEVA) model.................................. 27
3 OUTLINE OF THE MODEL .................................................................................. 29
3.1 Brand Equity Evaluator© .................................................................................. 29
3.2 Brand strength ................................................................................................... 34
3.2.1 Brand identity ............................................................................................. 35
3.2.2 Brand knowledge ........................................................................................ 36
3.2.3 Brand positioning........................................................................................ 36
3.2.4 Perceived quality......................................................................................... 37
3.2.5 Brand status................................................................................................. 37
3.3 Advantages of the model developed in this study ............................................. 38
3.4 Limitations of the model ................................................................................... 39
i
4 METHODOLOGY ...................................................................................................41
4.1 Research design - primary data..........................................................................41
4.2 Questionnaire design..........................................................................................42
4.3 Secondary data ...................................................................................................45
4.4 Research hypotheses ..........................................................................................45
5 DATA ANALYSIS ..................................................................................................47
5.1 Secondary data analysis .....................................................................................47
5.1.1 Factor Weights ............................................................................................47
5.1.2 Market Quality ............................................................................................49
5.1.3 Dominance of the Relevant Market ............................................................51
5.1.4 International Orientation of the Brand ........................................................51
5.1.5 Discounted Cash Flow for the Selected Corporate Brands .........................51
5.2 Primary data analysis .........................................................................................54
5.2.1 Reliability and validity tests........................................................................54
5.2.1.1 Reliability tests.........................................................................................54
5.2.1.2 Validity assessment..................................................................................55
5.2.2 Brand strength construct..............................................................................56
5.2.3 Descriptive statistics....................................................................................58
5.2.3.1 Descriptive statistics of the sample – demographic characteristics .........58
5.2.3.2 Descriptive statistics of the measures - whole sample (N=600) ..............59
5.2.3.3 Descriptive statistics of measures - sub samples .....................................62
5.2.4 Hypothesis testing .......................................................................................65
5.2.4.1 The first set of hypotheses .......................................................................66
5.2.4.2 The second set of hypotheses...................................................................68
5.2.5 Purchasing habits.........................................................................................70
6 RESULTS.................................................................................................................71
6.1 Brand equity valuation without the brand strength............................................71
6.2 Final valuation ...................................................................................................73
6.3 Corporate Brand Equity as % of Market Value of the Company ......................75
ii

7 CONCLUSION........................................................................................................ 77
7.1 Contribution....................................................................................................... 77
7.2 Limitation and direction for future research...................................................... 77
7.3 Managerial implications .................................................................................... 78
8 LITERATURE ......................................................................................................... 80
iii

LIST OF TABLES Table 1: BBDO Classification of models........................................................................25 Table 3: Brand Equity Ten ..............................................................................................35 Table 4: Control characteristics.......................................................................................42 Table 5: Factor Weights .................................................................................................48 Table 6: Elements of the model.......................................................................................50 Table 7: Beta and WACC in 2003 ..................................................................................53 Table 8: DCF for the three years period..........................................................................53 Table 9: Reliability of scales...........................................................................................55 Table 10: Correlation matrix ...........................................................................................56 Table 11: Factor loadings of brand strength items..........................................................57 Table 12: Factor loadings – brand strength.....................................................................58 Table 13: Demographics of the sample – gender and age structure................................58 Table 14: Descriptive statistics for constructs of brand strength – whole sample ..........61 Table 15: Descriptive statistics – BRAND STRENGHT................................................64 Table 16: Descriptive statistics for elements of brand strength ......................................65 Table 17: The paired sample test results .........................................................................67 Table 18: Paired sample test results II ............................................................................69 Table 19: Descriptive statistics – purchasing behaviour.................................................70 Table 20: Elements of the model and value without the brand strength (in 000 EUR) ..73 Table 21: Corporate brand equity for the brand include in the research.........................75 Table 22: Corporate brand equity in market value of the company................................76
LIST OF FIGURES Figure 1: CBBE pyramid.................................................................................................12 Figure 2: Corporate brand equity ....................................................................................18 Figure 3: BBDO’s BEES.................................................................................................27 Figure 4: Association network ........................................................................................36
iv

LIST OF TABLES IN THE APPENDIX
A - 1: Interbrand’s Global Brand Scoreboard................................................................. IV A - 2: Demographic characteristics of the sample – region............................................ IV A - 3: Demographic characteristics of the sample – level of education ......................... IV A - 4: Most frequent associations of consumers.............................................................. V A - 5: Most frequent associations of consumers (continued) .........................................VI A - 6: Multiple comparisons; LSD: BS ..........................................................................VII A - 7: Paired sample statistics and test ........................................................................ VIII A - 8: Paired sample statistics and test II........................................................................ IX A - 9: Brand strength – Group statistics: BS .................................................................. IX A - 10: Independent samples test ..................................................................................... X A - 11: Multiple comparisons. Dependant variable: Purchasing behaviour ...................XI A - 12: Exchange rates (EUR/SIT) ................................................................................XII A - 13: Questionnaire................................................................................................... XIII
v

vi

1 INTRODUCTION Today, company′s real value lies outside the business itself, in the minds of potential buyers (Kapferer, 1992, p. 9). This is reflected in the value of brands, which are the anchors of company’s value. Products are introduced, they live and disappear but brands endure (Kapferer, 1992, p. 17). The term ``brand’’ holds multiple meanings. According to John Murphy, founder of Interbrand (Ingham, 2003), a brand is not only an actual product, but also the unique property of a specific owner. Brands are increasingly considered to be the primary capital in many businesses. Financial professionals have developed the notion that a brand has an equity which exceeds its conventional asset value. This is supported by the fact that the cost of introducing a new brand to the market has been approximated at $100 million with a 50 percent probability of failure (Ourusoff, 1993, p. 81). Therefore, the phenomenon of brand and brand equity valuation became the centre of interest of both academic and business experts. The main issues are how a company can build, nurture and use a brand in order to obtain and sustain the competitive advantage in the marketplace. In its branding strategy, a company has a number of different options for branding. These can be divided into four different categories: corporate brands (e.g. British Airways), individual brand names or product brand, companies, product brands (e.g. Mars company and the chocolate bar) and manufacturer’s name and reputation (e.g. Marks &Spenser/St Michael) (Melewar and Walker, 2003, p.161). While in service marketing the company brand is the primary brand, the product brand is referred to as the primary brand in packaged goods marketing (Low and Lamb, 2000, p. 355). Brand equity is a measure of the health of the brand. Thus, it can be used for marketing decision-making. In addition, brand equity cannot be viewed only from the companies’ perspective, but one must be concerned with the way customers perceive product or service brands. In the marketing literature, operationalisation of consumer-based brand equity usually falls into two groups (Cobb-Walgren et al., 1995, p. 26; Yoo and Donthu, 2001, p. 10): consumer perception (brand awareness, brand associations, perceived quality) and consumer behaviour (brand loyalty, willingness to pay a high price). The key sources of brand equity suggested by Aaker (1991, p. 130) incorporate both perceptual and behavioural dimensions in the definition, whereas Lassar et al. (1995, p. 12) strictly distinguish the perceptual dimension from the behavioural dimension, so that behaviour is a consequence of brand equity rather than the brand itself.
1

The goal of my master thesis is to examine the corporate brand equity of firms’ selected in the food and beverage sector in Slovenia using the BBDO's Brand Equity Evaluator©
(Zimmerman et al., 2002, p. 1). This is a modular, multi-stage approach designed to assess various brand types and geared for various valuation purposes (Zimmerman et al., 2002, p. 8). The model is based on the two perspectives of the brand equity: financial and consumer perspective. The thesis is divided into five parts. The short overview of the thesis is as follows. The Chapter 2 presents the relevant theoretical background of the brand equity. That chapter is divided into four sections. The emphasise will be given on models which logically led to derivation of the model, which will be applied in the empirical part of this study. In the Chapter 3 I will present the model, which will be later applied in the empirical study. All elements of the model will be presented in detail, with explanation of the reasons for their inclusion into the model in the first place. In this section, I will also present the one of the elements of the model brand strength. Its influence on the overall brand equity will be presented in the separate chapter. The research methodology along with the research hypothesis will be presented in the Chapter 4. Data analysis will be presented in the Chapter 5. It is divided into secondary and primary data analysis. Summary results of the brand equity valuation of the corporate brands included in the research will be given in the Chapter 6. Last chapter of the thesis is the conclusion with the managerial implications of the study on the Slovenian market. Critique of the model along with the suggestions on the further research will also be presented in this section. The reader will notice that the author tried to make a strict distinction between the individual perspectives of the brand equity. Nevertheless, all the perspectives of the brand equity, as well as all the models are interrelated, and therefore one has to have in mind, when reading the thesis, that the repeating of some sections, conclusions and implications were inevitable.
2

2 THEORETICAL BACKGROUND OF THE BRAND EQUITY AND BRAND VALUATION
In this section I provide an overview of relevant terms relating to the brand equity. During my research of the brand equity, I came across a large number of studies, on this topic. Nevertheless, I concentrated merely on those which relate to brand equity valuation, corporate brand and strategic brand management. Why a brand equity matters is the first question that one has to answer. There have been some claims of a positive correlation between brand equity and a firm’s performance (Park and Srinivasan, 1994, p. 271; Aaker, 1996, p. 110). Some studies have found that a product’s brand equity positively affects future profits and long-term cash flow (Shocker et al., 1994, p. 150).
2.1 Brand and its Equity Aaker (1996, p. 111) views brand equity as a set of assets (liabilities) linked to a brand’s name and symbol that adds to (or subtracts from) the value provided by a product/service to the customer. A consumer perceives brand equity as the value added to the product by associating it with a brand name. While this ‘‘value added’’ is a function of several facets, the ‘‘core’’ facets are the primary predictors of brand purchase intent and behaviour. Core Consumer Based Brand Equity (henceforward: CBBE) facets, denoted by Aaker, include ‘‘perceived quality’’ (henceforward: PQ), ‘‘perceived value for the cost’’ (henceforward: PVC), ‘‘uniqueness,’’ and the ‘‘willingness to pay a price premium’’ of a given brand. Keller (1993, p. 2) defines brand equity as ‘‘the differential effect of brand knowledge on consumer response to the marketing of the brand.’’ He also views CBBE as a process, that occurs when the consumer is familiar with the brand and holds some favourable, strong, and unique brand associations in memory. The favourable, strong, and unique associations are termed as ‘‘primary’’ associations that include brand beliefs and attitudes encompassing the perceived benefits of a given brand (Keller, 1993, p. 5). These beliefs and attitudes can be functional and experiential (i.e., PQ and value relative to other brands) or symbolic (i.e., its ‘‘uniqueness’’). ‘‘Primary’’ brand associations of PQ, PVC, uniqueness, and the willingness to pay a price premium, are the strongest predictors of purchase intent and purchase behaviour in Keller’s framework. The value of a brand is based on a number of dynamic variables including the competitive set, category strength, differentiation, relevance, management ability, corporate strategy, existing intangible and tangible assets, etc. Not only do these variables change regularly, but also the centre of company’s attention changes depending on the requirements of the business. Therefore, it can be concluded that the
3

brand value is some sort of relative measure, contingent on circumstances and perspective. Ultimately, the audience is the one that “attaches” value to a brand (Woods, 1998, p. 9) not consultants, or the manager himself/herself. Company which owns the brand “enjoys” the benefits not available to companies which do not own it. One of them is that a company, through brand, acquires a good communication tool. This communication is not one-way. This means that enterprises are good “communicators” only if they are good listeners of what customers have to say. In addition, successful brands are the outcome of good communication. The direct result of good communication between a company and a customer is the brand loyalty. It is a consequence of trust, on which the relationship between the company and the customer is based on. Trust building requires long-term concentration. It takes money, patience, knowledge and the most important: it takes time. Losing the trust costs a lot more: net present value of all future net earnings from the brand (Yates, 1999). Therefore, a smart player in the market cannot afford to lose the trust of a customer. That is why many companies are investing significant amounts of money into both products and brand management. The next benefit of branding is that the brand designates a product or a service as being different from competitors' products and services by signalling certain key values specific to a particular brand. Consumers’ perception of brands is established from and based on both emotional and rational reasons. This provides the basis for the ongoing relationship between a supplier and a consumer, and because of this, brands provide a security of demand that the supplier otherwise would not enjoy. At the same time, all arguments mentioned so far may be the answer to the following question: why do brands “work” for customers? The reasons are familiar: a brand simplifies everyday choices (a shopper who regularly buys Paciotti shoes does not have to agonize continually over choice for shoes), reduces the risk of complicated buying decisions (having an item from a known brand, which is “tasteful” in itself, diminishes the risk of buying something out of fashion) (Abratt and Bick, 2003, p. 21), provide emotional benefits (having Paciotti gives the feeling of exclusivity and glamour), and offers a sense of community (fashionable society) (Zalewska, 2002, p. 17). Acquiring and creating strong brands is consequently enormously attractive to senior managers whose interest is fed by a number of books and articles on how to get and keep them (Court et al., 1999, p. 100). Consequently, a brand becomes a company's most important asset. All other assets within the company have some value for the company as well. The market for these assets exists, and therefore their value can be easily assessed. But what is the value of the brand, and how can it be determined? This question is becoming more important when we come to a due-diligence process during the mergers and acquisitions, since due diligence is a critical step towards reaching a correct investment decision.
4

Ten years ago Interbrand conducted the first brand valuation for Rank Hovis McDougal (henceforward RHM). This exercise succeeded in putting the worth of the company's brands as a figure on the balance sheet (Yates, 1999). RHM's management wanted this information to fight a hostile take-over bid. With the brand value information, the RHM board was able to go back to investors and argue that the bid was too low, and eventually prevent the take over. Therefore, the wave of brand acquisitions in the late 1980's that exposed the hidden value in highly branded companies, had raised the issue of brand valuation. Some of these acquisitions included Nestlé buying Rowntree, United Biscuits buying and later selling Keebler, Grand Metropolitan buying Pillsbury and Danone buying Nabisco's European businesses. All these acquisitions were at high multiple price tags1 (Yates, 1999). In addition, the amount being paid for the acquisition of a strongly branded company was increasingly higher than the value of the company's net tangible assets. This resulted in huge levels of goodwill which arisen in acquisition. This goodwill actually disguised a mix of concealed intangible assets - brands, copyrights, patents, customer loyalty, distribution contracts, staff knowledge, etc. The arguments presented so far are also supported by the Interbrand study of acquisitions in the 1980s that showed that, whereas in 1981 net tangible assets represented 82% (on the average) of the bid amount for companies, by 1988 this sum had fallen to just 56% (Yates, 1999). It became clear that companies were being acquired less for their tangible assets and more for their intangible assets.
2.1.1 Brand Equity Valuation Although the summary of the brand equity models will be presented in the separate section of the thesis, it is necessary to provide a short overview of the meaning of the brand equity valuation. Today, a widely accepted method of valuing a company or business is to discount the cash flows to equity it produces, to a net present value. A similar approach can be used for brands. The profit streams produced by the brand are discounted to their net present value using a discount rate, which reflects the risk of the realization of those income streams (i.e., which reflects the strength of the brand - the drivers of those profit streams). 1 Market value ratios (i.e. multiples) relate the firm’s stock price to its earnings, cash flow and book value per share. These ratios give the indication of how the investors perceive the companies’ past performance and future prospects (Brigham, 2002, p. 228). Market value ratios are: price/earnings ratio (P/E), price/cash flow ratio (P/CF), market/book ratio M/B) etc. P/E ratio shows how much investor is willing to pay per dollar of reported profits. P/CF ratio shows how much investor is willing to pay per dollar of company’s cash flow to equity. M/B ratio shows how much investor is willing to pay per dollar of reported book value of equity.
5

Interbrand, the original pioneer of Brand Valuation, employs an economic use method which is the most widely accepted and has made Interbrand a world-wide authority in this field. It is based on the premise that brands, when well managed, affect the way that consumers behave in the market and, as a result the brand owner derives an economic benefit from this behaviour. Interbrand bases its valuation method on the concept of economic use and the fundamental question: how much more valuable is the business because it owns certain brands (Yates, 1999). As such, it is a marketing measure that reflects the security and growth prospects of the brand as well as financial measure that reflects the earnings potential of the brand. If we take into account the “economic” worth concept, we can discuss both the discounted cash flows that are to be generated by the brand in the future, as well as the likelihood that these earnings will be generated. Broadly speaking, Interbrand's brand valuation methodology is comprised of four elements (Yates, 1999): • Financial Analysis – used to identify business earnings and 'Earnings from
Intangibles' for each of the distinct segments being assessed • Market Analysis – used to measure the role that a brand plays in driving demand for
services in the markets in which it operates, and hence, to determine what proportion of Earnings from Intangibles are attributable to the brand (this is measured by an indicator referred to as the 'Role of Branding Index')
• Brand Analysis – used to assess competitive strengths and weaknesses of the brand and hence the security of future earnings expected from that brand (this is measured by an indicator referred to as the 'Brand Strength Score')
• Legal Analysis – used to make sure that the brand is a true piece of 'property' 2.2 Brand Equity’s Life and Brand Dilution Companies, products and their brands have their life cycles which can more or less overlap. This means that brand will have both its high point and its “top form” and will enter the process of decay, eventually. Therefore, the assignment of the brand manager is to recognize the brand’s “top form” and to undertake all the necessary actions to keep it there as long as possible. The same refers to the brand associated equity. According to Pitta and Katsanis (1995, p. 57) brand equity is a subject of growth and reinforcement, or decay, and assault by competitors, or it can be harmed by intentioned actions of a management. One of the intentioned actions of a manager which can cause the brand to decay are both successful and unsuccessful brand extensions. Decay occurs since extensions are causing the dilution of the parent brand (Loken and John, 1993, p. 74).
6

“The term “dilution” refers to the lessening of the capacity of a famous mark to identify and distinguish goods or services, regardless of the presence or absence of: (1) competition between the owner of the famous mark and other parties, and (2) likelihood of confusion, mistake or deception” - Federal Dilution Trade Act, 1995, sec. 1127 (Mermin, 2000, p. 217). Findings provide the first indication that brand extensions can dilute brand names, through decreasing the positive perception consumers have about the family brand (Loken and John, 1993, p. 74-81). Moreover, data suggest that dilution is a complex phenomenon, emerging for certain types of brand extensions in just a few situations. First, the risk of brand name dilution appears to be greater for brand extensions that are perceived to be moderately different from the parent brand. In contrast, brand extensions perceived to be clearly different from originator carry a moderate degree of risk (Loken and John, 1993, p. 80).
The second reason for decay of brands and the associated brand equity can be repeated cycles of successful brand extensions. Combination of the two above mentioned factors (i.e. repeated number of brand extensions and unsuccessful brand extensions) can cause total “extinction” of the brand equity, regardless of its success at one point in time (Gibson, 1990, p. B1). 2.3 Brand Due Diligence Companies’ value depends largely on the brand value. Many private equity deals and merger and acquisition transactions account for brand equity. The main reason is that investors must make sure that their investment is adequate, and it will provide a high rate of return. Dealer, on the other end, needs to be sure that the price is close to the real value of the brand. Many equity deals, which were completed, show that wrong valuation of a brand can be harmful and expensive for both parties in the transaction. That is why consulting firms, which had been developing tools for brand valuation, face an extremely demanding assignment. One of the tools, which is becoming the prerequisite for good valuation, as well as investment decision, is BrandDueDiligenceTM (Haigh, 2002, p. 1). The demand for this tool is very high since the number of private equity and merger and acquisition deals is increasing. By using this tool companies are able to identify what the brand's operating environment, to determine the platform for brand's success in the future, and to determine factors, which need to be enhanced in order to assure the success of a brand in the future. In this way, brand managers also set a monitoring tool.
7

BrandDueDiligence process is a five-step approach (Haigh, 2002, p. 3). Phases of the process are as follows:
• Undertaking of comprehensive legal and risk analysis aimed to determine whether all brands are registered and properly protected. In addition, any brand extension, licensing, selling or sharing impacts the brand analysis.
• Market review and the risk analysis of a business in order to examine the business environment of the company. In this way, industry profile is created in order to see how it is affected by natural, political, social, economical and other factors. An analyst has to take into account all relevant factors. It is also extremely important to identify the business cycle of both the business and the market, and to determine the stage of the market development.
• Competitor review and risk analysis. If the brand is the leader in the market, analysis is used to identify whether other companies and the market believe that a company is a leader, and whether its strategy is understood. Furthermore, the analyst needs to map a market scene and to identify the followers and challengers. Then the market strategy of the competitors needs to be examined. Porter’s five forces model can be a useful tool.
• Brand image and risk analysis includes: customer target profile, pricing strategy, the response to environmental changes, the contingency plans for product or service malfunctioning and environmental problems. After qualifying and quantifying all these factors, one is able to evaluate the success of the current brand management. Unless brand management is strong and comprehensive, the brand equity will be devalued.
• Branded business review and risk analysis. The purpose of this stage is to identify the areas of competitive advantage and disadvantages of the brand. There are several different areas to be examined: product distribution channels, innovations, brand strength. The final report should encompass the drives of brand loyalty and alternative scenarios for growth.
Since these reports encompass the analysis of various aspects of the brand, they can have multiple uses. First, the owner/manager is able to see the true value, strength and weaknesses of its brand. An investor is able to use these reports for acquisition decisions, the decision on price, and decision on all other elements of the “deal structure”. Lending bankers are using the reports for lending decisions. In addition, we have to highlight that lending bankers must be aware of the fact that the value of the firm’s tangibles is just a small “chunk” of the firms overall value while the real value lies in its intangible assets. Intangibles, in addition, allow the firm to achieve a maximum »going concern«2 value. 2 Going concern is the idea that a company will continue to operate indefinitely, and will not go out of business and liquidate its assets. For this to happen, the company must be able to generate and/or raise enough resources to stay operational (www.investorwords.com).
8

2.4 Strategic Brand Management and Brand Equity Valuation In this thesis, implications for the strategic brand management will be given throughout the text, as well as in the final chapter of the thesis. Nevertheless, I will focus the attention to this topic in this section as well, since we have to keep in mind that the ultimate purpose of brand valuation is to provide implications for strategic brand management. Although overall opinion is that the brand valuation is often focused on balance sheet valuations, the reality is that the majority of valuations are now actually carried out to assist both brand management and strategic decisions. Brand value can be enhanced through brand management, and in this way increase the value of the company in the eyes of the customers as well as of potential investors. Therefore, companies are increasingly recognizing the importance of brand guardianship and management as the key to successful business management (Yates, 1999). The value associated with the product or service is communicated through the brand to the consumer. Consumers no longer want just a service or a product but a relationship based on trust and familiarity. Consequently the company will enjoy earnings stream secured by loyalty of customers who are buying the brand (Yates, 1999). On the other hand, brand equity valuation is some sort of a control mechanism of how the most valuable asset in the company is managed. In addition to using this tool, brand managers are able to see the results of their actions and use it either to improve or to redefine their goals and actions. The main implication for all the departments in the company is that brand equity valuation standardization across time, products and markets is of utmost importance for the success of the brand. In addition, any of the chosen techniques for the brand valuation which is standardized, has higher reliability and credibility when used to evaluate evolving trends in brand values (Cravens and Gilding, 1999, p. 55). Ultimately, the main prerequisites for the establishment of successful brand are as follows (Melewar and Walker 2003, p. 168)
• brands should be linked to corporate strategy • brands are a shorthand summary of its company • brands should be constantly manifested through the marketing mix • brands should be consistently positioned across markets • brand should deliver value, which should be expressed in consumer terms • brands portray a continuous relationship between the company and its buyers
and users • good brands should provide a platform for innovation and differentiation
9

• a company should understand its markets’ macro environments, competitive force, cultural dynamics and national identity.
2.5 Importance of Advertising in Branding This section addresses the issue of advertising in branding. In addition, I will analyze the importance of advertising in the brand equity valuation. At the end of this section I will outline how the advertising expenditures are assessed in brand valuation. The impact of advertising to the overall marketing program is evidenced in two ways. First, business suppliers need to constantly remind potential buyers of their products, or need to make them aware of the company’s new products and services. Second, advertising may make the selling efforts more effective (Hutt and Speh, 2004, p. 412). Advertising, in comparison to other marketing program activities, is cheaper since the costs of reaching the target audience through sales personnel can be very high. Advertising is a tool, used by companies for communication to their customers. The process of communicating to the target audience may begin from complete unawareness of the product on the part of the consumers. If communication strategy represented by an ad is adequate, consumers become aware of the product. This can lead to consumer’s preference for the product, and the belief that the product can satisfy the needs of consumers better than competing ones. This eventually leads to actual purchase (Hutt and Speh, 2004, p. 412). Advertising programs can create both product awareness and brand awareness. Consumers exposed to advertising, word of mouth and/or other means of promotion are usually able to recall the brand, even when actual brand awareness and recognition is low (Pitta and Katsanis, 1995, p. 53). This means that advertising is an inevitable and a necessary tool in creating brand awareness. Nevertheless, to achieve higher levels of brand awareness, which can eventually lead to brand knowledge, the company needs to take actions to advance its advertising activities. The brand knowledge importance will be explained in depth in section 3.2.2. In addition, advertising activities have very important implications for the creation of brand portfolio. One of them is the role of the advertising in brand extensions. Company spends less on advertising of the successful brand extensions than on comparable new name products. Also, advertising can facilitate the synergy among the brand extension and the parent brand. Nevertheless, the ultimate role of advertising in the brand valuation exists, even though the mere expenses of the marketing department in the company does not represent added value of that department to the brand. Some companies are evaluating the
10

activities of the marketing managers based on the advertising and marketing communication expenditures. Today, clients believe that agents3 should be rewarded based on the value they add to brand, rather than on the amounts they spend on media (Zimmerman et al., 2002, p. 40). Therefore, the inclusion of advertising expenditures in the model should have some other form and meaning. Brand Equity Evaluator©, the model which will be used in this study, is measuring the extent to which the market/industry or company is brand driven through advertising expenditures (Zimmerman et al., 2002, p. 45). The logic behind this is that the higher advertising expenditures indicate the higher companies’ awareness of the importance of advertising in creating brand awareness in the market. On the other hand, it can also indicate that consumers are influenced by advertising and that the market is actually brand driven. 2.6 Perspectives of Brand Equity Brand equity can be viewed from the three different perspectives. One perspective is the so-called Consumer Based Brand Equity, first used by Keller and Aaker. The second one is the firm's perspective and the third point of view is the so called trade perspective (Farquhar, 1989, p. 24). 2.6.1 Customer Based Brand Equity According to Keller (2001, p. 14) companies can develop strong brands only if the brand development process includes the following steps: (1) establishment of proper brand identity, (2) creation of the appropriate brand meaning, (3) extraction of the right brand responses, and (4) building of appropriate brand relationships with customers. Keller introduces six building blocks which are part of the Customer Based Brand Equity pyramid (see Figure 1). Those building blocks are: salience, performance, imagery, judgment, feelings and resonance. Establishment of brand identity is based on the brand salience which refers to brand awareness. Consumer is aware of the brand existence if he/she is able to recall and to recognize the brand. The main criteria for brand identity, according to Keller, are depth and breadth of brand awareness (Keller, 2001, p. 15). The next step is the brand meaning which is divided into brand's performance and brand imagery. Brand performance as one of the building blocks refers to the basic purpose of the product itself, functionality, or the ability to satisfy customers’ needs. This characteristic of a product is its intrinsic facet. The other building element, brand imagery, is developed from the extrinsic property of a product itself and it is connected 3 Agent is an individual or organization empowered by one or more individuals, called principals to: 1) perform some services and 2) delegate decision-making authority to that agent. In this way managers are empowered by the owners of the firm – the shareholders – to make decisions (Brigham, 2002, p. 5).
11

to the possibility that the product will satisfy customer's psychological and social needs. Brand meaning needs favourable, strong and unique associations (Keller, 2001, p. 15). The third step, i.e. brand responses step is defined as the way customers respond to a brand. Responses are divided into brand feelings and brand judgments. Brand judgment is the combination of brand imagery and brand performance in the minds of the consumers. Brand feelings are customers’ emotional reactions to the social currency brand evokes (Keller, 2001, p. 16). Brand responses lead to the positive and accessible reactions of consumers. Lastly, brand relationship is defined as the relationship between the customer and brand, and it is related to personal identification of the customer with the brand. Brand resonance as a building block of brand relationship is defined as the depth of the psychological bond between the customer and the brand which results in loyalty. Criteria are the intense and active loyalty (Keller, 2001, p. 16). A strong brand satisfies all the above-mentioned criteria. The most powerful block is brand resonance. Therefore, the strongest brands will be those to which customers become so attached that they, in effect, become evangelistic and actively seek means to interact with the brand and eagerly share their experiences with others (Keller, 1993, p. 18). Figure 1: CBBE pyramid
Source: Keller, 2001, p. 19.
12

2.6.2 Firms’ Perspective (Company Based Brand Equity) Company based brand equity can be defined as incremental cash flows that are added by the brand itself to the overall company’s value. Added value of the brand is higher, the stronger the brand. This statement has the following implications. First, strong brands usually give the opportunity for successful brand extensions and for brand licensing. Second, very important implication is that strong brands are able to keep the profits at the usual level during the critical situations for the company as a whole. Since the brand, in some way, is able to transform a product into a “luxury good” regardless of the fact that generic product is not classified in this category, profits will remain the same, or the company will not have substantial decrease in profits during the period of crises at the macroeconomic level. The final implication of a strong brand can be examined through one of the components in Porter’s Five Forces model, i.e. barrier to entry. Markets which are dominated by leaders with very strong brands are usually not being a target of attack by competitors, since companies which own weak brands cannot enter the market. From microeconomics point of view, we can say that strong brands are able to provide monopolistic position for a company in the market, or at least in the niche market, in the long run. 2.6.3 Trade’s Perspective Trade’s perspective is becoming increasingly important since the new level of competition is evolving in the product markets. This refers to distributors. Traditionally, companies were distributing their products using the following channels: company → wholesaler → retailer →final customer. Today, internal relationships in this channel are becoming more complicated because traditional distributors endanger manufacturers’ brands and represent fatal obstacle to their success (Shocker et al., 1994, p. 152). Negotiating power of distributors in case of weaker brands is higher in comparison to the negotiating power of producers. This influences the marketing communication strategies of the corresponding companies, since their focus is turning to the distributors instead of the customers. In addition, brand managers have to choose between fighting the distributor brands or joining them (i.e., produce private labels for the retailer) (Shoker et al., 1994, p. 153). In order to support adequate decision regarding the fighting vs. joining, brand managers have to obtain marketing research information (Russel and Kamakura, 1994, p. 295). Strong brands are usually highly leveraged and this protects brands against private labels (Farquhar, 1989, p. 27). Brand equity and the brand leverage are moving into the same direction. This could mean that the highly leveraged brands are at the same time stronger, and can have higher brand equity over the other products in the market. This
13

source of added value comes from easier acceptance and wider distribution of powerful brands. 2.7 Brand Equity Valuation Situations In this section I present the most important brand equity valuation situations. It is divided into two parts. In the first one I make reference to various brand equity valuation situations, found in the literature. In the second part, I provide a short overview of the situations used most often, and those referred to as the most important. Brand valuation is extremely important for strategic brand management. During my research of brand equity valuation I have learned that number of situations, when the company needs the brand equity valuation, is increasing. A summary of the most relevant and most often valuation situations are as follows (Zimmermann et al., 2002, p. 9; Yates, 1999; Chandon, 2003, p. 8; Cravens, Guilding, 1999, p. 56): • Strategic brand management and
corporate strategy • Balance sheet valuation • Brand valuation for the sake of brand
portfolio management: acquisition and disposal of brands, as well as brand portfolio management
• Brand licensing • Infringement of brand rights • Internal marketing management • Enhancing management
communications • Enhancing internal communication as a
whole • Benchmarking with competitors • M&A planning • Monitoring value year on year • Creating a brand-centric culture • Tax planning • Financing and insolvency- securing
funds through identification of value of intangible assets
• Agency remuneration • Fair trading investigation
• The value of liquidity in case of forced sale
• The book value for the company accounts
• The value needed in order to encourage brands to lend the company money
• The value of losses or damage to the worth of brand
• The value for management control which depends on the behaviour encouraged by managers
• The value for the partial sales of asset
14

The first use of the brand equity valuation is in the strategic brand management. Brand equity tool can provide a strategic dimension to the brand management, so that the effects of the activities of a brand manager can be identified. Brand equity, in this way becomes the quantitative measure of the qualitative actions. Therefore, the brand equity valuation becomes a planning tool as well as a brand steering tool. The role of brand equity valuation as the planning tool is revealed through efficient allocation of resources invested in the brand (i.e. money, time, and knowledge). Brand equity valuation as the steering tool is used to identify strengths and weaknesses of a brand (Zimmerman et al., 2002, p. 7). The next use of the brand equity valuation is in the brand portfolio management. Important dimensions are brand consolidation, brand extensions, acquisitions of new brands and a disposal of existing ones. The meaning of the brand consolidation is as follows. If the company estimates that the number of brands exceeds the number which can be efficiently, managed, then some brands can be consolidated into one, so that company can rationally dispose of resources available. In this way, limited resources can be used more efficiently. The next dimension of a brand portfolio management are brand extensions. If the company sees the potential profit increase in the brand extension, then the brand equity valuation is used to measure added value of that extension. Proper brand valuation is of utmost importance in acquiring new brands. Many companies see the potential benefit in buying an established brand instead of investing in the development of a new one. The role of the brand equity valuation in this case is to asses the value of an individual target brand, its added value to existing brand portfolio, as well as synergetic effects which new brand incurs to existing company’s portfolio. While one side of the coin is brand acquisition, the other is brand disposal. Brand disposal is the activity of destroying or selling the brand, which is no longer profitable. Nevertheless, companies cannot count on the fact that disposing a brand will necessarily solve the problem of individual brands’ unprofitability. In many situations, unprofitable brand can have positive synergetic effects. In these situations, we should not dispose of the brand. One of the examples is Nivea crème, which was one of the first Nivea’s brands. Even though, it is no longer profitable, its disposal would destroy part of the value of the Nivea’s brand portfolio4. Third, as it has been already mentioned, brand valuation is used as a management tool. Senior management use it when evaluating different brand strategies and performance of marketing teams. At the same time, internal communication is enhanced through brand valuation in a way that it helps managers to point to the outcomes of their actions, and it 4 One of the examples used in the lecture on Brand Portfolio Management, Marketing Course, 3rd year (2001/00’) Faculty of Economics, Podgorica
15

could be used as a way to motivate managers. Clients believe that agents should be awarded depending on the value they add to brand rather than on the amounts they spend on media. This contribution will be recognized in case of all those who view advertising as reason d’être for creation of brands for clients. In addition, brand valuation provides enough information for negotiation regarding license fees, as well as licensing terms, the next very important use of brand equity valuation. Since valuation encompasses future expectations of the earnings of the branded product, this value is an adequate measure needed in licensing agreement. The next use is the determination of internal royalty rates, which are based on brand values. In the past, many companies allowed their affiliates to use their brands with no charge. All the profits (e.g. royalties) were taxed to Mother Company. Nowadays, tax authorities are being alert that these kind of profits should be taxed to the companies using the brand. Infringement of the brand right, as the fifth the most important valuation situation, is coming to the centre of attention, in case of so called “brand piracy” (Zimmerman et al., 2002, p. 12). Brand piracy is a wide spreaded “disease”, since many producers figure that it is more cost efficient just to take someone’s else’s brand instead of building and investing in their own. In this way, companies are losing part of their goodwill. Since the company, the owner of a brand is implicitly losing part of the market and profits, estimation of a potential loss is very difficult. Brand valuation is an extremely useful tool in case of potential lawsuits and estimation of lost goodwill. Lastly, brand equity valuation tool can be used in case of law disputes regarding the monopolistic behaviour. Market share of the individual company to a very large extent depends on the presence of its brand in the market. The law forbids monopolistic behaviour, but in case of extremely strong brands, we cannot speak of the monopolistic behaviour, i.e. if the company’s market share is largely dependent on their brands. This argument can be used in court of law (Srivastava and Shocker, 1999, p. 9). 2.8 Corporate Brand Equity The purpose of my master thesis is to calculate the corporate brand equity in the food and beverage industry in Slovenia. Therefore, the aim of this chapter is to analyze and distinguish the corporate brand from the other types of brands.
2.8.1 Corporate Brand Brand literature separates the following types of brands: a corporate brand, a portfolio of product brands and a product brand. Corporate brand is defined at the level of the company. The positive image of a strong company usually extends to credibility of the products sold
16

under the company’s brand, both existing ones and those that are new to the market (Siburian, 2004). According to Aaker when brands are managed separately and independently, or at an ad hoc basis, overall resources allocation among brands may be less than optimal (1996, p. 102). Therefore, having the corporate brand, or in other words cohesive brand portfolio, instead of number of individual product brands, is more rational from the company’s point of view. Corporate brand is defined primarily by organizational associations (Aaker, 2004, p. 7). It is extremely important to notice that organisational associations are equally important for both product and corporate brands. Nevertheless, the power, number and credibility of the organisational associations are larger in case of corporate associations. The main distinction between the product brand and its “umbrella” (corporate) brand(s) is that once the product brand is established, it begins its life in the eyes of customers independent of the organisation which created it. Corporate brand is permanently tied to both organisations and other brands of the company: product brands. The corporate brand perspectives are presented in the Figure 2. The main prerequisite for successful corporate branding strategies is that corporate brand has to provide the sincerity which will assure potential buyer that the product will satisfy her/his needs on physical, emotional and all other levels. That is why the corporate brands can be identified as “endorsers” before the product brand in question “begin to have a life on their own”. At the same time, corporate brand has to provide the valued relationship with the respected company (Aaker, 2004, p.7). The main differences between the corporate brand and the product brand will be summarized in the following section. The first difference is in the longevity. In this sense, product brands along with products might appear and disappear, and the products along with their brands have regular life cycle. The corporate brands, on the other hand, have roots, which are much “deeper” than the roots of the product brand. “Heritage” of the corporate brand is the basis for its success and “ever lasting life”. Heritage helps the brand reappear even after the crises. Corporate brand can provide a message, which can be different than the one of the product brand. Corporate brands with a long successful history can be perceived as reliable, high quality but at the same time as deja vu: boring and outdated. In these cases, a combination of successful organizational heritage and injection of the energy of the new brand is the right solution to the problem (Aaker, 2004, p. 7).
17

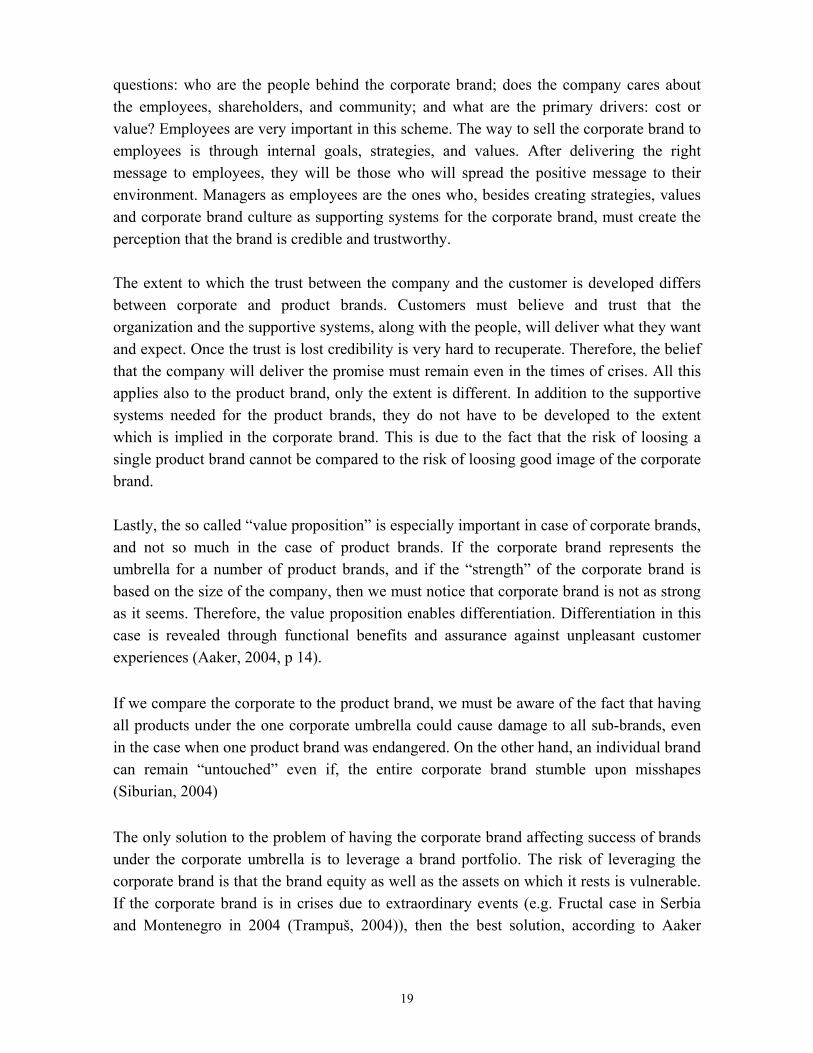
Figure 2: Corporate brand equity
CORPORATE BRAND • Heritage • Assets/Capabilities • People • Values/Priorities • Local/Global • Citizenship
CHALLENGES • Maintaining Relevance • Creating Value Positions • Avoiding Visible Negatives • Managing the Brand across Context • Making the Brand Identity Emerge
POTENTIAL IMPACT • Organizationally Based Differentiation • Corporate Programs as Branded
Energizers • Credibility – Liking, Expertise, Trust • More effective Management of the Brand Portfolio • Support for Internal Brand Building • Provides the Message to Supplement
the Product Brand • Support for Communication to
Audiences such as Investors,
Source: Aaker, 2004, p. 16. The second difference comes from the extent to which the stakeholders are involved in the development of the brand. Unlike the product brand, developing successful corporate brand involves all the stakeholders, as well as all the assets of the company. Assets and capabilities of the company transcend the message that the company is capable to deliver the quality and to fulfil the expectation of the customers. Employees of the company must be interested, responsible and empowered to deliver both quality and reliability. At the same time, they must be a part of the company’s image. Values and priorities are exquisite components, which are the drivers of the corporate brand, along with the concern for customers as the most important driver. The next component, which distinguishes the corporate brand from product brand, is a so called “citizenship” (Aaker, 2004, p. 9). This component actually involves the stakeholders throughout the creation of the good companies’ vibes, and it gives answers to the following
18
questions: who are the people behind the corporate brand; does the company cares about the employees, shareholders, and community; and what are the primary drivers: cost or value? Employees are very important in this scheme. The way to sell the corporate brand to employees is through internal goals, strategies, and values. After delivering the right message to employees, they will be those who will spread the positive message to their environment. Managers as employees are the ones who, besides creating strategies, values and corporate brand culture as supporting systems for the corporate brand, must create the perception that the brand is credible and trustworthy. The extent to which the trust between the company and the customer is developed differs between corporate and product brands. Customers must believe and trust that the organization and the supportive systems, along with the people, will deliver what they want and expect. Once the trust is lost credibility is very hard to recuperate. Therefore, the belief that the company will deliver the promise must remain even in the times of crises. All this applies also to the product brand, only the extent is different. In addition to the supportive systems needed for the product brands, they do not have to be developed to the extent which is implied in the corporate brand. This is due to the fact that the risk of loosing a single product brand cannot be compared to the risk of loosing good image of the corporate brand. Lastly, the so called “value proposition” is especially important in case of corporate brands, and not so much in the case of product brands. If the corporate brand represents the umbrella for a number of product brands, and if the “strength” of the corporate brand is based on the size of the company, then we must notice that corporate brand is not as strong as it seems. Therefore, the value proposition enables differentiation. Differentiation in this case is revealed through functional benefits and assurance against unpleasant customer experiences (Aaker, 2004, p 14). If we compare the corporate to the product brand, we must be aware of the fact that having all products under the one corporate umbrella could cause damage to all sub-brands, even in the case when one product brand was endangered. On the other hand, an individual brand can remain “untouched” even if, the entire corporate brand stumble upon misshapes (Siburian, 2004) The only solution to the problem of having the corporate brand affecting success of brands under the corporate umbrella is to leverage a brand portfolio. The risk of leveraging the corporate brand is that the brand equity as well as the assets on which it rests is vulnerable. If the corporate brand is in crises due to extraordinary events (e.g. Fructal case in Serbia and Montenegro in 2004 (Trampuš, 2004)), then the best solution, according to Aaker
19

(2004, p. 15), is to admit the wrong doing, or at least to admit that there is a problem, and to provide the visible solution to the problem.
2.8.2 Accounting Role in the Brand Valuation Another important implication of the corporate brand is related to the needs of the companies themselves, i.e. companies whose primary interest is to show the value of their assets in real terms. The fact is that brands represent approximately 62% of the total companies' value and in case of BMW this share is 77% (Sattler, 2001, p. 68). This validates the statement that the value of the brand must be attached to all the statements reporting the value of the company to its shareholders. Nevertheless, Abratt and Bick (2003, p. 25) highlight the reason why brand should be kept off balance sheet. Namely, keeping internally generated brands on the balance sheet statement decreases the profitability ratio (ROE) since the capital base is increasing. On the other hand, recognizing the brand as an asset is decreasing a firm’s gearing ratios (i.e. Return on total assets (ROA)5), since assets’ base is increasing. Brand equity is the value which should give the proper measure of brand goodwill in the financial statements. The value of the company presented in such a way is not providing the adequate picture for the potential investors. If the value of the brand is not included in financial statements, we can talk about hidden assets and information asymmetry. Therefore, financial statements must take into account both value of the brand as well as the value of all intangible assets (patents, licences etc.). Since measurement of the intangibles is difficult, and in many cases impossible, accuracy of the financial statement is always questionable. Brand valuation, and an inclusion of value obtained in this way (in the financial statements), is just one of the possible ways to decrease this inaccuracy. The answer to the question whether the value of the brand should be reflected in the balance sheet is as follows: even though the brand has no physical presence, it can be both sold and used for the generation of income, just as any tangible assets as such should be included in financial statements. This argument is supported by Srivastava et al., (1998, p. 27), who believe that shareholders value measurement should be based on valuable assets instead of traditional measures such as profit, market share or sales. The second question is what value should be taken into account for the statements. Since we cannot talk about the book value of a brand, market value is the one which must be taken into account. Valuation method, which takes into account brands market determinants, is a suitable one. Nevertheless, we have to keep in mind that active market6 5 Return on total assets is the ratio of net income to total assets (Brigham, 2002, p. 227). 6 Active market. Heavy trade volume for a specific asset or an entire exchange. In general, the more active a market is the more liquid it is. Liquid. Easily convertible to cash. (www.investorwords.com)
20

for brands does not exists meaning that we cannot directly assess its value, as in the cases of other assets. Depreciation of both the goodwill as well as the brand is the third issue. We cannot say that the brand value can be depreciated in the identical way as fixed assets (e.g. buildings, equipment) given that the value of depreciable assets is decreasing through the useful life of an asset. Traditionally, accountants have been writing-off the acquired “goodwill” and intangible assets, and failed to recognize internally generated intangible assets as balance sheet assets. The results are obvious: undervalued balance sheet values, which decreased the results of the management performance. In this way, ROA was extremely high due to the fact that the asset base is lower than it should be. In addition, we must notice that the value of a brand can decrease as well as increase. Therefore, the value of a brand must be appreciated or depreciated, respectively, while valuation method should, as has already been mentioned, encompass the future earning potential of a brand. The causes for not including brands on the financial statements are that accountants do not know how to value them and there is no appropriate regulatory system (i.e. accounting standard). Therefore, some of the companies were forced to “take the law into their own hands”. RHM, under the treat of take-over revaluated the entire brand portfolio (Yates, 1999.). The consequence of this was much higher take-over price. As the solution to this problem, the Accounting Standards Board published financial reporting standard 11 in July 1998. This was what all companies have been waiting for in order to start implementing FRS 10 (see Appendix I). One group of economists (Haigh, 1998, p. 7) claims that the accounts, which contain the value of brands are just a technical document, provided to analysts in order to calculate the value of the company. The second group believe that the financial accounts should represent the current value of assets. This means that assets should be revaluated on a regular basis. The main motive for this claim is the history of acquisitions showing that markets are not perfect and that they failed to recognize the true value of companies (Haigh, 1998, p. 8). Today, most of the companies attempt to present the value of their intangible assets in the Notes to the Accounts. Therefore, it is believed that Financial statements along with Notes to the Accounts will give much more information on the company, regardless whether the intangible assets are really included in the Balance sheet or not. With respect to of the short term and long term forecasts of the brand performance, we have the keep in mind the importance of the role and the relationship between accounting and marketing department. To be exact, the brand valuation is one of the most effective ways to bring accounting and marketing function together for the purpose of strategic brand management (Cravens and Guilding, 1999, p. 53). This is important since there is
21

large discrepancy between the information accounting department provides to marketing department, to those that marketing department actually needs. Accounting information are short term, internally oriented and usually related to past performance. However, marketing department needs reliable, verifiable and information that are free from bias (Cravens and Guilding, 1999, p. 54). In addition, it needs externally and future oriented information. However, some accounting data, i.e. consumer costing, can be very useful for marketing managers, because it is easy to identify the most important customers for the firm. In addition, one of the most important information that can be provided by accountants are brand valuation data which are long term and future oriented. These problems can be solved by using the information generated by accounting department. First if the support to the brand valuation is given by the accounting department, then we are able to say that the measure has both higher legitimacy as well as credibility, and it can help the entire organization to create mutual activities towards the future treatment of the brand. Second, in case of firms, operating internationally the problem of transfer pricing might occur. This can be illustrated with the example of Procter & Gamble, company which uses the brand valuation to determine the fair price for its subsidiaries, for using both the brand and the technology (Cravens and Guilding, 1999, p. 57). Thus, using the brand valuation, a company can decrease problems regarding the evaluation of international managers’ activities and international taxation problems. 2.9 An Overview of the Brand Equity Models The purpose of this section is to provide the overview of brand equity models. The first two sections describe the classifications of the models which have been used for brand equity valuation (traditional vs. BBDO’s classification of the models). In the third section I present the conceptual model from which the model developed used in this study originates. The fourth section describes the latest model of BBDO consulting, which was created along with the Ernst & Young. An overview of the brand equity models will be first presented in order to see what models fulfil the “contingency approach condition” (Zimmerman et al., 2001, p. 24). This proposition indicates that the model should be applicable to the specifics of a company or a product, as well as the industry. In this way brand valuation model becomes one of the strategic brand management tools that is applicable to all industries and companies. As such it helps the brand management to control, deploy and control resources in this segment. The final result is a monetary value, which can be used in various situations (e.g. acquisition of a brand and company, strategic brand management etc.).
22

One must be aware that none of the current models is perfect in its nature, and various alternative methods available for the brand valuation provide considerably different results. This indicates that the valuation necessitates the use of one standardized model which yields comparable results. At the same time, one has to be aware of the fact that there is a lack of active market for brands, which makes the empirical testing for the accuracy of the brand valuation impossible (Abratt and Bick, 2003, p. 24). The next issue is that one cannot separate the brand from other intangible assets (i.e. human capital). Therefore, we can say that the argument of Barwise et al. (1989, p. 46) that “at present, there is neither general agreement on valuation methods, nor can existing methods be regarded as theoretically valid or empirically verifiable” is true. Moreover, nobody by now has conducted a systematic meta-analysis of all brand equity models, which would test the verifiability and reliability of all available models.
2.9.1 Model Classification Traditional classification divides all models of brand equity in three categories: financial, consumer-based and composite models. The financial approach is explained by the definition of the brand equity provided by. Bekmeier-Feuerhahn (1998, p. 30), which is as follows: »brand equity is a net present value of future net surpluses over the cash inputs that owner of a brand can earn«. The main ongoing question is: “what is the value of a brand for a company or a producer?” Financially oriented valuations of brand equity should result in monetary value, which can be included in the financial statements of the company. Nevertheless, such valuations are of very limited capacity since they do not take into account all the aspects of a brand and its equity. Namely, they take into account purely financial aspects of the brand, while excluding all other aspects mentioned in Chapter 2.6. In addition, the application of these models is problematic in terms of: discount rate, growth rate and useful life (Kapferer, 1992, p. 25). The benefits of financial models are that most of them encompass the value-based techniques of the financial market to estimate a firm’s brand equity (Simon and Sullivan, 1993, p. 38). The estimation techniques extract the brand equity’s value from the value of a firm’s other assets. The methodology separates the value of a firm’s securities into tangible and intangible assets, and then carves brand equity out of other intangible assets. Second category of models are consumer-based. They value the brand from the consumer stand point. The main ongoing question is ”what is the value form the consumer’s point of view?” This approach takes into account consumer’s perception of a product, its quality and the added value of that product to the customer. The consumer-based perspective assumes the two multi-dimensional concepts of brand strength and brand value (Srivastava and
23

Shocker, 1991, p. 27). Brand strength is based on perceptions and behaviours of customers that allow the brand to enjoy sustainable and differentiated competitive advantages. There are two approaches for measuring the consumer-based brand equity: indirect approach and the direct approach The indirect approach requires measuring brand awareness, characteristics and relationships among brand associations. Brand awareness can be assessed effectively through a variety of aided and unaided memory measures that can be applied to test brand recall and recognition (Keller, 1993, p. 1-22). Brand associations are measured using qualitative techniques such as free association, tasks that lead customers to describe what the brand means to them, projective techniques such as sentence completion, picture interpretation, and brand personality descriptors. The direct approach, however, requires experiments in which, one group of customers responds to an element of the marketing program when it is attributed to the brand, and another group of consumers responds to that same element when it is attributed to a fictitiously named or unnamed version of the product or service. The ``blind’’ tests, are another example of the direct approach (Kamakura and Russell, 1993, p. 15). Other models can be viewed as combinations of afore mentioned approaches. Therefore, this can be viewed as comprehensive perspective, which incorporates both consumer-based brand equity and financial brand equity. This approach has been designed to make up for the insufficiencies that may arise when only one of the two perspectives is used. In addition, Dyson et al. (1996, p. 18) described a survey research system designed to place a financially related value to the consumer-based equity of brand images and associations. Motameni and Shahrokhi (1998, p. 275-290) proposed global brand equity valuations, which combine brand equity from the marketing perspective and brand equity from the financial perspective. 2.9.2 BBDO Classification of Brand Valuation Models The BBDO consulting, which along with the Interbrand can be classified into the group of the brand equity gurus, made its own classification of models. All the methodologies, which were created in order to find a way to valuate the brand, according to Zimmerman et al. (2001, p. 18), can be divided into the following four categories: • business finance-oriented methods • psychographics or behaviourally oriented methods • composite financial/behavioural models • input/output and portfolio models
24

As described in Table 1, individual approaches are applicable to various situations, and have their advantages and limitations. Since the purpose of my master thesis, is a calculation of monetary value of the corporate brands in the food and beverage sector, I can automatically exclude two categories of the models: psychographic/behaviourally oriented and input/output and portfolio models. The reason is that the results of application of the models classified in these groups do not result in monetary value. At the same time, if we look at the contingency approach proposition discussed in Chapter 2.9, one can exclude the group of business/finance models, since these do not take into the account the consumer perspective. Composite financial/behavioural models presumably fulfil the contingency approach proposition, defined at the beginning of the chapter. This means that the chosen model will be derived from this group of models. Table 1: BBDO Classification of models Categories Characteristics
Business Finance Models
• Quantitative procedures to compute a monetary value for brand equity
• Consumers perception not taken into account • Used to value brand equity in the context of
acquisitions, licensing and analysts’ opinions
Psychographic/behaviourally oriented models
• Brand equity seen as qualitative construct that can be made and manifested using scorecard
• Not empirically verifiable • High degree of subjectivity in the choice of
factors explaining brand strength • Endeavour to explain what goes on in the
“hearth and minds” of customers to determine a brand’s value
Composite financial/behavioural models
• Provide a monetary value for brand equity • Include variables covering earning status,
market status and psychographic status of a brand
• Interlink quantitative and qualitative factors
Input/Output portfolio models
• Establish a relative brand value index • Determine potential changes in a product’s
market share (given constant distribution) • Identify potential for optimizing specific
products
Source: Zimmerman et al., 2001, p. 13
25

2.9.3 BBDO’s Brand Equity Evaluation System (BEES) ranking The purpose of this section is to explain the model that provides a basis for my conceptual model of brand equity valuation. BEES model is created by the BBDO consulting. It is a multiphase factor model. The main benefit of this model is that it takes into account differences among industries. The main factor that distinguishes various industries is the advertising support cost, which varies form one industry to another. If these differences are not identified the results can be distorted. In addition, this component makes this model more universal than others. The model identifies eight determinants of the brand equity:
• brand sales performance and potential • brand net operating margin • brand development prospects • brand international orientation • brand advertising support • brand strength within the industry • brand image • brand earnings before taxes
These eight determinants of brand equity are aggregated to the following elements: market quality, dominance in relevant market, and international orientation of the brand, brand status and monetary basis. Market quality encompasses brand sales performance, net operating margin and brand development prospects, which are specifically determined by the experts’ opinions for each of the industries. These components are weighted to obtain market quality. This component along with the brand’s international orientation, brand advertising support, brand strength within the industry (defined as the % of sales of the brand in question relative to competitors), and brand image (defined as the brands attractiveness to stakeholders (Zimmerman et al., 2001, p. 44)) is aggregated into a new factor of brand equity, which is multiplied by the brand earnings before taxes. In this way one is able to obtain the brand equity value, which is comparable among the brands in different industries. In Figure 3, conceptual framework of the model is presented.
26

Figure 3: BBDO’s BEES
Source: Zimmerman et al., 2001, p. 43 Advantages. This model is classified in a group of composite financial - behaviour models, which means that it encompasses all necessary components and it takes into account all perspectives of brand equity. The advantage of the model is that it can easily differentiate among industries, in which the company operates. This is due to the presence of the market quality component, which includes the advertising support, the element used to differentiate between different industries. In addition, it is a forward looking model, which supports the proposition of Aaker (1996, p. 103), that brand equity is a strategic measure of brand performance. Limitations. This model can be applied only in the case of corporate brands, which reduce its applicability, and as such, it does not fulfil contingency approach proposition. The next limitation is the subjectivity in determining weights of the components of the model, and the subjectivity of experts’ when forecasting brand development. Therefore, the model, derived for this research, represents an upgrade of the model at hand, and it is conceptually based on this model. In addition, it is simpler and more comprehensive than the model described in this section, and is in line with the above-mentioned criteria for the usefulness of the model (see Chapter 3). 2.9.4 Brand Equity Value for Accounting (BEVA) model Existing brand equity models have their short-comings, and each of the newly developed models is an upgrade of the previous ones. A new model presented by the BBDO and the Ernst and Young AG, has been derived based on the experience and know-how compiled by these two firms in the previous decades. At the same time, it is the upgrade of the existing BBDO BEES ranking. Brand Equity Valuation for Accounting (BEVA) model includes two perspectives: strategic marketing and accounting/financial perspective. Best of
27

the two world’s approaches was taken, as the two companies’ collected valuable experience and expertise in this field. BEVA represents the multistage model which on one side uses the behavioural component (BBDO 5 level model) and the quantitative value approach (Relief from royalty7), on the other. The brand profit rate represents the central figure in derivation of brand value. The BBDO’s BEVA model calculation consists of five stages. The first is the brand strength determination, calculated on the basis of brand surveys. This component is combined with the license fees and the relevant brand meaning in the specific industry. In this way, company specific brand profit rate can be calculated. In the second step an analyst uses accounting data to estimate sales level, which in the further steps represents a basis for the calculation of the profit rate. The profit rate of the brand is used as a weighing factor for the monetary base. The results of the third step provide a brand-based income, and as in many discounted cash flow valuation, an appropriate discount rate. In the fourth step, the brand equity is calculated by summing the discounted cash value generated by the brand. This is the cash flow of saved license fees over some planned horizon. In many cases, the analysis demands that the »option value« is added in order not to lose the strategic options. If we include “option value” in the model, then we come one step further, since we include not only static components, but also introduce the component of future strategic decisions and moves of the company. The implication of the model is that it is to a large high extent universal, similar to the previously presented BBDO’s model. Again, since all the companies do not function in the same circumstances (regions and industries), it needs an adaptation. Since many companies do not have all products in the same industry, brand equity valuation model needs to incorporate the specifics of these situations as well. This results in form of some value, which must be reliable, and it can be used in the further decision-making process. It is very important to make sure that the data needed as the inputs of the model are readily available (i.e. financial data; brand strength can be tested using the customer surveys). In addition, the model is applicable to both corporate and product level. Model application is easier if applied to product level. Nevertheless, Slovenian companies do not provide enough
7 The "relief from royalty" technique has been used for many years in the valuation of intangible assets and intellectual property. It is based on the assumption that the owner of intangible property is "relieved" from paying a royalty to obtain its use. The technique is a permutation of the income approach in which a royalty rate (multiplied by the forecasted royalty base) is used to calculate an income stream attributable to the subject asset. Thus, the income stream calculated using the royalty becomes a surrogate for the economic benefit attributable to the intangible. A capitalization of that income stream becomes an indication of value. (www.royaltysource.com)
28

publicly available data for the calculation of the brand equity at product level. In addition, royalty rates/licensing, used for calculation of brand specific profit rate fees are not available for the Slovenian companies which are the focus of the empirical research and for that reason this model becomes useless for this study. 3 OUTLINE OF THE MODEL In this chapter I present the conceptual model applied in the empirical part of this thesis. The model is classified in the group of composite financial/behavioural models. The chapter is divided into two parts. In the first part, I will present the model and provide its arithmetical presentation. In the second section, I will present the brand strength, the element of the model which reflects the consumer perception of the brand. The conceptual model I derived for the empirical research in this study represents a combination of simple and applicable approach. In addition, if we are aware of the fact that brands are largely influenced by both “soft” and “hard” factors, we must include both groups of elements in the analysis. This model fulfils most of the following criteria for universality of the approach (Zimmerman et al., 2002, p. 24):
• it takes into account both monetary and non-monetary aspects of a brand. • it makes distinction between product and brand performance. • it enables brands’ valuation from various perspectives and it can measure different
types of brand equity (i.e. product vs. corporate brand). • it is cost-efficient and feasible. • it provides reliable, objective and valid results.
3.1 Brand Equity Evaluator© Conceptual model, in this study originates from the BBDO’s BEES ranking, which has already been presented in the section 2.9.3. The model is called the Brand Equity Evaluator©. It consists of the following five elements:
market quality dominance of the relevant market international orientation of the brand brand strength monetary basis
The model is based on the top-down approach since the valuation of the brand includes all dimensions of the brand: the industry or the market in which the company operates;
29

position of the brand in the market or the industry; the orientation of the brand, which connects the brand either to the local or international environment; the consumer perceptions of the brand and the cash flows the brand generates for the company which is the owner of the brand. In accordance with that, brand valuation process consists of four stages: valuation of the market quality (henceforward: MQ); valuation of the aggregate factor value (henceforward: AFV), the valuation of the discounted cash flows (henceforward: DCF) of a company or a product (depending on whether we talk about company or product brand) and of the brand valuation itself (henceforward: BV). Market quality element is included in the analysis because it provides an analysis of the “background” of the brand in terms of the environment in which the company, launching the brand, operates. For the purpose of valuation of market quality, a researcher needs to be familiar with the prospects of the market or the industry in which the company operates. The elements considered to be the most relevant for such an analysis include: sales performance (henceforward: SP) in the market, net operating margin (henceforward: NOM), and extent to which the market is brand driven (henceforward: BD). SP in the relevant market is determined as the three year average sales growth (Zimmerman et al., 2002, p. 17), and as such provides a clear picture of the future prospects of the market or the industry. If the sales growth rate is high, we can define the market as a growing market - one that affords the opportunity for a high future sales growth of the brand in question. On the other hand, if the growth rates are low and/or stable, we can talk about a mature market, whereby the future earning potential of the brand cannot be high. Third, if the sales growth rates are negative, we can conclude that the market is in a declining faze, whereby the future earning potential of the brand is much lower than in the two previous cases. NOM of the market, which is defined as the return of sales, provides a clear picture of the real earning power of the market, since the high sales level, do not necessarily imply high profitability. If the high amount of realized sales is “transferred” into the profit for the company, we can say that the market is efficient enough, and that it has high earning power. The third element of the MQ is BD. This element is determined as % of sales, which is spent on advertising in the relevant market or the industry. Therefore, if the substantial amount of sales is spent on advertising, companies are aware of the fact that these expenditures are regained through higher brand strength (e.g. brand knowledge) (Zimmerman et al., 2002, p. 20). Furthermore, these three components are aggregated into the MQ factor. Weights are determined according to the relevance of individual ratios for the specific valuation situation. Relevant valuation situations have been already mentioned in Chapter 2.7. The
30

specific valuation situation, in this empirical study, relates to the corporate brand valuation for the purpose of brand merger or acquisition. In accordance with the top-down approach, after the determination of the quality of the market in which the brand operates, we have to identify elements, which determine the quality of the brand itself. The first element, which should be calculated for this purpose is the dominance of the relevant market (hereafter DRM). This element describes the brands position in the relevant market in comparison to other competitive brands. A combination of high market quality, expressed in high market growth and high dominance of the brand, is the main prerequisite for the high value of the brand in comparison to other brands. Both of these indicators provide a better picture of the brand’s current financial strength as well as its future potential for market domination. The second element, to be determined with respect to the brand’s quality itself, is its international orientation (hereafter: IOB). This element positions the brand either at a local or at international level. It is defined as the brand sales at foreign market relative to total sales of the brand. Specification of the brand’s relevant market is important for determination of the international orientation of the brand and dominance at relevant market. The relevant market is one which is more important for the brand, than all other markets (i.e. local vs. foreign markets). Nevertheless, the purpose of the valuation as well as the availability of data gives the analyst the discretion right to define the relevant market on his/her own. It should be emphasized, however, that in case of small markets (i.e. Slovenian), one must be aware of the fact that the international dimension of the brand is extremely important, since the possibilities for growth of the brand are very limited in the domestic market. The third element of the quality of the brand itself is the brand strength (hereafter BS), which has been theoretically presented in Chapter 3.2 and section 4.2. Its empirical implementation is explained in Chapter 5.2. This element provides explicit perception of the brand in the eyes of consumers. All other elements, which are financial in their “character”, are implicit representations of consumer perceptions. After determining factors related to the quality of the brand itself (e.g. DRM, IOB and BS), we can conduct the second stage of brand valuation, i.e. the AFV valuation. This factor is calculated by weighting the four above-mentioned factors. Weighting of the factors depends on the valuation situation as well as the purpose of the analysis. The third stage of the brand valuation process is the DCF analysis. DCF is determined for the period of three years. Namely, the cash flows of the brand can be determined with the higher rate of precision for 3 years in comparison to longer periods. This element must be included in the brand equity model as it gives it monetary character, and as it is used to
31

reflect the cash flow generating power of the brand. Due to existence of time value of money, cash flow generated from the brand in different moments in time must be discounted at the moment of its valuation. Therefore, a discount factor must be determined. In the empirical study, Capital Asset Pricing Model (CAPM) is used to determine the discount rate. The main reasons are its simplicity as well as, the availability of data needed for the calculation of cost of equity8, using this model. The last stage of the brand valuation process is conducted by simply multiplying the AFV by DCF value. The result of the last stage is calculation of Brand Equity (BE). Arithmetic presentation of the model is as follows:
( ) DCFDRMdBScIOBbMQaBE ***** +++= where: BE – Brand equity MQ – Market quality IOB – International orientation of the brand DRM – Dominance of the relevant market DCF – Discounted cash flow of the company a,b,c,d – weights of corresponding elements
BDNOMSPMQ *** χβα ++= where. SP – Sales performance in the industry S – Sales α,β,χ - Weights of corresponding elements
100*3
22232
2
21
1
1 −−
−
−−
−
− ++
++
+
=
tt
t
tt
t
tt
t
SSS
SSS
SSS
SP
where: NOM – Net operating margin EBIT9 - In the industry S - Sales 8 Cost of equity is a return required by firm’s shareholders, and it can be estimated by three methods: 1) CAPM approach, 2) the dividend yield plus growth rate or DCF approach and 3) bond yield plus risk premium approach. 9 Earnings Before Interest and Taxes (EBIT). A measure of a company's earning power from ongoing operations, equal to earnings before deduction of interest payments and income taxes. EBIT excludes income and expenditure from unusual, non-recurring or discontinued activities. In the case of a company with minimal depreciation and amortization activities, EBIT is watched closely by creditors, since it represents the amount of cash that such a company will be able to use to pay off creditors. Also called operating profit. (www.investorwords.com)
32

100*3
22232
2
21
1
1 −−
−
−−
−
− ++
++
+
=
tt
t
tt
t
tt
t
SSEBIT
SSEBIT
SSEBIT
NOM
where: BD – The extent to which the market is brand driven Cadvertizing – Cost of advertising in the industry Sindustry – Sales in industry
100*industry
gadvertizin
SC
BD =
where: IOB – International orientation of the brand Sinternational – Sales in foreign markets Sbrand – Total sales of brand
brand
ernational
SS
IOB int= *100
where: DRM- Dominance of the relevant market Sbrand – Total sales of the brand Sleader – Sales of the industry leader
leader
brand
SS
DRM = *100
The weights, which are parameters in the model, depend on the brand valuation purpose, determined by a researcher. The purpose of this research is to test and apply the model, which can be used by beverages companies when they wish to calculate the acquisition price of the corporate brand itself. Weights will be determined on the basis of the opinion of experts from the financial institutions in Slovenia and the experts from Faculty of Economics in Ljubljana.
33

3.2 Brand Strength One of the elements of the model, as I have already mentioned, is the brand strength. It will be theoretically covered in this section. The elements of the brand strength: brand identity, brand knowledge, brand positioning and perceived quality are the base for the empirical part of the study. The theoretical background for these elements is also given in this section, while in the section on methodology I will explain the development of the methodological tools which are based on the theory. The brand strength element is important due to the fact that brand familiarity provides comfort to the consumer. This comfort is the consequence of trust and credibility. Taking into account “measures that matter”, institutional investors base 35% of their judgments of intangible factors such as management quality, effectiveness of new product development, and strength of market position (Kalafut et al., 1997, p. 45). It is difficult to communicate this information in the absence of a brand, or a corporate brand. Good management of the brand portfolio, as we have already said, demands the existence of the appropriate brand valuation tool as well as, other measures. If we rely on existing measures in the company, which are part of a internal accounting system, i.e., ROA, sales, cost margin or sales margin etc., we are looking at short term measures, which do not provide incentives for the investment in brands (Aaker, 1996, p. 103). Therefore, Aaker sees the brand strength as the sensitive and credible measure, which supplements the short-term financial measures. This measure is defined by Zimmerman et al. (2001, p. 46), with four different elements: brand identity, brand knowledge, brand positioning and perceived quality. These originate from Aaker’s four dimensions, which are as follows: brand loyalty, perceived quality, associations and awareness. Aaker’s Brand Equity Ten encompasses the four elements mentioned above as well as financial measures, as presented in Table 2. The appraisal of the brand strength can reveal areas of the brand vulnerability (Cravens and Guilding, 1999, p. 58). In this way, managers can consider adequate actions that should be taken in order to make adjustments in the brand management strategy and implementation, and they can make implications for the reallocation of budget. Even though Aaker sees all elements of the Brand Equity Ten as the elements of the brand strength, we will focus our attention on the following four elements: brand identity, brand knowledge, perceived quality and brand positioning.
34

Table 2: Brand Equity Ten
Loyalty measures • Price Premium • Satisfaction/Loyalty
Perceived quality/ Leadership Measures
• Perceived Quality • Leadership
Association/ Differentiation Measures
• Perceived Value • Brand Personality • Organizational Associations
Awareness measures • Brand Awareness
Market behaviour measures • Market Share • Price and Distribution Indices
Source: Aaker, 1996, p. 105 3.2.1 Brand Identity The concept of the brand identity originates from the corporate identity concept. The metaphorical use of the notion “identity” in the corporate context suggest that companies can be described through specific characteristics, due to the similarity with human beings (Karjalainen, 2003, p. 3). This was the starting point for the Aaker’s brand personality concept. According to Gagliardi (2002, p. 33) brand reflects the values and beliefs of the “brand originator” who is rooted in a particular culture. Therefore, brand can be perceived as the representation of the values, which are specifics to a certain company. This stands for both product and corporate brands. Identity functions in two directions: the brand towards the customer and customer towards the brand. Since the focus of each market oriented company is the customer, we can certainly claim that the former approach is much more “in use” than the latter. Brand towards the customer approach denotes that companies are becoming aware of the values, wishes and needs of their customers, and are attempt to generate brands which are communicating these values to the customers, and consequently meet the needs of their customers. If the “mission” of the company is successful and it results in the loyal customers, we can say that the company understands its customers. The second direction, i.e., customers towards the brand comes from the values of the customers, although the customer is one searching for the value-match. The result is basically the same. An identification with the brand as such relates to the acceptance of the certain values which are represented by the brand. The value of the brand in question is higher than the value, which the customer would obtain by buying another brand/product. The relation customer to brand can be seen as the perfect “fit”.
35

3.2.2 Brand Knowledge Brand knowledge is the fifth level of brand awareness (Aaker, 1996, p. 115), and it refers to both brand awareness and brand image (Chandon, 2003, p. 1). Brand awareness is one of the elements of the Brand Equity Ten. It can affect both consumer perception and attitudes of the brand. The levels of brand awareness are as follows (Aaker, 1996, p. 114): recognition, recall, top-of-mind, brand dominance, brand knowledge and brand opinion. Since the recognition is usually “attached” to new brands, the brand knowledge is appropriate for well-established brands. One of the problems that have been indicated by Aaker in the same study is that for some brands, name imagery cannot be separated from the familiarity with brand symbols and the brand imagery. 3.2.3 Brand Positioning One of the most important aspects of a brand positioning in the product category is how different or similar the brand is perceived to be in comparison to other brands in the product category (Sujan and Bettman, 1989, p. 454). Therefore, brand positioning influences the purchasing decisions in away that consumer sees the brand as unique, true and the one which meets his/her needs. The idea of positioning, although it relates to the modern branding strategies, dates to Plato’s assertion that memories evoke related memories, thus colouring interpretations (Marsden, 2002, p. 307). The main point is that the meaning of one idea depends of the positioning of the association in the network of memory. The idea of positioning can be represented through the “mind map” (see Figure 4). Figure 4: Association network
Source: Marsden, 2002, p. 308
36

Memes or genes of meaning are relevant to marketers since they are able to audit how the brands are positioned in the minds of customers (Marsden, 2002, p. 307). With respect to the link between the brand and its positioning in the mind of the customers, this study suggests that marketers should repeat the auditing process, and adjust brands accordingly. Consequently, marketers can accomplish the “perfect fit, between the brand and the ustomers’ needs.
chnical dimension of the product. Thus, we cannot apply it food and beverage products.
.2.4 Perceived Quality
s are usually prone to overestimate the quality of their favourite brand to other rands.
d of nother, is due to the perceived quality, even in cases when the price of later is higher.
.2.5 Brand Status
rand status in the Interbrand valuation model, are as follows (Abratt and Bick, 2003, p.31):
c In addition, the focus of the brand positioning is the perception of brand features. These features can be perceived as positive, neutral or negative. The brand is well positioned in the mind of the customer, only if the brand is “appealing” (Sujan and Bettman, 1989, p. 457), and, if it is differentiated from the other brands. An especially important facet of the brand is its functionality. Nevertheless, this facet is important in the case of some goods, since this feature relates to the teto 3 Perceived quality is one of the key elements of the brand equity since it is proven that this element is associated with the price premium, price elasticity, brand usage and stock return (Aaker, 1996, p. 109). As such, this element can be applicable to all brand types, across products and markets. It is also very important to notice that this element “works” only if we compare the brand in question with the competitive brands. The other issue is that loyal customerb Aaker claims that quality “can be key driver” (1999, p. 110) in cases of some brands. By looking at the products and corporate brands in the food and beverage industry, it can be concluded that perceived quality of products is extremely important, and it may be the most important element. This is in line with the notion that most of the products in this sector can be considered as “inferior” goods. This means that the choice of buying one good insteaa 3 Brand status can be viewed as a parallel to Aaker’s Brand Equity Ten. The components of the brand status are developed by the Interbrand. The Interbrand uses the forecasted profit deduced by the capital charge to get the Economic Value Added (EVA). Brand earnings are determined using the “brand index”. The seven components of the brand index, or the b
37

Market: 10% of brand status. Brands in markets where consumer preferences are more enduring would score higher. For example, a food brand or a detergent brand would score higher than a perfume or a clothing brand, because these latter categories are more susceptible to the swings of consumer preference.
Stability: 15% of brand strength. Long established brands in any market would normally score higher, because of the depth of loyalty they command. For example, Rolls Royce would score higher than Lexus.
Leadership: 25% of brand strength. A market leader is more valuable: being a dominant force and having strong market share matters. For example based on this score, it is likely that the Coca-Cola brand would out-perform Pepsi on a global basis.
Profit trend: 10% of brand strength. The long-term profit trend of the brand is an important measure of its ability to remain contemporary and relevant to consumers, according to Interbrand.
Support: 10% of brand strength. Brands, which receive consistent investment and focused support, usually have a much stronger franchise, but the quality of this support is as important as the quantity.
Geographic spread: 25% of brand strength. Brands that have proven international acceptance and appeal are inherently stronger than regional brands or national brands, as they are less susceptible to competitive attack, and therefore represent more stable assets.
Protection: 5% of brand strength. Securing full protection for the brand under international trademark and copyright law is the final component of the brand strength in the Interbrand model.
This model is not perfect. For example, several of the components have a built in preference for older brands, and as such may not give adequate recognition to the value of newer brands such as Amazon or Starbucks.
3.3 Advantages of the Model Developed in this Study There is a number of benefits yielded by the inclusion of certain variables, in the model, developed in this study. First, the model encompasses both financial and consumer perspective of the brand equity. This is extremely important, since only in this way the monetary value of the brand, can be determined and provide necessary information for decision-making regardless of the brand valuation situation. At the same time, this approach provides an incentive for cooperation between the two very important departments in the company: financial/accounting and marketing department, and increase the quality of information, that one department provides to another. This can lead to a better brand management, and higher brand performance, which in the long run, yields positive effects on the overall performance of the company.
38
Moreover, the model is very simple, and it can be easily adapted to the specifics of each industry/market as well as to an individual company, and/or brand. All information needed for the brand valuation using this model are readily available to the company, which uses it. At the same time, a potential investor can easily collect all necessary information for conducting brand valuation, which makes the decision making process much easier when acquiring the shares of the company or the brand. The availability of information as well as availability of information on brand value increases market efficiency, because all changes in actions of the brand management department can be reflected promptly in the stock prices of the company, represented by the corresponding corporate brand. One of the main advantages of the model developed n this study lies in its universality. The element which provides a certain degree of universality is the market quality. This element gives the possibility to adapt the model to specifics of the industry/market of the brand. At the same time, the model can be adapted to the specifics of the brand valuation situation by changing the weights assigned to each of the elements in the model. From all of the above, it can be concluded that the ability to adapt the model to specifics of the market, to use it in both brand and corporate brand valuation as well as to use it regardless of the valuation situation makes this model more universal than others. In addition, its wider implementation across companies would provide comparable brand valuation results across product/corporate brands. Moreover, wider implementation would make inter-temporal comparisons possible, as well.
3.4 Limitations of the Model Regardless of the fact that model is universal to the extent that it can be applied in a number of different situations, it has some disadvantages, that should be kept in mind in its implementation. The first disadvantage concerns the market quality element, or its “sub-element” i.e. sales performance. Since this element as well as other elements of the market quality (i.e. net operating margin and the extent to which the market is brand driven) should provide information on the market perspectives, they should be “future” oriented. On the other hand, it is difficult to accurately estimate the sales performance of the market as a whole. For this purpose, analysts are widely using data on historical performance of the market. Even though the data on historical performance have a low predictive power, these are the only predictors of future performance that are readily available. The next problematic area relates to the monetary component of the model, i.e., to the discounted cash flow of the brand. DCF calculation encounters two problems. One of them
39

is similar to the one explained above, and it is the problem of estimating the cash flows in the future. We have to take into account that estimation is far from a science, and most of experienced analysts are not able to estimate what will be the sales level in the next 3 years with 100% accuracy. The second issue is the issue of calculating the discount factor since the capital market in Slovenia is not as developed as Western markets. The cost of equity, determination consists of estimating beta as well as risk premium of the company. The difficulty of estimating beta comes from the short history of Slovenian capital market, illiquidity of the market, and absence of adequate predictor of the market returns for Slovenian capital market. The solution to this problem is explained in detail in 5.2 Chapter of the thesis. The next problem is to test of universality of the model, as defined in the section 2.9. Although it theoretically exists, it cannot be easily proven in practical sense. This is due to fact that all corporate brands, which will be included in the analysis, come from the same industry: the food and beverage industry in Slovenia. This problem is addressed by taking the sub-industries (e.g. beer industry, juices industry etc.), which are a part of the same industry (processing industry), and treating them as independent industries. In my opinion this is the optimal way to test the universality of the model, as this treatment of the sub-industries can provide results that reflect the differences across industries. The last problem of the model relates to the availability of data for the analysis. All data needed for the analysis are obtained from the publicly available sources. Public sources provide enough data for the corporate brand valuation. Nevertheless, the same sources do not all provide data needed for the implementation of the model on the product level. Therefore, in this case universality of model is reduced due to the unavailability of data.
40

4 METHODOLOGY
The objective of this chapter is to describe the methodology used in the research. The chapter is organised into four sections. The first section discuses the overall research design. The second section is focused on questionnaire design. These two sections are related to the primary data analysis. The third section is related to secondary data research methodology, while the last section covers the hypothesis proposed in the research.
4.1 Research Design - Primary Data Since the aim of this study is to analyse the phenomenon of brand equity, cross-sectional, research design is selected as it involves the collection of information from any given sample of population elements only once (Malhotra and Birks, 1999, p. 66). A survey method, with the use of highly structured questionnaire was applied. Although this method seemed to be the most appropriate in this research, there are some disadvantages of the method, in terms that it is time consuming and researcher is not able to cover all the geographical regions of the relevant market. The second problem is the non-response. The third problem is the interviewer’s bias. In order to mediate this problem, the questionnaire in this study was self-administered in the presence of the interviewer. Interviewers’ involvement was limited to the explanation of the purpose of the research and the instruction regarding the questionnaire. The sampling frame in this study was drawn from Slovenian population. The survey was conducted in Ljubljana, Celje, Kranj and Novo Mesto. The sample size is 600 respondents. The sampling technique used was a sampling without replacement which, by definition, refers to inclusion of all the sample elements only once (Malhotra and Birks, 1999, p. 360). At the same time, non-probability quota sampling is utilized. Control characteristics for the first stage of selection are defined in the Table 3. Quotas are calculated on the basis of demographic characteristics of Slovenian population.
41

Table 3: Control characteristics
Male Female Total Age
49% 51% 100% 18-30 25% 74 77 15031-45 30% 88 92 18045-60 28% 82 86 16861-75 18% 53 55 108
100% 297 309 600Source: Census, 2002 (URL: http://www.stat.si)
4.2 Questionnaire Design “Questionnaire is a structured technique for data collection consisting of a series of questions, written or verbal, that a respondent answers” (Malholtra and Birks, 1999, p. 326). According to the authors, the main drawback of this technique is a lack of theory for the questionnaire development, which would guarantee optimal design. I came across the similar problem in the questionnaire design, for this study. There was no single questionnaire, which encompassed all elements needed for the development of the brand equity research instrument for measuring its brand strength of the corporate brand. In order to refer to this issue I compiled the relevant literature. As it has already been mentioned, the brand strength encompasses four elements: brand identity, brand knowledge, brand positioning and perceived quality of the brand. Scales used in this study were based on the existing theory, even though I was not able to apply it completely for two reasons. First, none of the existing scales were developed exclusively for the food industry. The other reason is that while all scales were developed for product brands, I attempt to measure the brand strength of corporate brands. Questionnaire, originally developed in English, as well as its translation to Slovene language is provided in the Appendix III (see A - 13). I used 7-point Likert scale for all constructs. This is due to the fact that the literature, suggests that the reliability of the 7 – point scales is higher than when using the 3 and 5 – point Likert scales. Since the scope of this research and time constraints did not allow the development of own scales, I adopted existing scales. The basis for the development of the scales was given by Law and Lamb (2000, p. 350-368), Washburn and Plank (2002, p. 47-48), Yoo and Donhthu (2001, p. 1-14).
42

Brand positioning scale was created using the brand personality scales developed by Aaker (1997, p. 351), Franic and Pathak (2003, p. 484), Sujan and Bettman (1989, p. 454-67), brand personality theory developed by Ouwersloot and Tudorica (2001, p. 1-25) and Bhat and Reddy (1998, p. 32-43). Brand knowledge scale is developed on the basis of “brand familiarity” scales developed by Kent and Allen (1994, p. 98-100). One of the problems that have been indicated by Aaker in the same study is that for some brands name imagery cannot be separated from the familiarity with brand symbols and the brand imagery. The suggestion, that this measure could be based on the open-ended questions about what comes to the respondent’s mind when the brand is mentioned (Aaker, 1996, p. 115), was taken into account in the questionnaire design, as well. The scales used in the perceived quality section of the research instrument on the Aaker and Jacobson’s (1994, p. 191-201) perceived quality scales, as well as the brand trust scale developed by Delgado-Ballester (2003, p. 335-353). The scales which should be used for the measurement of perceived quality, according to Aaker (1996, p. 109) are as follows: a) this brand has high/average/low quality; b) this brand is the best/one of the best/one of the worst/ the worst and c) this brand has consistent/inconsistent quality. Brand identity scales are developed on the basis of the scales introduced by Dolich (1969, p. 81.). All elements mentioned in the section 3.2.1 were included in the empirical part of this research, as the elements for testing the brand identity. Brand identity, brand knowledge and perceived quality scales have already been developed for a variety of brands, which simplified the adoption procedure. As I have already mentioned, the scales were not developed specifically for the food and beverage corporate brands, which means that the adoption had to be made for this purpose. On the other hand, brand positioning scales have not yet been developed. Some of the items, from the original in English had to be left out and others had to be changed. The suggestions were provided by experts from the Faculty of Economics in Ljubljana, and a native speaker who was translating the questionnaire, since they believed that questions would be misunderstood. At the same time the format of the Slovene translation of the questionnaire was adjusted, so that all the statements for individual companies were on a single page. In this way, the time needed for the questionnaire administration was reduced. At the same time, respondent was not able to see the logic behind the structure of the questionnaire, as all the questions were part of the same “entity”. This was not the case with the original questionnaire in English, and we attached the original version without adjustments, which were made in Slovene questionnaire (see Appendix III).
43

Questionnaire was originally created in English language, as I have already said. The questionnaire actually used in the survey was translated and adapted from the original in English language. There are two reasons for the translation and the adaptation of the questionnaire. The first is that the all respondents certainly cannot be fluent in English. The second reason is avoiding misinterpretation and miscommunication (Aaker et al., 1998. p. 328). The person chosen to translate the questionnaire is fluent in both languages: Slovene and English. At the same time the person has extensive experience in the area of both academic and marketing research in Slovenia. The original version of the questionnaire, in English and Slovene were compared. All the changes made, were for the purpose of making it understandable to the Slovenian respondent in a way that the meaning and the logic of the question was not changed. Comparison of the two versions of questionnaire is given in the A – 13 in the Appendix III. The questionnaire was pre-tested on the sample of 10 respondents before the final data gathering. This was made in order to identify possible problems with the questionnaire. The pre-test group was defined in accordance to the control characteristics given in the Table 3. The participants were asked to evaluate the questionnaire for clarity, bias and ambiguous questions. The participants were also asked to comment on the instrument regarding the wording, sequencing and timing. The pre-test study did not indicate that time needed for answering the questions was too long. Data were collected on a sample of 600 people, which was drawn from the Slovenian population. Respondents were asked to fulfil the questionnaire in the presence of the interviewer. The interviews were conducted in Celje, Ljubljana, Kranj and Novo Mesto. After the data were collected they were entered in the SPPS for windows since there was no need for special data preparation. This is due to the fact that all the scales were ordered in the same direction (from negative to positive), and there was no need for reversing the data. Open-ended questions, on the other hand, were used to obtain additional explanations. Data analysis commenced with the calculation of summary statistics. After that, factor analysis has been conducted, on the items that constitute brand strength scale. Data were analysed using SPSS for Windows 10.0. Data analysis of the primary data will be presented in detail in the Chapter 5.
44

4.3 Secondary Data The secondary data needed for the analysis were collected from publicly available sources. This included financial data such as sales revenues of the company in the industry, as well as the sales of the entire, earnings before interest and taxes of the companies and industries (hereafter: EBIT), and advertising costs. These data were used for the analysis of financial “history” of the industry and companies in question, as well as the forecast of the companies’ cash flow for the three years period. This enabled me to calculate the necessary financial elements of the model. Companies/corporate brands from the food and beverage industry included in the analysis are Droga D.D.; Kolinska D.D.; Pivovarna Union D.D., Pivovarna Laško D.D., Radenska D.D. and Fructal D.D. Details of secondary data analysis is provided in Chapter 5. 4.4 Research Hypotheses As it has been already outlined in Chapter 3.2, Aaker sees the brand strength as the sensitive and credible measure, which supplements the short-term financial measures. Since the model used in this study encompasses both short-term measures as well as brand strength, we have to assess the brand strength influences the overall brand equity. Therefore I propose the following hypothesis:
1. Corporate brand equity in the Slovenian food and beverage sector.
H1: Brand equity value, without the brand strength element differs from the brand equity value, which includes the brand strength element, regardless of the corporate brand in question.
2. Individual corporate brands.
H2: Corporate brand equity value of: H2a: Droga; H2b: Fructal: H2c: Kolinska; H2d: Laško; H2e: Radenska; H2f: Union without the brand strength element differs from the brand equity value, which includes the brand strength element.
Brand strength element exclusion indicates that the weight assigned to other factors in the model will be different from the ones which would be assigned to elements in the original model. This is due to the fact that in case of exclusion of brand strength, the model will have only three different elements instead of four. These hypothesis, assume that the brand strength is excluded from the model. Therefore, the weights normally assigned to this factor, are “transferred” to remaining factors.
Therefore, I have to propose another set of hypotheses, which assumes that the weights assigned to elements in the model have not been changed. This means that the influence of the brand strength element on the brand equity can be tested also without changing the
45

weights. The purpose of this test is to see what the difference between the brand equity is if a consumer has an opinion (has an established perception) of the brand and the brand equity if consumer does not have an opinion (does not know a brand). Proposed hypotheses in this case are as follows:
3. Corporate brand equity in the Slovenian food and beverage sector.
H3: Brand equity value, if consumer does not know the brand differs from the brand equity value, if the consumer has an opinion on the brand, regardless of the corporate brand in question.
4. Individual corporate brands.
H4: Corporate brand equity value of: H4a: Droga; H4b: Fructal: H4c: Kolinska; H4d: Laško; H4e: Radenska; H4f: Union if the consumer does not know the brands differs from the brand equity value, if the consumer has an opinion on the brand.
If we summarized the proposed hypotheses, the most important difference between the two sets is as follows. The first set of hypotheses is the difference in the brand equity value, if the brand strength element is actually not included in the model and the brand equity if the brand strength is included. I have to stress that this is not supported theoretically, since the original model, actually encompasses the brand strength element. The goal of the hypothesis is to assess the difference between the results of purely financial model and composite financial/behavioural model (i.e. original one).
The second set of hypothesis is testing basically the same phenomenon as the first one, only in the second case we are assuming that brand strength is excluded from the model due to the fact that consumers do not have an established opinion on the brand (do not know the brand), even though the model remains the same.
46

5 DATA ANALYSIS The goal of this section is to present the data analysis. It consists of two major parts. The first is secondary data analysis, while the second one presents the primary data analysis.
5.1 Secondary Data Analysis In this section I present secondary data analysis is presented. It consists of five parts. In the first part I present the way I have determined the weights, which are later assigned to different elements of the model. In the second, the third, the fourth and the fifth part I present the calculation of the financial elements used in the model. Lastly I present the discounted cash flows calculation, which gave the monetary character to the model. 5.1.1 Factor Weights Weights in the model are determined in accordance to the brand valuation situation. The assumed brand valuation situation is acquisition of the corporate brand. Therefore, the weights are determined in line with the needs of the brand acquisition process. Since there are no theoretical guidelines established for determination of factor weights, which could be used in the model, I consulted Slovene practitioners to give their view on the topic. Serial of interviews was conducted in one of Slovene financial institutions and expert suggestions were included in the analysis. Practitioners have extensive knowledge and experience in the field of the mergers and acquisitions’ in Slovenia and they have conducted a number of deals in the Slovenian market. At the same time, they can be considered to be familiar with the situation in Slovenia, and can provide better estimates than the theory in the field. In addition, I have conducted an interview with one of the academics from the Faculty of economics, who has the extensive experience in the area of brand valuation and management, and used his suggestions on the subject. All interviews were conducted during the October 2004, in the headquarters of the financial institutions and at the Faculty of Economics. Results are presented in the Table 4. Table 4 shows that opinions of Slovenian experts from financial and marketing sphere are different on the factor weights. Nevertheless, their overall opinions do not differ noteworthy, and on the basis of their arguments, I have decided to use the weights which are presented in the table in the column «weights used». The arguments are presented in the following section of this chapter.
47

Weights used for the individual elements of market quality are 30% for the sales performance of the industry, 30% for the net operating margin and 40% for the extent to which the market is brand driven. The opinions of the experts are that the extent to which the market is brand driven is the most important element for the market quality valuation. This is supported by the arguments that if the market is not brand driven, consumers as well as the companies do not perceive the brand value as important, and they make the purchasing decision on the basis of price. Growth perspective of the market as well as the margin, which can be earned in the market, can be considered equally important. While the sales performance growth reflects the positive attitude toward the brand, net operating margin shows whether the consumers are willing to pay «extra» price for the brand (product/corporate brand), i.e. whether they are willing to pay the price premium. The argument of the academic from the Faculty of Economics that the NOM as a measure of the company or industry performance is unreliable, is taken into account in a way that I have not assigned the largest weight to this element. According to this professor, this measure can give an inconsistent picture of the industry prospects (e.g., Fructal in the 2003 was profitable, while in the 9 months of the 2004 it had a substantial loss). Table 4: Factor Weights 10
Weights11 Expert 1 Expert 2 Expert 3 Academic Weights used
α 0,30 0,30 0,30 0,50 0,30β 0,10 0,10 0,30 0,30 0,30γ 0,60 0,60 0,40 0,20 0,40a 0,30 0,35 0,30 0,20 0,30b 0,30 0,21 0,20 0,40 0,30c 0,20 0,21 0,20 0,30 0,20d 0,20 0,22 0,30 0,10 0,20
Arguments for the weights used in the final brand valuation are as follows. Thirty percent is assigned to the market quality, since the growth prospects of the market are extremely important for the growth of brand equity. This means that existence of brand in the low-quality market decreases the growth prospects of the brand as well as it decreases the brand equity value. At the same time, the thirty percent is assigned to the dominance of the relevant market element. The argument is that if the brand is one that has a high market share, it can enable company to generate higher profits. In addition, the brand equity of the leading brand in high growing market has high brand equity as a consequence of synergetic effects. In other words this value is higher than the equity value the brand would have if it
10 Based on interviews with managers and academic experts 11 γ – assigned to SP; β - assigned to NOM; γ - assigned to BD; a – assigned to MQ; b – assigned to DRM; assigned to IOB; d – assigned to BS.
48

were launched merely in the growing market, or if it were merely a leader at the market with low growing prospects. The expert opinion suggests were that the two remaining elements (i.e. international orientation of the brand and brand strength) are less important than the previous two (i.e. market quality and dominance of the relevant market). At the same time, they have argued that IOB element is very important for Slovenian brands since the local market is relatively small. Therefore, I have decided to give equal weights to the brand strength and international orientation of the brand (twenty percent), even though I personally believe that the brand strength is more important (consumer opinion of the brand is the most important since it influences all other elements). In addition, the weight assigned to this element depends on the goal of the investors. The weight is higher if investor perceives the market as small (e.g. Slovenian), or if investor wants to reduce future advertising expenditures in the foreign markets. This reduction is possible, when the brand has already-established position in the international markets, and the company does not have to spend so much on advertising as in the case of newly established brands. One can argue that the weights determination must be left to the discretion of individual investors, and their goals in specific acquisition situation. Therefore, this topic was not theoretically covered as one cannot find universal solution. I tried to provide a rationale for the solution, and even though it is not perfect, I believe it can be a starting point for the decision on the weights for individual elements, in case of companies, interested in adopting the model. 5.1.2 Market Quality The following four industries, which are part of the food and beverage sector in Slovenia, were included in the analysis beer production industry, water production industry, juice production industry, other food processing industry and tea and coffee production industry. Data obtained from the publicly available sources on these industries were used for determination of market quality. According to the model market quality of these industries in Slovenia, can be determined on the basis of three ratios: sales performance, or sales growth, net operating margin and advertising expenditures as the % of sales in the industry (Zimmerman et al., 2002, p. 17). The results are presented in the Table 5. Table 5 shows the market quality of the tea and coffee industry in Slovenia is the highest. This is the consequence of two elements included in the model. The high net operating margin indicates that this industry is among the most profitable industries from those included in the analysis. The market quality element has been influenced by the extent to which the industry is brand driven, as well.
49

Table 5: Elements of the model
LAŠKO UNION KOLINSKA DROGA FRUCTAL RADENSKA MQ12 0,0245 0,0245 0,0387 0,0464 0,0366 0,0036
SP -0,0016 -0,0016 0,0566 0,0148 0,0600 -0,0118NOM 0,0714 0,0714 0,0506 0,1105 0,0494 0,0011BD 0,0088 0,0088 0,0165 0,0220 0,0095 0,0171
DRM 1,0000 0,8335 1,0000 1,0000 1,0000 1,0000IOB 0,3470 0,3300 0,3470 0,3322 0,5719 0,2719
Source: Annual reports, IBON and IBO Market quality of the beer industry is second lowest due to two elements: the extent to which the market is brand driven and its sales performance. As it can be seen from the Table 5 average growth of sales in the last three years was negative (in real terms), which means that this industry is in a declining stage. This can be explained by the increasing number of competing brands in the Slovenian market, and the fact that the beer consumption is decreasing (FAO, 2003). Net operating margin of the industry is the highest; however this element did not significantly influence the «ranking « of the market quality component. Tea and coffee production industry is ranked number one if we take into account market quality. This is due to the fact that it has positive sales growth, even though not the highest sales growth. On the other hand it has the highest both net operating margin and extent to which the market is brand driven. Juice production industry has the third highest market quality. Juice production industry has the market quality, which is largely influenced by its high sales performance (the highest from all the industries included in the analysis), even though the extent to which the market is brand driven is among the lowest in the sample of industries in this study. Water production industry has the lowest market quality. The first reason for this is the negative sales performance, which is the result of negative growth of sales in the three years period chosen for this analysis. Net operative margin is also among the lowest. This means that the high extent to which this market is brand driven (BD) could not neutralize negative influence of two other elements of the market quality of this industry.
12 MQ – market quality, SP – sales performance, NOM – net operating margin, BD – the extent to which the market is brand driven, DRM – dominance of the relevant market, IOB – international orientation of the brand.
50

5.1.3 Dominance of the Relevant Market Relevant market for one corporate brand includes all the markets in which the company operates. The corporate brand, as “exporter” of company’s value (Aaker, 1991, p. 190), has the same relevant market as the corresponding company. In this analysis, I have not included all the markets relevant for the brand. The relevant market is defined narrowly – as the domestic market. This was done due to limited time resources and extent of the analysis. In addition, each of the corporate brands included in the analysis except for the Union, is the market leader. Therefore, dominance of the relevant market for all the companies except the one mentioned are equal and maximum (i.e., 1).
5.1.4 International Orientation of the Brand From the Table 5 it can be seen that Fructal is the corporate brand, which is more internationally oriented in comparison with other corporate brands. All other companies are exporting around 30% of the products to foreign markets, under their corporate brand. I have to stress that this element is extremely important for the Slovenian selected corporate brands, since the domestic market is extremely small. 5.1.5 Discounted Cash Flow for the Selected Corporate Brands Discounted cash flow element is the result of discounting of cash flows generated from the corporate brand. Cash flows generated from the company as a whole, are assumed to be equal to the flows generated by the corresponding corporate brand. Even though there is a difference between the cash flows generated from the corporate brands and cash flows generated by the company as a whole, there is no better approximation which could be used in for calculation of DCF of the corporate brands. Discounted cash flow for the corporate brand is determined on the basis of estimated free cash flow of the corporate brands for a three years period (i.e., 2001, 2002, 2003). Since it is difficult to predict free cash flows accurately, especially if not familiar with the operations of the company or corporate brand in question, I used a three year forecast (i.e. 2004, 2005, 2006) available at IBON (Information on Slovenian companies’ solvency). These were the only readily available data. Estimations of the free cash flow on the IBON are based on companies’ past performance, which is not the best predictor of the companies’ future performance. Consequently, the obtained results have to be taken with the certain degree of caution. The best kind of data would come from interviews with the companies’ management. Nevertheless, I used readily available data, and tried to make the necessary adjustments to the model, in order to make the most of the data available. Data were available in Slovenian tolars. All data were recalculated in EUROs to neutralize the
51

effects of currency exchange rate changes. Exchange rates used in the analysis are presented in the Table: A - 12 in the Appendix II. The Table: A - 12 presents both historical exchange rates (2001 to 2003) and predicted exchange rates (2004-2006). Although the discount factor is widely used in the valuation of the cost of capital, I have decided to use the cost of equity. This decision is supported by the valuation situation of the corporate brand value in this study i.e. mergers and acquisition. This argument is supported by Brigham (2002, p. 871), who says that in the cased of mergers we should use the equity residual method to value the cash flows of the target. The estimated net cash flows belong solely to the shareholders of the acquiring firm, and therefore they should be discounted at the cost of equity. For the purpose of objective analysis, I calculated beta as well as the cost of equity, which is used for the discounting of the free cash flows. Betas, available at IBON, for the companies are 1, which indicates that all companies included in the analysis are as volatile as the market. My calculation has proven the opposite. I plotted the market returns against the stock returns for the companies. I assumed that the SBI20 index of the Ljubljana Stock exchange is the best predictor of the market returns. This assumption is supported by the fact that some of the companies included in the analysis comprise SBI20. The slope of the regression, with stock returns of the individual companies (capitalized without dividend returns) as an independent variable, and SBI20 index as dependent variable have been used for the calculation of cost of equity later in the analysis. Even though the companies’ past stock returns are not the best predictors of the future volatility of the stock and the results have to be taken with a certain degree of caution, this is the optimal predictor available in the Slovenian market. The problem with some of companies included in the research (i.e. Radenska d.d.) is their illiquidity in the year 2004, which caused a low result for beta in 2004 (only 0,09). Nevertheless, beta to be used in the model is calculated on the basis of stock returns (daily) from the moment the companies were quoted at the Ljubljana Stock Exchange to until 22.10.2004. The model used for the calculation of the weighted average cost of equity is the CAPM model. Results for beta, cost of equity and WACC for individual companies are presented in Table 6.
52

Table 6: Beta and WACC in 2003
Weights Cost Ticker Beta S-T15
debt L-T16 debt Equity S-T
debt L-T debt Equity ETR13 WACC
14
KOLR 0,69 0,00 3,29 96,71 7,60 8,60 7,87 23,70 7,83DRPG 0,56 4,87 24,02 71,11 7,60 8,60 7,18 7,30 7,37PILR 0,74 5,40 26,36 68,24 7,60 8,60 8,14 13,00 7,88PULG 0,76 0,00 3,76 96,24 7,60 8,60 8,25 0,00 8,26RARG 0,44 11,86 2,89 85,25 7,60 8,60 6,52 24,20 6,43FRAG 0,29 20,43 5,59 73,98 7,60 8,60 5,75 5,90 6,17RFR17 4,20 MRR18 9,50 Source: www.ibon.com and www.ljse.si Results of the discounted cash flows analysis are presented in Table 7. As we can see the discounted free cash flow generated by Droga is the highest, while the one generated by Radenska is the lowest. Table 7: DCF for the three years period
Company DCF
Kolinska 64.735Droga 66.056Laško 34.857Union 49.526Radenska 33.534Fructal 22.023
Source: www.ibon.com and www.ljse.si The result is the highest for Droga which indicates the highest future generating power. This could also mean that Droga could have the highest brand equity value. Nevertheless, all other elements can significantly change is assumption. The lowest cash generating power is evident for Fructal, which indicates that the last years of Fructal’s financial history cannot be defined as successful in comparison to others. Nevertheless, at this point, I am merely comparing the absolute figures for different companies.
13 ETR – effective tax rate 14 WACC- weighted average cost of capital 15 S-T - short term 16 L-T-short term 17 RFR – risk free rate (Interbank interest rate) 18 MRR – market rate of return (Bošković, 2004, p. 68)
53

5.2 Primary Data Analysis The objective of this section is to test reliability and validity of the scales used in the consumers research part of the study: brand identity, brand knowledge, perceived quality and brand positioning. At the same time, I present the descriptive statistics of the multi-item scales. In the last section of the chapter, I present the testing of the hypothesis, which were proposed in section 4.4.
5.2.1 Reliability and Validity Tests We need two access two important requirements for measurement which are as follows: validity and reliability. Validity indicates that the measurement should be valid or accurate, while reliability indicates that outcomes of the measurement should be repeatable. 5.2.1.1 Reliability Tests First, I will access is reliability. According to Malhotra and Birks (1999, p. 313), reliability refers to the extent to which measurements of the particular test are repeatable. This means that the outcomes of the measurement, in repeated sequences of measuring, must be consistent. The greater the level of consistency in repeated sequences in which we assess measures, the greater the reliability. The measure which is used in the thesis in order to test the reliability of measures is coefficient Crombach's alpha, which is defined as the average of all possible split-half coefficients, which result from different ways of splitting the scale items (Malhotra and Birks, 1999, p. 314). The value range of this coefficient is between 0 and 1. The value of the coefficient is closer to 1 indicates the greater reliability, which refers to a greater commonality among the items. In other words, the items indicate the same thing about the construct. The recommended value of the coefficient is 0,7 (Sharma, 1996, p. 118). The values of the coefficients calculated using SPSS reliability procedure are presented in Table 8. It an be seen that the values of reliability coefficients for all constructs is greater than 0,83. Reliability of the construct BRAND STRENGHT as a whole is 0,93.
54

Table 8: Reliability of scales
Construct Number of items Alpha BRAND STRENGHT 4 0,9390
KNOWLEDGE 4 0,8568 QUALITY 5 0,9191
POSITIONING 3 0,8379 IDENTITY 5 0,9137
Source: Field research 5.2.1.2 Validity Assessment The second measure that is calculated in order to fulfil the requirements of the measurement is validity. According to Malhotra and Birks (1999, p. 770), validity is the extent to which a measurement represents characteristics that exist in the phenomenon under the investigation. Two types of validity are tested in research: content validity and construct validity. Content validity is based on judgement estimation, whether the scales measure the domain they are supposed to measure. The content validity in this research was measured in three ways. First, all scales have been borrowed from previous studies on the same subject, as explained in 4.2, and were adapted to the specifics of this research. The second way of testing the validity was that the translated version of the questionnaire was judged an expert by from the Faculty of Economic, in order to test whether the terminology used in the questionnaire was adequately adapted to the Slovenian language. Lastly, I have conducted the pre-test of questionnaire. The questionnaire was given to ten respondents who gave their comments on the content of the questionnaire, Chapter 4. The results of the testing show that the questionnaire satisfies the condition of content validity. Assessment of the construct validity refers to the extent to which the measures relate to other measures in a manner consistent with the theoretically based concepts (Malhotra and Birks, 1999, p. 315). Two types of construct validity were examined in the study: convergent and discriminant validity. While the convergent validity tests indicate the level to the items in the same construct converge in the same direction (homogeneity), the discriminant validity evaluates the level to which the measures (i.e. constructs) “deviate” from each other (heterogeneity). Therefore, what should be expected is homogeneity within the construct and heterogeneity among the constructs (Malhotra and Birks, 1999, p. 315). One of the measures created to test both convergent and discriminant validity, in this study is the correlation matrix. The items in each of the constructs are highly statistically significant. However, I only present the correlation matrix for the constructs, which was a
55

result of the factor analysis (see Table 9). It can be seen in Table 9, that correlations between constructs are strong, positive and statistically significant. Table 9: Correlation matrix
KNOWLEDGE QUALITY POSITIONING r 0,7285QUALITY P 0,0000r 0,7327 0,8776POSITIONING P 0,0000 0,0000r 0,7004 0,8783 0,8750IDENTITY P 0,0000 0,0000 0,0000
Source: Field research In addition, factor analysis, which is a class of procedures primarily used for data reduction and summarization (Malhotra and Birks, 1999, p. 760), is used to examine discriminant validity. Factor loadings were obtained using SPSS factor analysis procedure in order to create constructs. The value of factor loadings indicates the strength of the relationship between the item and the factor. The minimum requirements for the value of factor loadings is 0,3; one should take into account all factor loadings with the value above 0,4 as important, while those which have the value above 0,5 are considered significant (Sharma, 1996, p. 111). Therefore, higher the factor loading, the claim that the item is represented by the factor which is assigned to it, is more reliable. In this thesis, SPSS factor analysis procedure has been used to examine the brand strength constructs. The extraction method used is principal component factoring. Explanation of the construct development is provided in the following sections. 5.2.2 Brand Strength Construct Brand strength consists of four constructs: brand knowledge, perceived quality, brand positioning and brand identity. The purpose of this section is to explain how the scales for each of the constructs were developed. It is divided into two sections. First, I explain the process of scale development and items, which ultimately constituted the brand strength scale. At the end, I explain the brand strength scale development itself. Brand knowledge. This construct in measured by four items. These items were included in the brand strength questionnaire, as it was explained in sections 3.2.2 and 4.2. Brand knowledge is defined as the extent to which consumers are familiar with the corporate brand. Factor loading scores are presented in Table 10. As one can see all factor loadings for brand knowledge construct are highly significant (above 0,7). The lowest factor loading is for the fourth item of the brand knowledge construct (0,786). Therefore, all items formed the brand knowledge scale.
56

Table 10: Factor loadings of brand strength items
Items Factor loadings KNOWLEDGE 1 0,867 KNOWLEDGE 2 0,833 KNOWLEDGE 3 0,868 KNOWLEDGE 4 0,786 QUALITY 1 0,888 QUALITY 2 0,913 QUALITY 3 0,895 QUALITY 4 0,814 QUALITY 5 0,820 POSITIONING 1 0,869 POSITIONING 2 0,916 POSITIONING 3 0,822 IDENTITY 1 0,828 IDENTITY 2 0,895 IDENTITY 3 0,884 IDENTITY 4 0,871 IDENTITY 5 0,835
Source: Field research Perceived quality. This construct was measured by five items. This construct refers to the extent to which consumers perceive the quality of products, produced by the company with the corporate brand in question. It can be seen in Table 10, that the factor loadings are significant, just as in the case of brand knowledge construct (higher than 0,7). The lowest factor loading is 0,814. Therefore, all items formed the perceived quality scale. Brand positioning. This component consists of three items. This construct measures how the corporate brand in question is positioned in the minds of customers. It can be seen in Table 10 that loadings on this factor are highly significant. The lowest is the factor loading is 0,869. Therefore, all four items included, formed the brand positioning scale. Brand identity. This construct consists of five items. This construct measures the extent to which the customers perceive the corporate brand identity as positive. Factor loadings on this factor are presented in Table 10, and it can be seen that factor loadings are highly significant. The lowest factor loading is on the first item (0,828). Therefore, all five items formed the brand identity scale. The four constructs measure the same phenomenon: brand strength. As the theory suggests, I have conducted the second-order factor analysis, on the previously created scales, and obtained the results presented in Table 11. All factor loadings for brand strength are highly
57

significant and they are all higher than 0,7. This means that all scales loaded “cleanly” on brand strength construct. The lowest factor loading is for the brand knowledge scale (KNOWLEDGE), it is 0,850. Therefore, the four constructs, formed the brand strength scale. Table 11: Factor loadings – brand strength
Constructs Factor loadings KNOWLEDGE 0,850QUALITY 0,948POSITIONING 0,948IDENTITY 0,940
Source: Field research
5.2.3 Descriptive Statistics In the following sections I present the main findings obtained using the SPPS descriptive statistics procedures. This chapter is divided in two sections. The first one presents the descriptive statistics of the sample (i.e., demographic characteristics), the second one presents the descriptive statistics of the measures. 5.2.3.1 Descriptive Statistics of the Sample – Demographic Characteristics The proposed structure of the sample has been already presented in Table 3. The sampling technique used was quota sample, and the quotas have been constructed to reflect the characteristics of Slovenian population. Nevertheless, as it was not possible to fulfil this goal, the demographic characteristics of the actual sample differ slightly from the proposed one. The demographic characteristics of the actual sample are presented in Table 12. The largest difference appears in the age group from 61-75. The explanation for this difference is that some of the respondents, after I have explained what the purpose of my survey is, were not willing to answer.
Table 12: Demographics of the sample – gender and age structure
AGE MALE FEMALE TOTAL 18-30 83 78 161 31-45 90 108 198 46-60 78 73 151 61-75 47 43 90
TOTAL 298 302 600 Source: Field research
58

Other demographic characteristics are presented in the Appendix II: A - 2 and A - 3. In table A - 2, the structure of the sample is presented by taking into consideration region the respondents’ region. It can be seen that 47% of total number of respondents was from Ljubljana, only 1% was from Prekmurje. In table A - 3 in the Appendix II I have presented the structure of the sample, taking into consideration the education of the respondents. It can be seen that 42% of the respondents have secondary education. Only 6% of the respondents attained a masters or doctoral degree. 5.2.3.2 Descriptive Statistics of the Measures - Whole Sample (N=600)
The purpose of this section is to present the findings of descriptive analysis for the measures conducted on the entire sample (regardless of the company)19. In Table 13 summary statistics for all the items, factors (constructs) of the brand strength and brand strength itself is presented. The size of the whole sample is 600 units. Since the means of all items, are higher than the scales mid-point, an overall conclusion is that the respondents in this study agree (on average) with the statements in the questionnaire regardless of the corporate brand in question. This means that all the “elements” of the brand strength (i.e. brand knowledge, brand identity, perceived quality and brand positioning) are present to certain extent in the Slovenian market regardless of the brand in question (the lowest mean (4,45) on the 7 – point scale is for the first item of the brand identity). Nevertheless, I believe that the extent to which the consumers are familiar with the corporate brands, identify themselves with the corporate brands, perceive their quality, and find the brands appealing, is not high enough. In addition, I believe that all the elements of the brand strength can be improved through strategic brand management actions.
The mean of the corporate brand knowledge is 5,08 (SD = 1,37), and it is the highest among the brand strength factors. This indicates that Slovenian consumers are familiar with the corporate brands from the food and beverage industry20 included in this research. The literature does not provide the cut-off points for the “goodness” of corporate brand knowledge. Nevertheless, among all other elements of the brand strength, corporate brand knowledge can be considered as the most advanced one. This means that consumers do recognize and know that certain corporate brand and corresponding product exist. Nevertheless, corporate brand knowledge can be improved through marketing
19 Regardless of the company taking into account only the ones included in the research. 20 I am not generalizing in any point of the study. All conclusions relate only to the corporate brands included in the research.
59

communication activities (e.g., advertising). The effects of advertising on brand knowledge are presented in the section 2.5. The mean of the perceived quality of the corporate brand is 5,02 (SD = 1,25). This indicates that Slovenian consumers are (on average) familiar with and aware of the quality of these corporate brands, and the products produced by these companies represented by the corporate brands in question Corporate brand positioning has the mean of 4,85 (SD = 1,29). Therefore, we can say that corporate brands from the food and beverage industry, regardless of the corporate brand in question, are well positioned in the mind of consumers, even though the mean is just above the scale’s mid-point. The explanation could be that the characteristics of the corporate brands included in the analysis are perceived as appealing (on average). On the other hand, but the extent to which the consumers perceived them as appealing, in my opinion is not high enough, for consumers to establish “emotional” attachment to the corporate brand. Corporate brand identity, with the mean of 4,80 (SD = 1,23). This means that consumers are able to identify themselves with the brand, of the company. Consequently they can find fit between their values and the ones represented by the brand. However, I cannot judge the strength of the link among the values of the consumers and those represented by the corporate brands.
The mean of the corporate brand strength is 4,94 (SD = 1,18), which means that the brands of the corresponding companies are strong, even though its mean is close to the scale’s mid-point. The theory does not provide the strict cut-off points for the “goodness” of the brand strength. Nevertheless, I believe that the brand strength mean value surely indicates positive prospects for the corresponding corporate brand (i.e. since it is higher than the scale’s mid-point).
In sum, we can say that consumers (on average) are aware of the presence of corporate brands, selected in this research, and they are familiar with the products and characteristics of the products. The brand knowledge is established, and it is followed by a certain degree of awareness of the quality that is attached to the corporate brands (brand names) and to the products, which are represented by these corporate brands. Nonetheless, based on the above presented results, I believe that consumers are not emotionally attached to the corresponding corporate brands, even though they perceived them as appealing. All the above statements are supported by answers to open-ended questions. The most of consumers, if asked to state their associations with the names of the corporate brands were naming the products of the corresponding companies rather than their associations with the corporate brands (Appendix II: A - 4). In addition, I believe that there is no perfect “fit”
60

between the values represented by the corporate brands and the values of consumers. All this indicates that some changes in strategic brand management activities should be made in future in these companies. Table 13: Descriptive statistics for constructs of brand strength – whole sample
Variable Mean SD BRAND STRENGHT 4,9423 1,1867 KNOWLEDGE 5,0858 1,3746 KNOWLEDGE 1 5,0167 1,5579 KNOWLEDGE 2 4,6433 1,6525 KNOWLEDGE 3 5,2083 1,5766 KNOWLEDGE 4 5,4750 1,7780 QUALITY 5,0217 1,2545 QUALITY 1 5,1917 1,4749 QUALITY 2 5,1817 1,4655 QUALITY 3 5,1300 1,3903 QUALITY 4 4,9350 1,5269 QUALITY 5 4,6667 1,3864 POSITIONING 4,8583 1,2915 POSITIONING 1 4,6950 1,5229 POSITIONING 2 4,9750 1,4781 POSITIONING 3 4,9050 1,4570 IDENTITY 4,8033 1,2380 IDENTITY 1 4,4533 1,4905 IDENTITY 2 4,9350 1,4495 IDENTITY 3 4,7267 1,5119 IDENTITY 4 4,8800 1,3707 IDENTITY 5 5,0217 1,3494
Source: Field research
61

5.2.3.3 Descriptive Statistics of Measures - Sub Samples In the following section I provide the explanation of the brand strength construct means for the sub-samples, as well as the differences between brand strength means for independent samples21. These explanations will show which of the corporate brands included in this research is the strongest. In this way, I will be able to explain the differences of the influence of the brand strength element on the final calculation of the brand equity.
The criterion for creation of sub samples was individual corporate brand22, included in this research. The number of respondents in each of the sub samples was 100 as presented in the Table 14 and Table 15. I have tested the differences between brand strength means for more independent samples, (i.e. different corporate brand included in the research) using ANOVA procedure. It has shown the differences in brand strength, between the corporate brands included in the research. In addition, I have applied a posterior analysis23 as well. Method used for the posterior analysis is LSD (Least Significant Difference). The results on the significance of the differences between brand strength construct mean can be seen in the Appendix II (Table: A - 6).
Results of the analytical procedures mentioned above have shown that the corporate brand strength of Fructal is significantly different from the brand strength of other corporate brands included in the analysis (see Table: A - 6 in Appendix II). Fructal has the highest mean for brand strength of all the companies included in research, with a mean of 5,59 (SD = 1,01). This indicates that Fructal is a corporate brand, which is (on average) perceived better than all other companies included in this research (measured by brand strength). The strength of Fructal brand is larger than in all other cases analysed. Corporate brand strength of Radenska significantly differs from the brand strength of other corporate brands included in this research except for Laško (Appendix II: Table: A - 6). Its mean is 5,23 (SD = 1,12), which indicates that Radenska is the next strongest brand (on average) among the corporate brands included in the analysis. Laško corporate brand strength (on average) is significantly different from the strengths of the other brands included in this research, except for the Droga and Radenska (Appendix II: Table: A - 6). Union corporate brand strength differs significantly from the most of the corporate brands included in the analysis, with the exception of Droga and Radenska. Union and Laško have the following brand strength means 4,70 (SD = 1,16) and 5,00 (SD = 21 Independent samples - companies 22 From this point forward, company name refers to the corporate brand (e.g. Fructal refers to the corporate brand Fructal). 23 Procedure is used, when one has no prior knowledge about the relationship between the groups (Malhotra and Birks, 1999, p. 365).
62

1,27), respectively. Since difference in the brand strength between the two corporate brands is significant and in favour of Laško, I can conclude that Laško is stronger. If we take a look at the regional distribution of the sample respondents (Appendix II: Table: A - 2) we can see that the largest number of respondents comes from Ljubljana. Hence, I can conclude that the regional ethnocentrism did not influence the perception of corporate brands in question as much as I expected. ANOVA (Appendix II: Table: A - 6) revealed that corporate brand strength of Droga differs significantly from the corporate brand strength of other corporate brands included in this research (on average), except for Laško and Union corporate brands. Corporate brand strength of Kolinska, on the other hand significantly differs from the brand strength of all the other corporate brands included in this research (on average). Corporate brands Droga and Kolinska have the following means: 4,76 (SD = 1,10) and 4,36 (SD = 1,11) respectively. Therefore, I can draw two conclusions. The first one is that the corporate brand Droga is perceived as stronger than Kolinska corporate brand (on average). The second is that Kolinska, with the lowest mean, is perceived as least strong brand (on average) from all corporate brands included in this research. Overall conclusion from the brand strength analysis is that corporate brands classified in the beverage sector are, (on average), stronger than corporate brands from the food sector. Nevertheless, we have to take into account that the domain industry is not the only industry in which some of the corporate brands can be classified (e.g. Fructal and food for children). This is what makes this conclusion questionable. This argument is also supported by the fact that beer and water production industry have had a negative sales growth in the last three years in Slovenia (see: Table 5), which could categorize these industries in the group of declining industries (see section 5.1.2).
63

Table 14: Descriptive statistics – BRAND STRENGHT
Company BRAND STRENGHT
Mean 4,7633SD 1,1060DROGA N 100Mean 5,5930SD 0,9255FRUCTAL N 100Mean 4,3608SD 1,1159KOLINSKA N 100Mean 5,0038SD 1,2788LAŠKO N 100Mean 5,2318SD 1,1233RADENSKA N 100Mean 47009SD 1,1618UNION N 100
Source: Field research Analysis of the brand strength constructs provides clear picture on the reason why some corporate brands are stronger than others. The descriptive statistics of the brand strength constructs are presented in Table 15. Fructal has the highest means on all the elements of the brand strength. This means that, on average, Slovenian consumers are the most familiar with the brand, perceive the quality of products represented by the corporate brand Fructal as the highest, find it the most appealing, and can easily attach their values to the one represented by the corporate brand Fructal, and consumers identify themselves with this corporate brand better than in other cases of corporate brands included in this research. Radenska is some sort of a follower, since the means on all elements of brand strength are the next highest relative to Fructal (see Table 15). The means of the brand strength elements in case of Laško and Union are indicating the following: while consumers are more familiar (on average) with the corporate brand Union than with Laško, those that are familiar with both corporate brands perceive the quality of the later as higher (on average). Laško corporate brand is (on average) more appealing. Respondents (on average) can easily identify themselves or their values with the one, which is represented by Laško corporate brand.
64

Droga and Kolinska, are the least familiar brands (on average), particularly Kolinska (mean = 4,15; SD = 1,40). This means that people have problems to picture the corporate brand in their minds. This can be explained by the fact that they are using individual branding strategy (Droga) and brand licensing (Kolinska). On the other hand, perceived quality represented by the Droga is higher than the one represented by Kolinska and Union. Kolinska is positioned just above scale mid-point which is, in my opinion the consequence of low familiarity (knowledge) with the corporate brand. In addition, I can conclude that the respondents are indifferent in terms of the corporate brand in question. In other words, neither can they identify themselves with this corporate brand, nor are they able to find a good “fit” with the values represented by Kolinska corporate brand. Table 15: Descriptive statistics for elements of brand strength
Company KNOWLEDGE QUALITY POSITIONING IDENTITY Mean 4,702 4,958 4,716 4,676SD 1,255 1,156 1,219 1,172DROGA N 100 100 100 100Mean 5,607 5,718 5,576 5,470SD 1,014 0,990 1,021 1,020FRUCTAL N 100 100 100 100Mean 4,150 4,628 4,353 4,312SD 1,404 1,131 1,184 1,136KOLINSKA N 100 100 100 100Mean 5,220 5,014 4,833 4,948SD 1,444 1,377 1,397 1,281LAŠKO N 100 100 100 100Mean 5,520 5,230 5,133 5,044SD 1,187 1,174 1,254 1,189RADENSKA N 100 100 100 100Mean 5,315 4,582 4,858 4,370SD 1,379 1,326 1,291 1,236UNION N 100 100 100 100
Source: Field research 5.2.4 Hypothesis Testing The objective of this section is to test the hypothesis proposed in Chapter 4.4. I proposed two sets of hypotheses, in order to test the influence of the brand strength on the brand equity value. After entering primary data, into the SPPS, I entered secondary data results, which are calculated in section 6.1, as well as all the other financial measures which are calculated in the section 5.1.2 and presented in Table 19. In this way, I have created a data base for
65

comparison between the corporate brand equity value calculated when including the brand strength component, and brand equity value without the brand strength component. Financial data and the “soft data” (i.e., brand strength scores) are measured using different scales, and as such cannot be compared. Therefore, I conducted standardisation procedure for the brand strength scale. According to Malhotra and Birks (1999, p. 435), standardisation is the process of correcting data to reduce them to the same scale by subtracting the sample mean and dividing it by standard deviation. The brand strength scale has been standardized at the level of the whole sample using the SPSS standardization procedure. This is, in my opinion, an optimal way to include this element into the model. Consequently, I have obtained the z-scores, which can be entered in the Brand Equity Evaluator© model. For the purpose of testing the two sets of hypotheses proposed, I conducted paired - samples procedure, i.e. the two sets of observations related to same respondents (Malhotra and Birks, 1999, p. 474). 5.2.4.1 The First Set of Hypotheses In section 4.4, I proposed that the corporate brand equity value which does not include the brand strength component differs from the corporate brand equity which includes the brand strength component. Although the model as proposed by the BBDO consulting includes the brand strength element, I removed it because I wanted to test it as if the model were strictly financial. Therefore, I assumed there were only three elements in the model (MQ, IOB and DRM). The brand strength, on the other hand was excluded. The removal of this component affected the weights in a way that they were equally divided among the three elements of the model (i.e. 0,33). The value used for comparison was calculated using the original model, which included the brand strength element. This means that the weights were assigned to each of the elements as explained in Table 4. The results of the testing are presented in Table 16. The analysis was conducted for both entire sample as well as for each of individual corporate brands. The purpose of this hypothesis is to substantiate that the brand value if we exclude the brand strength (BE_OUT) differs from the brand value if we include the brand strength (BE_WITH). In addition it is tested on the entire sample, to see whether this hypothesis is holds regardless the corporate brand in question, taking into account only those corporate brands included in the research. Results in Table 16 indicate that these differences exist.
66

Table 16: The paired sample test results
Sign of the difference t-value Sig.
(1-tailed) N
WHOLE SAMPLE 600H1: BE_OUT – BE_WITH + 9,556 0,000
DROGA 100H1a: BE_OUT – BE_WITH + 5,619 0,000
FRUCTAL 100H1b: BE_OUT – BE_WITH - -0,269 0,394
KOLINSKA 100H1c: BE_OUT – BE_WITH + 9,267 0,000
LAŠKO 100H1d: BE_OUT – BE_WITH + 3,037 0,001
RADENSKA 100H1e: BE_OUT – BE_WITH + 0,880 0,190
UNION 100H1f: BE_OUT – BE_WITH + 5,585 0,000
Source: Field research Although I proposed no-directional relationship, the results indicate positive direction, which means that including brand strength component negatively influences the overall brand equity value (Appendix II: Table: A - 7 ). Second hypothesis was tested on individual corporate brands. From Table 16, it can be seen that the differences between BE_OUT – BE_WITH are significant in the case of the following brands: DROGA, KOLINSKA, LAŠKO and UNION. On the other hand, we cannot say that this holds true for FRUCTAL and RADENSKA. Paired-sample means are positive in case of all corporate brands except for Fructal. In other words, only for Fructal, an inclusion of the brand strength component would have positive effects on the corporate brand equity. However, the difference is not significant (p = 0,190). An overall conclusion is that inclusion of brand strength in the model influences the brand equity value significantly. Nevertheless, the sign of difference is positive in most cases (with the exception of Fructal). This indicates that the inclusion of the brand strength elements in the model has negative influence on the corporate brand equity. In my opinion the explanation for this in the case of investigated corporate brands, is that consumers do not perceive them in a way which would make this difference both significant and positive, and increase the value of the brand equity of corporate brands in question. The reasons could be that most of the consumers do not perceive the company’s corporate brand, but solely products and product brands produced under those corporate brands (Appendix II: Table:
67

A - 4). The case of Fructal is somewhat different, because the umbrella brand, in this case, is at the same time the product brand, and consumers do not have any problems to recognize corporate brand. On of the products of Union, on the other hand, has identical brand to the corporate brand (Union beer). Nevertheless, Union’s brand strength has negative influence on the overall equity of this corporate brand. In my opinion, it can be partly explained by answers to open-ended question in the research instrument. Unlike Fructal, which encounters only positive associations of consumers (e.g. nature, health, babies etc.), Union encounters in some cases purely negative associations (e.g., enemy, competitor, bad taste of beer etc.) This sort of associations influences the brand strength and this ultimately influences the brand equity. 5.2.4.2 The Second Set of Hypotheses This section presents the results of testing the second set of hypotheses (see section 4.4). Hypotheses in this section are testing the differences between the brand equity value before and after the inclusion of brand strength element. Even though I have already tested that in the previous section, there is a slight difference. In the previous section, I assumed that if we exclude the brand strength element, the model would have only three elements, and the weights would be assigned to only these three elements (in proportion: 0,33:0,33:0,33; where a+b+c=1). In this section the exclusion of brand strength element indicates that the model would have three elements as well. Nevertheless, the exclusion of the brand strength element, leaves the weight “untouched”, and they are divide, as if the model had four elements (in proportion if 0,3:0,3:0,2:0,2; where a+b+c+d=1). The purpose of this data manipulation is to see the actual influence of the brand strength on the brand equity value (i.e. to see is the difference between the brand equity if we include the brand strength element, and the brand equity if we assume that respondents do not know the brand). The hypotheses are tested using the same procedure as in the first set of hypotheses. The results of the paired sample testing procedure are presented in Table 17.
68

Table 17: Paired sample test results II
Sign of the difference t-value Sig.
(1-tailed) N
WHOLE SAMPLE 600H1: BE_STBS - BE_BS_0 - -0,914 0,180 DROGA 100H1a: BE_STBS - BE_BS_0 - -1,618 0,050 FRUCTAL 100H1b: BE_STBS - BE_BS_0 + 7,032 0,000
KOLINSKA 100H1c: BE_STBS - BE_BS_0 - -5,211 0,000
LAŠKO 100H1d: BE_STBS - BE_BS_0 + 0,481 0,315
RADENSKA 100H1e: BE_STBS - BE_BS_0 + 2,578 0,011
UNION 100H1f: BE_STBS - BE_BS_0 - -2,078 0,020
Source: Field research The results of the first hypothesis testing (whole sample), that there is a difference between the corporate brand equity value in the case when we include the brand strength element (BE_STBS), and the one when we would exclude the brand strength component (BE_BS_0) while keeping the same weights as in the original model, indicate that these differences do not exist (p = 0,18). This means that the brand strength exclusion does not influence the brand equity value. At the same time, the sign of the difference is such that the inclusion of the actual brand strength value would have negative influence on the corporate brand equity. The reasons for this are, in my opinion, the same as given in the last paragraph of the previous section. On the other hand, if we test the remaining sub-hypothesis, on the individual corporate brands, we can see that the results are somewhat different. The difference is significant in cases of all corporate brands except Laško. The difference, on the other hand, is positive for Fructal, Laško and Radenska, which means that the brand strength (based on the perception of Slovenian consumers in the study, yields positive effects on the corporate brand equity. In case of remaining corporate brands: Droga, Kolinska and Union, the signs of differences are negative. In sum, the overall perception of Fructal and Radenska positively and significantly influences the corporate brand equity. This means that the inclusion of brand strength in these two cases increases the value of the brands relative to when the brand strength element was not included (assuming that in both cases weights are assigned to four elements). While in case of Laško the brand equity value is slightly higher after the
69

inclusion of brand strength element, the difference is insignificant. On the other hand, perception of Droga, Kolinska and Union measured by the brand strength are negative. This means that the inclusion of brand strength in these cases decreases the value of the brands relative to when the brand strength element was not included (assuming that in both cases weights are assigned to four elements). Summary of results is presented in section 6.2.
5.2.5 Purchasing Habits The purpose of this section is to analyze the purchasing habits of consumers buying of the investigated companies. In my opinion some consumers’ perceptions of the corresponding companies can be explained by their purchasing habits. Therefore, this question was included in the questionnaire, even though it is not the component of either of the brand equity constructs. The reason for not including it is that the brand strength of certain brands exist whether consumers are buying it or not (e.g. one does not have to buy a Mercedes, in order to be familiar with the brand, to be aware of its quality, functionality and the fact that it a symbol of a certain social status). In Table 18, I present descriptive statistics of consumer purchasing habits by individual corporate brands. Consumers regularly buy products produced and sold under the corresponding corporate brands, with the exception of Kolinska. Kolinska’s products are purchased the least (on average) since on the scale from 1 to 7, it has the lowest mean (3,49; SD = 1,67), and it is below the scales' mid-point. Fructal with the mean of 4,89 (SD = 1,37) is purchased the most often. Table 18: Descriptive statistics – purchasing behaviour
Mean24 Std. Dev. N
DROGA 4.31 1.61 100FRUCTAL 4.89 1.37 100KOLINSKA 3.49 1.67 100LAŠKO 4.19 1.89 100RADENSKA 4.81 1.74 100UNION 4.24 1.79 100Total 4.32 1.74 600
Source: Field research
24 Mean is calculated for the item on regular purchase (see questionnaire in the Table: A - 13 in the Appendix III).
70

ANOVA (Appendix II: Table: A – 11) revealed that purchasing behaviour (on average) in the case of Fructal differs significantly from other corporate brands included in the analysis, with the exception of Radenska (Mean = 4,81; SD = 1,74). In addition, purchasing behaviour of consumers of Radenska differs significantly from the purchasing behaviour of consumers of other companies, except for Fructal. Purchasing behaviour of consumers in case of Kolinska differs significantly (on average), from the purchasing behaviour of all other corporate brands included in the analysis. Therefore, I can draw the following conclusions. Purchasing behaviour of consumers in case of Radenska and Fructal are similar. Overall conclusion is that the Fructal is the most often purchased brand from the ones included in this research. Consumers interviewed, on the other hand, do not regularly purchase products of Kolinska, or they are not aware of the fact that they do. Purchasing habits of consumers of Kolinska could be related to the overall brand strength of this corporate brand, since the mean of brand positioning construct of Kolinska is among the lowest of all elements of the brand strength for all corporate brands used in the analysis (see Table 15). In Table 15 it can be seen that Fructal is the corporate brand which is purchased the most often (on average). In addition the mean of the brand positioning for Fructal is among the highest of all brand strength elements for all brands. This logically leads to the conclusion that the overall positioning of the Fructal is successful since it leads to more frequent purchases of Fructal’s products (on average).
6 RESULTS The objective of this chapter is to present the results of this research. It is divided into three sections. In the first one I present the results of the corporate brand equity valuation using the Brand Equity Evaluator© adapted in a way that it does not include the “soft” component, i.e. the brand strength. In the second section, I present the final results, obtained using the same model without the adaptation mentioned above. In the last section, I present the comparison of corporate brand equity values of corporate brands included in the analysis using a relative measure, i.e. % of market value of the company assigned to corporate brand equity.
6.1 Brand Equity Valuation Without the Brand Strength The results presented in Table 19 are obtained by adapting the model in a way that it does not include the brand strength component (i.e. if we consider model to be strictly financial). For this purpose I have adjusted weights assigned to the main components (i.e. MQ, DRM and IOB) in a way that they are divided equally between the three elements i.e. assigned
71

weights are 33% for each of the element (i.e. MQ, DRM and IOB). The weight assigned to individual element, which form the MQ are as proposed in Table 4 (a = 0,3; b = 0,3; c = 0,2 and d = 0,2). If we consider model to be strictly financial, the brand equity of the corporate brand Laško is the highest. Radenska has the lowest corporate brand equity. The analysis of the results of the model without the brand strength component is as follows: if we compare the difference in corporate brand value of two direct competitors Laško and Union, we can see that corporate brand Laško has approximately EUR 4 million, greater equity value than the corporate brand Union. Since they compete in the same industries, differences can be assigned to two factors: the dominance of the relevant market and the international orientation of the brand. The fact is that Laško has lower DCF than Union, however, the previously mentioned element had significant influence on differences in equity values. The next set of corporate brands, which can be analysed and compared, are Kolinska and Droga. As one can see from Table 19, corporate brand Droga has almost EUR 6 million greater equity than corporate brand Kolinska. These differences in case of exclusion of the brand strength are assigned: MQ and DCF since they are substantially higher for corporate brand Droga than for corporate brand Kolinska. In this case, DRM does not play pivotal role since both companies are leaders in their relevant industries. Corporate brand Kolinska, on the other hand, is more internationally present. Nevertheless, the influence of this factor cannot neutralize the, “negative” influence of some other factors included in the model (i.e. DCF). The next relevant comparison can be made between the values of Kolinska corporate brand and Fructal since the qualities of accompanying relevant markets are almost the same, and the companies which own these corporate brands are both from the food processing industry and beverage production industry, regardless of their primary standard classification. In Table 19, it can be seen that the corporate brand value of Fructal is higher by approximately EUR 2 million. This difference can be assigned mostly to the IOB, since corporate brand Fructal is the one which has the largest international presence of all the brands included in the analysis.
72

Table 19: Elements of the model and value without the brand strength (in 000 EUR)
Element Laško Union Kolinska Droga Fructal Radenska MQ weights
BE weights
MQ 0,0245 0,0245 0,0387 0,0464 0,0366 0,0036 1,00 0,33SP -0,0016 -0,0016 0,0566 0,0148 0,0600 -0,0118 0,30
NOM 0,0714 0,0714 0,0506 0,1105 0,0494 0,0011 0,30 BD 0,0088 0,0088 0,0165 0,0220 0,0095 0,0171 0,40
DRM 1,0000 0,8335 1,0000 1,0000 1,0000 1,0000 0,33IOB 0,3470 0,3300 0,3470 0,3322 0,5719 0,2719 0,33DCF 64.735 66.056 34.857 49.526 33.534 22.023 BE 29.298 25.897 15.940 22.531 17.801 9.270
Source: Annual reports and field research Radenska has the lowest value of all the corporate brands, due to the following facts: it is launched and positioned at the market of the lowest quality; it has the smallest international presence, and the cash flows generated from this brand are the lowest of all brands in this research. This resulted in the value of Radenska corporate brand, which is nearly twice lower from the value of Fructal, for example. This can have some serious implications for brand management of the Radenska. 6.2 Final Valuation In the final corporate brand equity valuation, I used the original Brand Equity Evaluator© adapted to Slovenian market. Corporate brand values included in the analysis are presented in Table 20. The weights used for elements included in the model, are as proposed in Table 4 in Chapter 5. Corporate brand Laško is the most valuable corporate brand in the food and beverage industry in Slovenia, according to the results obtained using the above-mentioned model. The high cash flows generated by the corporate brand largely influenced the corporate brand equity in this case. BS, on the other hand has positive and small influence on the brand equity. Therefore, if we compare brand equity value, which includes brand strength to the one which does not include this element, we can see that former is higher. Corporate brand Union is the one with the next highest corporate brand equity. The corporate brand equity was strongly influenced by the high cash generating power of the corporate brand. Nevertheless, the overall perception of the corporate brand (measured by the brand strength) is negative. Therefore, the value of corporate brand Union in the case when we include the real value of the brand strength is lower than if we assumed that consumers have no opinion of the brand.
73

Corporate brand Fructal is ranked as third, even though results of brand strength (Table 14) provide completely different picture. The value of the brand strength is the highest, and it influences the value of Fructal significantly since the value of the Fructal corporate brand is much higher if we assign the BS its real value than in the case when we assume that consumers have no opinion. Nevertheless, Fructal has extremely low DCF, which indicates that this brand, although the overall perception is positive and the brand strength is high, does not generate the amount of cash flows which would reflect its brand strength. Since financial measures used for brand equity valuation are non-reliable and provide only a short-term perspective of the earning power of the brand, while brand strength is the strategic measure, we can conclude that the Fructal as the strongest corporate brand (measured by BS), among those included in the analysis, has good development prospects, both at Slovenian and international market. This statement, however, holds true just in case that crises in which the company is at the moment, is solved as soon as possible. Results on brand strength and brand equity on corporate brand Droga provide totally different picture. Droga’s value is almost the same as the value of Fructal corporate brand, even though consumers do not perceive it to be as strong as Fructal (measured by BS). This is reflected in the negative BS element, which influences the value of the corporate brand negatively. Therefore, the difference between the corporate brand equity value in case of assigning the BS its real value (as obtained from the research) and the one obtained assuming that consumers have no opinion, is in favour of the later. Corporate brand Kolinska has the second lowest equity value of all corporate brands included in this research. This is due to two reasons: cash flow generating power of this corporate brand is lower than in cases of Laško, Union and Droga, and it has scarcely higher cash flow generating power than Fructal. Nevertheless, the second reason for such a low value of corporate brand equity is explained by the low brand strength. As we indicated in the section 5.2.3.3, this means that consumers are not familiar with corporate brand. As a consequence, they cannot perceive its quality, cannot identify themselves with the values, which corporate brand represents, and the brand is not positioned in their minds. This is also supported by the fact that several respondents (Appendix II: Table: A - 4) answered that they are not familiar with the corporate brand in the case of Kolinska and cannot picture it in their minds. This influenced the overall corporate brand equity value negatively. Therefore the difference in corporate brand equity value calculated using the model which includes the BS element (as presented in Table 20), and the one which assume that consumers have no opinion, is large and in favour of later.
74

Table 20: Corporate brand equity for the brand include in the research
Element LAŠKO UNION KOLINSKA DROGA FRUCTAL RADENSKAMQ 0,0245 0,0245 0,0387 0,0464 0,0366 0,0036
DRM 1,0000 0,8335 1,0000 1,0000 1,0000 1,0000IOB 0,3470 0,3300 0,3470 0,3322 0,5719 0,2719BS 0,0518 -0,2036 -0,4900 -0,1509 0,5482 0,2438
DCF 64.735 66.056 34.857 49.526 33.534 22.023BE 25.060 18.673 9.865 17.343 17.941 8.902
BE_BS = 0 24.389 21.363 13.281 18.838 14.264 7.828Source: Annual reports and field research According to the results obtained in this research, corporate brand Radenska is the least valuable corporate brand, of the ones included in this research. If we take a look at Table 14, we can see that the brand strength scale provides completely different picture of the potential value of this brand. Fructal is one with the highest brand strength, Radenska follows it. Brand strength of corporate brand Laško is ranked third. This leads to the conclusion that the overall brand equity of Radenska and Fructal was negatively influenced by their low cash flows. At the same time, MQ of the industry, in which corporate brand Radenska is classified, is the lowest. In addition, all results can be explained by the quality of accounting reporting, which might suggest that publicly available data (i.e., Annual reports) do not provide an adequate picture of the actual state in the company. 6.3 Corporate Brand Equity as % of Market Value of the Company Additional comparison of corporate brand equity value can be conducted using the corporate brand equity as % of market value of the company. Interbrand Consulting is using this measure to compare the brand equity values for different companies. In addition, if we consider the Slovenian market to be efficient, stock prices of all companies should reflect the changes corporate brand equity. In this way, we can see the value added of good managing the corporate brand. One of the measures of the market value of the company is market capitalisation. Data were obtained from the Ljubljana Stock Exchange. I have calculated market capitalisation for the investigated companies, on 31/12/2003 and on 16/11/2004, using the same data for corporate brand equity (i.e. obtained from this research). Results are presented in Table 21.
75

Table 21: Corporate brand equity in market value of the company
Company Market cap.Corporate
BE % of
Market cap. KOLINSKA 85.928 9.865 11,48FRUCTAL 20.371 17.941 88,07DROGA 106.257 17.343 16,32UNION 133.760 18.673 13,96LAŠKO 274.635 25.060 9,12RADENSKA 42.011 8.902 21,19
Source: Ljubljana Stock Exchange (www.ljse.si) If we look at the fourth column of Table 21, we can see that the influence of the corporate brand value on market value of the companies (represented by that corporate brand) differs from one company to another. Corporate brand Fructal adds the largest value to the overall market value of the company in comparison to others analysed. This indicates that the overall value of this company is the most sensitive to market influences, and the success of its corporate brand. This could be supported by the recent events in Serbia and Montenegro. Namely, the export to Serbia and Montenegro decreased by 10% due to rumours that some of the Fructal’s products are radioactive (Felić and Konjević, 2004). These rumours had its influence on the overall perception of the corporate brand Fructal, which consequently decreased sales in these markets. The market capitalisation has not been influenced yet, but, in my opinion the future stock movements should reflect the consequences of these events. The sensitivity of the Fructal’s market value on the corporate brand equity, indicates that the management of this company should pay attention to strategic brand management, in terms of both product brands and corporate brand. Other corporate brands do not add as much value to the overall companies’ market value since none of them adds more than 20%, as in case of Fructal. This is why these companies’ values are less sensitive to consumers’ perceptions (measured by brand strength), in comparison to Fructal. Nevertheless, the sensitivity is substantial, and the implications regarding strategic brand management are similar as in the case of Fructal.
76

7 CONCLUSION The purpose of the study is to valuate selected corporate brand equity of the companies in the food and beverage sector in Slovenia. After I had presented theoretical background of brand equity and associated terms, I presented the model actually applied in this study. The model encompasses two of the most important perspectives of the brand equity, i.e. financial and the consumer perspective. Data analysis encompasses secondary and primary data analysis. Secondary data analysis includes the analysis of the domain industries, as well as the performance of the companies’ selected for the analysis. Primary data analysis represents the analysis of data compiled using brand equity questionnaire developed in this study. Results of the data analyses are the monetary values of the corporate brand equity for each of the corporate brands included in this research. The values obtained for the corresponding corporate brands can be used for decision making in case of mergers and acquisitions in the food and beverage industry.
7.1 Contribution Contribution of this study, concerns the monetary value calculated for corporate brands included in the research. Most of the studies conducted in Slovenian market so far, provided some sort of relative comparison among the brands, but none of them actually resulted in the monetary value to be included in e.g. financial statement. This is due to the fact that most of the models developed and tested in Slovenian market, did not include both financial and consumer elements along with the monetary component (i.e. DCF). Therefore, this is the first attempt to actually calculate the monetary value of the selected corporate brands in Slovenian market.
7.2 Limitation and Direction for Future Research From this research, it can be concluded that the model as such is applicable to the Slovenian market. We must notice that the model is theoretically applicable to both product brands and the corporate brand. Nevertheless, I could not apply it to the level of product brands due to several reasons. First, the availability of data. Publicly available sources do not provide data sufficient for the calculation of product brand equity. This is mostly due to the fact that Slovenian companies find some data more confidential than others. Due to that fact, annual reports of the Slovenian companies do not include elements such as: sales of individual brands. Also, in most cases one cannot be sure whether all products are sold under the corporate brand, and what is the percent of products which are sold under some other brand names.
77

The second reason why I could not apply the model to product brands is that one cannot determine the amount of the company’s cash flows to equity which are generated by individual product brands. This is partly the consequence of the accounting practices, which are going toward aggregation. Therefore, it was easier to calculate discounted cash flows at the level of the corporate brand, since it is not so different from the one generated by the company itself. The next problem directly related to the previous one is the determination of the discount factor (cost of capital) for product brands. This problem occurs since we cannot determine the volatility of the returns on the individual product brands. In addition I do not claim that the approach chosen for determination of the cost of capital at the level of corporate brand is 100% accurate. Nevertheless, discrepancies are much lower than those which would occur in case of product brands. The last but very important limitation of the model, which is also the limitation of all other models created in the branding theory, is the inability to empirically validate the results, since there is no active market for brands. At the same time, comparability of results in this study with the results of another valuation model (e.g. Interbrand) could be rendered invalid due to the fact that different elements are included in the model.
7.3 Managerial Implications In this section, I provide the implications for a) companies represented by the corporate brands included in the analysis, for b) companies which could be possible acquirers of the corporate brands included in the research, and for c) supporting industries (e.g. market research agencies).
Owners of the corresponding corporate brands, have to keep in mind that the brand equity valuation is crucial for their companies. While measures such as profitability ratios must be considered short term, the value of the brand is a long term strategic measure, which gives indication of the future potential of both product and company. Nevertheless, each of the approaches, which could be used for these purposes (i.e. result in monetary value), cannot be validated without a comparison other to companies across/within industry. This is possible if we put all the results on the same “scale” – evaluate the value of the brand on the same level (product, or corporate), use the same approach as well as the same model. The most important implications of the results obtained in this study relate to companies – potential acquirers of the corresponding corporate brands. The first implication is that the influence of equity of individual corporate brand on the overall value of the company differs from one company to another. Corporate brand of e.g. Fructal adds the largest value to the overall market value of the company, in comparison to other brands analysed. This
78

indicates that the overall value of this company is the most sensitive to market influences, and the success of its corporate brand. The overall sensitivity of the market value of Fructal on corporate brand value indicates that the management of this company should pay attention to the strategic brand management in terms of both product brand and corporate brand (Fructal brands are the same for both products and company if we consider beverages). All other corporate brands do not add as much value to the overall companies’ market values. Moreover, this indicates that the influence of consumer perceptions and the corporate brand equity is not as high as in the case of Fructal. This means that these companies are less sensitive to consumer perceptions. Implications regarding the strategic brand management, however, are the same as for Fructal. In order to be able to use the same approach, supporting institutions (e.g. marketing agencies) must provide comparable, timely and objective data for the analysis. This means that market research agencies need to provide data on advertising expenditures of other companies and corresponding industries. At the same time, supporting departments within the company itself, such as accounting departments must give appropriately disaggregated data for products and the company as a whole (i.e. advertising and other costs as well as sales, profit, cash flows generated by the products and company. In this way, marketing department will get the data needed for the brand valuation, which can be used in strategic brand decision making.
79

8 LITERATURE 1. Aaker D.A.: Managing Brand Equity: Capitalization on the Value of Brand Name. New
York: The Free Press, 1991, 229 p. 2. Aaker D.A.: Measuring Brand Equity Across Products and Markets. California
Management Review, Vol. 38 (3), 1996, p. 102-118. 3. Aaker D.A.: Leveraging the Corporate Brand. California Management Review, Vol. 46
(3), 2004, p. 6-18. 4. Aaker D.A. and Jacobson R.: The Financial Information Content of Perceived Quality.
Journal of Marketing Research, No. 3, May 1994, p. 191-201. 5. Aaker D.A., Kumar V. and Day G.S.: Marketing Research. New York: John Wiley&
Sons, Inc., 1998, 328 p. 6. Aaker J.L.: Dimensions of Brand Personality. Journal of Marketing Research, Vol. 34
Issue. 3, Aug 1997, p. 347-357. 7. Abratt, Russell and Bick, Geoffrey: Valuing Brands and Brand Equity: Methods and
Processes. Journal of Applied Management and Entrepreneurship, Vol. 8, No. 1, 2003, p. 21-39.
8. Barwise, P., Higson, C., Likierman, A., and Marsh, P. Accounting for Brands, The London Business School and The Institute of Chartered Accountants in England and Wales, London, 1989, 93 p.
9. Bekmeier-Feuerhahn S.: Marktorientierte Markenbewertung: eine konsumenten- und unternehmensbezogene Betrachtung. Wiesbaden: Gabler, 1998, 410 p.
10. Bhat S. and Reddy S.K.: Symbolic and Functional Positioning of Brands. Journal of Consumer Marketing, Vol. 15, No. 1, 1998, p. 32-43.
11. Boonghee Y. and Naveen D.: Developing and Validating Multidimensional Consumer-Based Brand Equity Scale. Journal of Business Research, Vol. 52 Issue. 1, 2001, p. 1-14.
12. Bošković, Milena: Estimating Cost of Capital Using Accounting Fundamentals. Master Thesis. Economics Faculty, Ljubljana, 2004, 110 p.
13. Brigham, E.F. and Daves, P.R.: Intermediate Financial Management. London, South Western, Thompson Learning, 2002, 980 p.
14. Chandon, Pierre: Note on Measuring Brand Awareness, Brand Image, Brand Equity and Brand Value. Insead Working Paper Series, 2003, p. 1-10.
15. Christodoulides G., Chernatony L., Shiu E., Furrer O. and Abimbola T.: E-tail Brand Equity: Scale Development and Validation. School Working Paper Series, 2004, p. 1-14.
16. Cobb-Walgren, C., Ruble, C. and Donthu, N.: Brand equity, brand preference, and purchaseintent. Journal of Advertising, No 24, 1995, p. 25-42.
17. Court, D. C., Leiter M. G. and Loch M. A.: Brand leverage. The McKinsey Quarterly, No. 2, 1999, p. 100–110.
80

18. Cox, Jennifer Lyn: Can Differential Prices Be Fair? Journal of Product and Brand Management, Vol. 10, No. 5, 2001, p. 264 – 275.
19. Cravens K.S. and Guilding C.: Strategic Brand Valuation: A Cross-Functional Perspective. Business Horizons, 1999, p. 53-62.
20. Delgado-Ballester E., Munuera-Aleman J. L. and Yagoe-Guillin M. J.: Development and Validation of a Brand Trust Scale. International Journal of Market Research, Vol. 45, No. 1, 2003, p. 335-353.
21. Dolich, Ira J.: Congruence Relationship Between Self Images and Product Brands. Journal of Marketing Research, Vol. 6, Feb. 1969, p. 80-84.
22. Doyle P.: Marketing Management and Strategy. Hemmel Hempsted: Prentice Hall, 2001, 480 p.
23. Dyson, P., Farr, A. and Hollis, N.: “Understanding measuring and using brand equity”, Journal of Advertising Research, Vol.36, No.6, 1996, p. 9-21.
24. Farquhar P.H.: Managing Brand Equity. Marketing Research, Vol. 1 Issue 3, Sept. 1989, p. 24-33.
25. Felić E. and Konjević V. Za Fructalovo izgubo krive visoke dajatve na južnih trgih. Finance, 2004 (URL: http://www.finance-on.net/danes.php?dat=2004-09-16).
26. Franic D.M. and Pathak D.S.: Respondents' Attitude Toward Preference Measurement Tools: Graphic Positioning Scale Versus Traditional Scales. Value in Health, Vol. 6, No. 4, 2003; p. 483-493.
27. Gagliardi, Mario. Alchemy of Cultures: From Adaptation to Transcendence in Design and Branding. Design Management Journal, Vol. 12, No 4. 2002, p. 32-39.
28. Gibson R. The end of the line? Overkill on extensions. Wall Street Journal, June 18, 1990, p. B1.
29. Haigh, David. Brand Due Dilligence.: Brand Finance, 2002, p. 1-4. 30. Haigh, David. FRS 10, Brands on the Balance Sheet. Brand Finance Report, 1998, p. 1-
21. 31. Hutt, Michael D. and Speh, Thomas W.: Business Marketing Management. Mason,
Ohio: Thomson, South – Western, 2004, 714 p. 32. Ingham, Sandra: Cool Britania? New Business Week, 2003, (URL: http://www.newbusiness.co.uk/cgi-bin/showArticle.pl?id=388) 33. Kalafut P., Low J. and Robinson J.: Measures that Matter. New York: Ernst &Young,
1997, 64 p. 34. Kamakura, W.A and Rusell, G. J.: Measuring brand value with scanner data. Journal of
Research in Marketing, Vol. 10, 1993, p. 9-22. 35. Kapferer J.: Strategic Brand Management: New Approaches to Creating and Evaluating
Brand Equity. London: Kogan Page, 1992, 230 p. 36. Karjalainen, T.M.: Strategic Design Language: Transforming Brand Identity into
Product Design Elements. Proceedings of the 10th International Product Development Management Conference, Brussels, 2003, p. 1-16.
37. Keller K.L. (1993): Conceptualizing, Measuring, and Managing Customer Based
81

Brand Equity. Journal of Marketing, Vol. 57 Issue 1, 1993, p. 1-22. 38. Keller K.L.: Strategic Brand Management – Building, Managing and Measuring Brand
Equity. New Jersey: Prentice Hall, 1998, 788 p. 39. Keller K.L.: Building Customer-Based Brand Equity. Marketing Management, Vol. 10
Issue 2, 2001, p. 14-19. 40. Kent J.R. and Allen T.C.: Competitive Interference Effects in Consumer Memory for
Advertising: The Role of Brand Familiarity. Journal of Marketing, Vol. 58, No. 3, 1994, p. 97-105.
41. Kim, Hong-bumm, Kim W.G. and Jeong A.: The effect of Consumer-Based Brand Equity on Firms’ Financial Performance. Journal of Consumer Marketing, Vol. 20, No. 4, 2003, p. 335 – 351.
42. Lassar W., Mittal B., and Sharma A.: Measuring Customer-Based Brand Equity. Journal of Consumer Marketing, Vol. 12, No 4, 1995, p. 11-19.
43. Loken B. and John D.: Dilution brand beliefs: when do brand extensions have a negative impact? Journal of Marketing, Vol. 57 Issue 3, July 1993, p. 71-84.
44. Low G.S. and Lamb C.W. Jr.: The Measurement and Dimensionality of Brand Associations. Journal of Product and Brand Management, Vol. 9, No. 6, 2000, p. 350-368.
45. Machleit, Karen A., Allen, Chris T. and Madden T.J.: The Mature Brand and Brand Interest: An Alternative Consequence of Ad-Evoked Affect. Journal of Marketing, Vol. 57, No. 4, 1993, p. 72.
46. Mackay M.M.: Application of Brand Equity Measures in Service Markets. Journal of Services Marketing, Vol. 15, No.3, 2001, p. 210 – 221.
47. Malhotra N.T. and Birks D.F.: Marketing Research: An Applied Approach, FT Prentice Hall Inc. London, 1999, 770 p.
48. Marsden, Paul: Brand Positioning: Meme’s the Word. Marketing Intelligence & Planning, 20/5, 2002, p. 307-312
49. Melewar T.C. and Walker C.: Global Corporate Brand Building: Guidelines and Case Studies. Journal of Brand Management, Vol. 11, No. 2, 2003, p. 157- 170.
50. Mermin J.: Interpreting the Federal Trademark Dilution Act of 1995. The Logic of the Actual Dilution Requirement. Boston College Law Review, Vol. 42 No. 1; 2000, p. 207-256.
51. Motameni, Reza and Shahrokhi, Manuchehr: Brand Equity Valuation: A Global Perspective. Journal of Product and Brand Management, Vol. 7, No. 4, 1998, p. 275-290.
52. Netemeyer, Richard G., Krishnan B., Pullig C., Wang G., Yagci M., Dean D., Ricks J. and Wirth F.: “Developing and Validating Measures of Facets of Customer-Based Brand Equity”. Journal of Business Research, Vol. 57 Issue 2, 2004, p. 209-224.
53. Ourusoff, Alexandre: What’s in A Name? Financial World, Vol. 161, 1993, p. 81-85. 54. Ouwersloot H. And Tudorica A.: Brand Personality Creation through advertizing. Maxx
Paper Series, 2001, p. 1- 25.
82

55. Pahud de Mortanges, Charles and Allard C.R. van Riel: Brand Equity and Shareholder Value. European Management Journal, Vol. 21, No. 4, 2003, p. 521–527.
56. Park, Chan S. and Srinivasan V.: A Survey Based Method for Measuring and Understanding Brand Equity and its Extendibility. Journal of Marketing Research, Vol. 31, No. 2, 1994, p. 271-288.
57. Pitta, Dennis A. and Katsanis L. P.: Understanding Brand Equity for Successful Brand Extension. Journal of Consumer Marketing, Vol.12, No. 4, 1995, p. 51-64.
58. Russell, G. and Kamakura, K.: Understanding Brand Competition Using Micro and Macro Scanner Data. Journal of Marketing Research, 1994, May, p. 289-303.
59. Sattler H.: Praxis von Markenbewertung und Markenmanagement in deutschen Unternehmen. Frankfurt am Main: Fachverlag Moderne Wirtschaft, 2001, 667 p.
60. Sharma S.: Applied Multivariate Techniques. New York. John Wiley & Sons, 1996, 493 p.
61. Srivastava R.K., Shervani T.A and Fahey L.: Market-based assets and Shareholder Value: A Framework for analysis. Journal of Marketing, 1998, p. 19-32.
62. Srivastava, R. K. and Shocker, A. D.: Brand Equity: a perspective on its meaning and measurement. Marketing Science Institute, 1991, p. 1-31.
63. Shocker A.D., Srivastava R.K. and Ruekert R.W. Challenges and Opportunities Facing Brand Management: An Introduction to the Special Issue. Journal of Marketing Research, Vol. 31 Issue 2, 1994, p. 149-159.
64. Simon C.J., and Sullivan M.J.: The Measurement and Determinants of Brand Equity: A Financial Approach. Marketing Science, Vol. 12, No 1, 1993, p. 28-52.
65. Siburian S. J.: Company Brand vs. Individual Brand: Which Way to Go? 2004. (URL: http://www.businessknowhow.com/marketing/brand.htm) 66. Sujan M. and Bettman James R.: The Effects of Brand Positioning Strategies on
Consumers’ Brand and Category Perception: Some Insights from Schema Research. Journal of Marketing Research, Vol. 26, Nov. 1989, p. 454-467.
67. Trampuš, Jure: Borovničev sok. Mladina, No. 30, 2004. (URL: http://www.mladina.si/tednik/200430/clanek/slo-tema--jure_trampus/) 68. Washburn J.H. and Plank. R.E.: Measuring Brand Equity: An Evaluation of a
Consumer-Based Brand Equity Scale. Journal of Marketing Theory and Practice, Vol. 10, No. 1, Winter 2002, p. 46-61.
69. Woods R.J.: Can there be a Common Definition of Brand Equity. Journal of Modern Business, 1998, p. 1-11.
70. Yates J.: Brand Valuation and its Applications, 1999. (URL: http://www.poolonline.com/archive/iss6fea5.html), 71. Yoo, B. And Donthu, N.: Developing and validating a multidimensional consumer-
based brand equity scale. Journal of Business Research, Vol. 52, No 1, 2001, p. 1-14. 72. Zalewska B. Dynamics of Mergers and Acquisitions in the Luxury Apparel Industry.
Master thesis, Faculty of Economics, Ljubljana, 2002, 100 p.
83

73. Zimmermann R., Klein-Bölting U., Sander B. and Murad-Aga T.: BBDO’s Brand Equity Review Part I, (URL: www.bbdo.de), 2001, p. 1-74.
74. Zimmermann R., Klein-Bölting U., Sander B. and Murad-Aga T.: BBDO’s Brand Equity Review Part II, (URL: www.bbdo.de), 2002, p. 1-35.
75. Zimmermann R.: BBDO’s Point of View 5; (URL. www.bbdo.de), 2004, p. 1-6.
84

SOURCES: 1. www.businessweek.com 2. www.fao.org 3. www.finance-on.net 4. www.ibon.com 5. www.investorwords.com 6. www.gvin.com 7. www.knowledgeboard.com 8. www.ljse.si 9. www.royaltysource.com 10. www.stat.si 11. IBO 2001, 2002, 2003 (Mediana) 12. Droga D.D., Annual report (2001, 2002, 2003) 13. Fructal D.D., Annual report (2001, 2002, 2003) 14. Kolinska D.D., Annual report (2001, 2002, 2003) 15. Pivovarna Union D.D., Annual report (2001, 2002, 2003) 16. Pivovarna Laško D.D., Annual report (2001, 2002, 2003) 17. Radenska D.D., Annual report (2001, 2002, 2003)
85


APPENDIX I
FRS 10 – Intangible assets and goodwill
The objective of the standard is to ensure that purchased goodwill and intangible assets (non/financial assets that do not have physical substance but are identifiable and are controlled by the entity through the custody or legal rights), which may include brands, are charged to the profit and loss account over the period, which they are depleted.
An intangible asset may be classified as an asset if it relates to the future economic benefits represented and controlled by the reporting entity. Purchased goodwill and intangible asset should be capitalized as assets (removing the option write-off goodwill straight to shareholders’ reserves, which existed under the previous Statement of Standard accounting Practice 22).
Internally generated goodwill should never be capitalized. Internally generated intangible assets should be capitalized only where separately identifiable and have a readily ascertainable market value (defined as being from a “homogenous population of assets that are equivalent in all material respects” and for which there is an “active market, evidenced by frequent transactions”
Where goodwill (and related intangible assets) is not capable of continued measurement, or where they have limited useful economic life, they must be written–off in the profit and loss account on a systematic basis. They should be done over a prudent, but not unrealistically short period.
The useful economic life of purchased goodwill is defined as period over which the value of the underlying acquired business is expected to exceed the value of its identifiable tangible and intangible assets. The useful economic life of an intangible asset is defined as period over which the entity expects to derive economic benefit from that asset.
There is a “reputable presumption” that the useful economic life of purchased goodwill and of individual intangible asset cannot exceed 20 years form the date of acquisition. The 20-year presumption can be rebutted where the useful economic life of an intangible asset can be demonstrated to be greater than 20 years and where the asset is capable of continued measurement. Intangible assets with finite useful economic lives should be amortized over the appropriate period. Intangible assets with indefinite lives should not be amortized.
Impairment reviews should be performed to ensure that goodwill and intangible assets are not carried at above their recoverable amounts. If such assets have been impaired the amount impaired should be charged to the profit and loss account in the year of impairment.
The recoverable amount of an intangible asset is defined as the higher or net realizable value (amount at which an asset could be disposed of) and its value in use (the present
I

value of the future cash-flows obtainable as a result of an asset’s continued plus any residual value on its ultimate disposal).
Full impairment reviews (including a detailed analysis of acquired future cash flows) should be conducted one year after acquisition for all intangible assets and annually thereafter for all assets which are deemed to have an indefinite life. Intangible assets deemed to have a finite life would be subject to a more limited review.
For accounts purposes the bases of valuation of the assets, the grounds for believing that a useful life exceeds 20 years or is indefinite and the treatment adopted for any “negative goodwill” (arising where the value of identifiable purchased assets exceeds the price paid in an acquisition) must be disclosed in the Notes to the Accounts.
II

B. FRS 11 “Impairment of Fixed Assets and Goodwill”
The objective of the standard is to ensure that: fixed assets and goodwill are recorded in the financial statements at no more than their recoverable amounts. Any resulting impairment loss is measured and recognized on a consistent basis.
Sufficient information is disclosed in the financial statement to enable users to understand the impact of the impairment on the financial position and performance of the reporting entity. Fixed assets (including intangible assets) and goodwill should be reviewed for impairment if events or charges in circumstances indicate that the carrying amount of the intangible asset or goodwill may not be recoverable.
Individual assets should be tested for impairment. However, if cash flows are not generated by a single asset this may not be possible. In such cases the smallest possible group of assets, or “income generating unit” should be tested, subject to practicality. An income generating unit is defined as a “group of assets, liabilities and associated goodwill" that” generates income that is largely independent of the reporting entity’s other income streams.
Impairment should be measured by comparing the carrying value of the goodwill or fixed asset (either tangible or intangible) with its recoverable amount. The recoverable amount is the higher of the amount that can be obtained from selling the fixed asset or income-generating unit (net realizable value) or using the fixed asset or income generating unit (value in use).
Value in use is calculated by discounting future cash flows of the income-generating unit at a rate of return, which the market would expect from an equally risky investment. Impairment losses must be recognized immediately in the profit and loss account.
Past impairment losses can be written back in certain circumstances. If an external event caused the impairment, the amount can be written back if subsequent external events clearly and demonstrably reverse the effects of the initial event in a way not foreseen in the original impairment calculations.
III

APPENDIX II A - 1: Interbrand’s Global Brand Scoreboard
Source: http://www.businessweek.com/pdfs/2003/0331_globalbrands.pdf A - 2: Demographic characteristics of the sample – region
Region No of
respondents % LJUBLJANA 282 47 DOLENJSKA 108 18 GORENJSKA 78 13 ŠTAJERSKA 84 14 PRIMORSKA 18 3 KOROŠKA 24 4 PREKMURJE 6 1 Total 600 100
A - 3: Demographic characteristics of the sample – level of education
Level of education % LESS THAN SECONDARY SCHOOL 66 11 SECONDARY SCHOOL 252 42 HIGH UNIVERSITY DEGREE 120 20 UNIVERSITY DEGREE 126 21 MASTERS OR DOCTORAL DEGREE 36 6 Total 600 100
IV

A - 4: Most frequent associations of consumers
BRAND MOST FREQUENT ASSOCIATIONS
KOLINSKA
Logo of the company Cocta Droga Portorož Mayonnaise Lilly hips Snacks Čokolešnik Food for children Tiha Food and beverage Spices Fruit beverages
Mustard Pudding Chocolate Products Chips RK Frutek Potato products Smoki Instant Pez Bebi papa Soup concentrate
Brand Embalage Argo soup Sweets Droga Baby food Čokolino Green building at Šmartinka Pasta Chunga Lunga Preserver Bonbons Chewing gums
Sport sponsor Knnor soups Royal pudding Margarine Vinegar Can Mustard Kiki bonbons Not familiar Red logo Jupi
DROGA
Portorož Tea Kekec pasty Tea “En cvet” Primož Peterka Spices Soups Salt Caviare Argety pasty
Pasty Marijuana BarCaffe 1001 cvet – tea Drugs Portorož and sea side Maestro Aroma Rise “Zlato polje” Nice wrapping
Argo soup Crumbles Izola Skiing competition Relaxation Tea flavours Mediterranean Sun and sea Horse radish Bad smell of coffee
Soup concentrate Primož Peterka Cucumber
UNION
Beer Sole Ledeni Čaj Union – Olimpija Beer Radler Ice-tea Zala Sola
Ljubljana Commercial for friends Bad beer Good beer Basketball Natalija Verboten Red colour Dragon
Red can Interbrew Joy Uni Multi sola Jabolko
Bad smell of beer Summer heat Tivoli Smile Kras
LAŠKO
Zlatotog pivo KK Pivovarna Laško “Pivo in cvetje” “Oda” RK Celje Laško beer Good beer Walleyball
Green colour Black, light, Classic Beer Štajerska Competition Parties Celje Sip of cold beer Quality
Sport – sponsoring Drunk Good beer taste Success of volleyball team Kozorog Bandidos Titanic Netopir
Bad smell of beer Union take over
V

A - 5: Most frequent associations of consumers (continued)
FRUCTAL
Juices Frutek Fruc Children food Apple juice Frutabela Fruit juice Nature
Goods of nature Sugar Alcohol Blue bottles Tree Healthy fruit Cute bottles Health
Sport Enjoying different flavours Radioactivity Blueberry juice Ajdovščina Baby Oranges
Good juice Expensive Marmalade Sport sponsor
RADENSKA
Radenska water Izvir Tri srca Mineral water Health spa Sparkling water Ice tea Bubbles
Hearts and bubbles Thirst Donat Mg Pools Health Freshness Joy Hotels
Stil Three hearts marathon Tradition Sprint Radenci Miral
Source: Consumer survey
VI

A - 6: Multiple comparisons; LSD: BS
(I) COMP (J) COMP Mean
Difference (I-J)
Sig.
FRUCTAL -0,830 0,000 KOLINSKA 0,403 0,012 LAŠKO -0,241 0,131 RADENSKA -0,469 0,003
DROGA
UNION 0,062 0,695 DROGA 0,830 0,000 KOLINSKA 1,232 0,000 LAŠKO 0,589 0,000 RADENSKA 0,361 0,023
FRUCTAL
UNION 0,892 0,000 DROGA -0,403 0,012 FRUCTAL -1,232 0,000 LAŠKO -0,643 0,000 RADENSKA -0,871 0,000
KOLINSKA
UNION -0,340 0,033 DROGA 0,241 0,131 FRUCTAL -0,589 0,000 KOLINSKA 0,643 0,000 RADENSKA -0,228 0,152
LAŠKO
UNION 0,303 0,057 DROGA 0,469 0,003 FRUCTAL -0,361 0,023 KOLINSKA 0,871 0,000 LAŠKO 0,228 0,152
RADENSKA
UNION 0,531 0,001 DROGA -0,062 0,695 FRUCTAL -0,892 0,000 KOLINSKA 0,340 0,033 LAŠKO -0,303 0,057
UNION
RADENSKA -0,531 0,001 Source: Field research Note: The mean difference is significant at the .05 level.
VII

A - 7: Paired sample statistics and test
Mean / Paired diff. Mean SD t-value Sig. (2-
tailed) N
DROGA 100BE_OUT 22.531 0,000 BE_WITH 17.343 9.231,322 BE_OUT - BE_WITH 5.187 9231,322 5,619 0,000 FRUCTAL 100BE_OUT 17.801 0,000 BE_WITH 17.941 5.230.357 BE_OUT - BE_WITH -140 5230,357 -0,269 0,788 KOLINSKA 100BE_OUT 15.940 0,000 BE_WITH 9.865 6.555,504 BE_OUT - BE_WITH 6.074 6555,500 9,267 0,000 LAŠKO 100BE_OUT 29.298 0,000 BE_WITH 25.060 13.951,410 BE_OUT - BE_WITH 4.237 13951,410 3,037 0,003 RADENSKA 100BE_OUT 9.270 0,000 BE_WITH 8.902 4.169,241 BE_OUT - BE_WITH 367 4169,241 0,880 0,381 UNION 100BE_OUT 25.897 0,000 BE_WITH 18.673 12.934,130 BE_OUT - BE_WITH 7.223 12934,130 5,585 0,000
Source: Field research
VIII

A - 8: Paired sample statistics and test II
Mean / Paired diff. Mean SD t-value Sig. (2-tailed)
DROGA BE_STBS 17.344 BE_BS_0 18.838 BE_STBS - BE_BS_0 -1.494 9231,322 -1,618 0,109FRUCTAL BE_STBS 17.942 BE_BS_0 14.264 BE_STBS - BE_BS_0 3.678 5230,357 7,032 0,000KOLINSKA BE_STBS 9.865 BE_BS_0 13.281 BE_STBS - BE_BS_0 -3.416 6555,504 -5,211 0,000LAŠKO BE_STBS 25.060 BE_BS_0 24.389 BE_STBS - BE_BS_0 671 13951,410 0,481 0,631RADENSKA BE_STBS 8.903 BE_BS_0 7.828 BE_STBS - BE_BS_0 1.075 4169,241 2,578 0,011UNION BE_STBS 18.673 BE_BS_0 21.361 BE_STBS - BE_BS_0 -2.687 12934,147 -2,078 0,040
Source: Field reserach A - 9: Brand strength – Group statistics: BS
Mean Std. Dev. N BUYER 5,615 0,801 305 NON-BUYER 4,246 1,118 295
Source: Field research
IX

A - 10: Independent samples test
Levine’s Test for Equality of Variances F Sig. Equal variances assumed Equal variances not assumed 20,332 0,000t-test for Equality of Means t Sig. (2-tailed) Equal variances assumed 17,270 0,000Equal variances not assumed 17,178 0,000
X

A - 11: Multiple comparisons. Dependant variable: Purchasing behaviour
(I) COMP (J) COMP Mean
Difference (I-J)
Sig.
DROGA FRUCTAL -0,580 0,015 KOLINSKA 0,820 0,001 LAŠKO 0,120 0,615 RADENSKA -0,500 0,036 UNION 0,070 0,769 FRUCTAL DROGA 0,580 0,015 KOLINSKA 1,400 0,000 LAŠKO 0,700 0,003 RADENSKA 0,080 0,737 UNION 0,650 0,007 KOLINSKA DROGA -0,820 0,001 FRUCTAL -1,400 0,000 LAŠKO -0,700 0,003 RADENSKA -1,320 0,000 UNION -0,750 0,002 LAŠKO DROGA -0,120 0,615 FRUCTAL -0,700 0,003 KOLINSKA 0,700 0,003 RADENSKA -0,620 0,010 UNION -0,050 0,834 RADENSKA DROGA 0,500 0,036 FRUCTAL -0,080 0,737 KOLINSKA 1,320 0,000 LAŠKO 0,620 0,010 UNION 0,570 0,017 UNION DROGA -0,070 0,769 FRUCTAL -0,650 0,007 KOLINSKA 0,750 0,002 LAŠKO 0,050 0,834 RADENSKA -0,570 0,017
Source: Field research The mean difference is significant at the .05 level.
XI

A - 12: Exchange rates (EUR/SIT)
Year ER 2000 205,03 2001 217,19 2002 225,54 2003 236,69 2004 242,00 2005 247,43 2006 252,98
Source: Bank Slovenia and own calculation
XII

APPENDIX III: A - 13: Questionnaire
ITEM ORIGINAL VERSION ADAPTED VERSION
KNOWLEDGE 1 Familiar with the products which are produced by the company with this corporate brand
Familiar with the products which are sold by the company with this corporate brand
REGULAR PURCHASE Regular purchasing the products of the company with this corporate brand
Regular purchasing the products of the company with this corporate brand
KNOWLEDGE 2 Know what are the products of the company with the following corporate brand look/taste like
Know what characteristics products of the company with the following corporate brand have
KNOWLEDGE 3 Can recognize this corporate brand among other competitive brands
Products produced by the company, represented by this corporate brand
KNOWLEDGE 4 can quickly recall the symbol and logo attached to this corporate brand
Know the logo of the corporate brand
QUALITY 1 Corporate brand associates to high quality Claim that the products of the company
represented by this corporate brand have the high quality
QUALITY 2 Satisfied with products which are produced by the company with this corporate brand
Satisfied with products which are produced by the company with this corporate brand
QUALITY 3 Likehood that new products of the company with this corporate brand would have high quality is high
Likehood that new products of the company with this corporate brand would have high quality is high
QUALITY 4 Willingness to try new product produced by the company represented by this corporate brand
Willingness to try new product produced by the company represented by this corporate brand
QUALITY 5 This corporate brands associate me to better quality than the competitive corporate brand
This corporate brands associate me to better quality than the competitive corporate brand
POSITIONING 1 Corporate brand products are functional I claim that I can satisfy my needs with the products produced under this corporate brand
POSITIONING 2 This corporate brand is appealing All in all I like products produced by the company, represented by this corporate brand
POSITIONING 3 Products produced under this corporate brand are different from the products of other companies in the same industry
Products produced under this corporate brand are different from the products of other companies in the same industry
IDENTITY 1
Corporate brand helps me demonstrate certain social status
Products produced by the company, represented by this corporate brand are more valuable for me than those form competition corporate brands
IDENTITY 2 Corporate brand gives me pleasure I am extremely satisfied with products which
are produced by the company represented by this corporate brand
IDENTITY 3 Company with this corporate brand actually cares for me
Company with this corporate brand actually cares for the needs of consumers
IDENTITY 4 Corporate brand represents the values, which are compatible to the wishes of consumers
Company with this corporate brand is appreciates the wishes of consumers
IDENTITY 5 Company with this corporate brand really understands me
Company with this corporate brand really understands its target consumers
XIII

A – 14: QUESTIONNAIRE – Original in English Very strongly disagree (1); Very strongly agree (7) A. Brand knowledge 1. I am familiar with the following corporate brand
Fructal Radenska Kolinska Droga Union Laško 1 2 3 4 5 6 7 1 2 3 4 5 6 7 1 2 3 4 5 6 7 1 2 3 4 5 6 7 1 2 3 4 5 6 7 1 2 3 4 5 6 7 2. I am buying the products of the company with this corporate brand
Fructal Radenska Kolinska Droga Union Laško 1 2 3 4 5 6 7 1 2 3 4 5 6 7 1 2 3 4 5 6 7 1 2 3 4 5 6 7 1 2 3 4 5 6 7 1 2 3 4 5 6 7
3. I know what are the products of the company with the following corporate brand
look/taste like
Fructal Radenska Kolinska Droga Union Laško 1 2 3 4 5 6 7 1 2 3 4 5 6 7 1 2 3 4 5 6 7 1 2 3 4 5 6 7 1 2 3 4 5 6 7 1 2 3 4 5 6 7 4. I can recognize this corporate brand among other competitive brands
Fructal Radenska Kolinska Droga Union Laško 1 2 3 4 5 6 7 1 2 3 4 5 6 7 1 2 3 4 5 6 7 1 2 3 4 5 6 7 1 2 3 4 5 6 7 1 2 3 4 5 6 7 5. Some characteristics this corporate brand has come to my mind quickly
Fructal Radenska Kolinska Droga Union Laško 1 2 3 4 5 6 7 1 2 3 4 5 6 7 1 2 3 4 5 6 7 1 2 3 4 5 6 7 1 2 3 4 5 6 7 1 2 3 4 5 6 7 6. I can quickly recall the symbol and logo attached to this corporate brand
Fructal Radenska Kolinska Droga Union Laško 1 2 3 4 5 6 7 1 2 3 4 5 6 7 1 2 3 4 5 6 7 1 2 3 4 5 6 7 1 2 3 4 5 6 7 1 2 3 4 5 6 7 7. I can quickly imagine this corporate brand in my mind
Fructal Radenska Kolinska Droga Union Laško 1 2 3 4 5 6 7 1 2 3 4 5 6 7 1 2 3 4 5 6 7 1 2 3 4 5 6 7 1 2 3 4 5 6 7 1 2 3 4 5 6 7
XIV
B. Perceived quality 1. This corporate brand associates me to high quality of products
Fructal Radenska Kolinska Droga Union Laško 1 2 3 4 5 6 7 1 2 3 4 5 6 7 1 2 3 4 5 6 7 1 2 3 4 5 6 7 1 2 3 4 5 6 7 1 2 3 4 5 6 7 2. I am satisfied with products which are produced by the company with this corporate
brand
Fructal Radenska Kolinska Droga Union Laško 1 2 3 4 5 6 7 1 2 3 4 5 6 7 1 2 3 4 5 6 7 1 2 3 4 5 6 7 1 2 3 4 5 6 7 1 2 3 4 5 6 7 3. The likelyhood that products of the company with this corporate brand would be
functional is very high
Fructal Radenska Kolinska Droga Union Laško 1 2 3 4 5 6 7 1 2 3 4 5 6 7 1 2 3 4 5 6 7 1 2 3 4 5 6 7 1 2 3 4 5 6 7 1 2 3 4 5 6 7 4. The likelyhood that the products produced by the company with this corporate brand
are reliable, is very high
Fructal Radenska Kolinska Droga Union Laško 1 2 3 4 5 6 7 1 2 3 4 5 6 7 1 2 3 4 5 6 7 1 2 3 4 5 6 7 1 2 3 4 5 6 7 1 2 3 4 5 6 7 5. The likelyhood that I will try the new products of the company with this corporate
brand is high.
Fructal Radenska Kolinska Droga Union Laško 1 2 3 4 5 6 7 1 2 3 4 5 6 7 1 2 3 4 5 6 7 1 2 3 4 5 6 7 1 2 3 4 5 6 7 1 2 3 4 5 6 7 6. Competitive corporate brands associate me to lower quality than this corporate brand
Fructal Radenska Kolinska Droga Union Laško 1 2 3 4 5 6 7 1 2 3 4 5 6 7 1 2 3 4 5 6 7 1 2 3 4 5 6 7 1 2 3 4 5 6 7 1 2 3 4 5 6 7 7. Products produced under this corporate brand are different than the products of other
companies in the same industry
Fructal Radenska Kolinska Droga Union Laško 1 2 3 4 5 6 7 1 2 3 4 5 6 7 1 2 3 4 5 6 7 1 2 3 4 5 6 7 1 2 3 4 5 6 7 1 2 3 4 5 6 7
XV

C. Brand positioning 1. Products of the company with this corporate brand satisfy my needs
Fructal Radenska Kolinska Droga Union Laško 1 2 3 4 5 6 7 1 2 3 4 5 6 7 1 2 3 4 5 6 7 1 2 3 4 5 6 7 1 2 3 4 5 6 7 1 2 3 4 5 6 7 2. This corporate brand is appealing
Fructal Radenska Kolinska Droga Union Laško 1 2 3 4 5 6 7 1 2 3 4 5 6 7 1 2 3 4 5 6 7 1 2 3 4 5 6 7 1 2 3 4 5 6 7 1 2 3 4 5 6 7 3. This corporate brand is not like other brands in the industry
Fructal Radenska Kolinska Droga Union Laško 1 2 3 4 5 6 7 1 2 3 4 5 6 7 1 2 3 4 5 6 7 1 2 3 4 5 6 7 1 2 3 4 5 6 7 1 2 3 4 5 6 7 D. Brand identity 1. This corporate brand helps me demonstrate certain social status
Fructal Radenska Kolinska Droga Union Laško 1 2 3 4 5 6 7 1 2 3 4 5 6 7 1 2 3 4 5 6 7 1 2 3 4 5 6 7 1 2 3 4 5 6 7 1 2 3 4 5 6 7 2. This corporate brand gives me pleasure
Fructal Radenska Kolinska Droga Union Laško 1 2 3 4 5 6 7 1 2 3 4 5 6 7 1 2 3 4 5 6 7 1 2 3 4 5 6 7 1 2 3 4 5 6 7 1 2 3 4 5 6 7 3. I feel that the company with this corporate brand actually cares for me
Fructal Radenska Kolinska Droga Union Laško 1 2 3 4 5 6 7 1 2 3 4 5 6 7 1 2 3 4 5 6 7 1 2 3 4 5 6 7 1 2 3 4 5 6 7 1 2 3 4 5 6 7 4. Products of the company with this corporate brand are compatible to the wishes of
consumers
Fructal Radenska Kolinska Droga Union Laško 1 2 3 4 5 6 7 1 2 3 4 5 6 7 1 2 3 4 5 6 7 1 2 3 4 5 6 7 1 2 3 4 5 6 7 1 2 3 4 5 6 7 5. I feel that the company with this corporate brand really understands me
Fructal Radenska Kolinska Droga Union Laško 1 2 3 4 5 6 7 1 2 3 4 5 6 7 1 2 3 4 5 6 7 1 2 3 4 5 6 7 1 2 3 4 5 6 7 1 2 3 4 5 6 7 E. Demographics
1. Gender: M / F 2. Age ________ 3. Region ___________ 4. Education
a. Less than secondary school b. Secondary school c. High university degree d. University degree (BA) e. Masters or doctoral degree
XVI