Coronary Revascularization Rates in Ontario: Which … · Coronary Revascularization Rates in...
23
Coronary Revascularization Rates in Ontario: Which rate is right? Jack V. Jack V. Tu Tu , MD PhD FRCPC , MD PhD FRCPC Division of General Internal Medicine, Sunnybrook & Women’s College Health Science Centre University of Toronto
-
Upload
nguyenhuong -
Category
Documents
-
view
217 -
download
1
Transcript of Coronary Revascularization Rates in Ontario: Which … · Coronary Revascularization Rates in...

Coronary RevascularizationRates in Ontario:
Which rate is right?
Jack V.Jack V. Tu Tu, MD PhD FRCPC, MD PhD FRCPCDivision of General Internal Medicine,Sunnybrook & Women’s College HealthScience Centre
University of Toronto

Outline
•To review previous studies of cardiacprocedure rates in different jurisdictions
•To review in detail 2 previous US - Canadacomparison studies
•CABG in Ontario vs. New York•AMI in Ontario vs. United States

Which rate is right ?
•Wennberg J, Gittelsohn A. Small area variations inhealth care delivery. Science 1973;182:1102-4
•Wide variations in rates of use of commonmedical and surgical procedures in differentgeographical areas
•May reflect overuse, underuse, or differences inthe underlying prevalence of disease

The Institute for Clinical Evaluative Sciences (ICES) is a non-profitresearchcorporation funded by the Ontario Ministry of Health. The ICESmandate is to conduct applied research that contributes to theeffectiveness, quality, and efficiency of health care in the province ofOntario.

Factors influencing cardiacprocedure rates
DEMAND•Patient preferences
•Physician practicestyles
•Burden of disease
SUPPLY•Number of hospitalsoffering cardiacprocedures
•Number of cardiacsurgeons and invasivecardiologists

Anderson et al. NEJM 1989; 321;1443-8
Hospital care for elderly patients with diseases of the circulatory system: A comparison of hospital use in the United States and Canada
Diagnosis United States Manitoba and Ontario
Myocardial infarction 1052 1163
Heart failure 1631 1341
Artherosclerosis 179 917
Arrhythmia 777 583
Angina 1253 1150
Total 4892 5154
Coronary Artery Bypass Surgeryin Ontario and New York State:
Which rate is right?
Jack V.Jack V. Tu Tu, C. David Naylor, , C. David Naylor, Dinesh Dinesh Kumar, Barbara A.Kumar, Barbara A.DeBuonoDeBuono, Barbara J . McNeil, Edward L. , Barbara J . McNeil, Edward L. HannanHannan
Steering Committee of the Cardiac Care Network ofSteering Committee of the Cardiac Care Network ofOntarioOntario
Cardiac Advisory Committee of New York StateCardiac Advisory Committee of New York State
Annals of Internal Medicine 1997; 126:13-19.Annals of Internal Medicine 1997; 126:13-19.

Study Questions1Are there differences in the annual volume ofisolated CABG surgery performed by hospitals andcardiac surgeons in New York State and Ontario?
2Are there differences in the relative rate of coronaryangiography, PTCA, and isolated CABG surgerybetween New York State and Ontario?
3Are there differences in the clinical characteristicsof patients having CABG surgery in Ontario and NewYork State? What are the rates of use by coronaryanatomy?
4What would be the number of additionalprocedures required in Ontario if Ontario was toincrease its CABG rate to New York State’s CABG

Data Sources
•Year 1993
•Ontario: Cardiac CareNetwork (CCN) of Ontario
•New York: Cardiac SurgeryReporting System

Demographic characteristics and CABG volumes
New York State Ontario Ratio
(NY/ON)1993 Adult Population (millions)
13.2 7.9 -
CABG hospitals 31 9 2.06Cardiac
surgeons 145 42 2.07
Volume of CABG surgery 16690 5517 -
Mean (SE) hospital volume 538 (300) 613 (323) -
Mean (SE) surgeon volume 115 (81) 131 (45) -
Ratios are population-adjusted.

Rates of Coronary Angiography, PTCA,and CABG surgery in New York andOntario, 1993
601.2
127.8 120.6
272.8
57.2 67.4
0
100
200
300
400
500
600
700
Angiography PTCA CABG
Ag
e-a
dju
ste
d r
ate
s, p
er
100,
000
New York
Ontario

Age-specific rates of isolated CABG surgery
Rates are per 100 000
Age group, y New York State Ontario Relative rate
(95% CI)
20-64 65.5 44.8 1.46 (1.40-1.53)
65-74 451.6 239.5 1.89 (1.79-1.99)
>75 266.3 79.8 3.34 (3.01-3.71)
Total 120.6 67.4 1.79 (1.74-1.85)

7.3
0.82
10.8
1.22.5
16.8
2.2
4.5
One vessel, Two Two vessel with Left main0
5
10
15
20
Rel
ativ
e C
AB
G r
a te
(NY
to
ON
) Age 20-64
Age 65-74
Age 75>
vessel without PLAD PLAD, Three vessel
Coronary anatomy
.0
Relative rate of CABG surgery in New York to Ontario

Increasing Ontario’s CABG to New York’s CABG rate.How many additional CABGs would be required?
Age group, y
1 vessel, 2 vessel-PLAD
2 vessel+PLAD, 3 vessel Left main Total
20-64 1300 (30) -- 435 (10) 1735 (40)
65-74 880 (20) 260 (6) 497 (12) 1637 (38)
>75 284 (7) 344 (8) 312 (7) 940 (22)
Total 2464 (57) 604 (14) 1244 (29) 4312(100)
N (% of total)

1995 CCN SteeringCommittee
Recommendations•minimum target rate of 100CABGs per 100,000 adults foreach county in Ontario
•minimum target rate of 100PTCAs per 100,000 adults
•minimum target rate of 357

Use of cardiac procedures and outcomes inelderly patients with myocardial infarction in
the United States and Canada
Jack V.Jack V. Tu Tu, Chris L. , Chris L. PashosPashos, C. David Naylor,, C. David Naylor,
ErluoErluo Chen, Sharon- Chen, Sharon-Lise NormandLise Normand,,
Joseph P. Joseph P. NewhouseNewhouse, Barbara J . McNeil, Barbara J . McNeil
Institute for Clinical Evaluative SciencesInstitute for Clinical Evaluative Sciences
University of Toronto, Harvard Medical SchoolUniversity of Toronto, Harvard Medical School
NEJM 1997; 336: 1500-1505.NEJM 1997; 336: 1500-1505.

Study Questions1. What are the rates of use of coronaryangiography, PTCA, and CABG surgery inelderly patients after an AMI in Ontario,Canada vs. the United States?
2. Are there differences in the availability ofcardiac procedures in Ontario vs. the UnitedStates?
3. Are there short-term or long-termoutcome differences for elderly AMI patientsin Ontario vs. the United States?


Characteristics of Hospitals in theUnited States and Ontario, 1991
No. of PTCA
Area Hospitals None CATH CABG or both <100 >500
United States 5075 55.4 24.6 20.2 43.8 7.5
Ontario 193 91.7 3.1 5.2 41.5 8.3
Availability of Procedures No. of Beds

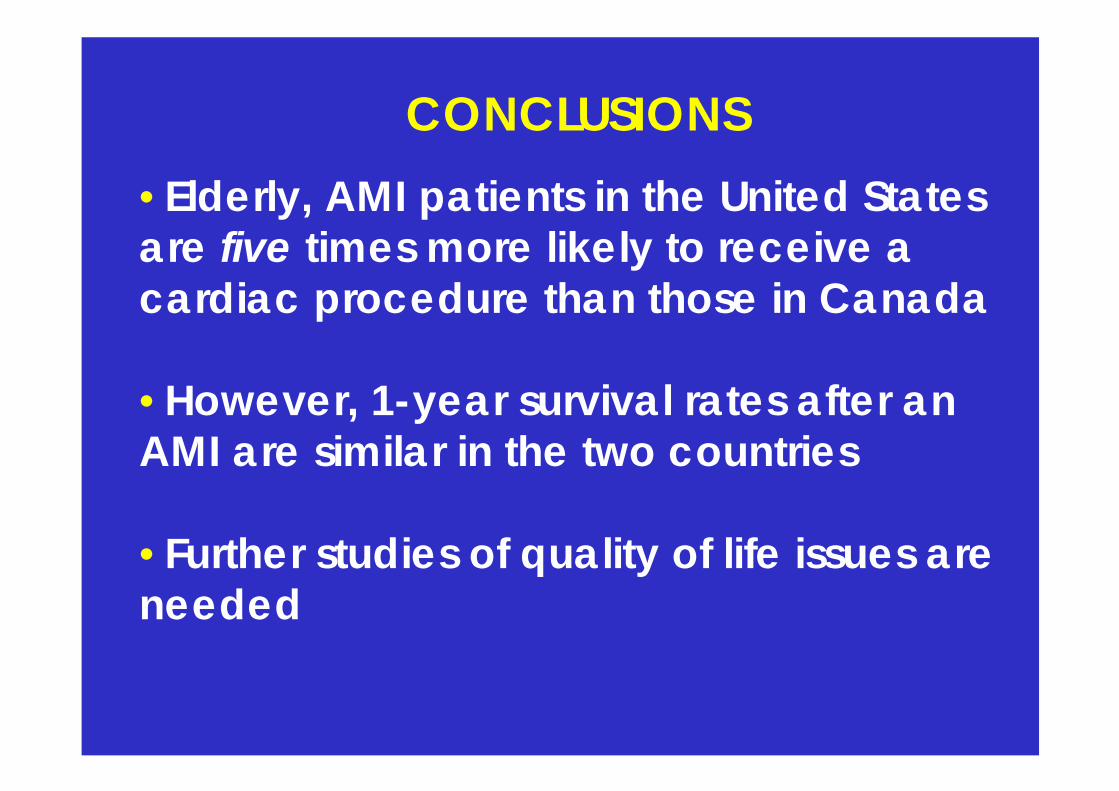
CONCLUSIONS
•Elderly, AMI patients in the United Statesare five times more likely to receive acardiac procedure than those in Canada
•However, 1-year survival rates after anAMI are similar in the two countries
•Further studies of quality of life issues areneeded

CONCLUSIONS•There are wide regional variations in cardiacprocedure rates throughout North America
•Many factors have been identified that contribute tothese variations (patient, physician, hospital, systemfactors)
•Probably cannot determine an ‘optimal’ rate but candefine reasonable target rates using available data
•Collaborative outcomes research (interprovincial,international) will be very important in improving theevidence base for determining procedure rates