CORNING INCORPORATED AND SUBSIDIARY COMPANIES CONSOLIDATED ... · CORNING INCORPORATED AND...
25
© 2017 Corning Incorporated. All Rights Reserved. - 1 - CORNING INCORPORATED AND SUBSIDIARY COMPANIES CONSOLIDATED STATEMENTS OF INCOME (Unaudited; in millions, except per share amounts) Three months ended December 31, Year ended December 31, 2016 2015 2016 2015 Net sales $ 2,476 $ 2,231 $ 9,390 $ 9,111 Cost of sales 1,486 1,374 5,644 5,458 Gross margin 990 857 3,746 3,653 Operating expenses: Selling, general and administrative expenses 368 548 1,472 1,508 Research, development and engineering expenses 173 208 742 769 Amortization of purchased intangibles 18 14 64 54 Restructuring, impairment and other charges (1) 77 Operating income 432 87 1,391 1,322 Equity in earnings of affiliated companies 165 104 284 299 Interest income 11 5 32 21 Interest expense (37) (39) (159) (140) Translated earnings contract gain (loss), net 1,847 38 (448) 80 Gain on realignment of equity investment 2,676 Other expense, net (14) (26) (84) (96) Income before income taxes 2,404 169 3,692 1,486 (Provision) benefit for income taxes (832) 55 3 (147) Net income attributable to Corning Incorporated $ 1,572 $ 224 $ 3,695 $ 1,339 Earnings per common share attributable to Corning Incorporated: Basic $ 1.64 $ 0.17 $ 3.53 $ 1.02 Diluted $ 1.47 $ 0.17 $ 3.23 $ 1.00 Dividends declared per common share (1) $ 0.135 $ 0.12 $ 0.54 $ 0.36 (1) The first quarter 2015 dividend was declared on December 3, 2014.
Transcript of CORNING INCORPORATED AND SUBSIDIARY COMPANIES CONSOLIDATED ... · CORNING INCORPORATED AND...

© 2017 Corning Incorporated. All Rights Reserved. - 1 -
CORNING INCORPORATED AND SUBSIDIARY COMPANIES CONSOLIDATED STATEMENTS OF INCOME
(Unaudited; in millions, except per share amounts)
Three months ended
December 31, Year ended
December 31, 2016 2015 2016 2015 Net sales $ 2,476 $ 2,231 $ 9,390 $ 9,111 Cost of sales 1,486 1,374 5,644 5,458 Gross margin 990 857 3,746 3,653 Operating expenses:
Selling, general and administrative expenses 368 548 1,472 1,508 Research, development and engineering expenses 173 208 742 769
Amortization of purchased intangibles 18 14 64 54 Restructuring, impairment and other charges (1) 77
Operating income 432 87 1,391 1,322 Equity in earnings of affiliated companies 165 104 284 299 Interest income 11 5 32 21 Interest expense (37) (39) (159) (140) Translated earnings contract gain (loss), net 1,847 38 (448) 80 Gain on realignment of equity investment 2,676 Other expense, net (14) (26) (84) (96) Income before income taxes 2,404 169 3,692 1,486 (Provision) benefit for income taxes (832) 55 3 (147) Net income attributable to Corning Incorporated $ 1,572 $ 224 $ 3,695 $ 1,339 Earnings per common share attributable to Corning Incorporated: Basic $ 1.64 $ 0.17 $ 3.53 $ 1.02 Diluted $ 1.47 $ 0.17 $ 3.23 $ 1.00 Dividends declared per common share (1) $ 0.135 $ 0.12 $ 0.54 $ 0.36 (1) The first quarter 2015 dividend was declared on December 3, 2014.

© 2017 Corning Incorporated. All Rights Reserved. - 2 -
CORNING INCORPORATED AND SUBSIDIARY COMPANIES CONSOLIDATED BALANCE SHEETS
(Unaudited; in millions, except per share amounts) December 31, 2016 2015 Assets Current assets:
Cash and cash equivalents $ 5,291 $ 4,500 Short-term investments, at fair value 100 Trade accounts receivable, net of doubtful accounts and allowances 1,481 1,372 Inventories 1,471 1,385 Other current assets 805 912
Total current assets 9,048 8,269 Investments 336 1,975 Property, plant and equipment net of accumulated depreciation 12,546 12,648 Goodwill, net 1,577 1,380 Other intangible assets, net 796 706 Deferred income taxes 2,446 2,056 Other assets 1,150 1,493 Total Assets $ 27,899 $ 28,527 Liabilities and Equity Current liabilities:
Current portion of long-term debt and short-term borrowings $ 256 $ 572 Accounts payable 1,079 934 Other accrued liabilities 1,416 1,308
Total current liabilities 2,751 2,814 Long-term debt 3,646 3,890 Postretirement benefits other than pensions 737 718 Other liabilities 2,805 2,242
Total liabilities 9,939 9,664 Commitments and contingencies Shareholders’ equity:
Convertible preferred stock, Series A – Par value $100 per share; Shares authorized 3,100; Shares issued: 2,300 2,300 2,300
Common stock – Par value $0.50 per share; Shares authorized: 3.8 billion; Shares issued: 1,691 million and 1,681 million 846 840
Additional paid-in capital – common stock 13,695 13,352 Retained earnings 16,880 13,832 Treasury stock, at cost; shares held: 765 million and 551 million (14,152) (9,725) Accumulated other comprehensive loss (1,676) (1,811)
Total Corning Incorporated shareholders’ equity 17,893 18,788 Noncontrolling interests 67 75
Total equity 17,960 18,863 Total Liabilities and Equity $ 27,899 $ 28,527
© 2017 Corning Incorporated. All Rights Reserved. - 3 -
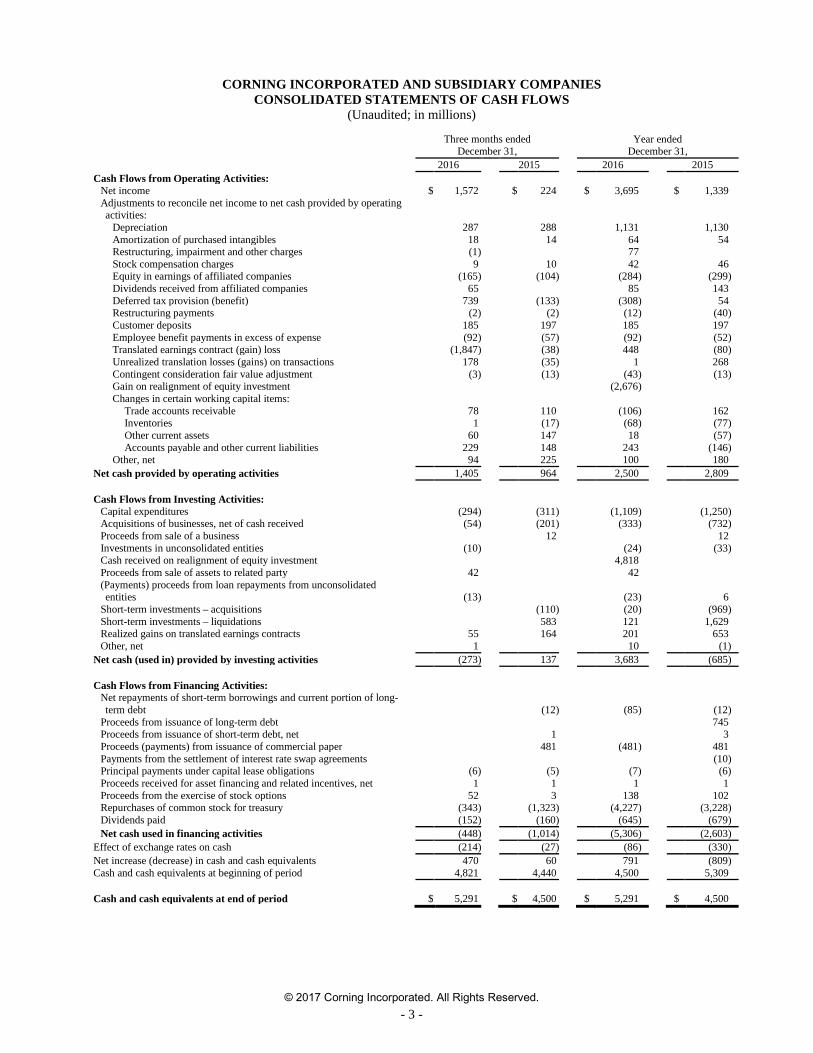
CORNING INCORPORATED AND SUBSIDIARY COMPANIES CONSOLIDATED STATEMENTS OF CASH FLOWS
(Unaudited; in millions)
Three months ended
December 31, Year ended
December 31, 2016 2015 2016 2015 Cash Flows from Operating Activities:
Net income $ 1,572 $ 224 $ 3,695 $ 1,339 Adjustments to reconcile net income to net cash provided by operating activities:
Depreciation 287 288 1,131 1,130 Amortization of purchased intangibles 18 14 64 54 Restructuring, impairment and other charges (1) 77 Stock compensation charges 9 10 42 46 Equity in earnings of affiliated companies (165) (104) (284) (299) Dividends received from affiliated companies 65 85 143 Deferred tax provision (benefit) 739 (133) (308) 54 Restructuring payments (2) (2) (12) (40) Customer deposits 185 197 185 197 Employee benefit payments in excess of expense (92) (57) (92) (52) Translated earnings contract (gain) loss (1,847) (38) 448 (80) Unrealized translation losses (gains) on transactions 178 (35) 1 268 Contingent consideration fair value adjustment (3) (13) (43) (13) Gain on realignment of equity investment (2,676) Changes in certain working capital items:
Trade accounts receivable 78 110 (106) 162 Inventories 1 (17) (68) (77) Other current assets 60 147 18 (57) Accounts payable and other current liabilities 229 148 243 (146)
Other, net 94 225 100 180 Net cash provided by operating activities 1,405 964 2,500 2,809 Cash Flows from Investing Activities:
Capital expenditures (294) (311) (1,109) (1,250) Acquisitions of businesses, net of cash received (54) (201) (333) (732) Proceeds from sale of a business 12 12 Investments in unconsolidated entities (10) (24) (33) Cash received on realignment of equity investment 4,818 Proceeds from sale of assets to related party 42 42 (Payments) proceeds from loan repayments from unconsolidated entities (13) (23) 6
Short-term investments – acquisitions (110) (20) (969) Short-term investments – liquidations 583 121 1,629 Realized gains on translated earnings contracts 55 164 201 653 Other, net 1 10 (1)
Net cash (used in) provided by investing activities (273) 137 3,683 (685) Cash Flows from Financing Activities:
Net repayments of short-term borrowings and current portion of long-term debt (12) (85) (12)
Proceeds from issuance of long-term debt 745 Proceeds from issuance of short-term debt, net 1 3 Proceeds (payments) from issuance of commercial paper 481 (481) 481 Payments from the settlement of interest rate swap agreements (10) Principal payments under capital lease obligations (6) (5) (7) (6) Proceeds received for asset financing and related incentives, net 1 1 1 1 Proceeds from the exercise of stock options 52 3 138 102 Repurchases of common stock for treasury (343) (1,323) (4,227) (3,228) Dividends paid (152) (160) (645) (679) Net cash used in financing activities (448) (1,014) (5,306) (2,603)
Effect of exchange rates on cash (214) (27) (86) (330) Net increase (decrease) in cash and cash equivalents 470 60 791 (809) Cash and cash equivalents at beginning of period 4,821 4,440 4,500 5,309 Cash and cash equivalents at end of period $ 5,291 $ 4,500 $ 5,291 $ 4,500

© 2017 Corning Incorporated. All Rights Reserved. - 4 -
CORNING INCORPORATED AND SUBSIDIARY COMPANIES (Unaudited)
GAAP Earnings per Common Share The following table sets forth the computation of basic and diluted earnings per common share (in millions, except per share amounts):
Three months ended December 31,
Year ended December 31,
2016 2015 2016 2015
Net income attributable to Corning Incorporated $ 1,572 $ 224 $ 3,695 $ 1,339 Less: Series A convertible preferred stock dividend
24
24 98 98
Net income available to common stockholders – basic
1,548
200 3,597 1,241 Add: Series A convertible preferred stock dividend 24 98 98 Net income available to common stockholders - diluted $ 1,572 $ 200 $ 3,695 $ 1,339
Weighted-average common shares outstanding - basic
942
1,146 1,020 1,219 Effect of dilutive securities:
Stock options and other dilutive securities
10
8 9 9
Series A convertible preferred stock 115 115 115 Weighted-average common shares outstanding - diluted
1,067
1,154 1,144 1,343
Basic earnings per common share $ 1.64 $ 0.17 $ 3.53 $ 1.02 Diluted earnings per common share $ 1.47 $ 0.17 $ 3.23 $ 1.00
Core Earnings per Common Share The following table sets forth the computation of core basic and core diluted earnings per common share (in millions, except per share amounts):
Three months ended December 31,
Year ended December 31,
2016 2015 2016 2015
Core earnings attributable to Corning Incorporated $ 534 $ 429 $ 1,774 $ 1,882 Less: Series A convertible preferred stock dividend
24
24 98 98
Core earnings available to common stockholders - basic
510
405 1,676 1,784 Add: Series A convertible preferred stock dividend 24 24 98 98 Core earnings available to common stockholders - diluted $ 534 $ 429 $ 1,774 $ 1,882
Weighted-average common shares outstanding - basic
942
1,146 1,020 1,219 Effect of dilutive securities:
Stock options and other dilutive securities
10
8 9 9 Series A convertible preferred stock 115 115 115 115 Weighted-average common shares outstanding - diluted
1,067
1,269 1,144 1,343
Core basic earnings per common share $ 0.54 $ 0.35 $ 1.64 $ 1.46 Core diluted earnings per common share $ 0.50 $ 0.34 $ 1.55 $ 1.40

© 2017 Corning Incorporated. All Rights Reserved. - 5 -
Use of Non-GAAP Financial Measures CORE PERFORMANCE MEASURES In managing the Company and assessing our financial performance, we supplement certain measures provided by our consolidated financial statements with measures adjusted to exclude certain items, to arrive at core performance measures. We believe reporting core performance measures provides investors greater transparency to the information used by our management team to make financial and operational decisions. Corning has adopted the use of constant currency reporting for the Japanese yen and South Korean won, and uses an internally derived yen-to-dollar management rate of ¥99 and won-to-dollar management rate of ₩1,100. Net sales, equity in earnings of affiliated companies and net income are adjusted to exclude the impacts of changes in the Japanese yen and the South Korean won, gains and losses on our foreign currency hedges related to translated earnings, acquisition-related costs, discrete tax items, restructuring and restructuring-related charges, certain litigation-related expenses, pension mark-to-market adjustments and other items which do not reflect on-going operating results of the Company or our equity affiliates. Management’s discussion and analysis on our reportable segments has also been adjusted for these items, as appropriate. These measures are not prepared in accordance with Generally Accepted Accounting Principles in the United States (“GAAP”). We believe investors should consider these non-GAAP measures in evaluating our results as they are more indicative of our core operating performance and how management evaluates our operational results and trends. These measures are not, and should not be viewed as a substitute for GAAP reporting measures. Corning does not forecast the movement of the Japanese yen and South Korean won against the U.S. dollar, or other items that do not reflect ongoing operations. As a result, the company is unable to provide forward-looking information on a GAAP basis. Items which we exclude from GAAP measures to arrive at Core performance measures are as follows:
(1) Constant-currency adjustments: Constant-yen: Because a significant portion of Display Technologies segment revenues and manufacturing
costs are denominated in Japanese yen, management believes it is important to understand the impact on core earnings of translating yen into dollars. Presenting results on a constant-yen basis mitigates the translation impact of the Japanese yen, and allows management to evaluate performance period over period, analyze underlying trends in our businesses, and establish operational goals and forecasts. As of January 1, 2015, we used an internally derived management rate of ¥99, which is closely aligned to our current yen portfolio of foreign currency hedges, and have recast all periods presented based on this rate in order to effectively remove the impact of changes in the Japanese yen.
Constant-won: Following the acquisition of Samsung Corning Precision Materials and because a significant portion of Corning Precision Materials’ costs are denominated in Korean won, management believes it is important to understand the impact on core earnings from translating won into dollars. Presenting results on a constant-won basis mitigates the translation impact of the Korean won, and allows management to evaluate performance period over period, analyze underlying trends in our businesses, and establish operational goals and forecasts without the variability caused by the fluctuations caused by changes in the rate of this currency. We use an internally derived management rate of 1,100, which is consistent with historical prior period averages of the won.
(2) Translated earnings contract loss (gain): We have excluded the impact of the gains and losses of our foreign currency hedges related to translated earnings for each period presented.
(3) Acquisition-related costs: These expenses include intangible amortization, inventory valuation adjustments and external acquisition-related deal costs.
(4) Discrete tax items and other tax-related adjustments: This represents the removal of discrete adjustments attributable to changes in tax law and changes in judgment about the realizability of certain deferred tax assets, as well as other non-operational tax-related adjustments, including the tax effect of transfer pricing out-of-period adjustments in 2014 and 2015.
(5) Litigation, regulatory and other legal matters: Includes amounts related to the Pittsburgh Corning Corporation (PCC) asbestos litigation, adjustments to our estimated liability for environmental-related items and other legal matters.
(6) Restructuring, impairment and other charges: This amount includes restructuring, impairment and other charges, including goodwill impairment charges and other expenses and disposal costs not classified as restructuring expense.
(7) Gain on realignment of equity investment: Gain recorded upon the completion of the strategic realignment of our ownership interest in Dow Corning.

© 2017 Corning Incorporated. All Rights Reserved. - 6 -
(8) Equity in earnings of affiliated companies: These adjustments relate to items which do not reflect expected on-
going operating results of our affiliated companies, such as restructuring, impairment and other charges and settlements under “take-or-pay” contracts.
(9) Impacts from the acquisition of Samsung Corning Precision Materials: Pre-acquisition gains and losses on previously held equity investment and other gains and losses related to the acquisition, including post-combination expenses, fair value adjustments to the indemnity asset related to contingent consideration and the impact of the withholding tax on a dividend from Samsung Corning Precision Materials.
(10) Post-combination expenses: Post-combination expenses incurred as a result of an acquisition in the first quarter of 2015.
(11) Pension mark-to-market adjustment: Defined benefit pension mark-to-market gains and losses, which arise from changes in actuarial assumptions and the difference between actual and expected returns on plan assets and discount rates.
(12) Taiwan power outage: Impact of the power outage that temporarily halted production at our Tainan, Taiwan manufacturing location in the first half of 2016. The impact includes asset write-offs and charges for facility repairs, offset somewhat by partial reimbursement through our insurance program. We expect to receive the remainder of the insurance reimbursement in the fourth quarter of 2016.

© 2017 Corning Incorporated. All Rights Reserved. - 7 -
CORNING INCORPORATED AND SUBSIDIARY COMPANIES RECONCILIATION OF NON-GAAP FINANCIAL MEASURE TO GAAP FINANCIAL MEASURE
Three Months Ended December 31, 2016 (Unaudited; amounts in millions, except per share amounts)
Net
sales Equity
earnings
Income before income taxes
Net income
Effective tax
rate (a) Per
share As reported $ 2,476 $ 165 $ 2,404 $ 1,572 34.6% $ 1.47 Constant-yen (1) 74 68 58 0.05 Constant-won (1) 1 (11) (8) (0.01) Translated earnings contract loss (gain) (2) (1,847) (1,165) (1.09)
Acquisition-related costs (3) 18 12 0.01 Discrete tax items and other tax-related adjustments (4) 56 0.05
Restructuring, impairment and other charges (6) 68 47 0.04
Equity in earnings of affiliated companies (8) (53) (53) (33) (0.03)
Impacts from the Acquisition of Samsung Corning Precision Materials (9) (4) (4)
Pension mark-to-market adjustment (11) 7 5
Taiwan power outage (12) (8) (6) (0.01) Core performance measures $ 2,551 $ 112 $ 642 $ 534 16.8% $ 0.50
(a) Based upon statutory tax rates in the specific jurisdiction for each event. See Reconciliation of Non-GAAP Financial Measures, “Items which we exclude from GAAP measures to arrive at Core Performance measures” for the descriptions of the footnoted reconciling items.

© 2017 Corning Incorporated. All Rights Reserved. - 8 -
CORNING INCORPORATED AND SUBSIDIARY COMPANIES RECONCILIATION OF NON-GAAP FINANCIAL MEASURE TO GAAP FINANCIAL MEASURE
Three Months Ended December 31, 2015 (Unaudited; amounts in millions, except per share amounts)
Net
sales Equity
earnings
Income before income taxes
Net income
Effective tax
rate (a) Per
share As reported $ 2,231 $ 104 $ 169 $ 224 (32.5)% $ 0.17 Constant-yen (1) 170 2 148 110 0.09 Constant-won (1) 1 (1) (12) (9) (0.01) Translated earnings contract loss (gain) (2) (38) (23) (0.02)
Acquisition-related costs (3) 15 11 0.01 Discrete tax items and other tax-related adjustments (4) 11 0.01
Litigation, regulatory and other legal matters (5) 11 7 0.01
Restructuring, impairment and other charges (6) 40 36 0.03
Equity in earnings of affiliated companies (8) (18) (18) (17) (0.01)
Impacts from the Acquisition of Samsung Corning Precision Materials (9) (24) (21) (0.02)
Pension mark-to-market adjustment (11) 157 100 0.08
Core performance measures $ 2,402 $ 87 $ 448 $ 429 4.2% $ 0.34
(a) Based upon statutory tax rates in the specific jurisdiction for each event. See Reconciliation of Non-GAAP Financial Measures, “Items which we exclude from GAAP measures to arrive at Core Performance measures” for the descriptions of the footnoted reconciling items.

© 2017 Corning Incorporated. All Rights Reserved. - 9 -
CORNING INCORPORATED AND SUBSIDIARY COMPANIES RECONCILIATION OF NON-GAAP FINANCIAL MEASURE TO GAAP FINANCIAL MEASURE
Year Ended December 31, 2016 (Unaudited; amounts in millions, except per share amounts)
Net
sales Equity
earnings
Income before income taxes
Net income
Effective tax
rate (a) Per
share As reported $ 9,390 $ 284 $ 3,692 $ 3,695 0% $ 3.23 Constant-yen (1) 316 4 300 222 0.19 Constant-won (1) 4 (1) (47) (34) (0.03) Translated earnings contract loss (gain) (2) 448 282 0.25
Acquisition-related costs (3) 127 107 0.09 Discrete tax items and other tax-related adjustments (4) (27) (0.02)
Litigation, regulatory and other legal matters (5) 55 70 0.06
Restructuring, impairment and other charges (6) 199 138 0.12
Gain on realignment of equity investment (7) (2,676) (2,676) (2.34)
Equity in earnings of affiliated companies (8) (37) (37) (18) (0.02)
Impacts from the Acquisition of Samsung Corning Precision Materials (9) (49) (42) (0.04)
Pension mark-to-market adjustment (11) 67 44 0.04
Taiwan power outage (12) 17 13 0.01 Core performance measures $ 9,710 $ 250 $ 2,096 $ 1,774 15.4% $ 1.55
(a) Based upon statutory tax rates in the specific jurisdiction for each event. See Reconciliation of Non-GAAP Financial Measures, “Items which we exclude from GAAP measures to arrive at Core Performance measures” for the descriptions of the footnoted reconciling items.

© 2017 Corning Incorporated. All Rights Reserved. - 10 -
CORNING INCORPORATED AND SUBSIDIARY COMPANIES RECONCILIATION OF NON-GAAP FINANCIAL MEASURE TO GAAP FINANCIAL MEASURE
Year Ended December 31, 2015 (Unaudited; amounts in millions, except per share amounts)
Net
sales Equity
earnings
Income before income taxes
Net income
Effective tax
rate (a) Per
share As reported $ 9,111 $ 299 $ 1,486 $ 1,339 9.9% $ 1.00 Constant-yen (1) 687 6 567 423 0.31 Constant-won (1) 2 (2) (25) (19) (0.01) Translated earnings contract loss (gain) (2) (80) (48) (0.04)
Acquisition-related costs (3) 55 36 0.03 Discrete tax items and other tax-related adjustments (4) 36 0.03
Litigation, regulatory and other legal matters (5) 5 3
Restructuring, impairment and other charges (6) 46 42 0.03
Equity in earnings of affiliated companies (8) (34) (34) (33) (0.02)
Impacts from the acquisition of Samsung Corning Precision Materials (9) (20) (18) (0.01)
Post-combination expenses (10) 25 16 0.01
Pension mark-to-market adjustment (11) 165 105 0.08
Core performance measures $ 9,800 $ 269 $ 2,190 $ 1,882 14.1% $ 1.40
(a) Based upon statutory tax rates in the specific jurisdiction for each event. See Reconciliation of Non-GAAP Financial Measures, “Items which we exclude from GAAP measures to arrive at Core Performance measures” for the descriptions of the footnoted reconciling items.
© 2017 Corning Incorporated. All Rights Reserved. - 11 -
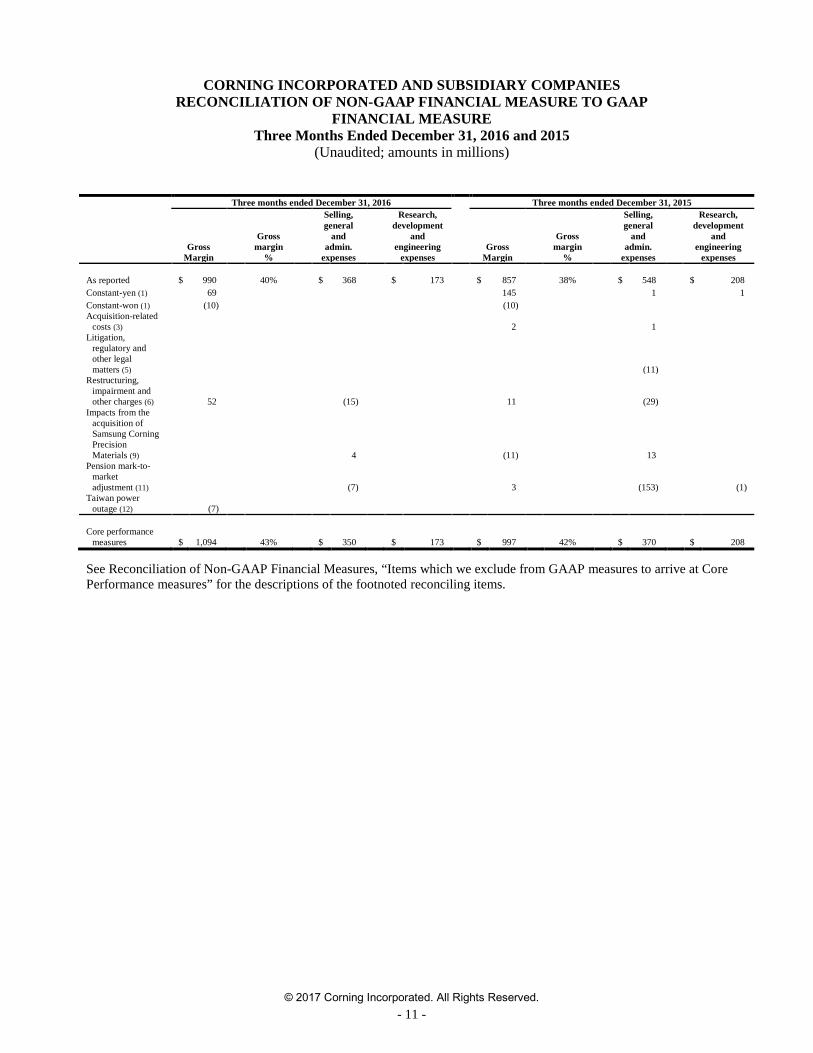
CORNING INCORPORATED AND SUBSIDIARY COMPANIES RECONCILIATION OF NON-GAAP FINANCIAL MEASURE TO GAAP
FINANCIAL MEASURE Three Months Ended December 31, 2016 and 2015
(Unaudited; amounts in millions)
Three months ended December 31, 2016 Three months ended December 31, 2015
Gross
Margin
Gross margin
%
Selling, general
and admin.
expenses
Research, development
and engineering
expenses Gross
Margin
Gross margin
%
Selling, general
and admin.
expenses
Research, development
and engineering
expenses As reported $ 990 40% $ 368 $ 173 $ 857 38% $ 548 $ 208 Constant-yen (1) 69 145 1 1 Constant-won (1) (10) (10) Acquisition-related
costs (3) 2 1 Litigation,
regulatory and other legal matters (5) (11)
Restructuring, impairment and other charges (6) 52 (15) 11 (29)
Impacts from the acquisition of Samsung Corning Precision Materials (9) 4 (11) 13
Pension mark-to-market adjustment (11) (7) 3 (153) (1)
Taiwan power outage (12) (7)
Core performance
measures $ 1,094 43% $ 350 $ 173 $ 997 42% $ 370 $ 208 See Reconciliation of Non-GAAP Financial Measures, “Items which we exclude from GAAP measures to arrive at Core Performance measures” for the descriptions of the footnoted reconciling items.

© 2017 Corning Incorporated. All Rights Reserved. - 12 -
CORNING INCORPORATED AND SUBSIDIARY COMPANIES RECONCILIATION OF NON-GAAP FINANCIAL MEASURE TO GAAP
FINANCIAL MEASURE Years Ended December 31, 2016 and 2015
(Unaudited; amounts in millions)
Year ended December 31, 2016 Year ended December 31, 2015
Gross
Margin
Gross margin
%
Selling, general
and admin.
expenses
Research, development
and engineering
expenses Gross
Margin
Gross margin
%
Selling, general
and admin.
expenses
Research, development
and engineering
expenses
As reported $ 3,746 40% $ 1,472 $ 742 $ 3,653 40% $ 1,508 $ 769 Constant-yen (1) 299 565 1 Constant-won (1) (40) 1 1 (19) 1 1 Translated
earnings contract loss (gain) (2) (4)
Acquisition-related costs (3) 5 (55) 4 4
Litigation, regulatory and other legal matters (5) (52) (3)
Restructuring, impairment and other charges (6) 101 (19) 18 (27)
Impacts from the acquisition of Samsung Corning Precision Materials (9) 49 (8) 13
Post-combination expenses (10) (25)
Pension mark-to-market adjustment (11) (67) 3 (161) (1)
Taiwan power outage (12) 16
Core
performance measures $ 4,127 43% $ 1,329 $ 743 $ 4,212 43% $ 1,311 $ 769
See Reconciliation of Non-GAAP Financial Measures, “Items which we exclude from GAAP measures to arrive at Core Performance measures” for the descriptions of the footnoted reconciling items.

© 2017 Corning Incorporated. All Rights Reserved. - 13 -
CORNING INCORPORATED AND SUBSIDIARY COMPANIES RECONCILIATION OF NON-GAAP FINANCIAL MEASURE TO GAAP
FINANCIAL MEASURE Display Technologies Segment
Three Months Ended December 31, 2016 and 2015 (Unaudited; amounts in millions)
Three months ended December 31, 2016
Three months ended December 31, 2015
Net
sales Net
income Net
sales Net
income As reported $ 830 $ 243 $ 732 $ 243 Constant-yen (1) 74 51 170 108 Constant-won (1) (9) 1 (8) Translated earnings contract gain (2) (34) (103) Restructuring, impairment and other charges (6) 31 Impacts from the acquisition of Samsung Corning Precision
Materials (9) (4) (10) Pension mark-to-market adjustment (11) 1 4 Taiwan power outage (12) (3) Core performance measures $ 904 $ 276 $ 903 $ 234 See Reconciliation of Non-GAAP Financial Measures, “Items which we exclude from GAAP measures to arrive at Core Performance measures” for the descriptions of the footnoted reconciling items.
© 2017 Corning Incorporated. All Rights Reserved. - 14 -
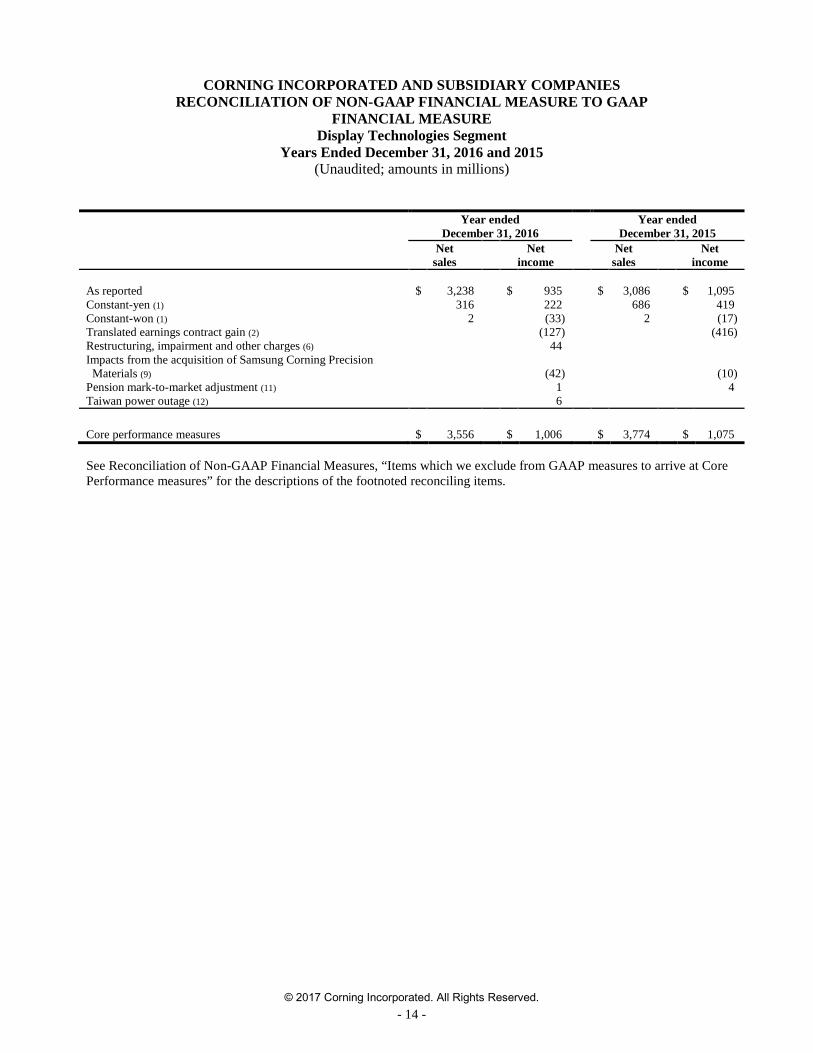
CORNING INCORPORATED AND SUBSIDIARY COMPANIES RECONCILIATION OF NON-GAAP FINANCIAL MEASURE TO GAAP
FINANCIAL MEASURE Display Technologies Segment
Years Ended December 31, 2016 and 2015 (Unaudited; amounts in millions)
Year ended
December 31, 2016 Year ended
December 31, 2015
Net
sales Net
income Net
sales Net
income As reported $ 3,238 $ 935 $ 3,086 $ 1,095 Constant-yen (1) 316 222 686 419 Constant-won (1) 2 (33) 2 (17) Translated earnings contract gain (2) (127) (416) Restructuring, impairment and other charges (6) 44 Impacts from the acquisition of Samsung Corning Precision
Materials (9) (42) (10) Pension mark-to-market adjustment (11) 1 4 Taiwan power outage (12) 6 Core performance measures $ 3,556 $ 1,006 $ 3,774 $ 1,075 See Reconciliation of Non-GAAP Financial Measures, “Items which we exclude from GAAP measures to arrive at Core Performance measures” for the descriptions of the footnoted reconciling items.

© 2017 Corning Incorporated. All Rights Reserved. - 15 -
CORNING INCORPORATED AND SUBSIDIARY COMPANIES RECONCILIATION OF NON-GAAP FINANCIAL MEASURE TO GAAP
FINANCIAL MEASURE Optical Communications Segment
Three Months Ended December 31, 2016 and 2015 (Unaudited; amounts in millions)
Three months ended December 31, 2016
Three months ended December 31, 2015
Net
sales Net
income Net
sales Net
income As reported $ 819 $ 67 $ 736 $ 33 Acquisition-related costs (3) 7 1 Litigation, regulatory and other legal matters (5) 13 Restructuring, impairment and other charges (6) 12 Pension mark-to-market adjustment (11) 1 Core performance measures $ 819 $ 87 $ 736 $ 47 See Reconciliation of Non-GAAP Financial Measures, “Items which we exclude from GAAP measures to arrive at Core Performance measures” for the descriptions of the footnoted reconciling items.

© 2017 Corning Incorporated. All Rights Reserved. - 16 -
CORNING INCORPORATED AND SUBSIDIARY COMPANIES RECONCILIATION OF NON-GAAP FINANCIAL MEASURE TO GAAP
FINANCIAL MEASURE Optical Communications Segment
Years Ended December 31, 2016 and 2015 (Unaudited; amounts in millions)
Year ended
December 31, 2016 Year ended
December 31, 2015
Net
sales Net
income Net
sales Net
income As reported $ 3,005 $ 245 $ 2,980 $ 237 Acquisition-related costs (3) 23 16 Litigation, regulatory and other legal matters (5) 13 Restructuring, impairment and other charges (6) 24 (1) Post-combination expenses (10) 16 Pension mark-to-market adjustment (11) 5 Core performance measures $ 3,005 $ 297 $ 2,980 $ 281 See Reconciliation of Non-GAAP Financial Measures, “Items which we exclude from GAAP measures to arrive at Core Performance measures” for the descriptions of the footnoted reconciling items.

© 2017 Corning Incorporated. All Rights Reserved. - 17 -
CORNING INCORPORATED AND SUBSIDIARY COMPANIES RECONCILIATION OF NON-GAAP FINANCIAL MEASURE TO GAAP
FINANCIAL MEASURE Environmental Technologies Segment
Three Months Ended December 31, 2016 and 2015 (Unaudited; amounts in millions)
Three months ended December 31, 2016
Three months ended December 31, 2015
Net
sales Net
income Net
sales Net
income As reported $ 245 $ 27 $ 254 $ 29 Core performance measures $ 245 $ 27 $ 254 $ 29 See Reconciliation of Non-GAAP Financial Measures, “Items which we exclude from GAAP measures to arrive at Core Performance measures” for the descriptions of the footnoted reconciling items.

© 2017 Corning Incorporated. All Rights Reserved. - 18 -
CORNING INCORPORATED AND SUBSIDIARY COMPANIES
RECONCILIATION OF NON-GAAP FINANCIAL MEASURE TO GAAP FINANCIAL MEASURE
Environmental Technologies Segment Years Ended December 31, 2016 and 2015
(Unaudited; amounts in millions)
Year ended
December 31, 2016 Year ended
December 31, 2015
Net
sales Net
income Net
sales Net
income As reported $ 1,032 $ 133 $ 1,053 $ 161 Restructuring, impairment and other charges (6) 3 Core performance measures $ 1,032 $ 136 $ 1,053 $ 161 See Reconciliation of Non-GAAP Financial Measures, “Items which we exclude from GAAP measures to arrive at Core Performance measures” for the descriptions of the footnoted reconciling items.

© 2017 Corning Incorporated. All Rights Reserved. - 19 -
CORNING INCORPORATED AND SUBSIDIARY COMPANIES RECONCILIATION OF NON-GAAP FINANCIAL MEASURE TO GAAP
FINANCIAL MEASURE Specialty Materials Segment
Three Months Ended December 31, 2016 and 2015 (Unaudited; amounts in millions)
Three months ended December 31, 2016
Three months ended December 31, 2015
Net
sales Net
income Net
sales Net
income As reported $ 336 $ 68 $ 275 $ 39 Constant-yen (1) (1) Constant-won (1) (1) (1) Restructuring, impairment and other charges (6) 1 7 Taiwan power outage (12) (3) Core performance measures $ 336 $ 65 $ 275 $ 44 See Reconciliation of Non-GAAP Financial Measures, “Items which we exclude from GAAP measures to arrive at Core Performance measures” for the descriptions of the footnoted reconciling items.

© 2017 Corning Incorporated. All Rights Reserved. - 20 -
CORNING INCORPORATED AND SUBSIDIARY COMPANIES RECONCILIATION OF NON-GAAP FINANCIAL MEASURE TO GAAP
FINANCIAL MEASURE Specialty Materials Segment
Years Ended December 31, 2016 and 2015 (Unaudited; amounts in millions)
Year ended
December 31, 2016 Year ended
December 31, 2015
Net
sales Net
income Net
sales Net
income As reported $ 1,124 $ 174 $ 1,107 $ 167 Constant-yen (1) (1) (6) Constant-won (1) (2) (2) Translated earnings contract loss (gain) (2) 5 Restructuring, impairment and other charges (6) 15 14 Taiwan power outage (12) 3 Core performance measures $ 1,124 $ 189 $ 1,107 $ 178 See Reconciliation of Non-GAAP Financial Measures, “Items which we exclude from GAAP measures to arrive at Core Performance measures” for the descriptions of the footnoted reconciling items.

© 2017 Corning Incorporated. All Rights Reserved. - 21 -
CORNING INCORPORATED AND SUBSIDIARY COMPANIES RECONCILIATION OF NON-GAAP FINANCIAL MEASURE TO GAAP
FINANCIAL MEASURE Life Sciences Segment
Three Months Ended December 31, 2016 and 2015 (Unaudited; amounts in millions)
Three months ended December 31, 2016
Three months ended December 31, 2015
Net
sales Net
income Net
sales Net
income As reported $ 206 $ 13 $ 202 $ 9 Acquisition-related costs (3) 3 3 Restructuring, impairment and other charges (6) 1 Core performance measures $ 206 $ 17 $ 202 $ 12 See Reconciliation of Non-GAAP Financial Measures, “Items which we exclude from GAAP measures to arrive at Core Performance measures” for the descriptions of the footnoted reconciling items.

© 2017 Corning Incorporated. All Rights Reserved. - 22 -
CORNING INCORPORATED AND SUBSIDIARY COMPANIES RECONCILIATION OF NON-GAAP FINANCIAL MEASURE TO GAAP
FINANCIAL MEASURE Life Sciences Segment
Years Ended December 31, 2016 and 2015 (Unaudited; amounts in millions)
Year ended
December 31, 2016 Year ended
December 31, 2015
Net
sales Net
income Net
sales Net
income As reported $ 839 $ 58 $ 821 $ 61 Acquisition-related costs (3) 12 12 Restructuring, impairment and other charges (6) 7 Core performance measures $ 839 $ 77 $ 821 $ 73 See Reconciliation of Non-GAAP Financial Measures, “Items which we exclude from GAAP measures to arrive at Core Performance measures” for the descriptions of the footnoted reconciling items.

© 2017 Corning Incorporated. All Rights Reserved. - 23 -
CORNING INCORPORATED AND SUBSIDIARY COMPANIES RECONCILIATION OF NON-GAAP FINANCIAL MEASURE TO GAAP
FINANCIAL MEASURE Equity in Earnings of Affiliated Companies
Three Months Ended December 31, 2016 and 2015 (Unaudited; amounts in millions)
Three months ended December 31, 2016
Three months ended December 31, 2015
Hemlock
Semiconductor Other
Total equity
earnings Dow
Corning Other
Total equity
earnings As reported $ 168 $ (3) $ 165 $ 96 $ 8 $ 104 Constant-yen (1) 2 2 Constant-won (1) (1) (1) Equity in earnings of affiliated
companies (8) (58) 5 (53) (18) (18) Core Performance Measures $ 110 $ 2 $ 112 $ 78 $ 9 $ 87 See Reconciliation of Non-GAAP Financial Measures, “Items which we exclude from GAAP measures to arrive at Core Performance measures” for the descriptions of the footnoted reconciling items.

© 2017 Corning Incorporated. All Rights Reserved. - 24 -
CORNING INCORPORATED AND SUBSIDIARY COMPANIES RECONCILIATION OF NON-GAAP FINANCIAL MEASURE TO GAAP
FINANCIAL MEASURE Equity in Earnings of Affiliated Companies Years ended December 31, 2016 and 2015
(Unaudited; amounts in millions) Year ended December 31, 2016 Year ended December 31, 2015
Dow
Corning Hemlock
Semiconductor Other
Total equity
earnings Dow
Corning Other
Total equity
earnings As reported $ 82 $ 212 $ (10) $ 284 $ 281 $ 18 $ 299 Constant-yen (1) 4 4 6 6 Constant-won (1) (1) (1) (2) (2) Equity in earnings of affiliated
companies (8) 16 (58) 5 (37) (36) 2 (34) Core Performance Measures $ 98 $ 154 $ (2) $ 250 $ 245 $ 24 $ 269
See Reconciliation of Non-GAAP Financial Measures, “Items which we exclude from GAAP measures to arrive at Core Performance measures” for the descriptions of the footnoted reconciling items.

© 2017 Corning Incorporated. All Rights Reserved. - 25 -
CORNING INCORPORATED AND SUBSIDIARY COMPANIES RECONCILIATION OF NON-GAAP FINANCIAL MEASURE TO GAAP FINANCIAL MEASURE
Three Months and Year Ended December 31, 2016 (Unaudited; amounts in millions)
Three months ended
December 31, 2016
Year ended
December 31, 2016
Cash flows from operating activities $ 1,405 $ 2,500 Transaction costs on realignment of equity investment 37 Realized gains on translated earnings contracts 55 201 Translation (losses) gains on cash balances (138) 10 Adjusted cash flows from operating activities $ 1,322 $ 2,748